An ANP-Balanced Scorecard Methodology to Quantify the Impact of TQM Elements on Organisational Strategic Sustainable Development: Application to an Oil Firm

 ,
,  ,
,
Abstract
1. Introduction
2. Literature Review
2.1. TQM and Performance Measurement
2.2. Strategic Sustainable Development and Performance Measurement
2.3. TQM and Sustainable Development
2.4. Quantitative Techniques
2.5. Research Gap
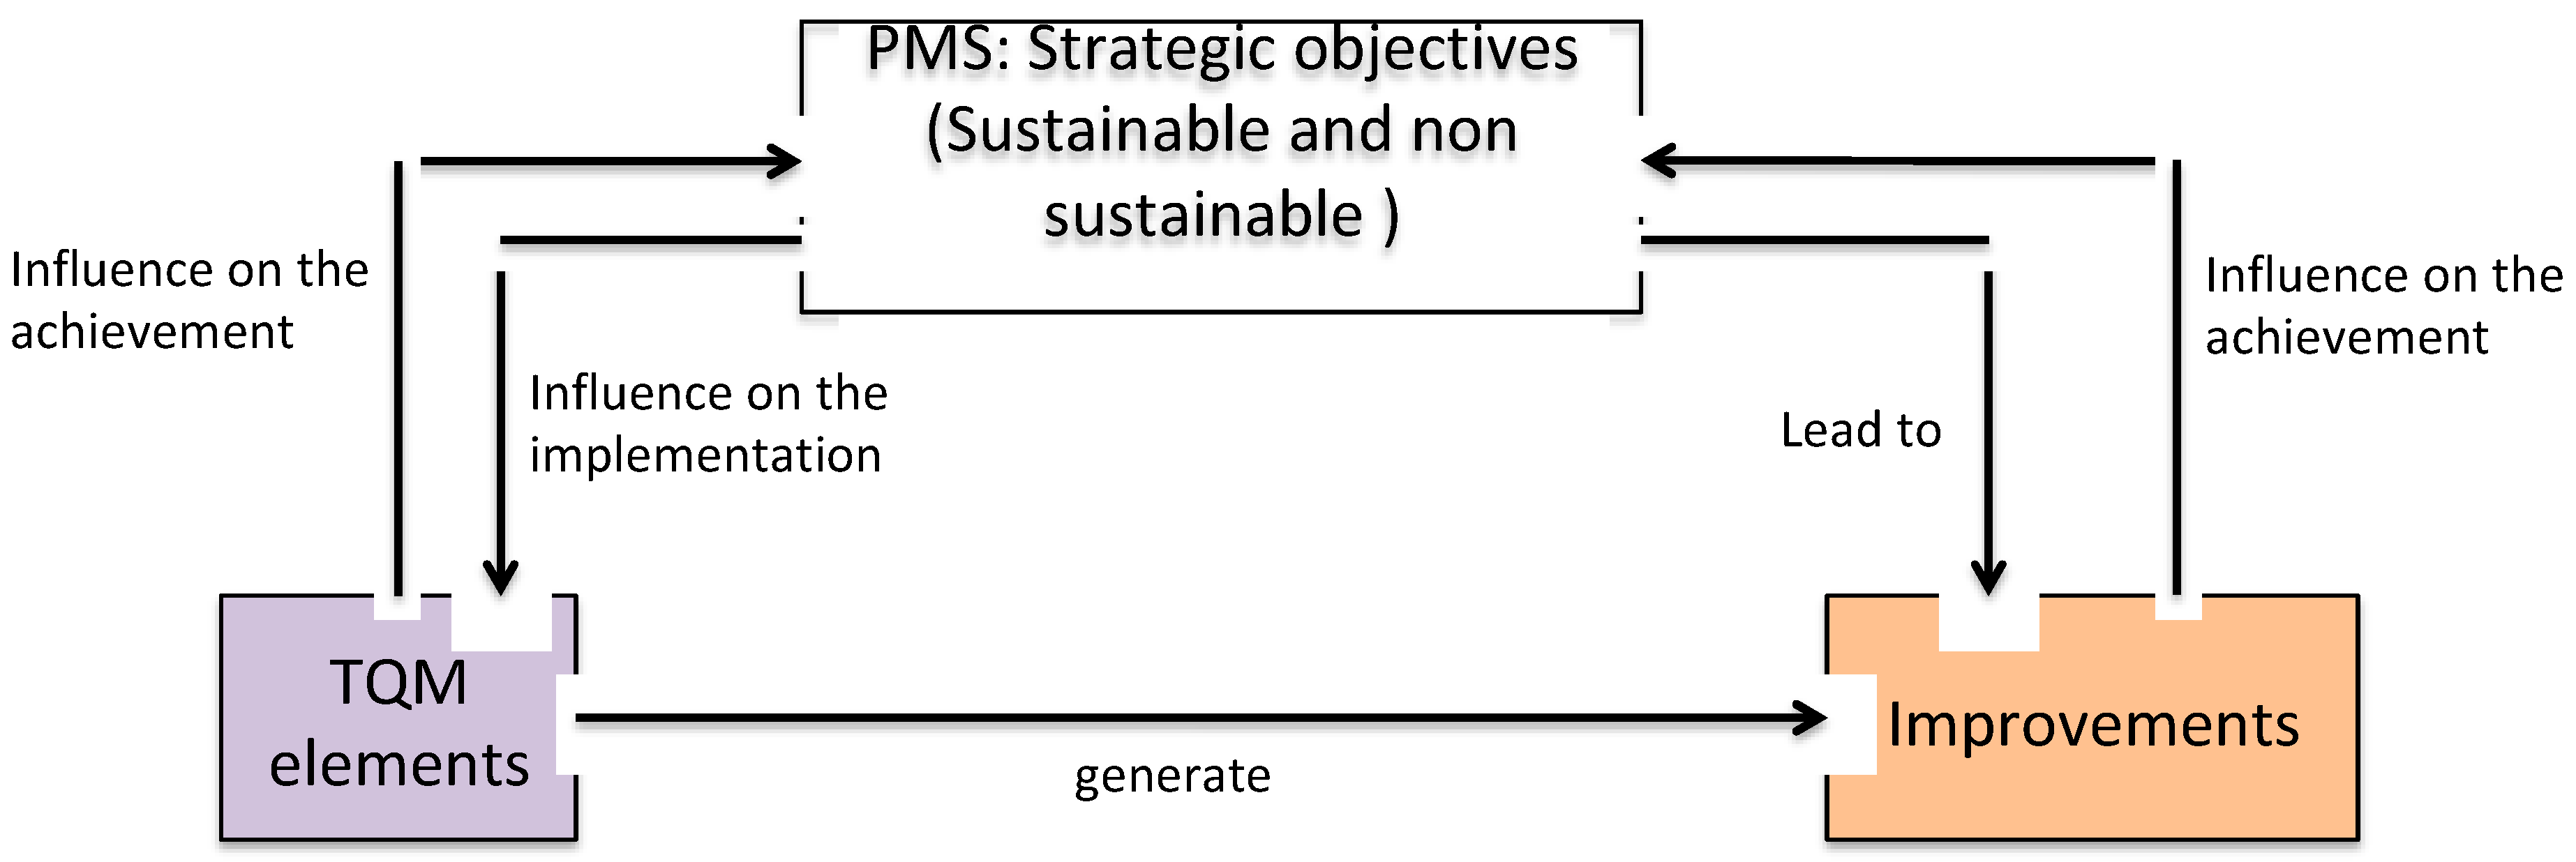
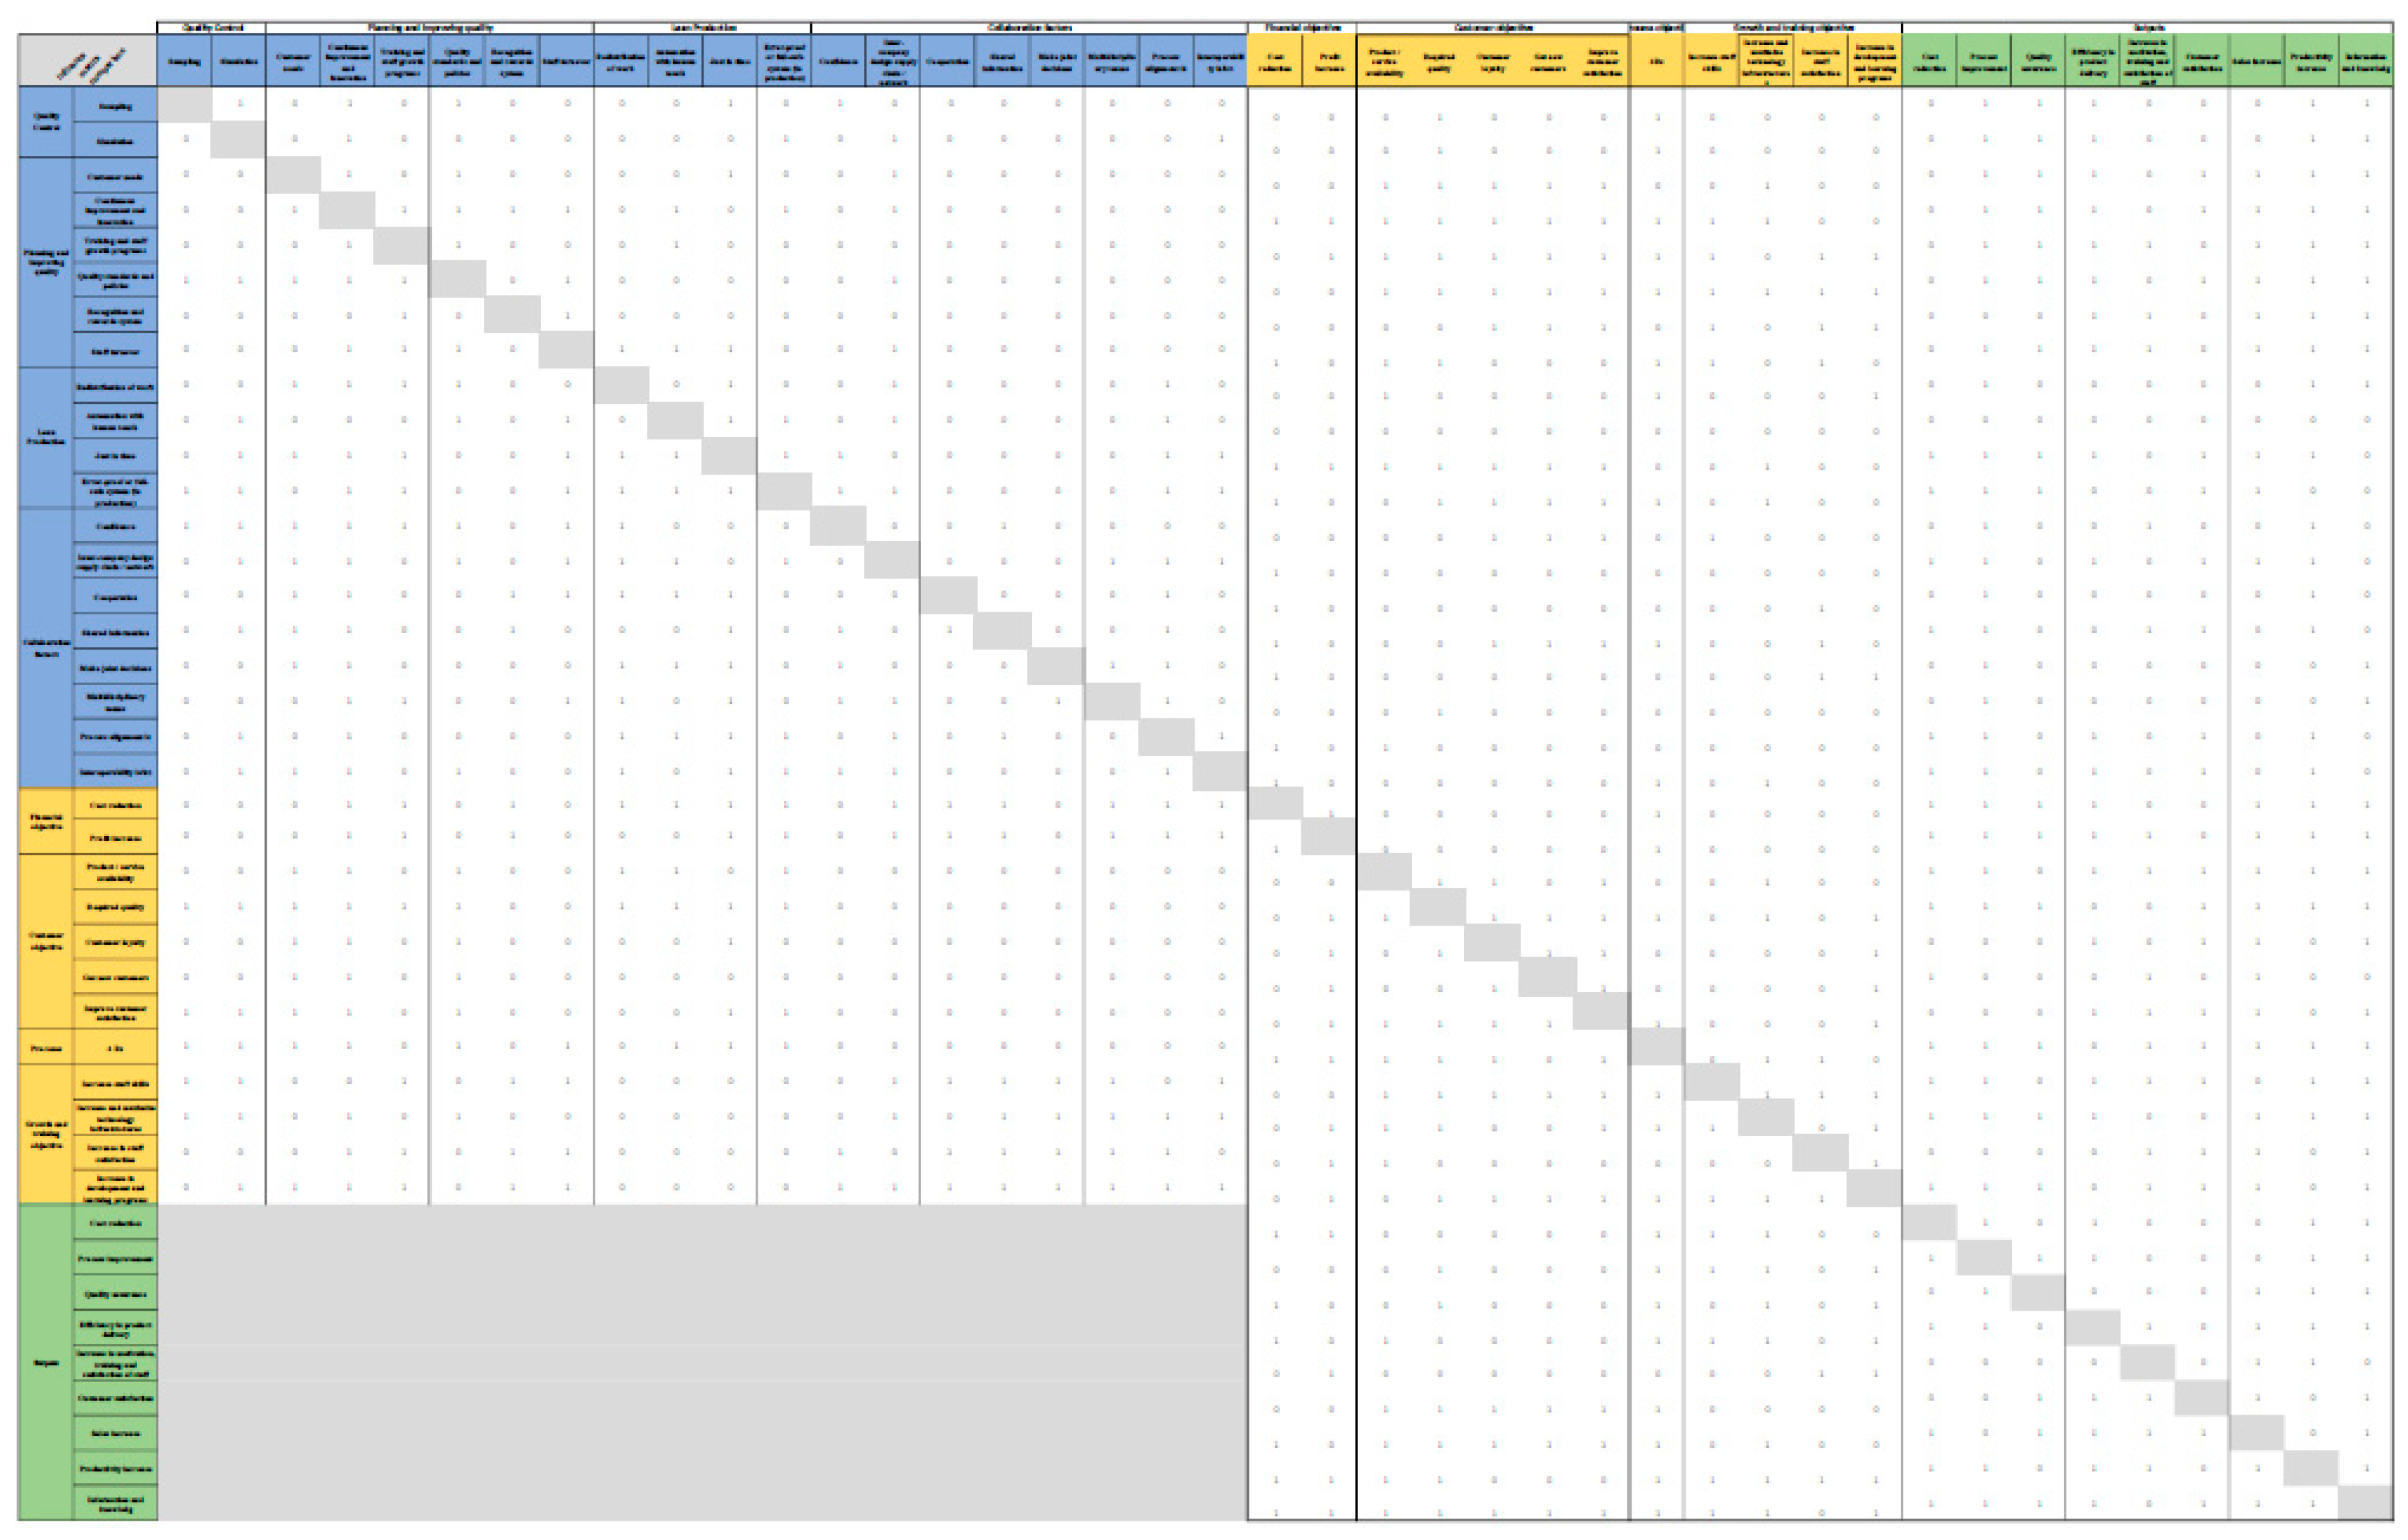
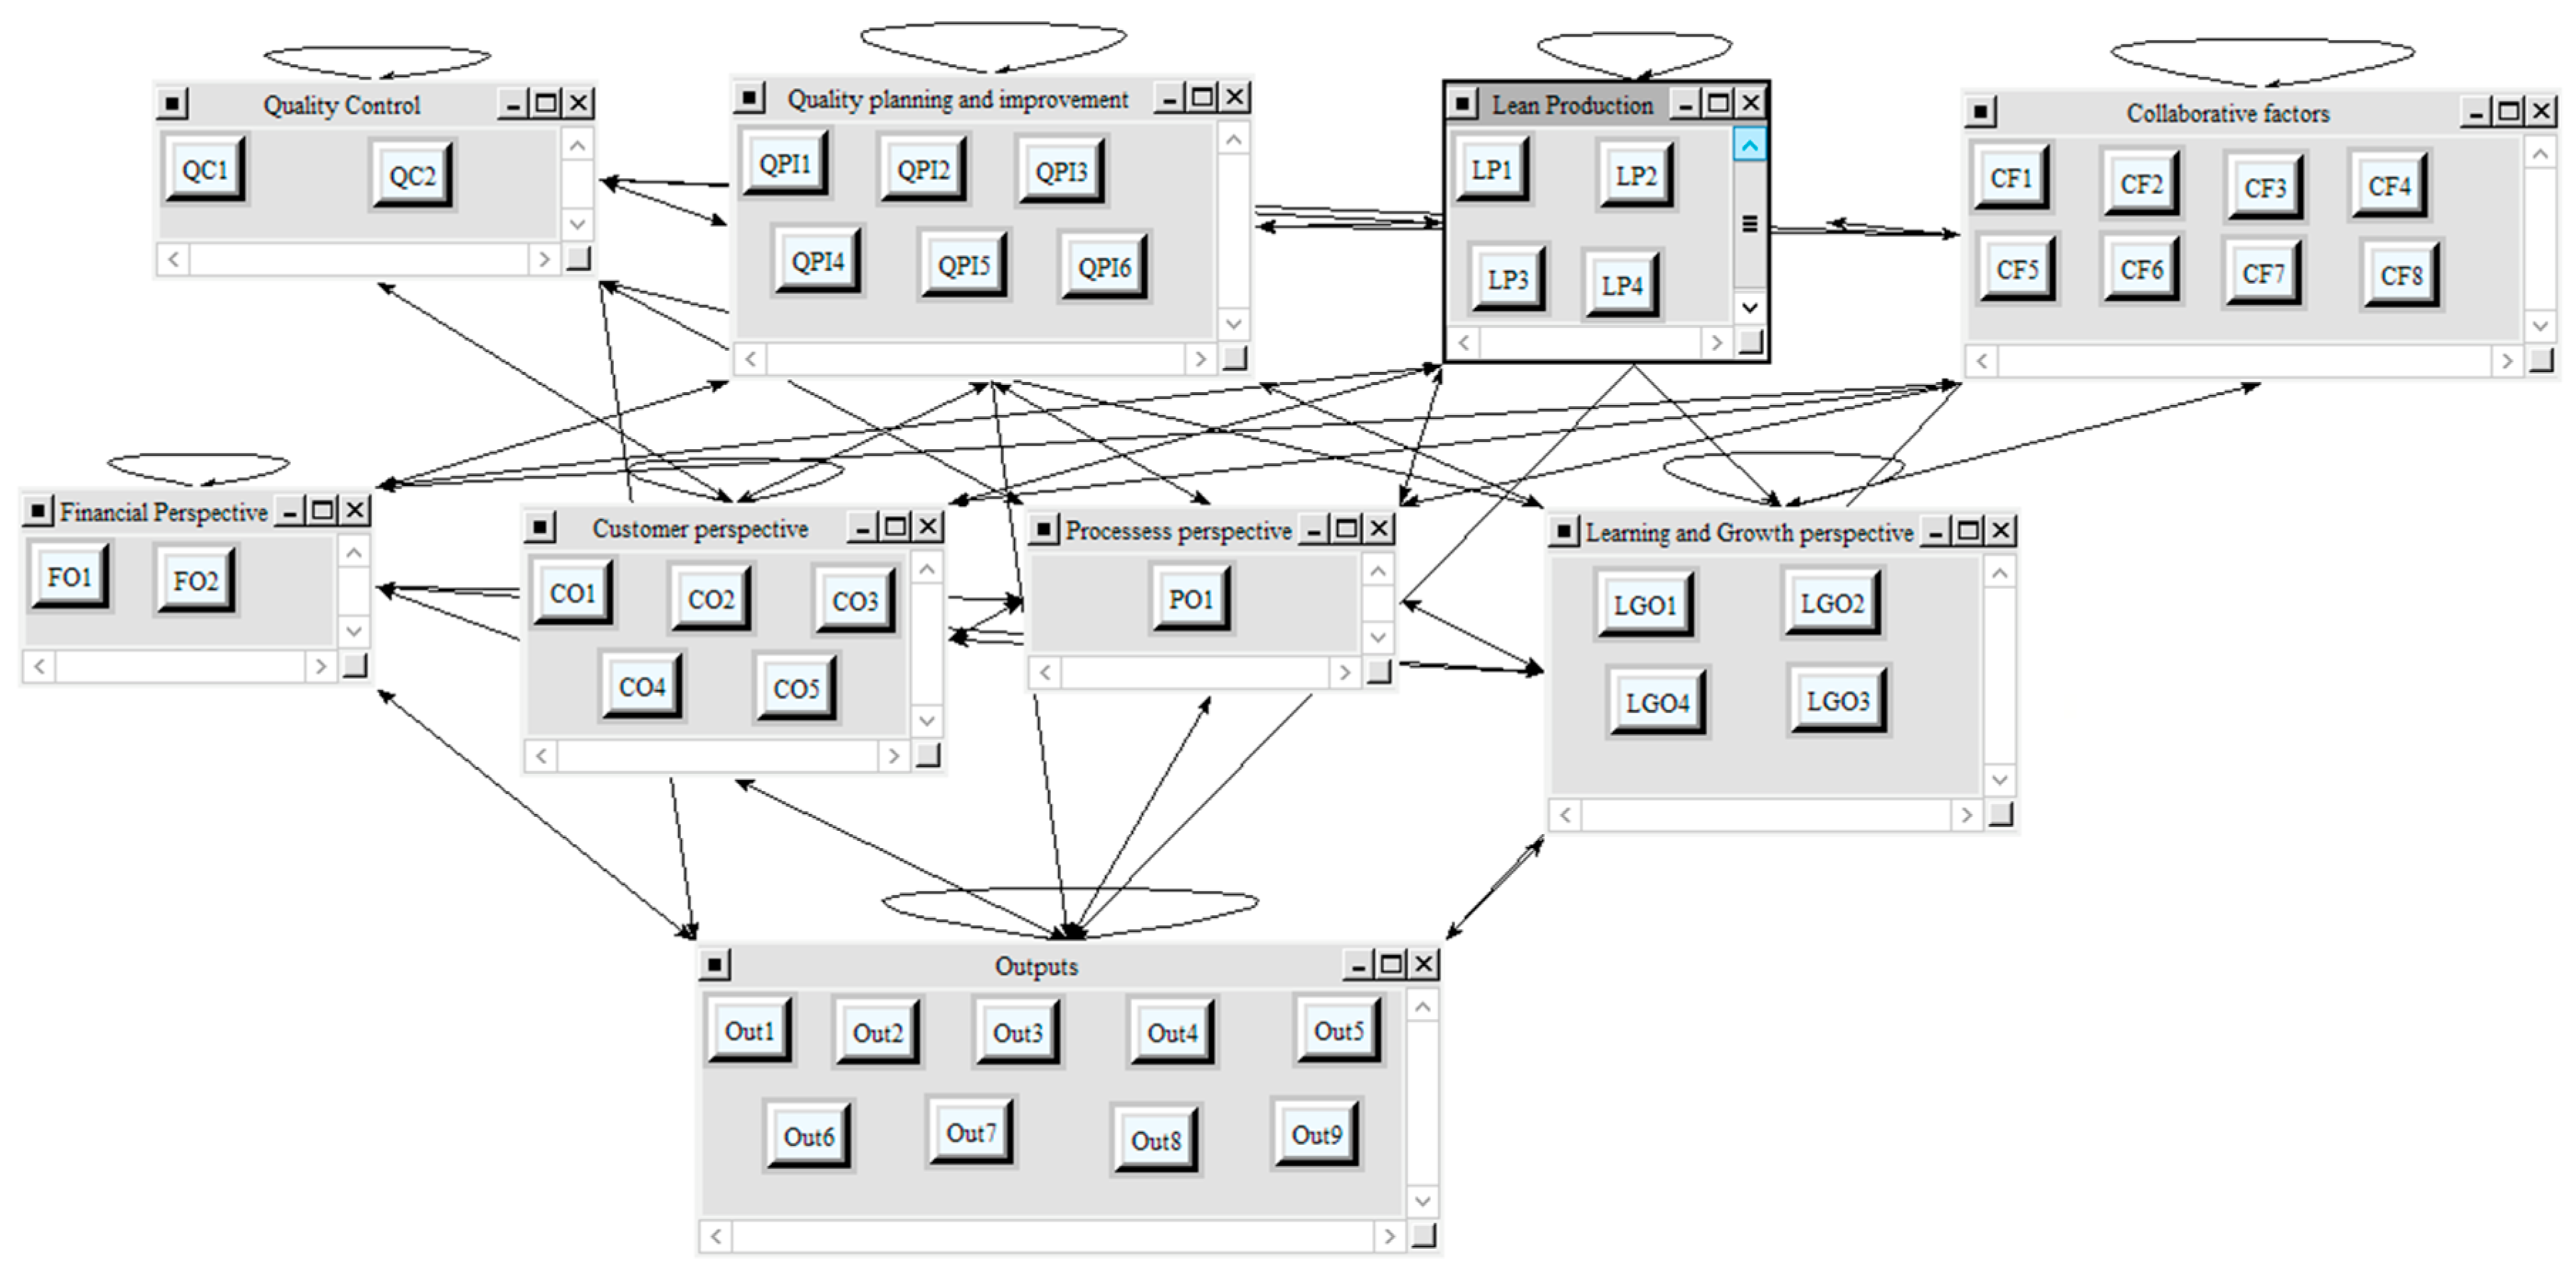
3. The ANP-BSC Methodology
4. Results
- Economic. Output 1 (Cost reduction), Output 7 (Sales increase), Output 9 (Information and knowledge);
- Environmental. Output 4 (Efficiency in product delivery), Output 3 (Quality assurance), Output 2 (Process improvement);
- Social. Output 5 (Increase in motivation and satisfaction level).
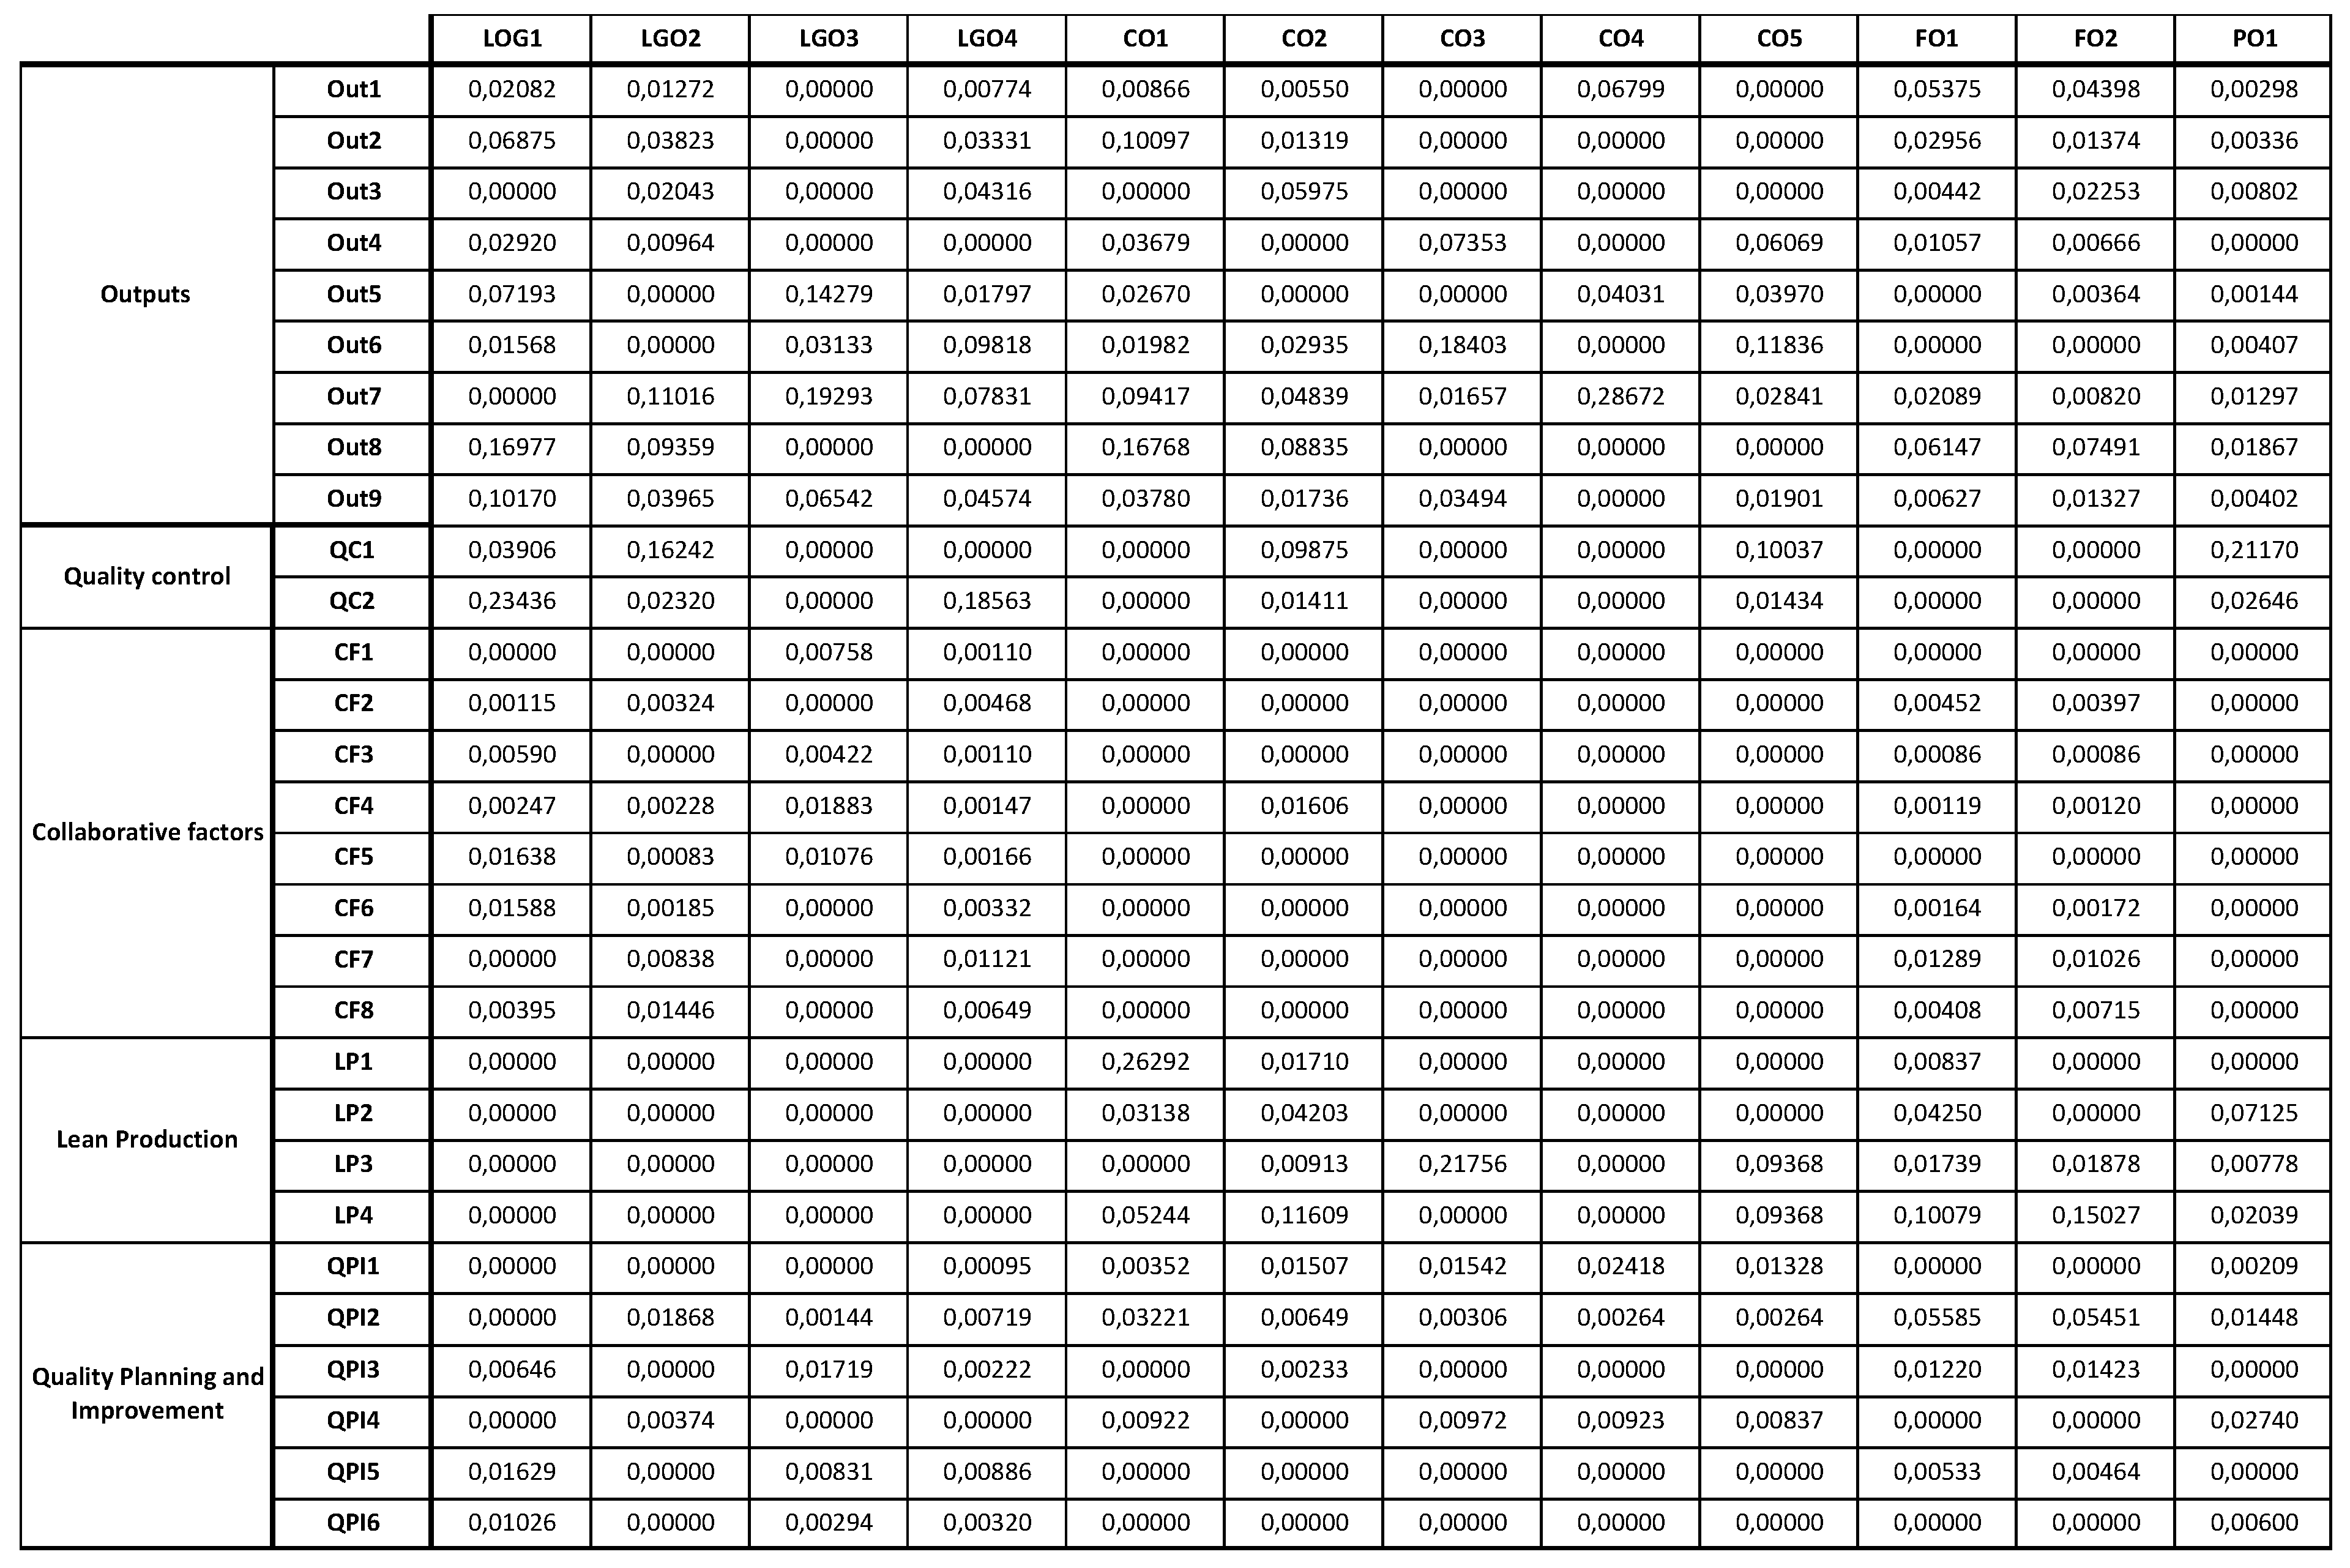
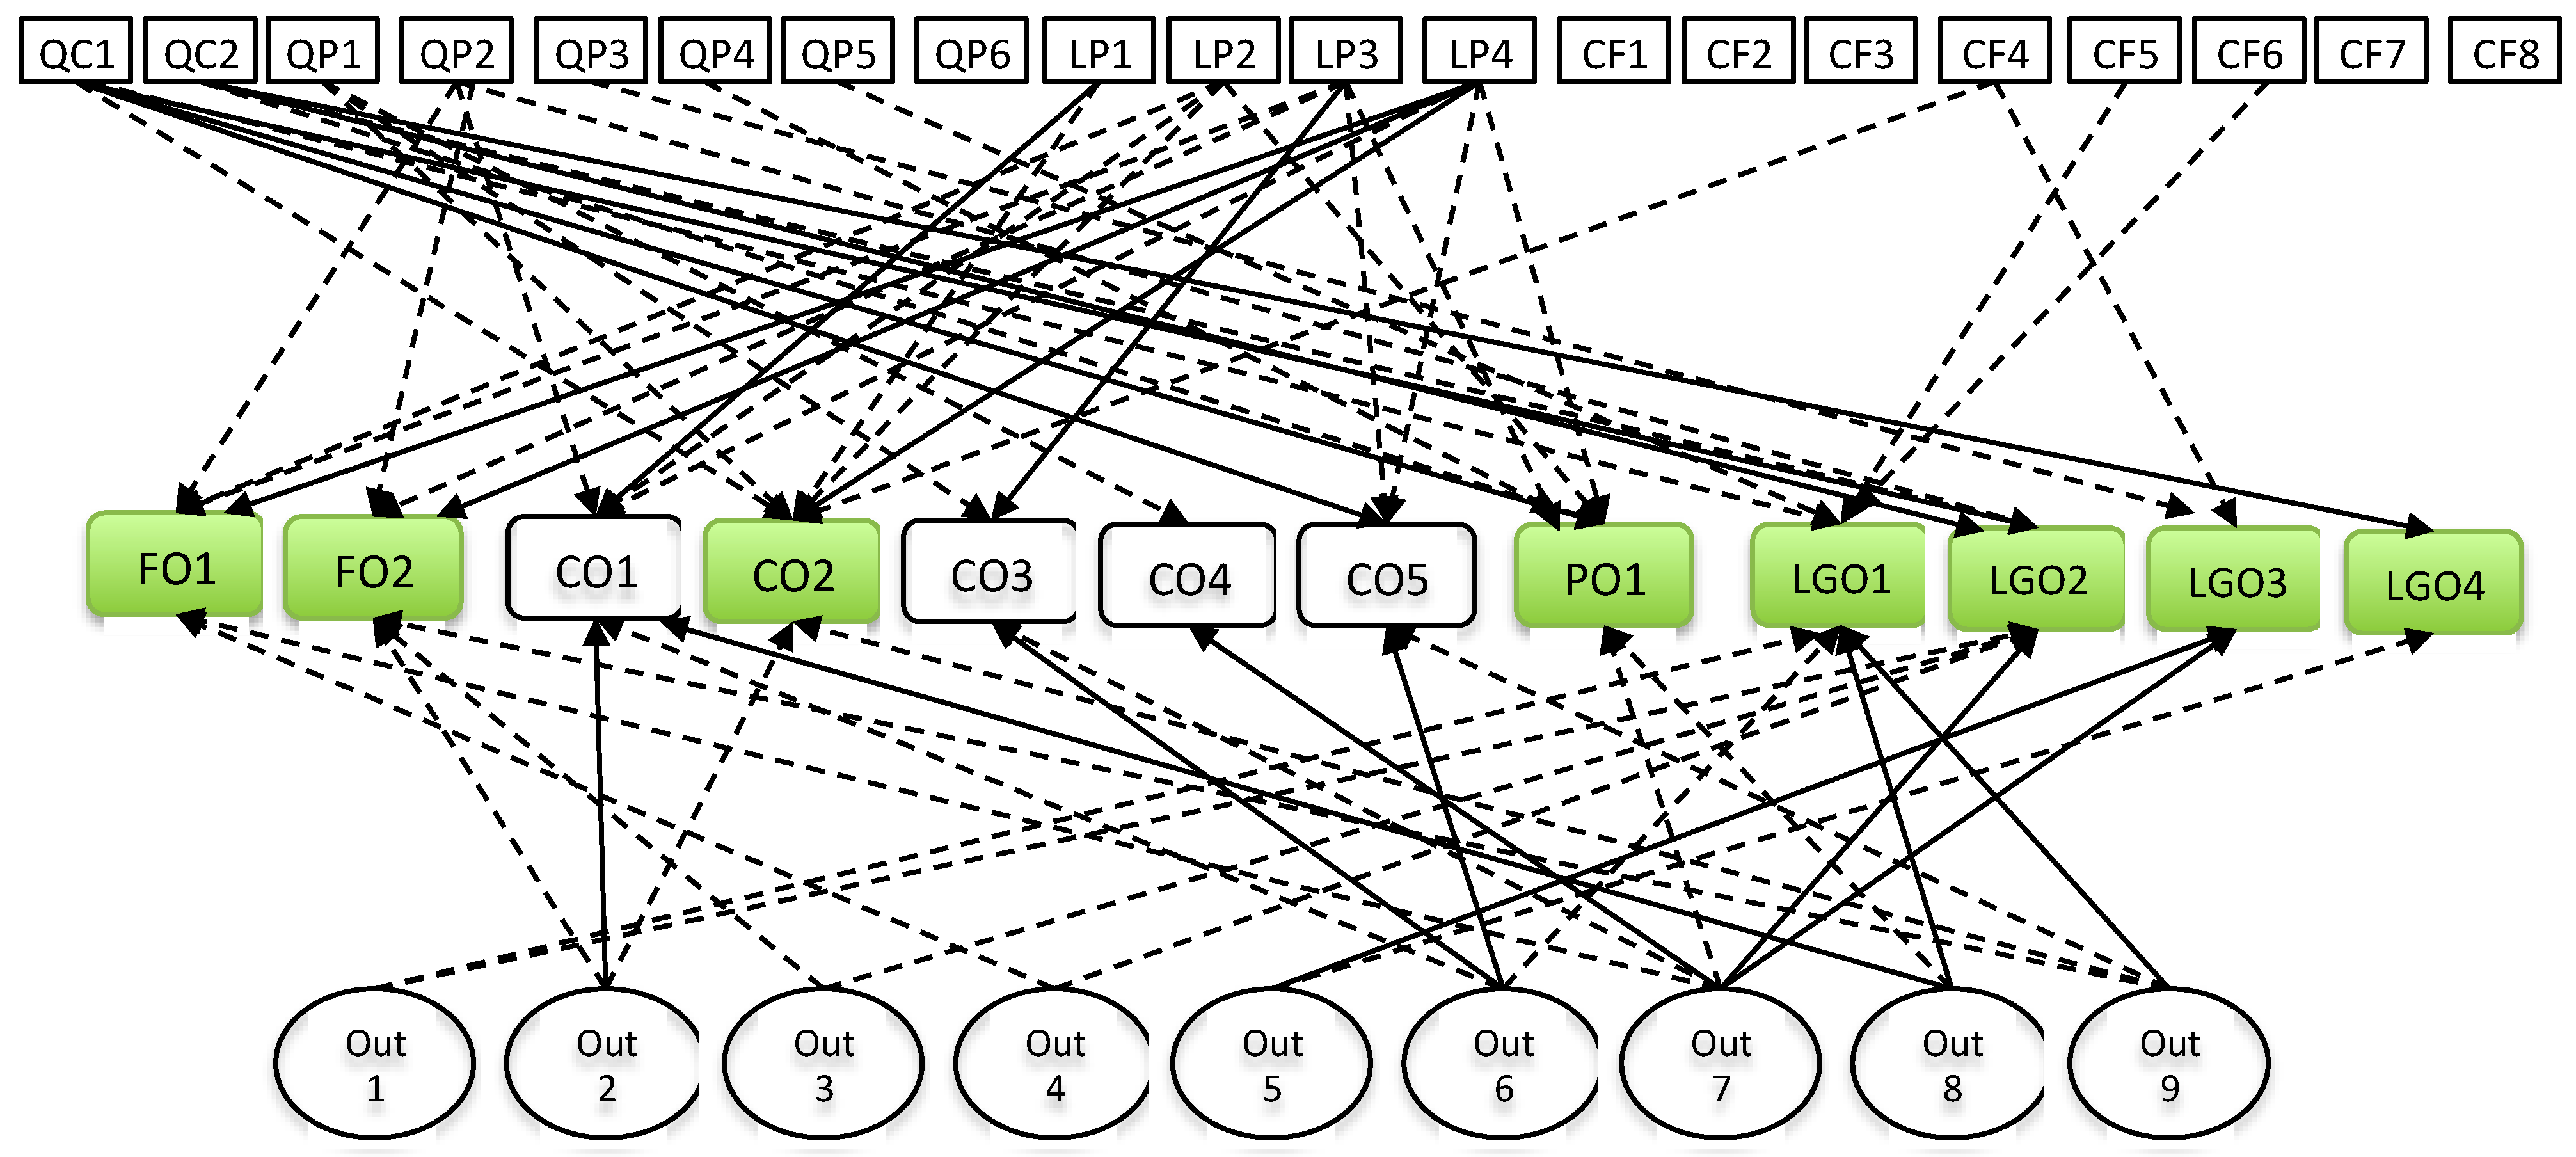
- Economic dimension. FO1 and FO2 receive a strong influence only from LP4 (Error-proof), whereas LGO2 is strongly influenced by both the TQM element QC1 (Simulation) and the Out7 (Sales increase). Additionally, FO1 and FO2 are influenced with a medium–low intensity by the TQM elements LP2 (Automation), LP3 (Just in time) and QPI2 (Continuous improvement), and by Out2 (Process improvement), Out3 (Quality assurance), Out4 (Efficiency in product delivery), Out7 (Productivity increase) and Out9 (Information and knowledge). On the other hand, LGO2 is relatively influenced by QC2 (Sampling), QPI2 (Continuous improvement) and Out 1 (Cost reduction), Out3 (Quality assurance) and Out 4 (Efficiency in product delivery).
- Environmental dimension. PO1 is strongly influenced by QC1 (Simulation) and relatively influenced by all of the TQM elements, QC2 (Sampling), LP2 (Automation), LP4 (Error-proof), QPI4 (Recognition and reward systems), Out7 (Productivity increase) and Out8 (Interoperability). On the other hand, CO2 is strongly influenced by LP4 (Error-proof) and relatively influenced by al; of the TQM elements LP2 (Automation), LP1 (Redistribution of work), QPI1 (Customer needs), CF4 (Information sharing process), and Out2 (Process improvement) and Out9 (Information and knowledge).
- Social dimension. LGO1 and LGO4 are strongly influenced by the TQM element QC2 (Sampling) and by Out5 (Increase in motivation and satisfaction level), Out7 (Sales increase), Out8 (Productivity increase) and Out9 (Information and knowledge). On the other hand, LGO1, LGO3 and LGO4 are moderately influenced by both of the TQM elements, CF4 (Information sharing process), CF5 (Joint decisions), CF6 (Process alignment), QPI3 (Training), QPI5 (Recognition and rewards systems) and Out1 (Cost reduction), Out5 (Increase in motivation and satisfaction level) and Out6 (Information and knowledge).
- Strong direct influences, which are produced by LP4 (Error-proof);
- Medium–low direct influences, which are produced by LP2 (Automation), LP3 (Just in time) and QPI2 (Continuous improvement).
- The organisation should primarily focus on, foster and maintain the TQM elements of LP4 (Error-proof) and QC1 (Simulation), which will strongly influence the three key sustainable strategic objectives (FO1, PO1, and FO2);
- Secondly, they should foster and augment the investment in LP2 (Automation) and either LP3 (Just in time) or QPI2 (Continuous improvement), which will moderately influence the achievement of the three key sustainable strategic objectives (FO1, PO1 and FO2).
- Thirdly, they should foster QC2 (Sampling), which strongly affects both the LGO4 and LGO1.
5. Discussion
6. Conclusions
Author Contributions
Funding
Conflicts of Interest
References
- Hardie, N. The effects of quality on business performance. Qual. Manag. J. 1997, 4, 65–83. [Google Scholar] [CrossRef]
- Lee, C.L.; Yang, H.J. Organization structure, competition and performance measurement systems and their joint effects on performance. Manag. Account. Res. 2011, 22, 84–104. [Google Scholar] [CrossRef]
- Davis, T. Breakdowns in total quality management. Int. J. Manag. 1997, 14, 13–23. [Google Scholar]
- Powell, T.C. Total quality management as competitive advantage: A review and empirical study. Strateg. Manag. J. 1995, 16, 15–37. [Google Scholar] [CrossRef]
- Westphal, J.D.; Gulati, R.; Shortell, S.M. The institutionalization of total quality management: The emergence of normative TQM adoption and the consequences for organizational legitimacy and performance. Acad. Manag. Procedia 1996, 14, 249–253. [Google Scholar] [CrossRef]
- Choi, T.; Eboch, K. The TQM paradox: Relations among TQM practices, plant performance, and customer satisfaction. J. Oper. Manag. 1998, 17, 59–75. [Google Scholar] [CrossRef]
- Brah, S.A.; Tee, S.S.; Madhu Rao, B. Relationship between TQM and performance of Singapore companies. Int. J. Qual. Reliab. Manag. 2002, 19, 356–379. [Google Scholar] [CrossRef]
- Shenaway, E.E.; Baker, T.; Lemak, D.J. A meta-analysis of the effect of TQM on competitive advantage. Int. J. Qual. Reliab. Manag. 2007, 25, 42–61. [Google Scholar]
- Zakuan, N.M.; Yusof, S.M.; Laosirihongthong, T.; Shaharoun, A.M. Proposed relationship of TQM and organisational performance using structured equation modelling. Total Qual. Manag. 2010, 21, 185–203. [Google Scholar] [CrossRef]
- Corredor, P.; Goñi, S. TQM and performance: Is the relationship so obvious? J. Bus. Res. 2011, 64, 830–838. [Google Scholar] [CrossRef]
- Talib, F.; Rahman, Z.; Qureshi, M.N. An empirical investigation of relationship between total quality management practices and quality performance in Indian service companies. Int. J. Qual. Reliab. Manag. 2013, 30, 280–291. [Google Scholar] [CrossRef]
- Ahmad, M.; Zakuan, N.; Jusoh, A.; Takala, J. Relationship of tqm and business performance with mediators of spc, lean production and tpm. Procedia-Soc. Behav. Sci. 2012, 65, 186–191. [Google Scholar] [CrossRef]
- Kaur, P.; Sharma, S.K. Evaluating the relationship and influence of critical success factors of tqm on business performance: Evidence from SMEs of manufacturing sector. IUP J. Oper. Manag. 2014, 13, 17–30. [Google Scholar]
- García-Bernal, J.; Ramírez-Alesón, M. Why and how tqm leads to performance improvements. Qual. Manag. J. 2015, 22, 23–37. [Google Scholar] [CrossRef]
- Farish, K.; Anil, A.P.; Satish, K. Effect of TQM Practices on Financial Performance through Innovation Performance-In Indian Manufacturing Context. Int. Res. J. Eng. Technol. 2017, 4, 2649–2655. [Google Scholar]
- Qasrawi, B.T.; Almahamid, S.M.; Qasrawi, S.T. The impact of TQM practices and KM processes on organisational performance: An empirical investigation. Int. J. Qual. Reliab. Manag. 2017, 34, 1034–1055. [Google Scholar] [CrossRef]
- Singh, V.; Kumar, A.; Singh, T. Impact of TQM on organisational performance: The case of Indian manufacturing and service industry. Oper. Res. Perspect. 2018, 5, 199–217. [Google Scholar] [CrossRef]
- Hendricks, K.B.; Singhal, V.R. Firm characteristics, total quality management, and financial performance. J. Oper. Manag. 2001, 19, 269–285. [Google Scholar] [CrossRef]
- Hansson, J.; Eriksson, H. The impact of TQM on financial performance. Meas. Bus. Excell. 2002, 6, 44–54. [Google Scholar] [CrossRef]
- York, K.M.; Miree, C.E. Causation or covariation: An empirical re-examination of the link between TQM and financial performance. J. Oper. Manag. 2004, 22, 291–311. [Google Scholar] [CrossRef]
- Gündüz, G.Ş.; Gündüz, Ç. Examining the perception of quality and customer satisfaction within the framework of total quality management in textile sector. Tekst. Ve Konfeksiyon 2017, 27, 101–107. [Google Scholar]
- Jaiswal, K.; Garg, M. Impact of TQM on employee and customer satisfaction-A study on tricity region. 8M: J. Indian Manag. Strategy 2018, 23, 28–35. [Google Scholar] [CrossRef]
- Hwang, G.H. The impact of TQM practices on employee satisfaction in the ICT customer service and retail distribution organizations. J. Korean Soc. Equip. Manag. 2015, 20, 39–50. [Google Scholar]
- Zimon, D. The impact of TQM philosophy for the improvement of logistics processes in the supply chain. Int. J. Qual. Res. 2017, 11, 3–16. [Google Scholar]
- Ooi, K.B.; Arumugam, V.; Teh, P.L.; Chong, A.Y.L. TQM practices and its association with production workers. Ind. Manag. Data Syst. 2008, 108, 909–927. [Google Scholar] [CrossRef]
- Dubey, R.; Gunasekaran, A. Exploring soft TQM dimensions and their impact on firm performance: Some exploratory empirical results. Int. J. Prod. Res. 2015, 53, 371–382. [Google Scholar] [CrossRef]
- Basu, R.; Bhola, P. Impact of quality management practices on performance stimulating growth Empirical evidence from Indian IT enabled service SMEs. Int. J. Qual. Reliab. Manag. 2016, 33, 1179–1201. [Google Scholar] [CrossRef]
- Shafiq, M.; Lasrado, F.; Hafeez, K. The effect of TQM on organisational performance: Empirical evidence from the textile sector of a developing country using SEM. Total Qual. Manag. Bus. Excell. 2019, 30, 31–52. [Google Scholar] [CrossRef]
- Feng, J.; Prajogo, D.I.; Tan, K.C.; Sohal, A.S. The impact of TQM practices on performance: A comparative study between Australian and Singaporean organizations. Eur. J. Innov. Manag. 2006, 9, 269–278. [Google Scholar] [CrossRef]
- Kaynak, H. The relationship between total quality management practices and their effects on firm performance. J. Oper. Manag. 2003, 21, 405–435. [Google Scholar] [CrossRef]
- Wei, J.T.; Chang, Y.W.; Zhang, X.; Wu, H.H.; Tang, Y.T. Performance measurement systems, TQM and multi-level firm performance: A person–organisation fit perspective. Total Qual. Manag. Bus. Excell. 2019, 30, 1578–1595. [Google Scholar] [CrossRef]
- Hoque, Z. Total quality management and the balanced scorecard approach: A critical analysis of their potential relationships and directions for research. Crit. Perspect. Account. 2003, 14, 553–566. [Google Scholar] [CrossRef]
- Kaplan, R.S.; Norton, D.P. The Balanced Scorecard. Measures that Drive Performance. Available online: https://steinbeis-bi.de/images/artikel/hbr_1992.pdf (accessed on 31 July 2020).
- Sabbagh, O.; Ab Rahman, M.N.; Ismail, W.R.; Hussain, W.; Hirwani, W.M. The impact of TQM practices on key performance indicators: Empirical evidence from automotive dealerships. Econ. Manag. 2019, 22, 115–129. [Google Scholar] [CrossRef]
- Albuhisi, A.M.; Abdallah, A.B. The impact of soft TQM on financial performance: The mediating roles of non-financial balanced scorecard perspectives. Int. J. Qual. Reliab. Manag. 2018, 35, 1360–1379. [Google Scholar] [CrossRef]
- Figge, F.; Hahn, T.; Schaltegger, S.; Wagner, M. The sustainability balanced scorecard: Linking sustainability management to business strategy. Bus. Strategy Environ. 2002, 11, 269–284. [Google Scholar] [CrossRef]
- Ferreira, L.; Silva, C.; Garrido Azevedo, S. An environmental balanced scorecard for supply chain performance measurement. Benchmarking Int. J. 2016, 23, 1398–1422. [Google Scholar] [CrossRef]
- Motevali-Haghighi, S.; Torabi, S.A.; Ghasemi, R. An integrated approach for performance evaluation in sustainable supply chain networks. J. Clean. Prod. 2016, 137, 579–597. [Google Scholar] [CrossRef]
- Valenzuela, L.; Maturana, S. Designing a three-dimensional performance measurement system for the wine industry: A Chilean example. Agric. Syst. 2016, 142, 112–121. [Google Scholar] [CrossRef]
- Qorri, A.; Mujki, Z.; Kraslawski, A. A conceptual framework for measuring sustainability performance of supply chains. J. Clean. Prod. 2018, 189, 570–584. [Google Scholar] [CrossRef]
- Verdecho, M.-J.; Alarcón-Valero, F.; Pérez-Perales, D.; Alfaro-Saiz, J.-J.; Rodríguez-Rodríguez, R. A methodology to select suppliers to increase sustainability within supply chains. Cent. Eur. J. Oper. Res. 2020. [Google Scholar] [CrossRef]
- Popovic, T.; Kraslawski, A.; Barbosa-Póvoa, A.; Carvalho, A. Quantitative indicators for social sustainability assessment of society and product responsibility aspects in supply chains. J. Int. Stud. 2017, 10, 9–36. [Google Scholar] [CrossRef] [PubMed]
- Siva, V.; Gremyr, I.; Bergquist, B.; Garvare, R.; Zobel, T.; Isaksson, R. The support of Quality Management to sustainable development: A literature review. J. Clean. Prod. 2016, 138, 148–157. [Google Scholar] [CrossRef]
- Li, D.; Zhao, Y.; Zhang, L.; Chen, X.; Cao, C. Impact of quality management on green innovation. J. Clean. Prod. 2018, 170, 462–470. [Google Scholar] [CrossRef]
- Todorut, R. Sustainable development of organizations through total quality management. Procedia Soc. Behav. Sci. 2012, 62, 927–931. [Google Scholar] [CrossRef]
- Abbas, J. Impact of TQM on corporate sustainability through the mediating effect of knowledge management. J. Clean. Prod. 2020, 20, 118806. [Google Scholar] [CrossRef]
- Abbas, J. Impact of TQM on corporate green performance through the mediating role of corporate social responsibility. J. Clean. Prod. 2019, 242, 118458. [Google Scholar] [CrossRef]
- Perez Ruano, J.L.; Rodríguez-Rodríguez, R.; Alfaro-Saiz, J.J.; Verdecho, M.J. An ANP-Based Network to Measure the Impact of Lean Production on Organisational Performance. J. Ind. Eng. Manag. 2018, 11, 222–228. [Google Scholar] [CrossRef]
- Saaty, T.L. The Analytic Network Process. In Decision Making with Interdependence and Feedback, 2nd ed.; RWS Publications: Pittsburgh, PA, USA, 2001. [Google Scholar]
- Boj, J.J.; Rodríguez-Rodríguez, R.; Alfaro-Saiz, J.J. An ANP-multi-criteria-based methodology to link intangible assets and organizational performance in a Balanced Scorecard context. Decis. Support Syst. 2014, 68, 98–110. [Google Scholar] [CrossRef]
- Verdecho, M.J.; Alfaro-Saiz, J.J.; Rodríguez-Rodríguez, R.; Ortiz Bas, A. A multi-criteria approach for managing inter-enterprise collaborative relationships. Omega 2012, 40, 249–263. [Google Scholar] [CrossRef]
- Saaty, T.L. Fundamentals of Decision Making and Priority Theory with the Analytic Hierarchy Process, 1st ed.; RWS Publications: Pittsburgh, PA, USA, 1994. [Google Scholar]
- Neely, A.; Adams, C.; Crowe, P. The performance prism in practice. Meas. Bus. Excel. 2001, 5, 6–12. [Google Scholar] [CrossRef]
- Saaty, T.L.; Shih, H.S. Structures in decision-making: On the subjective geometry of hierarchies and networks. Eur. J. Oper. Res. 2009, 199, 867–872. [Google Scholar] [CrossRef]


| Perspective | Objective | Denomination | Goal | Sustainability Dimension |
|---|---|---|---|---|
| Financial perspective | Cost reduction | FO1 | 7% | Economic |
| Increase net benefit | FO2 | 2% | Economic | |
| Customer perspective | Increase product availability | CO1 | 4% | |
| Increase quality level by maintaining or reducing environmental impact | OCO2 | 1% | Environmental | |
| Increase customer loyalty | CO3 | 10% | ||
| Increase new customers | CO4 | 10% | ||
| Improve customer satisfaction | CO5 | 3% | ||
| Process perspective | Improve circular economy practices efficiency: Recycle, reuse, reduce and recover (4Rs) | PO1 | 7% (aggregated value) | Environmental |
| Learning and Growth | Increase staff competencies | LGO1 | 2% | Social |
| Increase and maximize the technological infrastructure | LGO2 | 20% | Economic | |
| Increase staff satisfaction | LGO3 | 10% | Social | |
| Increase development and learning programs | LGO4 | 2% | Social |
| Cluster | TQM Elements |
|---|---|
| Quality control (QC) | Simulation (QC1), Sampling (QC2) |
| Quality planning and improvement (QPI) | Customer needs (QPI1), Continuous improvement (QPI2), Training (QPI3), Quality standards (QPI4), Recognition and rewards systems (QPI5), Staff turnover (QPI6) |
| Lean Production (LP) | Redistribution of work (LP1), Automation with human touch (LP2), Just in time (LP3), Error-proof (LP4) |
| Collaboration factors (CF) | Trust (CF1), Supply chain design (CF2), Cooperation (CF3), Information sharing processes (CF4), Joint decisions (CF5), Multi-disciplinary teams (CF6), Process alignment (CF7), Interoperability (CF8) |
| Outputs (Out) | Cost reduction (Out1), Process improvement (Out2), Quality assurance (Out3), Efficiency in product delivery (Out4), Increase in motivation and satisfaction level (Out 5), Increase in customer satisfaction (Out6), Sales increase (Out7), Productivity increase (Out8), Information and knowledge (Out9) |
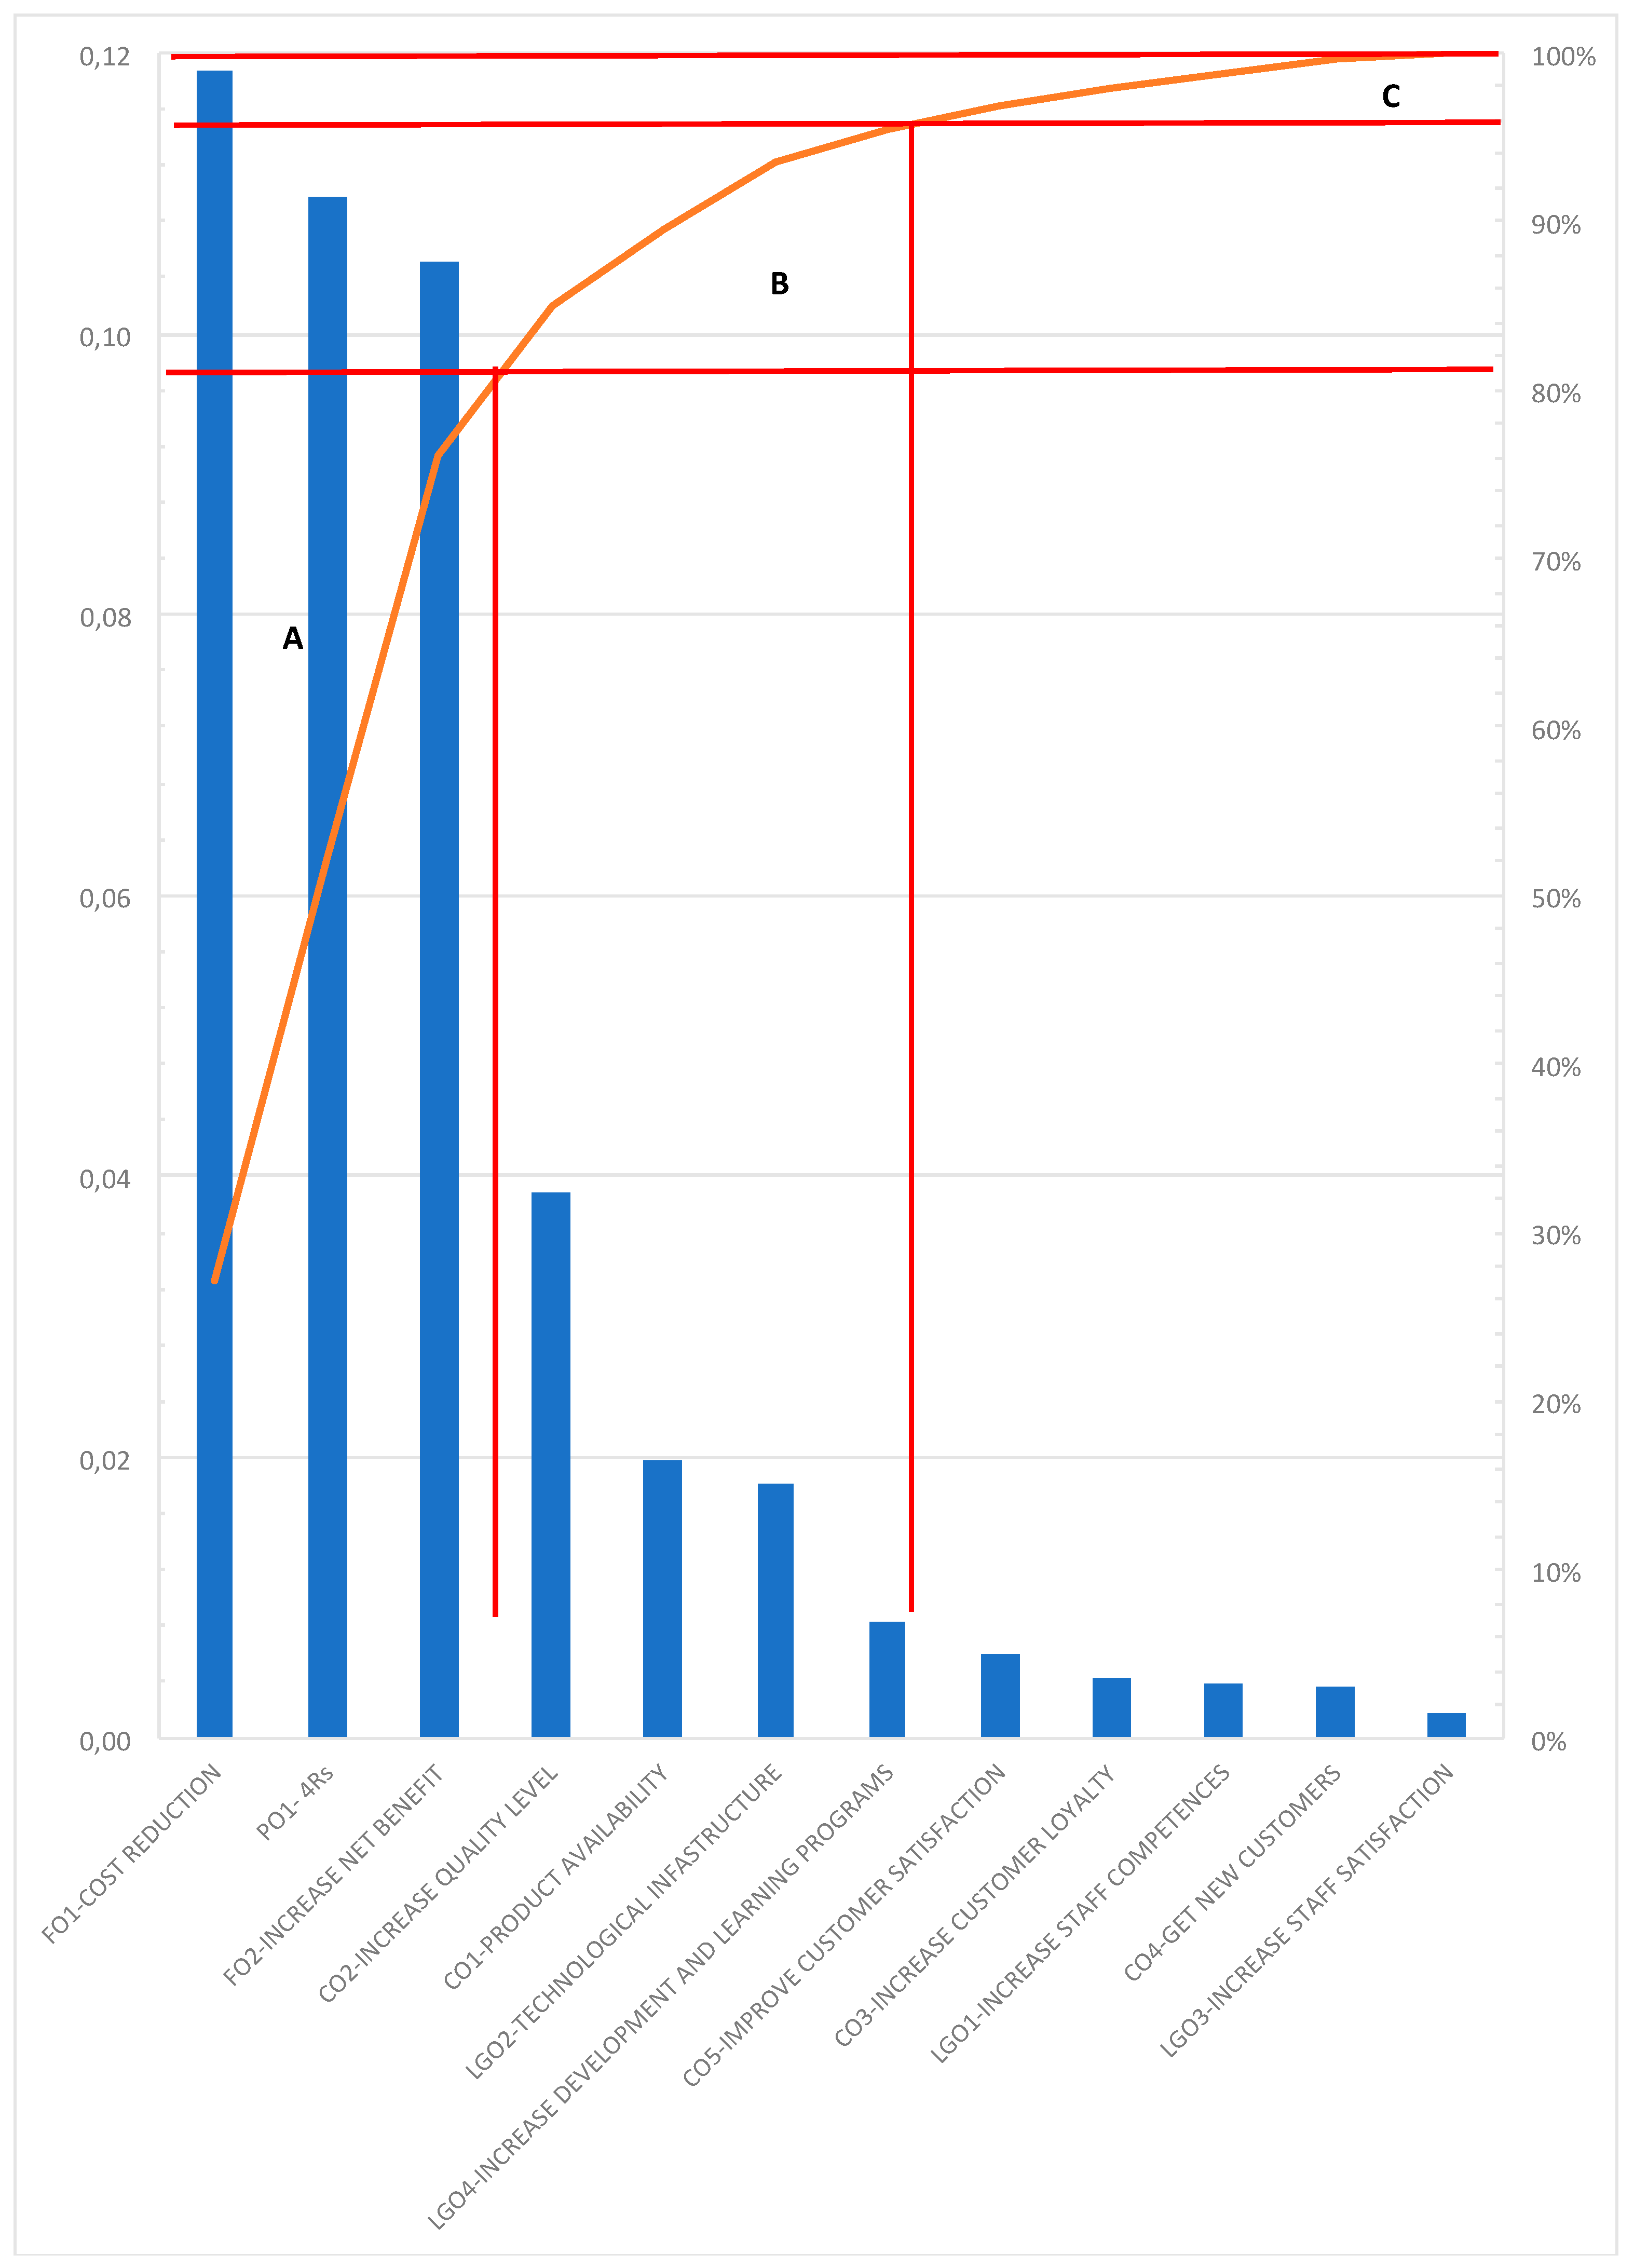
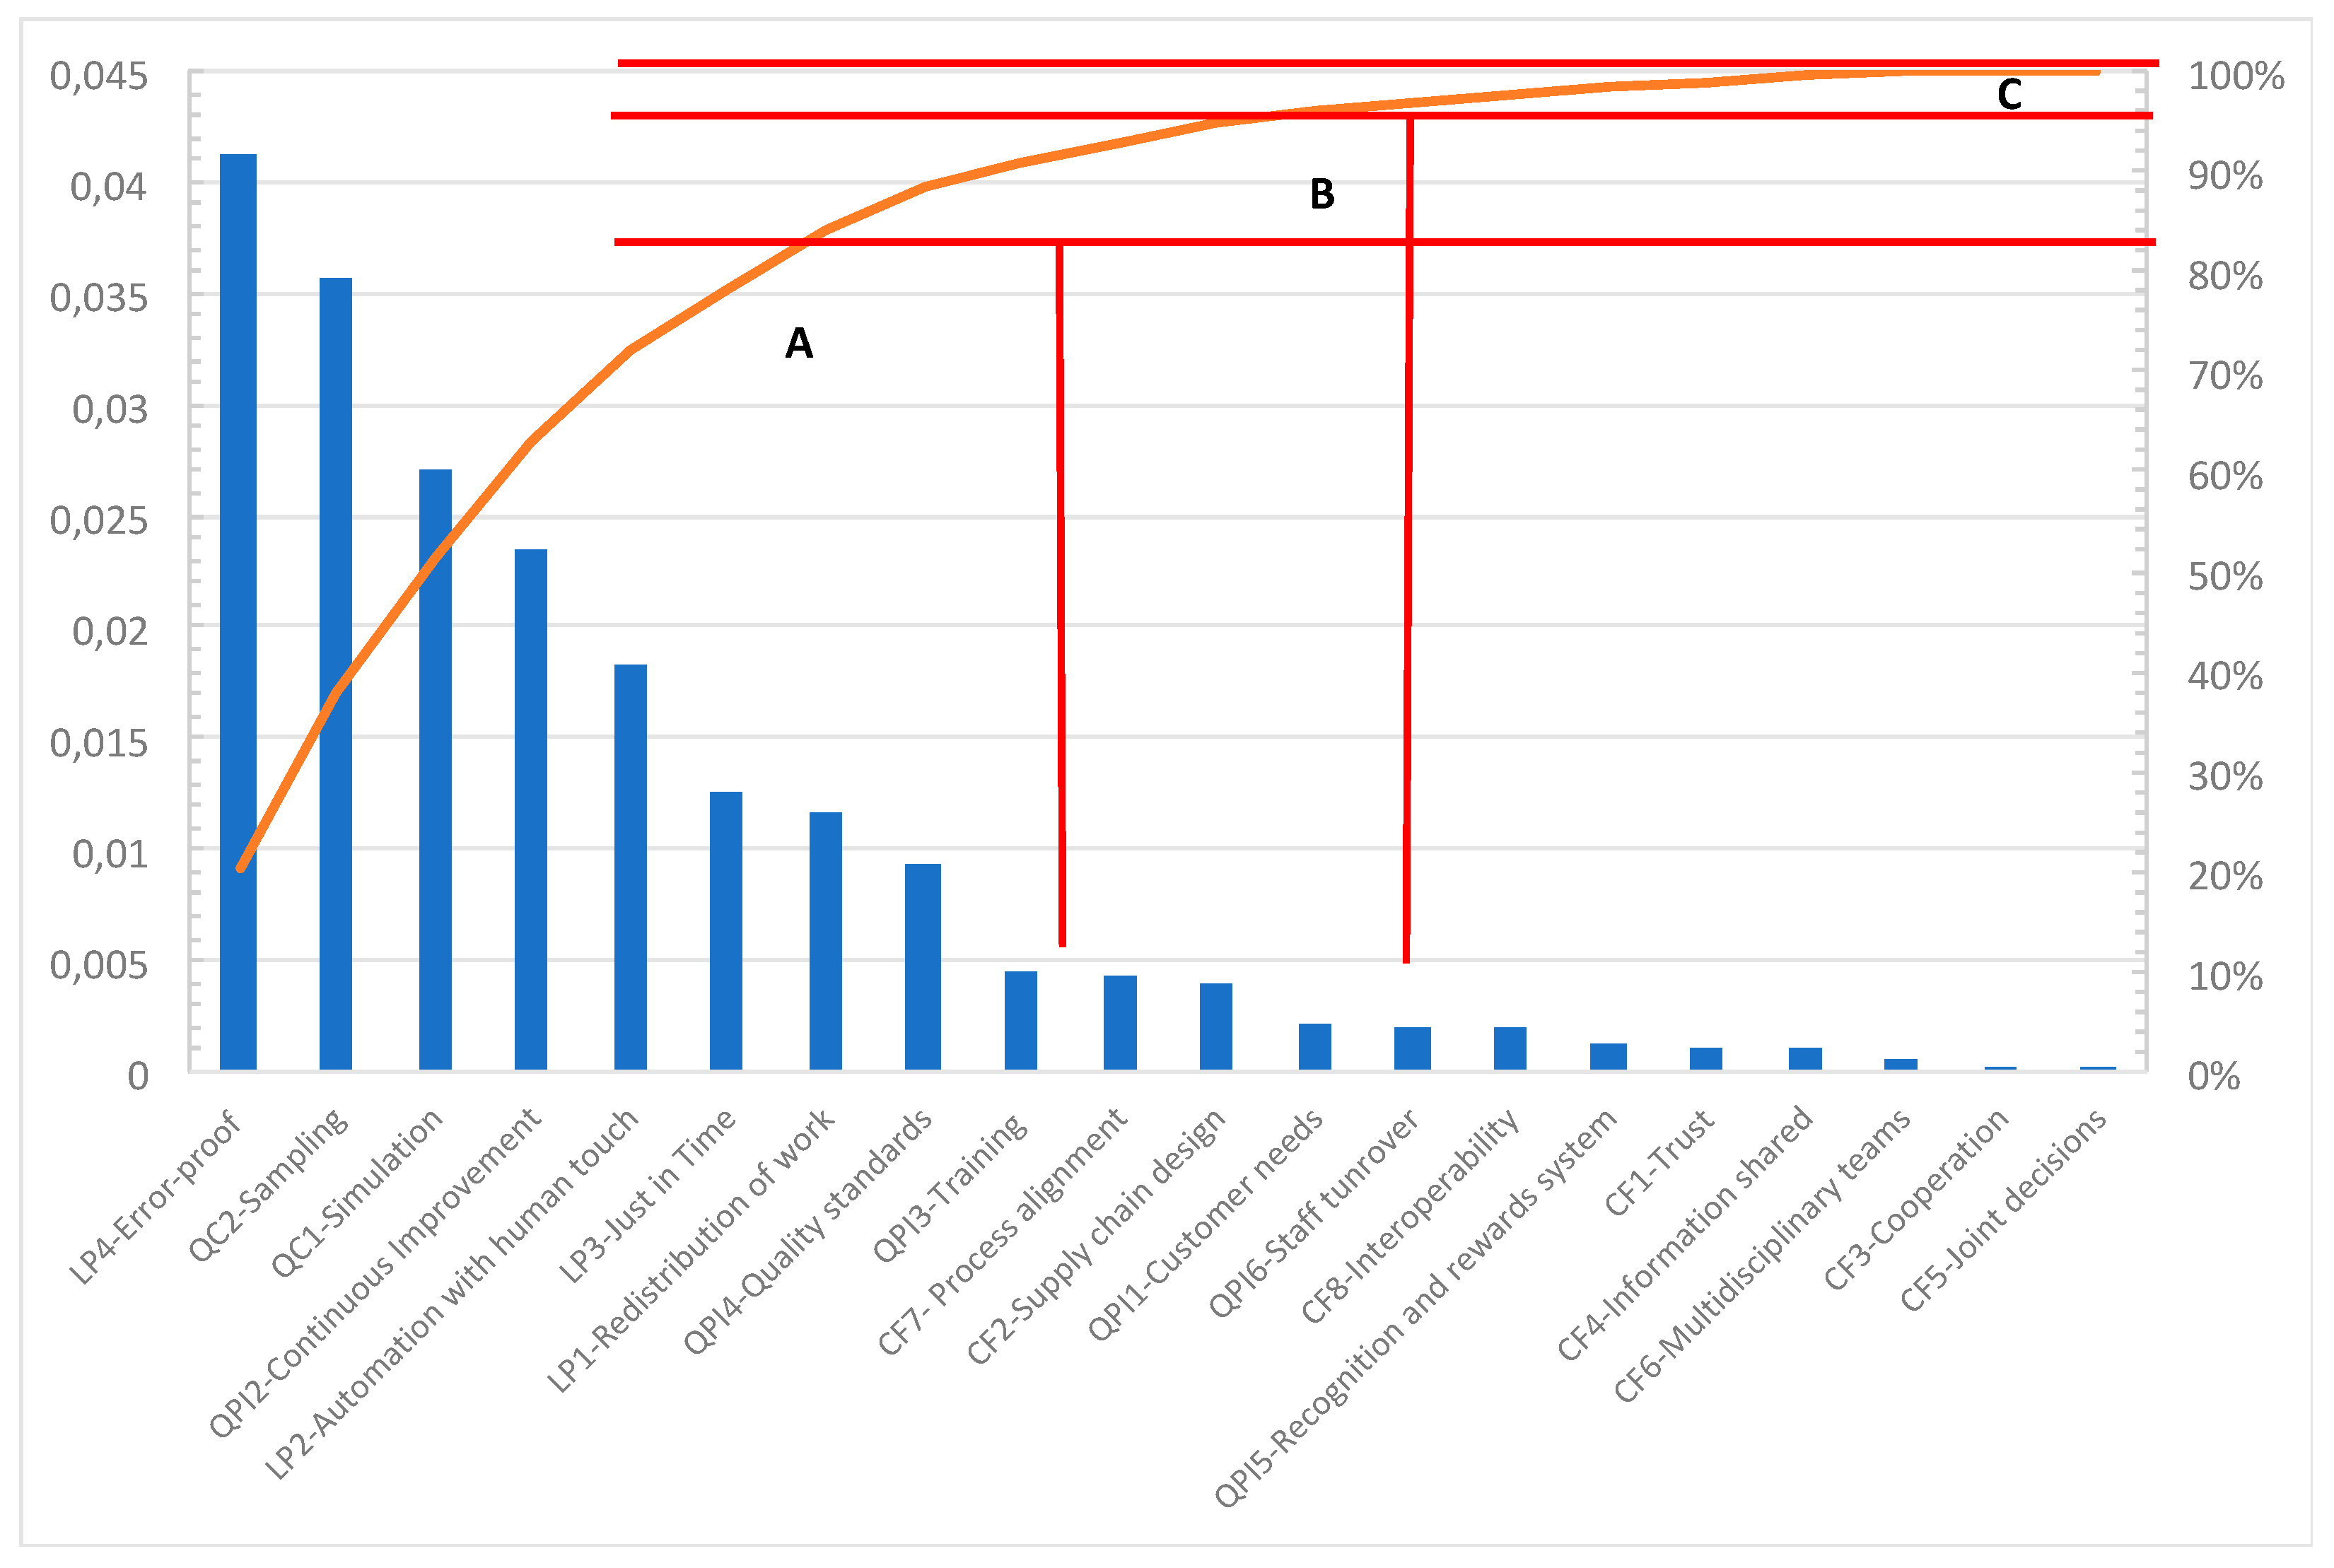
| Structural Block | Cluster | Element | Global Priority | Global Normalised Priority | Accumulated | Pareto Classes |
|---|---|---|---|---|---|---|
| Bsc | Financial Perspective | FO1 | 0.1187 | 11.87% | 11.87% | A |
| Bsc | Processes Perspective | PO1 | 0.1097 | 10.97% | 22.84% | A |
| Bsc | Financial Perspective | FO2 | 0.10508 | 10.51% | 33.35% | A |
| Outputs | Outputs | Out2 | 0.08575 | 8.58% | 41.93% | A |
| Outputs | Outputs | Out8 | 0.08243 | 8.24% | 50.17% | A |
| Outputs | Outputs | Out3 | 0.04976 | 4.98% | 55.15% | A |
| TQM | Lean Production | LP4 | 0.04121 | 4.12% | 59.27% | A |
| BSC | Customer Perspective | CO2 | 0.03875 | 3.88% | 63.14% | A |
| Outputs | Outputs | Out7 | 0.03724 | 3.72% | 66.87% | A |
| TQM | Quality Control | QC1 | 0.03569 | 3.57% | 70.44% | A |
| Outputs | Outputs | Out4 | 0.03086 | 3.09% | 73.52% | A |
| TQM | Quality Control | QC2 | 0.02716 | 2.72% | 76.24% | A |
| Outputs | Outputs | Out1 | 0.02522 | 2.52% | 78.76% | A |
| Outputs | Outputs | Out9 | 0.02501 | 2.50% | 81.26% | B |
| TQM | Quality Planning | QPI2 | 0.02352 | 2.35% | 83.61% | B |
| Bsc | Customer Perspective | CO1 | 0.01985 | 1.99% | 85.60% | B |
| TQM | Lean Production | LP2 | 0.01831 | 1.83% | 87.43% | B |
| Bsc | L&G Perspective | LGO2 | 0.01819 | 1.82% | 89.25% | B |
| Outputs | Outputs | Out6 | 0.01635 | 1.64% | 90.89% | B |
| TQM | Lean Production | LP3 | 0.01247 | 1.25% | 92.13% | B |
| TQM | Lean Production | LP1 | 0.01171 | 1.17% | 93.30% | B |
| TQM | Quality Planning | QPI4 | 0.00938 | 0.94% | 94.24% | B |
| Bsc | L&G Perspective | LGO4 | 0.00835 | 0.84% | 95.08% | C |
| Outputs | Outputs | Out5 | 0.00649 | 0.65% | 95.73% | C |
| Bsc | Customer Perspective | CO5 | 0.00602 | 0.60% | 96.33% | C |
| TQM | Quality Planning | QPI3 | 0.00441 | 0.44% | 96.77% | C |
| TQM | Collaboration Factors | CF7 | 0.00438 | 0.44% | 97.21% | C |
| Bsc | Customer Perspective | CO3 | 0.00427 | 0.43% | 97.63% | C |
| TQM | Collaboration Factors | CF2 | 0.00395 | 0.40% | 98.03% | C |
| Bsc | L&G Perspective | LGO1 | 0.00392 | 0.39% | 98.42% | C |
| Bsc | Customer Perspective | CO4 | 0.00361 | 0.36% | 98.78% | C |
| TQM | Quality Planning | QPI1 | 0.00221 | 0.22% | 99.00% | C |
| TQM | Quality Planning | QPI6 | 0.00192 | 0.19% | 99.19% | C |
| TQM | Collaboration Factors | CF8 | 0.00189 | 0.19% | 99.38% | C |
| Bsc | L&G Perspective | LGO3 | 0.00173 | 0.17% | 99.56% | C |
| TQM | Quality Planning | QPI5 | 0.00132 | 0.13% | 99.69% | C |
| TQM | Collaboration Factors | CF1 | 0.00116 | 0.12% | 99.80% | C |
| TQM | Collaboration Factors | CF4 | 0.00109 | 0.11% | 99.91% | C |
| TQM | Collaboration Factors | CF6 | 0.0006 | 0.06% | 99.97% | C |
| TQM | Collaboration Factors | CF3 | 0.00026 | 0.03% | 100.00% | C |
| TQM | Collaboration Factors | CF5 | 0.00013 | 0.01% | 100.00% | C |
| Sustainability Dimension | Objective | Strongly Influenced by | Moderately Influenced by | |
|---|---|---|---|---|
| 1 (Key) | Economic | FO1. Cost reduction | LP4 | LP2, LP3, QPI2 |
| 2 (Key) | Environmental | PO1. 4Rs (Recycle, reuse, reduce and recover) | QC1 | LP2, LP4, QPI4 |
| 3 (Key) | Economic | FO2. Increase net benefit | LP4 | LP3, QPI2 |
| 4 | Environmental | CO2. Increase quality level by maintaining or reducing environmental impact | LP4 | LP1, LP2, QPI1, QC1, CF4 |
| 5 | Economic | LGO2. Increase and maximise the technological infrastructure | QC1 | QC2, QPI2 |
| 6 | Social | LGO4. Increase development and learning programs | QC2 | - |
| 7 | Social | LGO1. Increase staff competencies | QC2 | QPI5, QC1, CF5, CF6 |
| 8 | Social | LGO3. Increase staff satisfaction | - | QPI3, CF4 |
© 2020 by the authors. Licensee MDPI, Basel, Switzerland. This article is an open access article distributed under the terms and conditions of the Creative Commons Attribution (CC BY) license (http://creativecommons.org/licenses/by/4.0/).
Share and Cite
Andrade Arteaga, C.; Rodríguez-Rodríguez, R.; Alfaro-Saiz, J.-J.; Verdecho, M.-J. An ANP-Balanced Scorecard Methodology to Quantify the Impact of TQM Elements on Organisational Strategic Sustainable Development: Application to an Oil Firm. Sustainability 2020, 12, 6207. https://doi.org/10.3390/su12156207
Andrade Arteaga C, Rodríguez-Rodríguez R, Alfaro-Saiz J-J, Verdecho M-J. An ANP-Balanced Scorecard Methodology to Quantify the Impact of TQM Elements on Organisational Strategic Sustainable Development: Application to an Oil Firm. Sustainability. 2020; 12(15):6207. https://doi.org/10.3390/su12156207
Chicago/Turabian StyleAndrade Arteaga, Carla, Raúl Rodríguez-Rodríguez, Juan-José Alfaro-Saiz, and María-José Verdecho. 2020. "An ANP-Balanced Scorecard Methodology to Quantify the Impact of TQM Elements on Organisational Strategic Sustainable Development: Application to an Oil Firm" Sustainability 12, no. 15: 6207. https://doi.org/10.3390/su12156207
APA StyleAndrade Arteaga, C., Rodríguez-Rodríguez, R., Alfaro-Saiz, J.-J., & Verdecho, M.-J. (2020). An ANP-Balanced Scorecard Methodology to Quantify the Impact of TQM Elements on Organisational Strategic Sustainable Development: Application to an Oil Firm. Sustainability, 12(15), 6207. https://doi.org/10.3390/su12156207