Study on Land Use/Cover Change and Ecosystem Services in Harbin, China


 and
and
Abstract
1. Introduction
2. Materials and Methods
2.1. Study Area
2.2. Data Source
2.3. Methods
2.3.1. Land Use/Cover Change
2.3.2. Ecosystem Service Value
2.3.3. Ecological Economic Harmony
3. Results
3.1. Evolution Characteristics of Land Use/Cover Change
3.1.1. Change Characteristics of Quantitative Structure
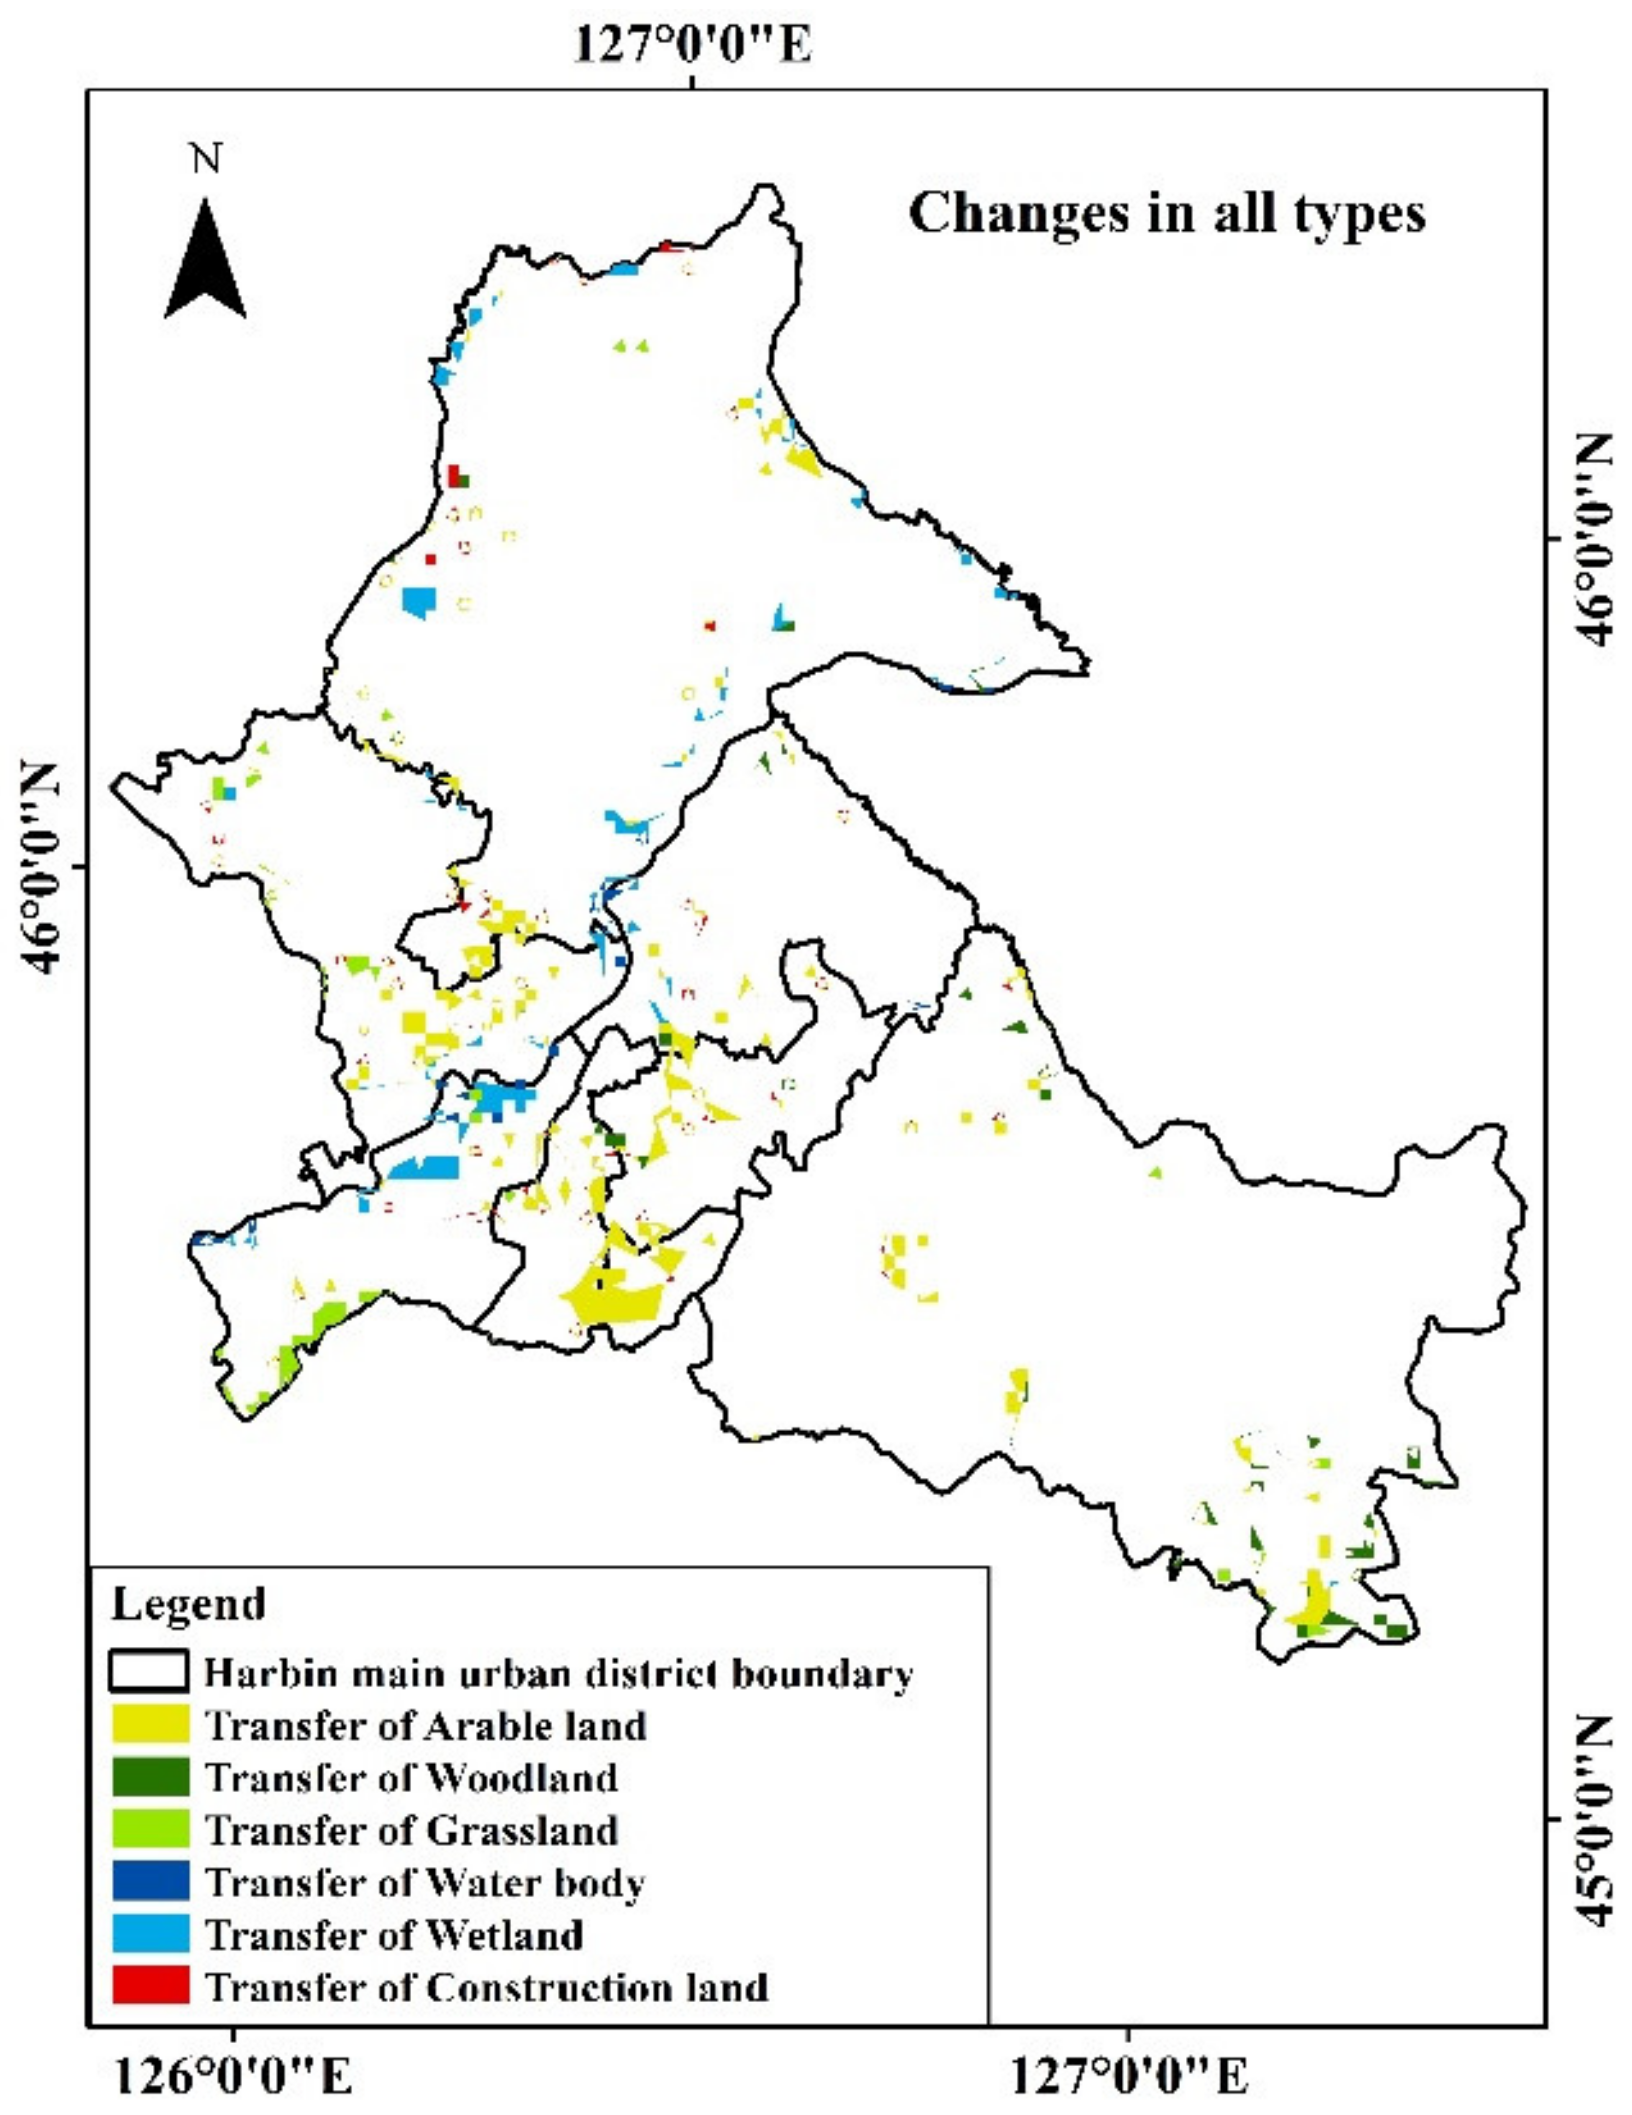
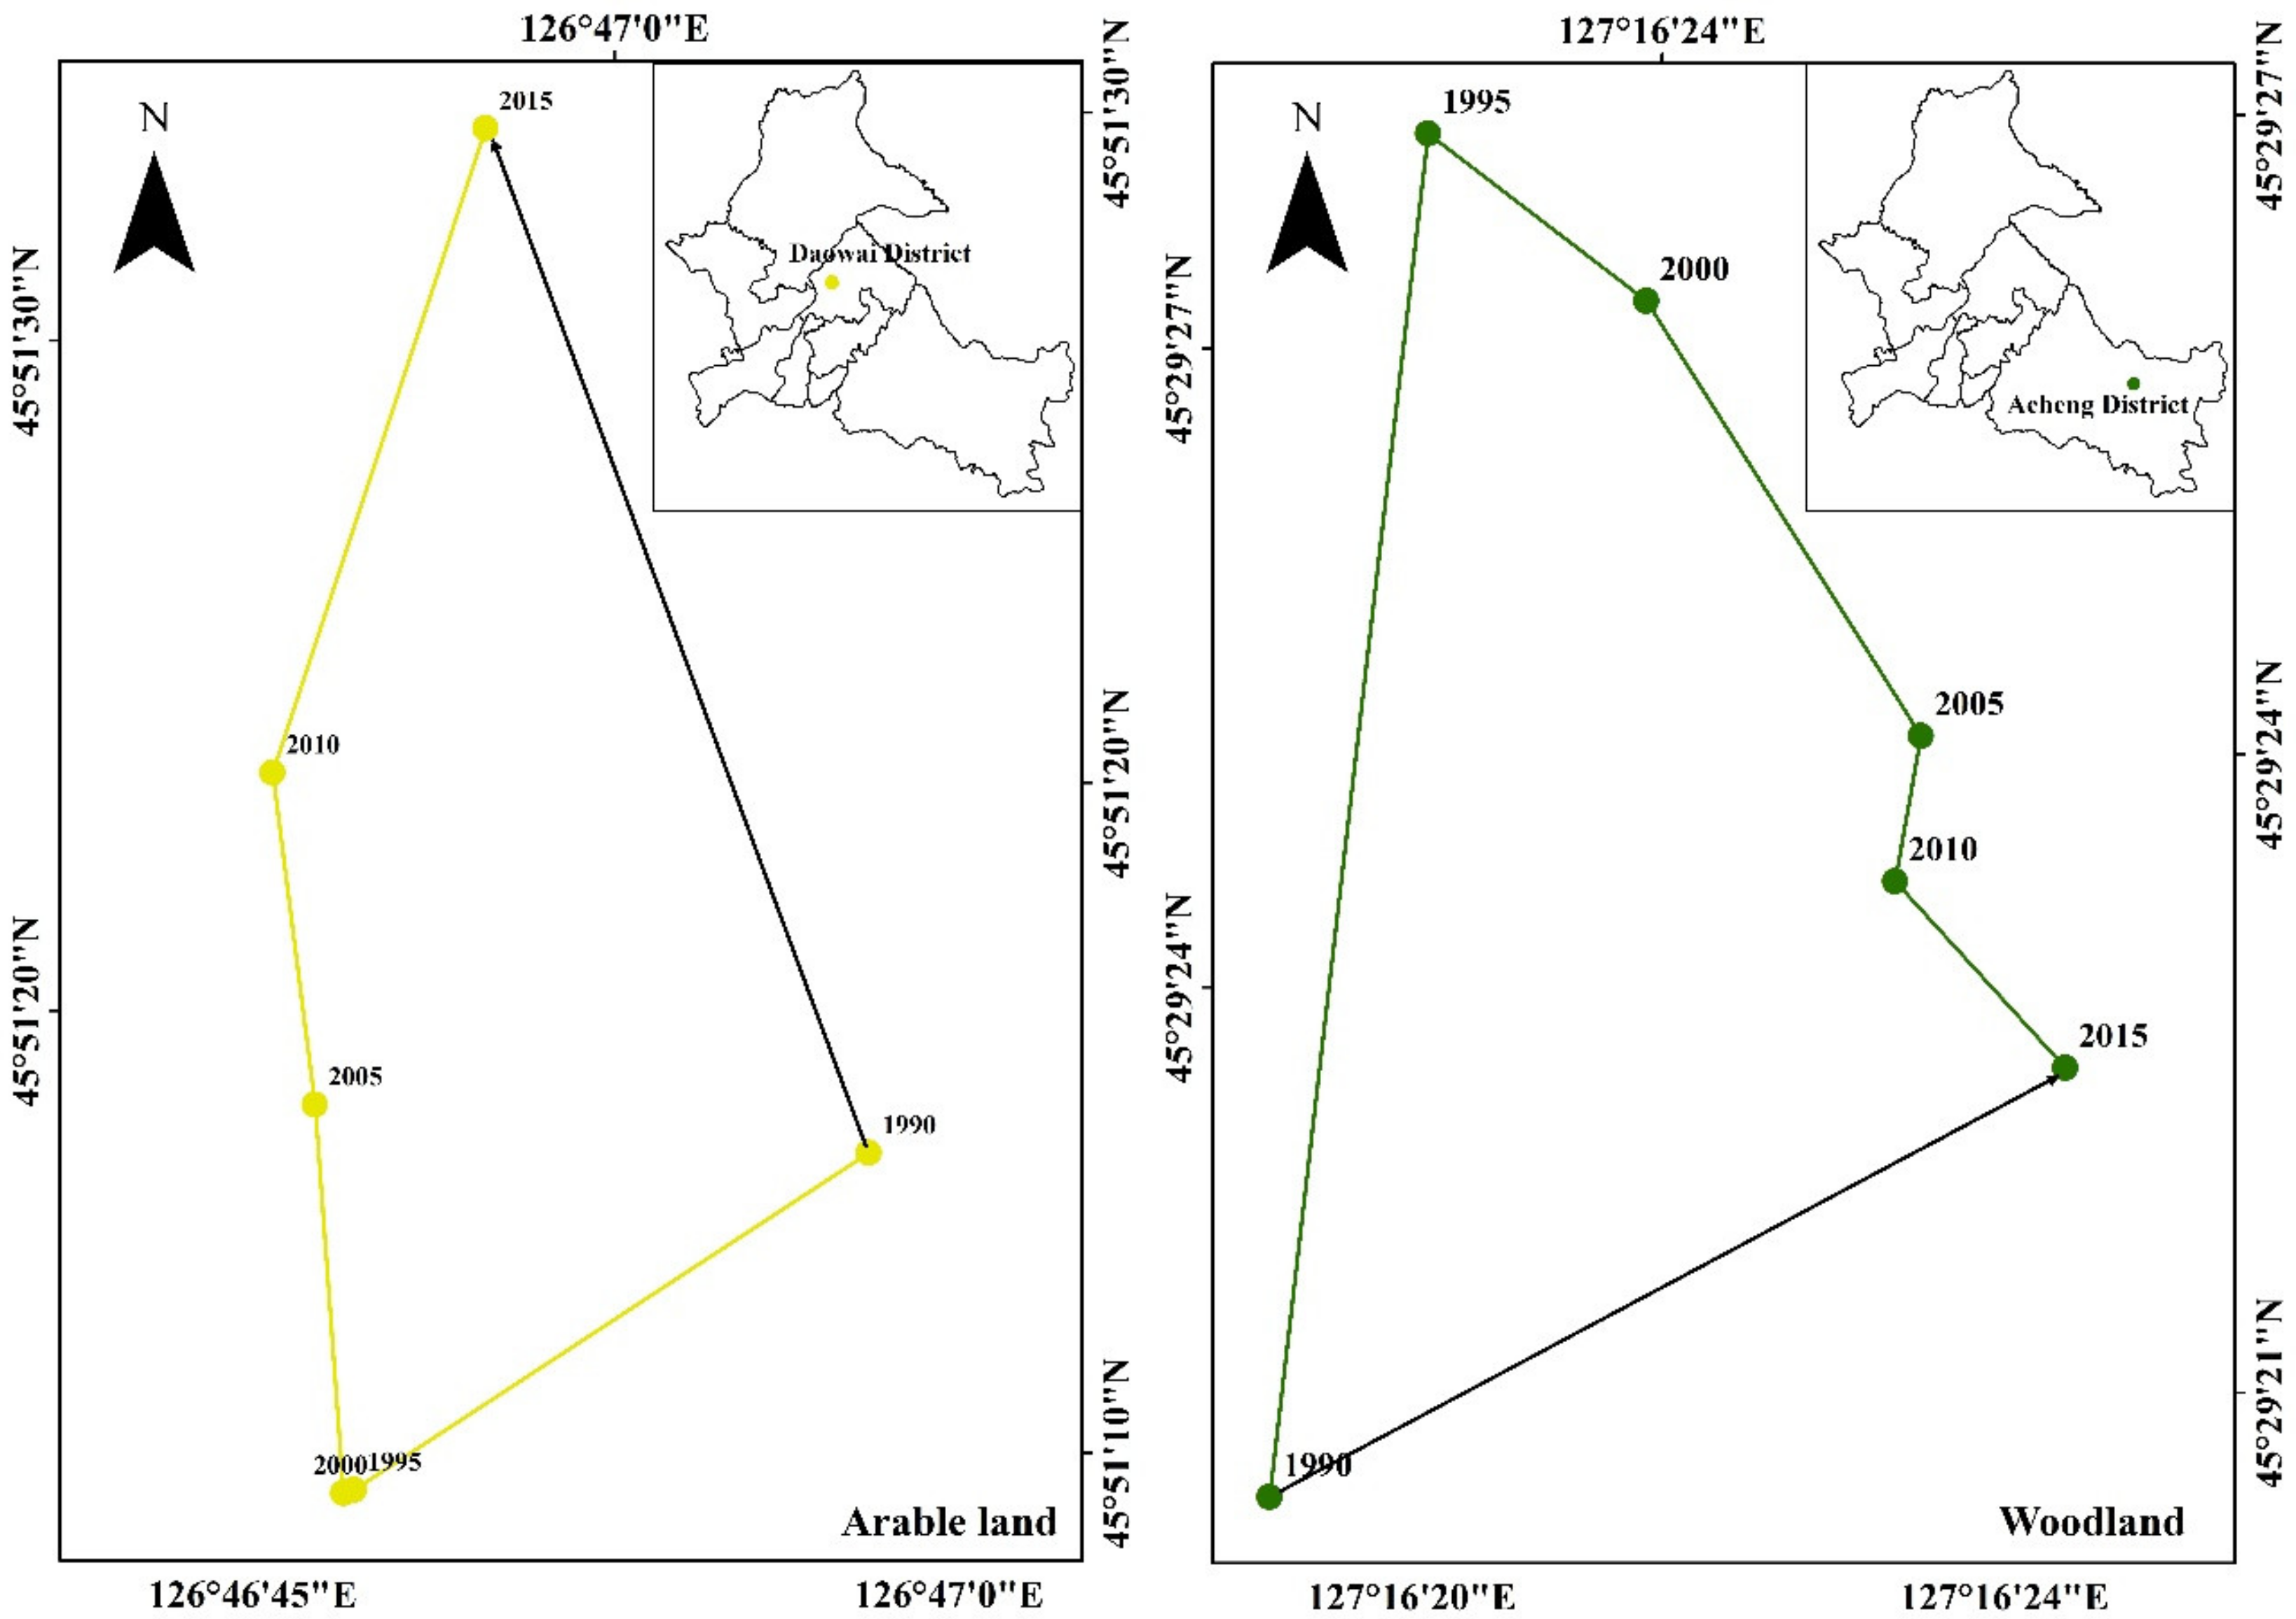
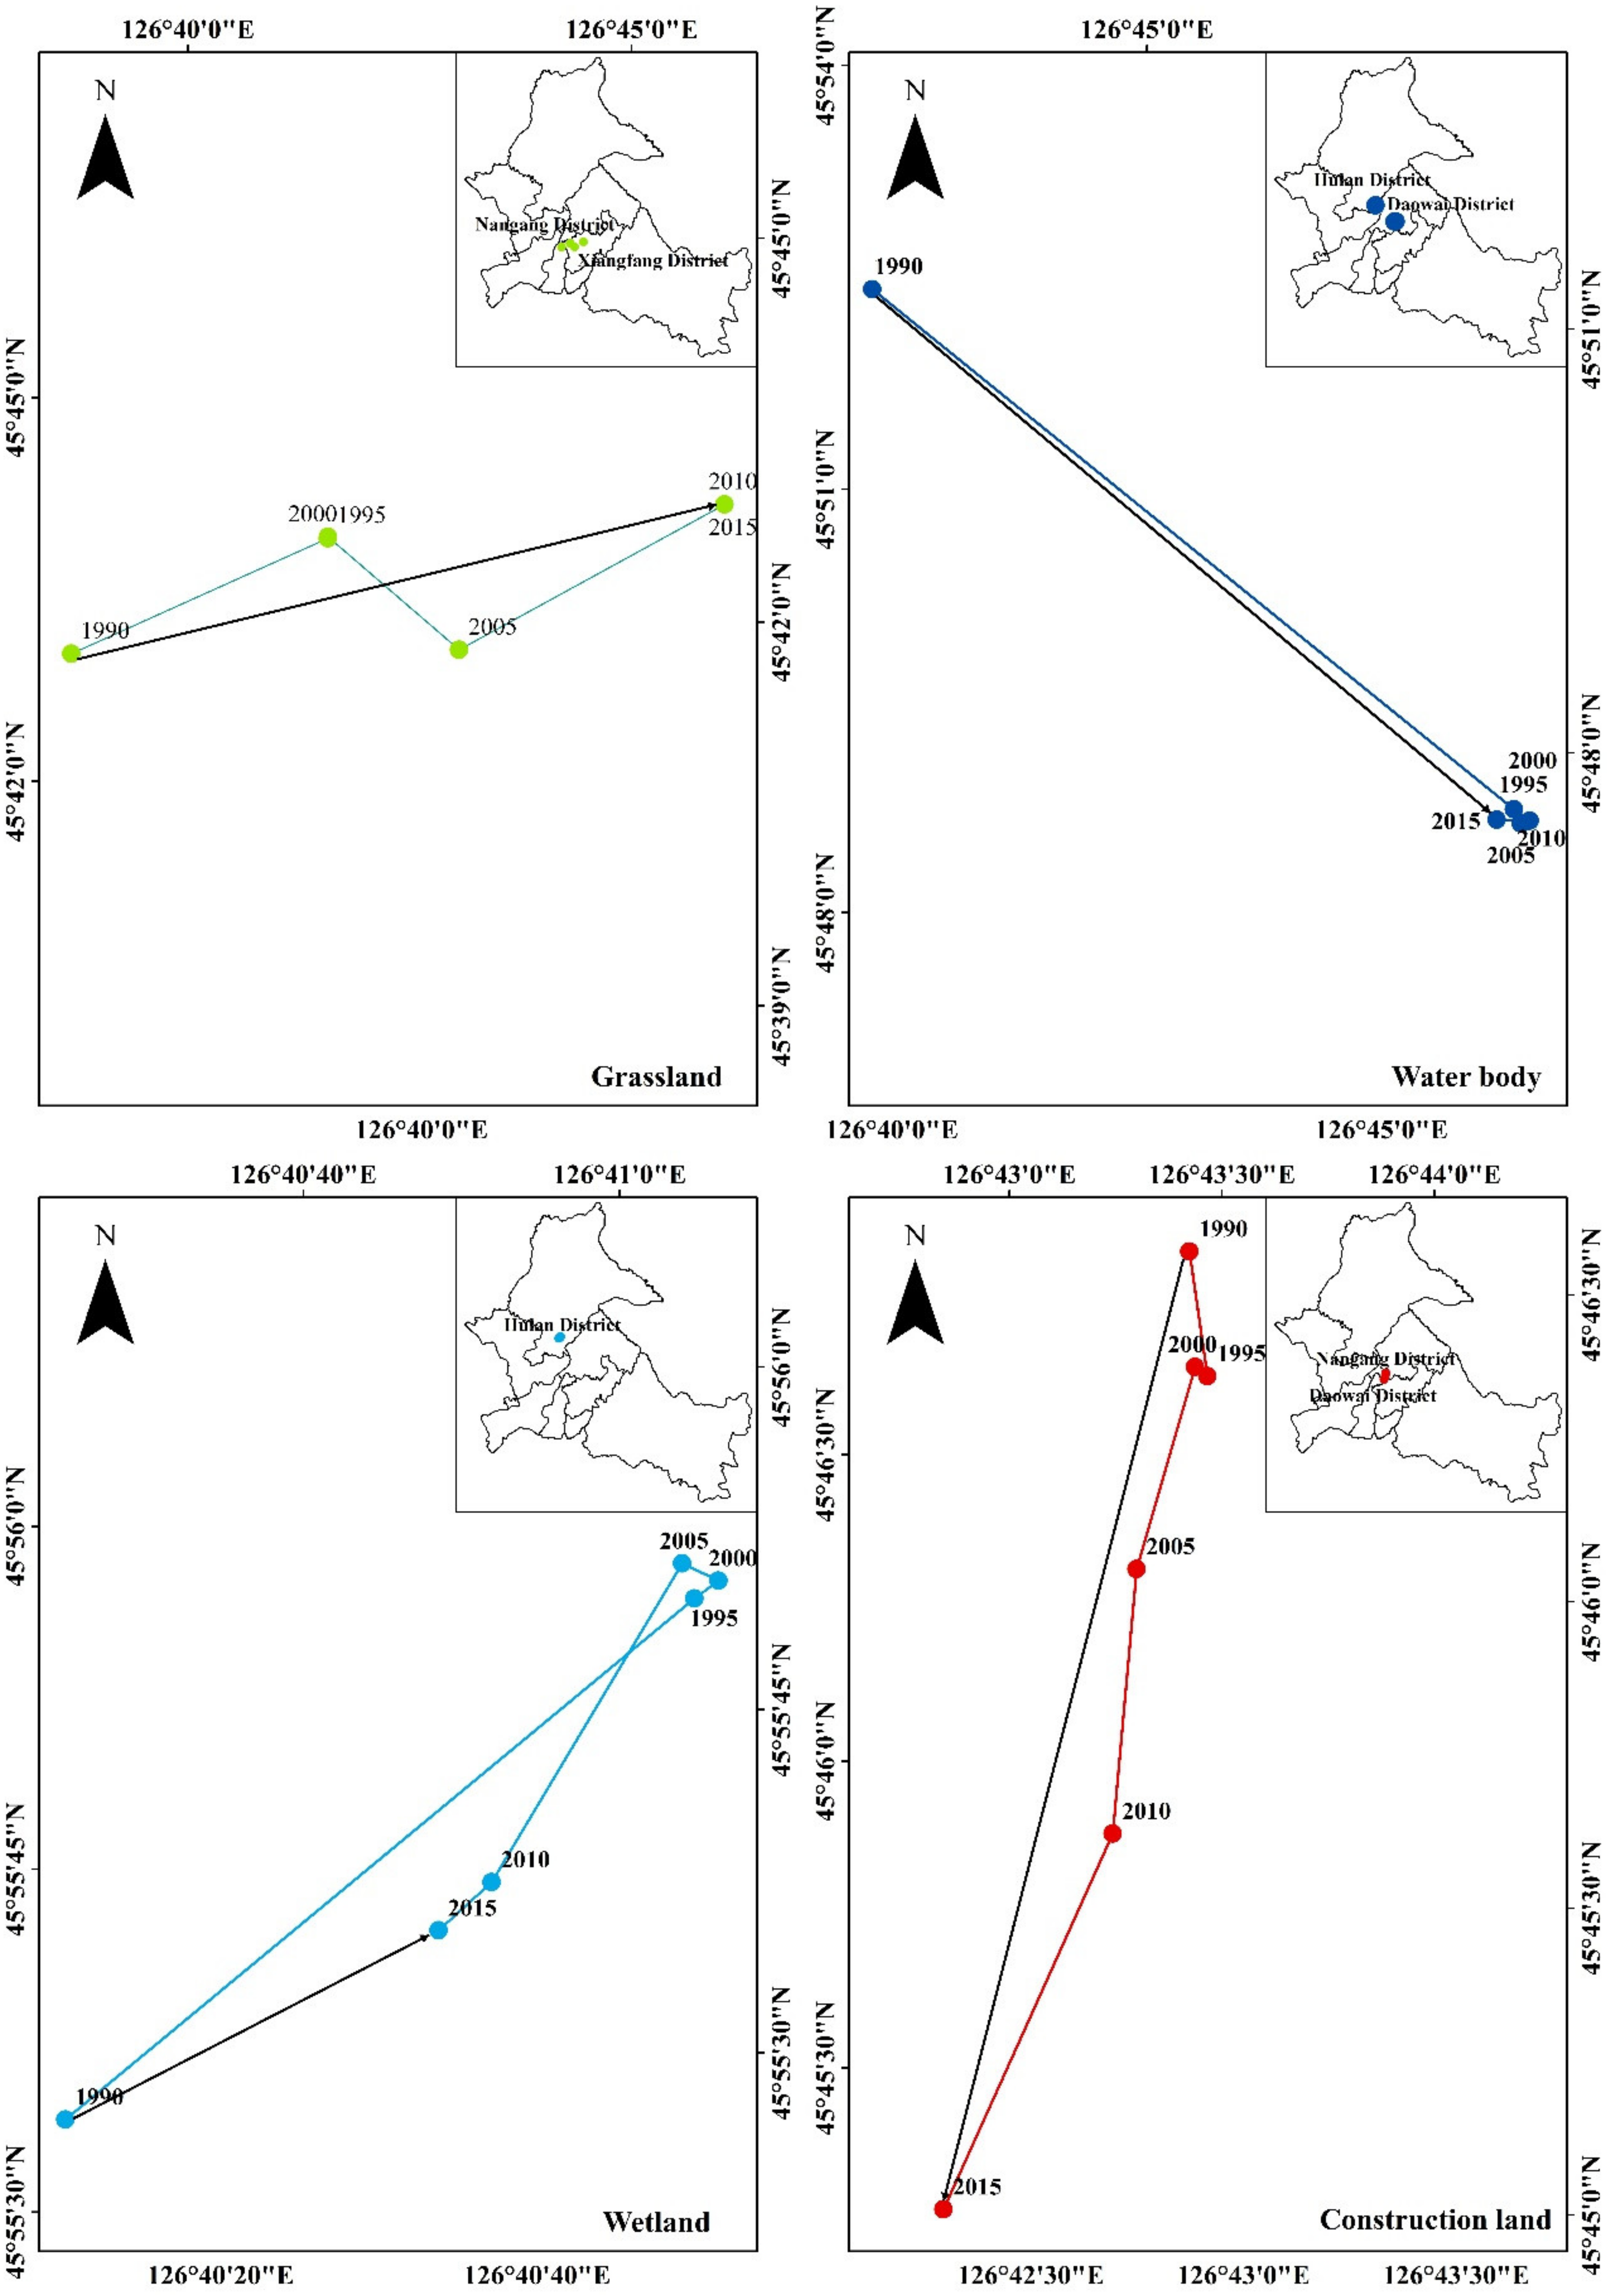
3.1.2. Change Characteristics of Spatial Pattern
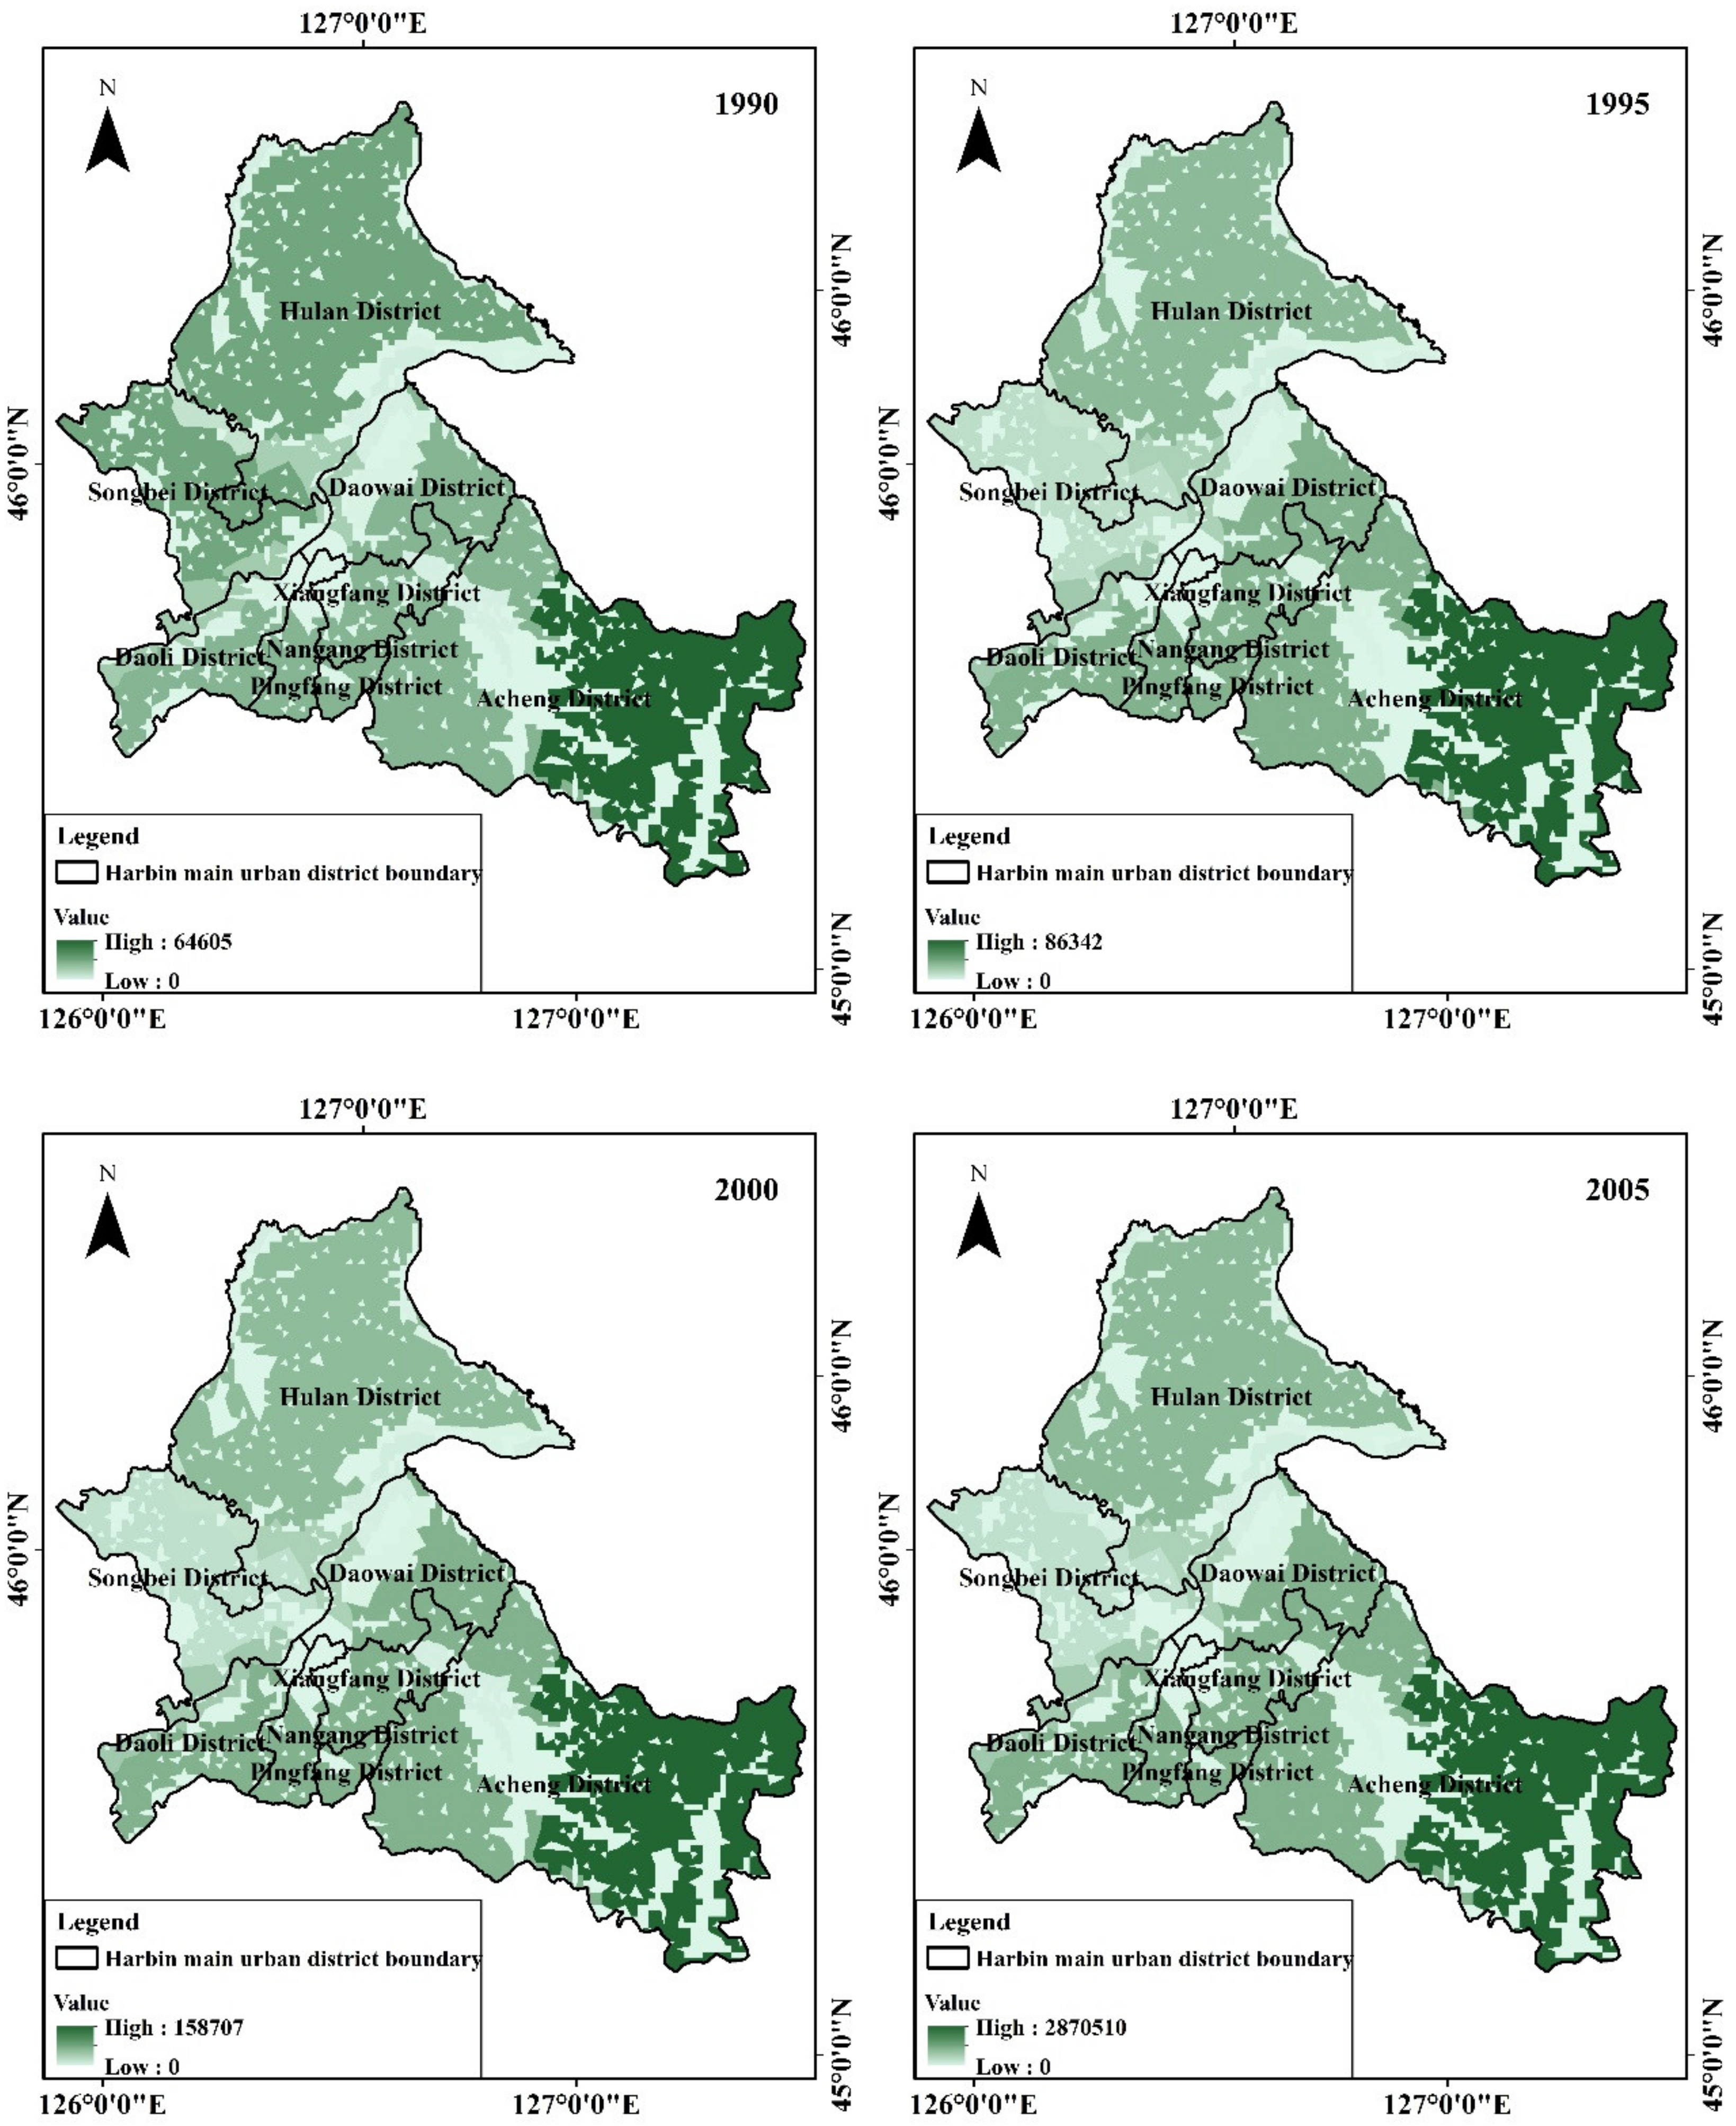
3.2. Ecosystem Service Value
3.3. Ecological Economic Harmony
4. Discussion
5. Conclusions
- (1)
- In the past 25 years, the absolute values of the seven types of dynamic degrees are not more than 1.5%. The highest dynamic degree was construction land. The barycenter of other types move, with the exception of bare land. The barycenter of total land use/cover change in the study area moved 2750 m to the southeast of the study area. Among them, the moving distances of water body, construction land, and grassland are the longest. The degree of movement of the overall change is the same as that of the change characteristics of quantitative structural of land use/cover changes.
- (2)
- The self- adjacency probability of arable land and woodland is as high as 98% in the spatial adjacency probability of land use/cover types, high self-stability. In the past 25 years, only the self- adjacency probability between water body and construction land has increased. Excluding water body, for conversion to cultivated land or construction land, the change index of each type is greater than the reverse index.
- (3)
- It is roughly predicted that future land use changes in the study area will mainly occur in three types: Construction land, arable land, and forest land. The expansion of construction land uses arable land as its main source. In order to maintain the output of arable land, woodland is the main source.
- (4)
- The value of ecosystem services, quantitatively, has changed little over 25 years. Spatially, it is skewed towards Acheng district. The quantitative and spatial trends are consistent with changes in land use/cover change attitudes and shifts in focus.
- (5)
- During the past 25 years, the total degree of eco-economic coordination has been in a potential crisis zone. From the potential crisis zone in 1990–1995, it rose to a moderate degree of coordination, and dropped to a low degree of coordination after 2000.
Author Contributions
Funding
Acknowledgments
Conflicts of Interest
References
- Xie, H.; Liu, Z.; Wang, P.; Liu, G.; Lu, F. Exploring the mechanisms of ecological land change based on the spatial autoregressive model: A case study of the Poyang Lake Eco-Economic Zone, China. Int. J. Environ. Res. Public Health 2013, 11, 583–599. [Google Scholar] [CrossRef]
- Foley, J.A.; Defries, R.; Asner, G.P.; Barford, C.; Bonan, G.; Carpenter, S.R.; Chapin, F.S.; Coe, M.T.; Daily, G.C.; Gibbs, H.K.; et al. Global consequences of land use. Science 2005, 309, 570–574. [Google Scholar] [CrossRef] [PubMed]
- Zhang, H.; Zhai, C.; Zhang, X. Forecasting water resources demand based on complex system dynamics: A case study of Tianjin City. In Proceedings of the 2008 International Seminar on Future BioMedical Information Engineering, Hong Kong, 18 December 2008; pp. 415–417. [Google Scholar]
- Qiu, L.; Pan, Y.; Zhu, J.; Amable, G.S.; Xu, B. Integrated analysis of urbanization-triggered land use change trajectory and implications for ecological land management: A case study in Fuyang, China. Sci. Total Environ. 2019, 660, 209–217. [Google Scholar] [CrossRef] [PubMed]
- Zhang, Q.; Gao, M.; Yang, L. Changes in the spatial structure of ecological land and ecosystem service values in nine key districts of Chongqing City over the past 25 years. Acta Ecol. Sin. 2017, 37, 566–575. [Google Scholar]
- Yu, F.; Li, X.B.; Zhang, L.J.; Xu, W.H.; Fu, R.; Wang, H. Study of ecological land in China: Conception, classification, and spatial temporal pattern. Acta Ecol. Sin. 2015, 35, 4931–4943. [Google Scholar]
- Lambin, E.F.; Baulies, X.; Bockstael, N. Land-use and land-cover change: Implementation strategy. In IGBP Report No.48/IHDP Report No.10; IGBP: Stockholm, Sweden, 1999. [Google Scholar]
- IGBP Secretariat. GLP Science Plan and Implementation Strategy. In IGBP Report No. 53/IHDP Report No.19; IGBP: Stockholm, Sweden, 2005. [Google Scholar]
- Turner, B.N.; Lambin, E.F.; Reenberg, A. The emergence of land change science for global environmental change and sustainability. Proc. Natl. Acad. Sci. USA 2007, 104, 20666–20671. [Google Scholar] [CrossRef] [PubMed]
- Mooney, H.A.; Duraiappah, A.; Larigauderie, A. Evolution of natural and social science interactions in global change research programs. Proc. Natl. Acad. Sci. USA 2013, 110, 3665–3672. [Google Scholar] [CrossRef]
- Sterling, S.M.; Ducharne, A.; Polcher, J. The impact of global land-cover change on the terrestrial water cycle. Nat. Clim. Chang. 2013, 3, 385–390. [Google Scholar] [CrossRef]
- Tong, S.; Dong, Z.; Zhang, J.; Bao, Y.; Guna, A.; Bao, Y. Spatiotemporal variations of land use/cover changes in Inner Mongolia (China) during 1980–2015. Sustainability 2018, 10, 4730. [Google Scholar] [CrossRef]
- Zhou, T.; Li, T.H. Influence of land use/cover changes on ecosystem services in Shaanxi Province before and after returning farmland to forest/grass. Res. Soil Water Conserv. 2014, 21, 246–250. [Google Scholar]
- Cao, K.Y. Research on the Paths of the Redevelopment of Low-Efficiently Used Land under the Background of New Urbanization, by the Example of Xiaoshan District of Hangzhou. Master’s Thesis, Northwest University, Xian, China, 2016. [Google Scholar]
- Zhou, L. Research on classification standard and quality system of dynamic information of digital city spatial governance. In Proceedings of the Geospatial Information Technology and Digital Jiangsu Forum, Nanjing, China, 20 November 2001. [Google Scholar]
- Jia, M.Y. Transformed biological city—Malmo of Sweden. Urban Manag. Sci.Technol. 2018, 20, 84–85. [Google Scholar]
- Wan, J.; Qin, C.B.; Yu, L.; Lu, H.B. Ideas and suggestions on speeding up the establishment of “Three Lines and One List”. Environ. Prot. 2017, 45, 7–9. [Google Scholar]
- Meyfroidt, P.; Lambin, E.F.; Erb, K.H.; Hertel, T.W. Globalization of land use: Distant drivers of land change and geographic displacement of land use. Curr. Opin. Environ. Sustain. 2013, 5, 438–444. [Google Scholar] [CrossRef]
- Qiao, W.; Sheng, Y.; Fang, B.; Wang, Y. Land use change information mining in highly urbanized area based on transfer matrix: A case study of Suzhou, Jiangsu Province. Geogr. Res. 2013, 32, 1497–1507. [Google Scholar]
- Pontius, R.G.; Boersma, W.; Castella, J.C.; Clarke, K.; Nijs, T.D.; Dietzel, C. Comparing the input, output, and validation maps for several models of land change. Ann. Reg. Sci. 2008, 42, 11–37. [Google Scholar] [CrossRef]
- Krajewski, P.; Solecka, I.; Mastalska-Cetera, B. Landscape change index as a tool for spatial analysis. J. IOP Mater. Sci. Eng. 2017, 245, 072014. [Google Scholar] [CrossRef]
- Zhu, X.M. The Spatiotemporal Change and Scenario Simulation of Ecological Land Pattern in Harbin Based on CLUE-S Model. Master’s Thesis, Northeast Normal University, Changchun, China, 2019. [Google Scholar]
- The State Council Approved Harbin City Master Plan (2011-2020). Urban Plan. Newsrep. 2011, 11, 2–3.
- Forkuor, G.; Cofie, O. Dynamics of land-use and land-cover change in Freetown, Sierra Leone and its effects on urban and peri-urban agriculture—A Remote Sensing Approach. Int. J. Remote Sens. 2011, 32, 1017–1037. [Google Scholar] [CrossRef]
- Zhang, L.; Yang, G.F.; Liu, J.P. The Dynamic Changes and Hot Spots of Land Use in Fushun City from 1986 to 2012. Sci. Geogr. Sin. 2014, 34, 185–191. [Google Scholar]
- Wang, X.L.; Bao, Y.H. Study on the methods of land use dynamic change research. Prog. Geogr. 1999, 018, 3–5. [Google Scholar]
- Zhu, H.Y.; Li, X.B. Discussion on the index method of regional land use change. Acta Geogr. Sin. 2003, 58, 643–650. [Google Scholar]
- Narisu. Spatio-Temproal Variation Characteristics of Desertification in Hulunbeier Sandy Land. Master’s Thesis, Inner Mongolia Normal University, Hohhot, China, 2017. [Google Scholar]
- Gao, Z.Q.; Liu, J.Y.; Zhuang, D.F. The dynamic changes of the gravity center of the farmland area and the quality of the farmland area ecological background in China. J. Nat. Resour. 1998, 13, 3–5. [Google Scholar]
- Tang, K.J.; Zheng, X.Q.; Yan, H.W.; Dong, J.W. Construction and application of modeling tendency of land type transition based on spatial adjacency. Acta Ecol. Sin. 2009, 29, 337–343. [Google Scholar]
- Bai, G.C. Study on the Prediction of Land Use Change Trend in Dongpo District in Meishan City. Master’s Thesis, Sichuan Agricultural University, Ya’an, China, 2009. [Google Scholar]
- Zeng, C.Y.; Liu, Z.B.; Zeng, G.Y.; Cheng, L.H.; Liao, Y.; Li, B. Analysis on forestland change by using spatial transition matrix model. For. Resour. Manag. 2012, 105–110. [Google Scholar] [CrossRef]
- Zhao, G.S.; Liu, J.Y.; Kuang, W.H.; Ouyang, Z.Y.; Xie, Z.L. Disturbance impacts of land use change on biodiversity conservation priority areas across China: 1990–2010. J. Geogr. Sci. 2015, 25, 515–529. [Google Scholar] [CrossRef]
- Costanza, R.; D’Arge, R.; De Groot, R.; Farber, S.; Grasso, M.; Hannon, B.; Limburg, K.; Naeem, S.; O’neill, R.V.; Paruelo, J. The value of the world’s ecosystem services and natural capital. Nature 1997, 387, 253–260. [Google Scholar] [CrossRef]
- Xie, G.D.; Zhen, L.; Lu, C.X.; Xiao, Y.; Chen, C. Expert Knowledge Based Valuation Method of Ecosystem Services in China. J. Nat. Resour. 2008, 23, 911–919. [Google Scholar]
- Radford, K.G.; James, P. Changes in the value of ecosystem services along a rural–urban gradient: A case study of Greater Manchester, UK. Landsc. Urban Plan. 2013, 109, 117–127. [Google Scholar] [CrossRef]
- Zang, Z.; Zou, X.; Zuo, P.; Song, Q.; Wang, C.; Wang, J. Impact of landscape patterns on ecological vulnerability and ecosystem service values: An empirical analysis of Yancheng Nature Reserve in China. Ecol. Indic. 2017, 72, 142–152. [Google Scholar] [CrossRef]
- Zhao, Y.; Wang, S.; Zhou, C. Understanding the relation between urbanization and the eco-environment in China’s Yangtze River Delta using an improved EKC model and coupling analysis. Sci. Total Environ. 2016, 571, 862–875. [Google Scholar] [CrossRef] [PubMed]
- Wang, Z.B.; Fang, C.L.; Cheng, S.W.; Wang, J. Evolution of coordination degree of eco-economic system and early-warning in the Yangtze River Delta. J. Geogr. Sci. 2013, 23, 147–162. [Google Scholar] [CrossRef]
- Wei, X.X.; Zhan, J.; Wei, W.; Xie, B.B. Coordinated development of ecological-economic system and spatial evolution based on county unit in China. Prog. Geogr. 2014, 33, 1535–1545. [Google Scholar]
- Su, F.; Zhang, P.Y. Assessment of coordinative development between economy and environment based on ecosystem service values change: A case of Daqing city. Prog. Geogr. 2009, 28, 471–477. [Google Scholar]
- He, H.H.; Li, X.; Dong, F.; Ren, Y.N. Evaluation on Coordination Degree of Eco-economic System in Anhui Province. Econ. Forum 2016, 28–32. [Google Scholar] [CrossRef]
- Xie, A.L. An Analysis of Harbin’s Planning and Development Strategy of “North Jump, South Extension, Central Prosperity and Strong County”. China Sci. Technol. Panor. Mag. 2011, 52. [Google Scholar] [CrossRef]
- Interpretation 1 of “Implementation Opinions on Financial Support for Tourism Development in Harbin City”. Available online: http://www.harbin.gov.cn/art/2012/9/28/art_727_29748.html (accessed on 16 December 2019).
- “North Jump, South Extension, Central Prosperity and Strong County” Strategy to Promote Harbin’s Strong Development. Available online: http://news.ifeng.com/c/7fckPKTOqR5 (accessed on 16 December 2019).
- Du, G.Q.; Li, H.Y.; Li, H.; Chen, Y.J.; Jang, X.Y. Study on resilience evaluation of flood disaster urban system in Harbin. Shanxi Archit. 2019, 45, 251–253. [Google Scholar]
- Zhang, J.G.; Wang, Y.B.; Wei, F.Y. Cause analysis of flood disaster in Harbin city and discussion on flood control countermeasures. Heilongjiang Sci. Technol. Water Conserv. 2008, 36, 20–21. [Google Scholar]
- Xin, R. Simulation of land use change patterns in Harbin area based on CLUE-S model and its prospects. Agric. Outlook 2019, 15, 71–76. [Google Scholar]
- Wang, S.B.; Pan, T.; Lei, G.P. Land use pattern and NDVI response characteristics based on Landsat TM in Harbin city. Jiangsu Agric. Sci. 2019, 47, 221–225. [Google Scholar]
- Liu, M. Research on the Change of the Land Use for Urban-Rural Construction in Harbin Based on Remote Sensing. Master’s Thesis, Northeast Agricultural University, Harbin, China, 2018. [Google Scholar]
- Li, Z.M. Study on Temporal and Spatial Characteristics of Land Use Change in Harbin. Master’s Thesis, Northeast Agricultural University, Harbin, China, 2018. [Google Scholar]
- Liu, H.Y. Research on urban land security in China’s urbanization process. Ph.D. Thesis, Institute of Geographic Sciences and Natural Resources Research, Beijing, China, 2008. [Google Scholar]
- Gai, Z.X.; Sun, P.; Zhang, J.Q. Land Use Change and Formation Mechanism in Songhuajiang Basin—Harbin Section as an Example. Res. Soil Water Conserv. 2019, 26, 314–320. [Google Scholar]


| Primary Classification | Secondary Classification | Include |
|---|---|---|
| Ecological land | Arable land | Paddy field, Dry farmland |
| Woodland | Forest land, Shrub land, Sparse woodland, Other woodland | |
| Grassland | High-coverage grassland, Medium-coverage grassland, Low-coverage grassland | |
| Water body | Ditch, Lake, Reservoir pit, Permanent Glacial Snow fields | |
| Wetland | Intertidal zone, Shoal, Marshland | |
| Non-ecological land | Construction land | Urban land, Rural settlements, Other construction land |
| Bare land | Sand land, Gobi, Saline-alkali land, Bare land, Bare rock land, Other land |
| Primary Type | Secondary Type | Arable Land | Wood-Land | Grass-Land | Water Body | Wet-Land | Construction Land | Bare Land |
|---|---|---|---|---|---|---|---|---|
| Supply service | Food production | 1 | 0.33 | 0.43 | 0.53 | 0.36 | 0 | 0.02 |
| Raw material production | 0.39 | 2.98 | 0.36 | 0.35 | 0.24 | 0 | 0.04 | |
| Mediation service | Gas regulation | 0.72 | 4.32 | 1.5 | 0.51 | 2.41 | 0 | 0.06 |
| Climate regulation | 0.97 | 4.07 | 1.56 | 2.06 | 13.55 | 0 | 0.12 | |
| Hydrological regulation | 0.77 | 4.09 | 1.52 | 18.77 | 13.44 | 0 | 0.07 | |
| Waste disposal | 1.39 | 1.72 | 1.32 | 14.85 | 14.4 | 0.25 | 0.26 | |
| Support services | Maintain soil | 1.47 | 4.02 | 2.24 | 0.41 | 1.99 | 0 | 0.17 |
| Maintain biodiversity | 1.02 | 4.51 | 1.87 | 3.43 | 3.69 | 0.4 | 0.4 | |
| Cultural services | Provide aesthetic landscape | 0.17 | 2.08 | 0.87 | 4.44 | 4.69 | 0.24 | 0.24 |
| Total | 7.9 | 28.12 | 11.67 | 45.35 | 54.77 | 0.89 | 1.38 | |
| Type of LUCC | 1990–1995 | 1995–2000 | 2000–2005 | 2005–2010 | 2010–2015 | 1990–2015 | |
|---|---|---|---|---|---|---|---|
| Arable land | 0.21% | −0.006% | −0.14% | −0.05% | −0.24% | −0.04% | −0.07% |
| Wood-land | −0.29% | −0.002% | 0.02% | −0.01% | −0.01% | −0.06% | |
| Grass-land | −5.44% | 0.01% | 1.07% | −0.93% | 0 | −1.07% | |
| Water body | 2.14% | 0 | −0.08% | −0.08% | 0.54% | 0.51% | |
| Wet-land | −0.89% | 0.05% | 0.06% | −0.27% | −0.16% | −0.24% | |
| Construction land | 0.59% | 0.01% | 1.19% | 0.97% | 2.31% | 1.11% | 1.10% |
| Bare land | 0 | 0 | 0 | 0 | 0 | 0 | |
| Total change | 0.40% | 0.01% | 0.19% | 0.13% | 0.34% | 0.73% | |
| Type of LUCC | Arable Land | Wood-Land | Grass-Land | Water Body | Wet-Land | Construction Land | Bare Land |
|---|---|---|---|---|---|---|---|
| Arable land | 98.32% | 0.52% | 0.12% | 0.03% | 0.23% | 0.78% | 0.004% |
| Woodland | 1.83% | 98.17% | 0.17% | 0.07% | 0.14% | 0.14% | 0.01% |
| Grassland | 6.10% | 2.39% | 90.69% | 0.11% | 0.19% | 0.52% | 0 |
| Water body | 1.50% | 1.13% | 0.12% | 91.09% | 5.49% | 0.66% | 0 |
| Wetland | 1.86% | 0.33% | 0.03% | 0.80% | 96.79% | 0.19% | 0 |
| Construction land | 8.27% | 0.42% | 0.11% | 0.13% | 0.26% | 90.82% | 0 |
| Bare land | 6.95% | 4.46% | 0 | 0 | 0 | 0 | 88.59% |
| Type of LUCC | Arable Land | Wood-Land | Grass-Land | Water Body | Wet-Land | Construction Land | Bare Land |
|---|---|---|---|---|---|---|---|
| Coefficient | −0.20 | 0.18 | −0.08 | 0.60 | −0.17 | 0.84 | 1.00 |
| 1990–1995 | 1995–2000 | 2000–2005 | 2005–2010 | 2010–2015 | 1990–2015 | |
|---|---|---|---|---|---|---|
| EEH type | Potential crisis zone | Moderate coordination zone | Low coordination zone | Low coordination zone | Low coordination zone | Potential crisis zone |
© 2020 by the authors. Licensee MDPI, Basel, Switzerland. This article is an open access article distributed under the terms and conditions of the Creative Commons Attribution (CC BY) license (http://creativecommons.org/licenses/by/4.0/).
Share and Cite
Riao, D.; Zhu, X.; Tong, Z.; Zhang, J.; Wang, A. Study on Land Use/Cover Change and Ecosystem Services in Harbin, China. Sustainability 2020, 12, 6076. https://doi.org/10.3390/su12156076
Riao D, Zhu X, Tong Z, Zhang J, Wang A. Study on Land Use/Cover Change and Ecosystem Services in Harbin, China. Sustainability. 2020; 12(15):6076. https://doi.org/10.3390/su12156076
Chicago/Turabian StyleRiao, Dao, Xiaomeng Zhu, Zhijun Tong, Jiquan Zhang, and Aoyang Wang. 2020. "Study on Land Use/Cover Change and Ecosystem Services in Harbin, China" Sustainability 12, no. 15: 6076. https://doi.org/10.3390/su12156076
APA StyleRiao, D., Zhu, X., Tong, Z., Zhang, J., & Wang, A. (2020). Study on Land Use/Cover Change and Ecosystem Services in Harbin, China. Sustainability, 12(15), 6076. https://doi.org/10.3390/su12156076