Article

Impacts of Rapid Changes of Land Cover and Intensive Human Activities on Avarga Toson Lake Area, Mongolia

by
Urtnasan Mandakh
1,2,
Danzanchadav Ganbat
2,3,
Bayartungalag Batsaikhan
2,
Sainbayar Dalantai
2,
Zolzaya Adiya
2,4,
Natsagsuren Bayasgalan
2,
Sainbuyan Bayarsaikhan
2,
Almaz Borjigidai
5,* and
Chunlin Long
1,*
1
College of Life and Environmental Sciences, Minzu University of China, Beijing 100081, China
2
Institute of Geography and Geoecology, Mongolian Academy of Sciences, Ulaanbaatar 15170, Mongolia
3
College of Geographical Science, Inner Mongolia Normal University, Hohhot 010022, China
4
Department of Geography, School of Arts and Sciences, National University of Mongolia, Ulaanbaatar 14201, Mongolia
5
School of Pharmacy, Minzu University of China, Beijing 100081, China
*
Authors to whom correspondence should be addressed.
Sustainability 2020, 12(15), 6070; https://doi.org/10.3390/su12156070
Submission received: 16 June 2020 / Revised: 24 July 2020 / Accepted: 25 July 2020 / Published: 28 July 2020

Abstract

:
Avarga Toson Lake and its surrounding area are very important for people, wildlife, and animals in Delgerkhaan Soum of Khentii Province in Eastern Mongolia. Some research has been conducted so as to explore the medical nature and characteristics of the lake and its surrounding area. However, the adverse effects of land use have neither been studied nor reported. The fact that the water catchment area is shrinking evidences clearly that findings of various real-time studies must be used effectively in the long-term by the local government and relevant authorities in order to take immediate remedial measures. Our study focused on land cover changes occurring as a result of human activities in the area, using a Landsat imageries and water indices approach to estimate the changes of land use and land cover. The aims of this study were to assess the land use and cover change that occurred between 1989 and 2018 and to define the impacting factors on the changes of water surface area in Avarga Toson Lake area, Mongolia. Findings revealed that the water surface area has decreased by 34.1% in the past 30 years. The lake water area had the weakest, positive correlation with temperature and precipitation. We did not find any indicators suggesting a relationship between lake area and climate variables. In contrast, the area was slightly correlated with socio-economic variables, such as Toson Lake area with the number of visitors (R2 = 0.89) and Burd Lake area the with number of livestocks (R2 = 0.75), respectively. Therefore, the main conclusion of this paper is that socioeconomic factors driven by land use change, policy, and institutional failure together with the existing pressure on the lake may amplify their effect of the water surface area decreasing. Additionally, even if policy adoption is relatively sufficient in the country, the public institutional capacity to implement a successful sustainable land management model regarding land access, land development, land resources protection, land market, and investments in infrastructure remains very limited.

1. Introduction

Earth’s land cover keeps transforming due to global climate change, intensive economic activities [1], rapid population growth, rising consumption, excessive service growth, and scarcity of natural resources, which, collectively, dramatically change the production and consumption patterns that are directly dependent on human activities [2]. Land cover exists in a systemic relationship with human uses of land. Both land use and land cover changes have been occurring on Mongolian plateau [1,3,4] for years. Exemplarily, these transformations and resulting consequences are observable in Delgerkhaan Soum of Khentii Province and lead to different land uses depending on the social context in which they operate.
Land use and land cover changes are the most important indicators of interaction between human activities and the natural environment [5,6,7]. Land use/cover changes directly influence water resources and agro-economic growth [8]. Land use/cover changes affect water resources mainly through vegetation interception, evapotranspiration, runoff, surface infiltration, soil moisture status, and so on, thereby affecting the process of watershed hydrology and water resource cycles [9]. Natural ecosystems are burdened by agricultural use, tourism development, and other activities. European scientists presented a study showing that current change trends [10] are dominated by changes in land use and land cover in two post-socialist countries: Hungary and Poland [11,12]. Numerous studies globally note the rapid changes of land use and land cover resulting from human activities [2,13], the dynamics and impacts of human activities [14], intensive land use [15,16], and loss of natural areas [10,17], and also to promote land use sustainability [18,19]. For EU members, land conservation and sustainable land use remain of primary importance to environmental policy and management [19,20]. Some European countries consider the property rights approach resulting from the Coasian theorem, as the focus has been on an interpretation of the Coasian theorem [21], which identifies an attempt at sustainable land management and land improvement syndicates [22], and clarifies property rights as the main roles of governments or local authorities.
Long-term information about lake ecosystems—especially human-induced advances—is rare, and such research is very valuable [23]. Over the course of time, shallow lakes have been suspected as being used for irritation resulting from changes in human activity, nutrient, sediment load, and hydrological changes [24].
Geographic information systems (GIS) and remote sensing (RS) are methods for analyzing long-term changes in wetlands caused by lake fluctuations or alterations [25,26,27]. Although multispectral remote sensing data have long been successfully used for land cover classifications [28,29], optical earth observation systems face the challenge of acquiring data with minimum cloud cover. The difficulty of obtaining suitable cloud-free imagery from optical systems has been demonstrated by many studies [30,31].
Lakes are necessary fresh water bodies and play an important role in the biogeochemical and hydrological cycles. Water surface area variations are controlled by water inputs (i.e., precipitation, surface inflow, groundwater inputs) and water outputs (i.e., evaporation, surface outflow, groundwater outputs) [3]. Furthermore, water inputs and outputs are affected by anthropogenic activities. Agriculture, industry, and other human activities mainly affect water surface areas of lakes via land use change [32,33].
Rich natural resources are a fundamental factor of land use and land cover change, and this has been tightly coupled to settlement and economic growth. As a result, control over land and its use is often an object of intense human interactions. In this study site, two different lakes coexist as Toson and Burd for the treatment of skin ailments and livestock water needs. Increasing treatment seekers at the resort results in a large visitor influx and livestock water demand exerts pressure on the lake’s water resources. Toson Lake is important for treating chronic skin diseases, as it has been used for a long time. Since 1977, the resort close to Toson Lake has been open for the patients all year around. There is a great deal of research on the nature of this lake. Unfortunately, focal studies on the lake changes and its effects have been very scarce.
Our study focused on the land cover changes occurring as a result of human activities in this area. The objectives of this study were to measure land cover/land use change over a 30-year period, to evaluate the environmental impact of these changes, and to define future trends of the use of land cover, land use, and ultimately identifying areas that are more susceptible to changes driven by human activities in wetlands. The aims of this paper were, therefore: (1) to examine the land use and cover change that occurred between 1989 and 2018; and (2) to assess the impacting factors on the changes of water surface area for Avarga Toson Lake area, Mongolia. In this paper, 30 years of data covering 1989–2018 for Toson Lake in Delgerkhaan Soum of Khentii Province will be calculated using the 5-year periods of Landsat satellite data with a normalized difference water index (NDWI) and a normalized difference vegetation index (NDVI) estimating the amount of lake area compared to annual precipitation and temperature data. An analysis will be made that links the factors influencing the changes and impacts of herders’ traditional heritage, such as tourism. Based on these results, suggestions will be proposed at the end.

2. Materials and Methods
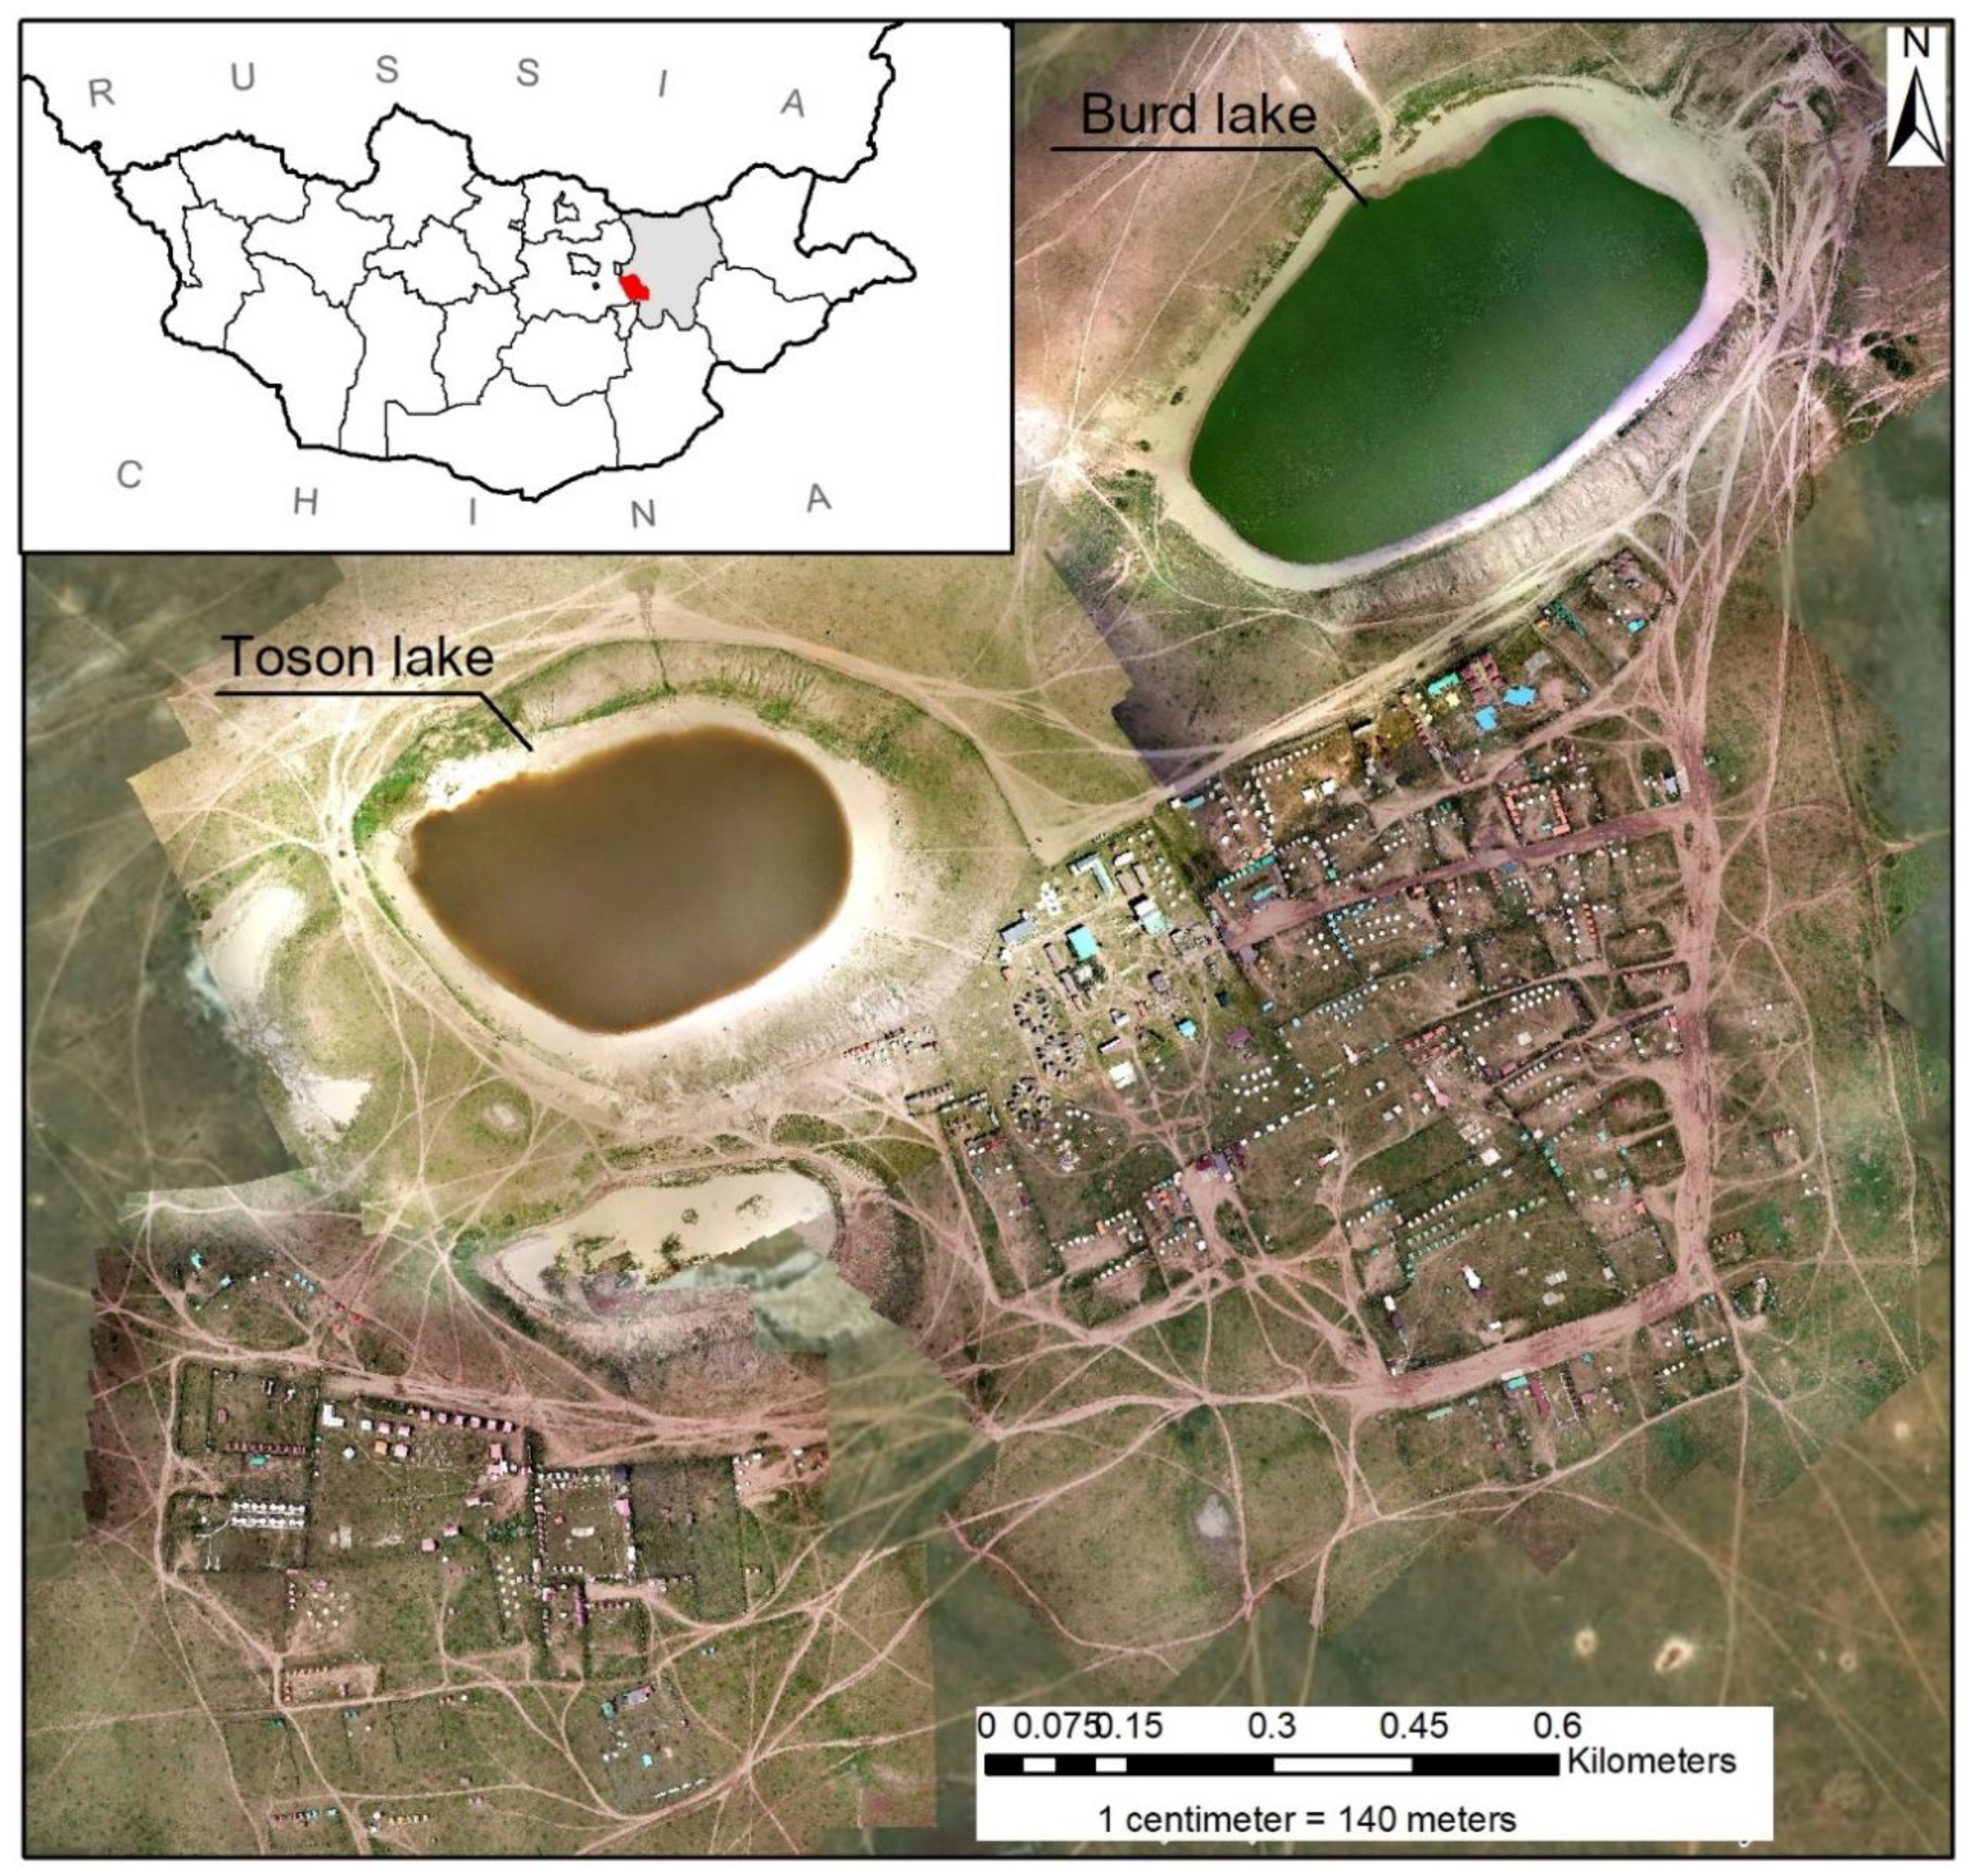
2.1. Study Area

The study site was Avarga Toson Lake area, located in Delgerkhaan Soum, Khentii Province, Mongolia (109°05′–109°13′ E and 47°09′–47°12′ N). There are two lakes in the near vicinity, together with a dry pond and the surrounding grasslands. The first one is a freshwater lake with fish, and the second one is a therapeutic lake with a beautiful sandy beach. The pond has nearly dried up (Figure 1). The area is considered as a highly important place for people, wildlife, and domestic animals, as they fetch water for survival. Specifically, it is the most important place for people collecting sediments from Toson Lake for the treatment of skin diseases, which has lasted for centuries. The core area has been fenced off to keep livestock and campers out. Its water and mud are reputed to have medicinal properties and are regarded as a rare resource in Eastern Mongolia. Locals bathe, stroll, and jog around the lake. The Avarga Toson Lake area is composed of two sites: Toson Lake and Burd Lake with Avarga springs and grasslands and built-up surroundings. The elevation is 1300 m above sea level. Toson Lake stretches 300 m long and 250 m wide. Water comes from an underground source that is rich in minerals: notably, carbonate. Mud on the banks of the lake has the same composition as the mineral water of the lake. The whole area is renowned for its therapeutic values—notably, for dermatological and cardiovascular diseases. The main chemical composition of the lakes is hydro carbonate sodium alkaline and light-colored water. The lake is rich in sulfuric hydrochloric acid, with 23.03 g/L of black sulfate chloride hydro carbonate [34]. The radiation of the lake is 90–100 X-ray, with an average water temperature of 20–21 °C in June, 19–20 °C in July, 18–19 °C in August at 14–15 °C. The water temperature decreases from mid-August [35].
In 1977, the Center for Dermatology began organizing a seasonal home for treating people with chronic diseases, such as neurodermatitis and flat red, and established a 30-bed resort in the Avarga Toson [36]. From 2005, there was an increase to 205 business entities, resorts, and sanatoriums providing services to those who come to the lake, and this growth continued until 2018. Burd Lake originates from the Avarga River and Head Burd, adjacent to Toson Lake, which is a source of water for animals [37]. The impacts of tourism development and territorial diversity on the areas covered by the survey and the impacts of tourism on rural populations are shown in the examples of Avarga Toson spa resort in Delgerkhaan Soum of Khentii Province.

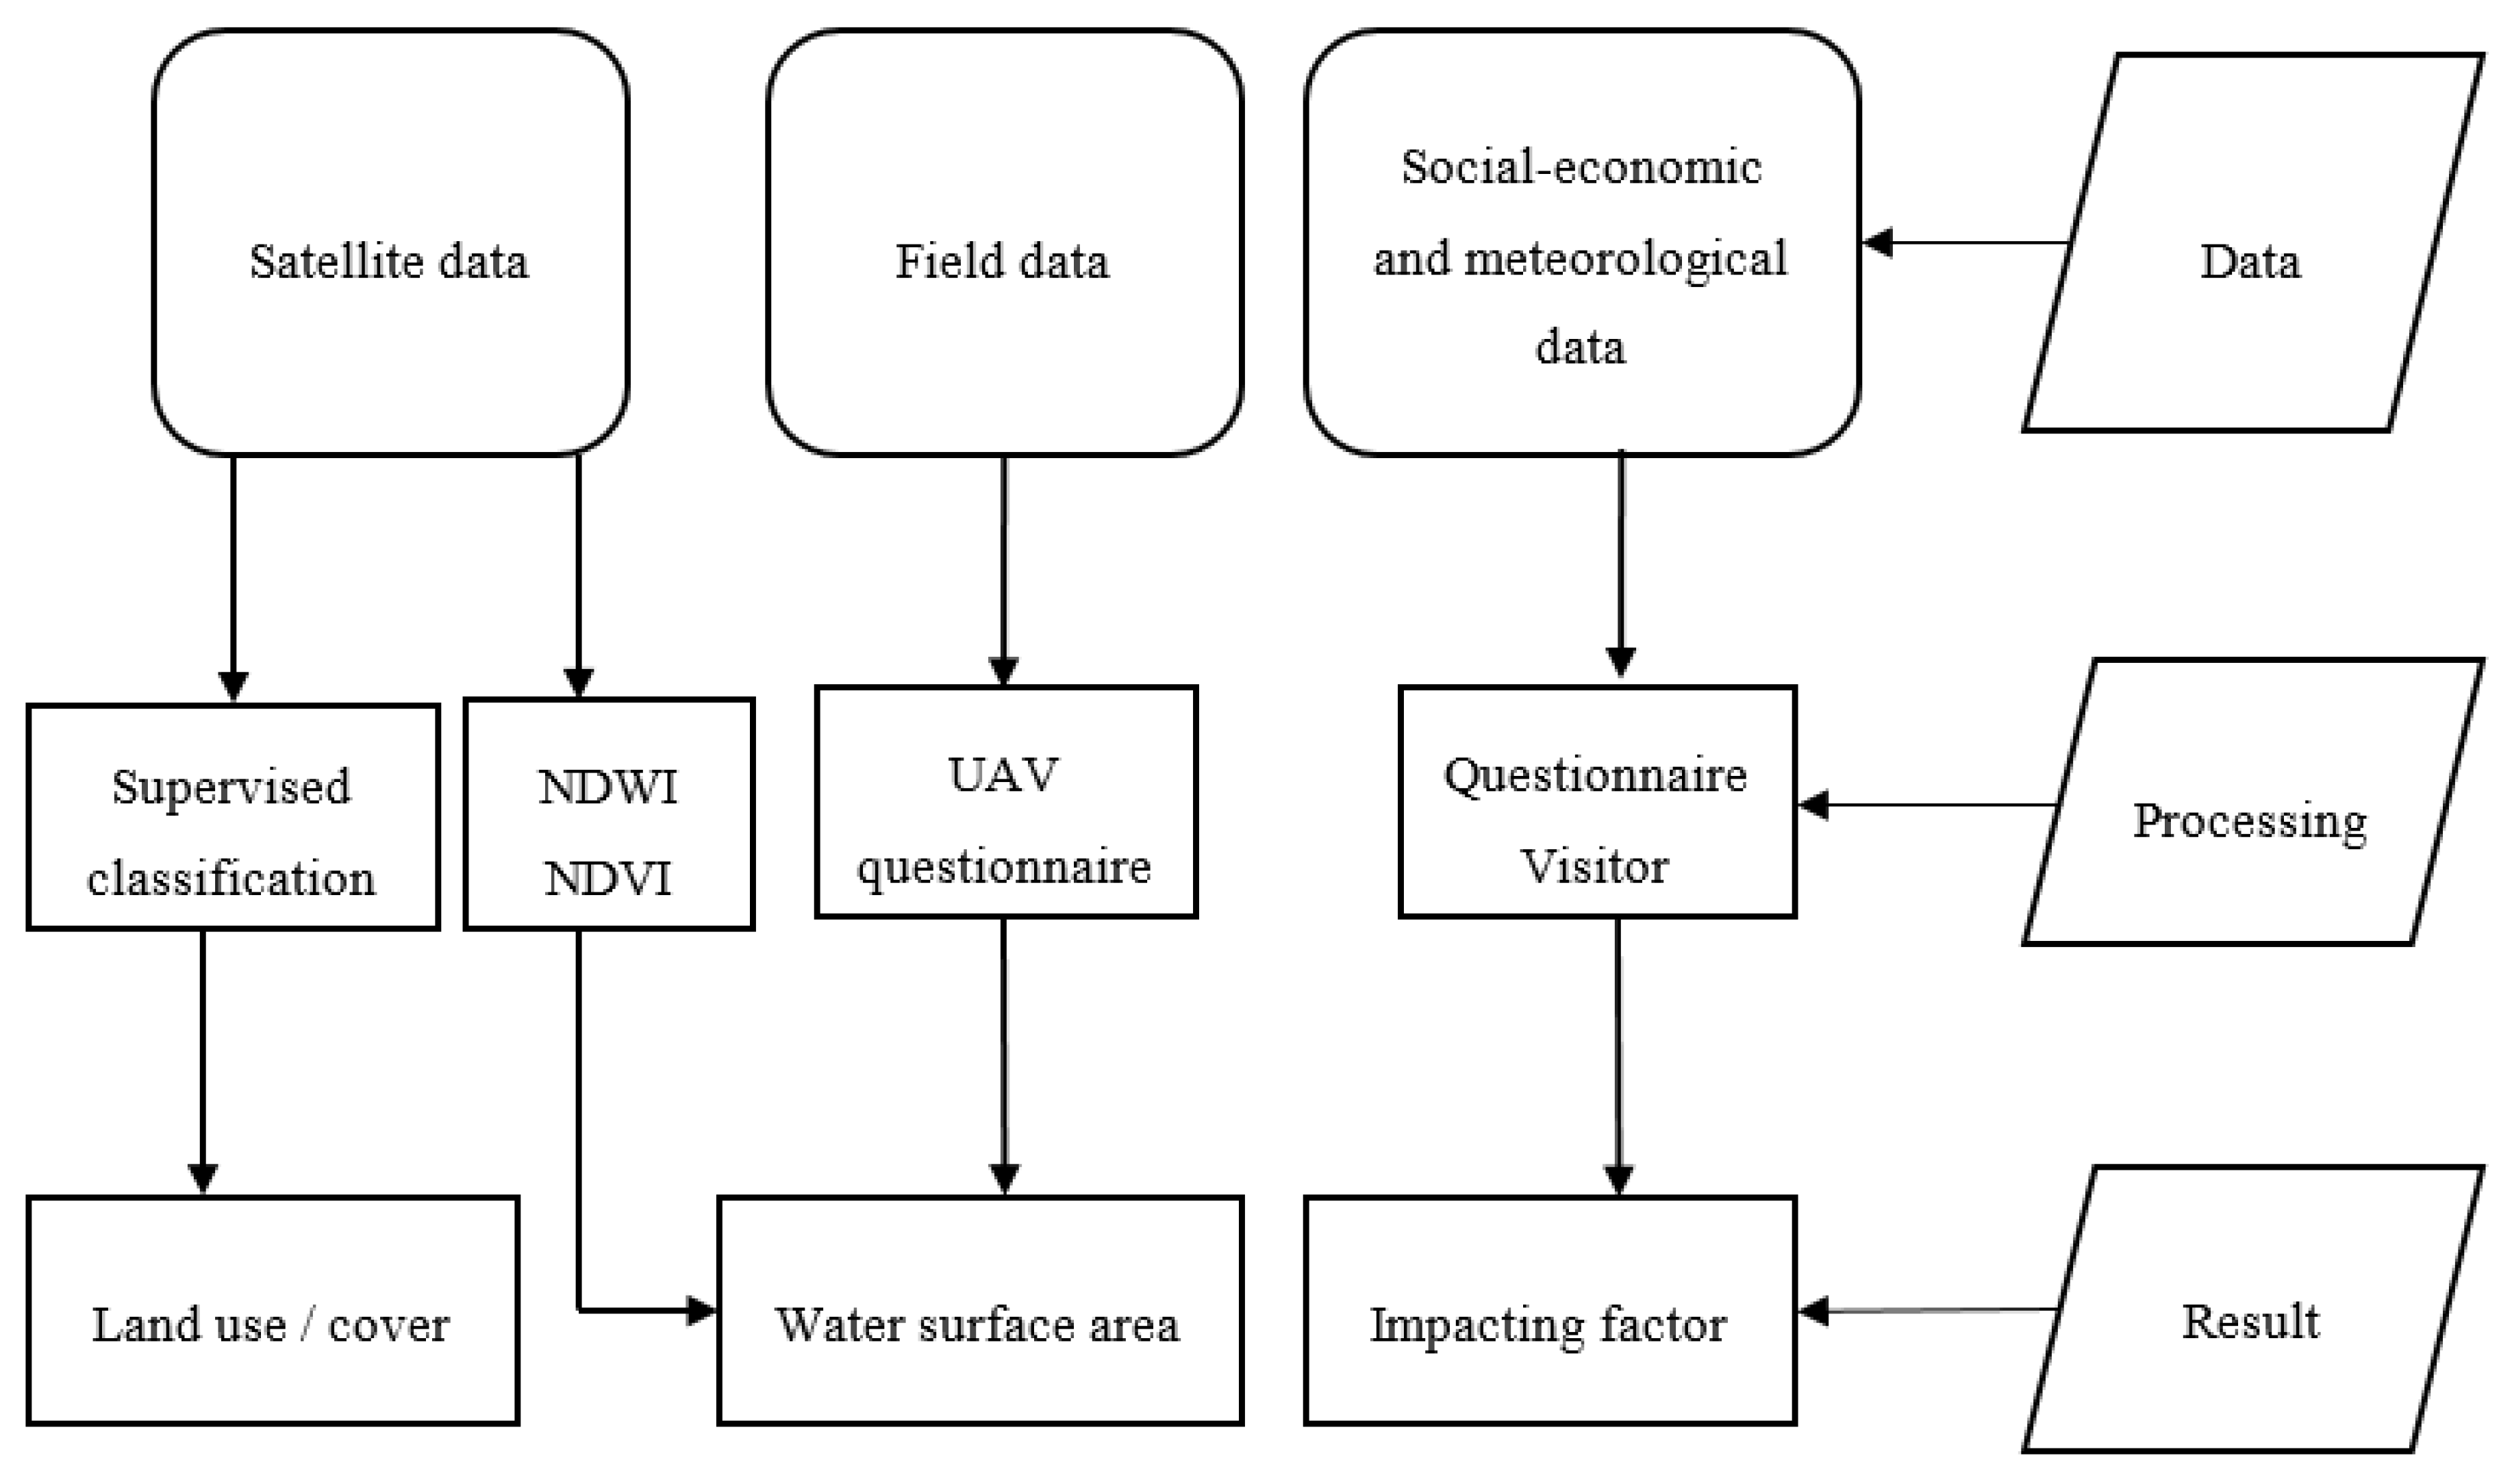
2.2. Data Collection and Processing

The purpose of the analysis was to examine changes in water surface area and grassland area with water level changes over the past 30 years, using aerial photos and GIS techniques. A long-term study of this nature can further elucidate and document the impact of human activities on water area in shallow lake ecosystems.

2.2.1. Collection of Satellite Images

Satellite data for 1989, 1993, 1998, 2003, 2008, 2013, and 2018, as well as multispectral data acquired by Landsat satellite for the months of May, June, July, and August, with 30 m spatial resolution were acquired from United States Geological Survey (USGS) as the Earth Explorer online archive with the official website earthexplorer.usgs.gov [38]. The dates of the satellite data collected for the land use/cover change analysis are shown in Table 1. A total of 28 images were downloaded. All images contained no clouds covering the study area. They were compared to a two-dimensional representation of satellite images or land use/cover maps.

2.2.2. Primary Data Collection

The data used in this study were divided into meteorological, socio-economic, and field survey data. Meteorological data included the average monthly temperature and precipitation as from May to September collected from eight meteorological stations near Toson and Burd lakes, covering the period of 1989–2018. Socio-economic data were collected from national and local statistical offices and contained the number of domestic and foreign entities operating in tourism areas, resorts, and services, the number of individual citizens operating businesses, tourism areas, and the number of livestock in the territory of Delgerkhaan Soum of Khentii Province for each year (Table 2). Primary data on the number of livestock were used covering the period between 1989 and 2018 and the data were checked and statistical accuracy was ensured by verifying with the State Registrar and State Environmental Officer of Delgerkhaan Soum (Table 2). Field survey data included ground truth data for land cover/use classes, unmanned aerial vehicle (UAV) imagery of lakes for validation of classification, and its surrounding area. Ground truth data were in the form of reference data points collected using a global positioning system (GPS) receiver three times in July, August, 2018, and August, 2019. The field survey also helped us to understand the natural setting of the study area, as well as the perception of local people relevant to this study. During the field survey, semi-structured interviews with local people—especially older ones—were carried out with 38 respondents. Subsequently, databases were created and analyzed to understand their perception about trends of land cover. Informal interviews also helped us to understand their adaptive nature and resource consumption strategy in tourism in herder settlements, with 14 entities operating at the Avarga Toson health resort.

2.3. Image Processing and Classification

The schematic presentation of the methodology used in this study was shown in Figure 2. Satellite imageries processing was performed using ENVI 4.8 software (www.harrisgeospatial.com) in order to extract land use/cover information as efficiently as possible. Using remote sensing software as atmospheric correction with flash mode and spatial improvements in subset, LC08 LE07, and 8-channel black and white data, an accuracy of 30 to 15 m from spatial accuracy spectral sharpening was achieved. Primary data and pre-processed imagery were projected into the universal transverse Mercator coordinate system (UTM) zone 48 North and clipped to the study area. This coordinate system was also used for the whole research. An analysis on the change detection was based on ArcGIS for Desktop Advanced 10.2.1 (ESRI) and its spatial analyst extension.
Supervised classification was carried out using the maximum likelihood method for each image separately. Land use/cover was classified into six different categories. The delineated classes were settlements, surface water, sand, wetlands, bare soil/road, bare area, and grassland in 1989, 1993, 1998, 2003, 2008, 2013, and 2018. During these years, data were used for land cover classification in August of each year. For each of the predetermined land cover/use type, training samples (ground truth data) were selected by delimiting polygons around representative sites. Spectral signatures for respective land cover types derived from satellite imagery were recorded by using the pixels enclosed by these polygons. UAV data were used for validation on each classification of lake water area. Training samples were collected using UAV and handheld GPS. We measured the ground control point with GPS at the same time that pictures were taken with the UAV. Supervised classification techniques, such as the maximum likelihood, were applied to the panoramic image to generate a land use and land cover map for the study area.
The remote sensing indexes were used to delineate the water surface area based on the difference of absorption and reflection of light between water and other features on different frequency bands. In this study, the normalized difference vegetation index (NDVI) and normalized difference water index (NDWI) by [39,40,41] were calculated for determining optimal water extraction. NDVI and NDWI were calculated with the following equations:
N D V I = ( N I R R E D ) ( N I R R E D )
N D W I = ( G r e e n N I R ) ( G r e e n + N I R )
where Green is a green band, such as thematic mapper (TM) band 2, and NIR is a near-infrared band, such as TM band 4. This index is designed to maximize the reflectance of water by using green wavelengths, minimize low reflectance of NIR by water features, and take advantage of the high reflectance of NIR by vegetation and soil features. As a result, water features have positive values and, thus, are enhanced, while vegetation and soil usually have 0 or negative values and, therefore, are suppressed [42].
Remote sensing indexes were used to delineate water surface area based on the difference of absorption and reflection of light between water and other features on different frequency bands. In this study, the normalized difference water index (NDWI) [43] and NDVINDWI [44] were compared with each other to determine the optimal water extraction index.

3. Results

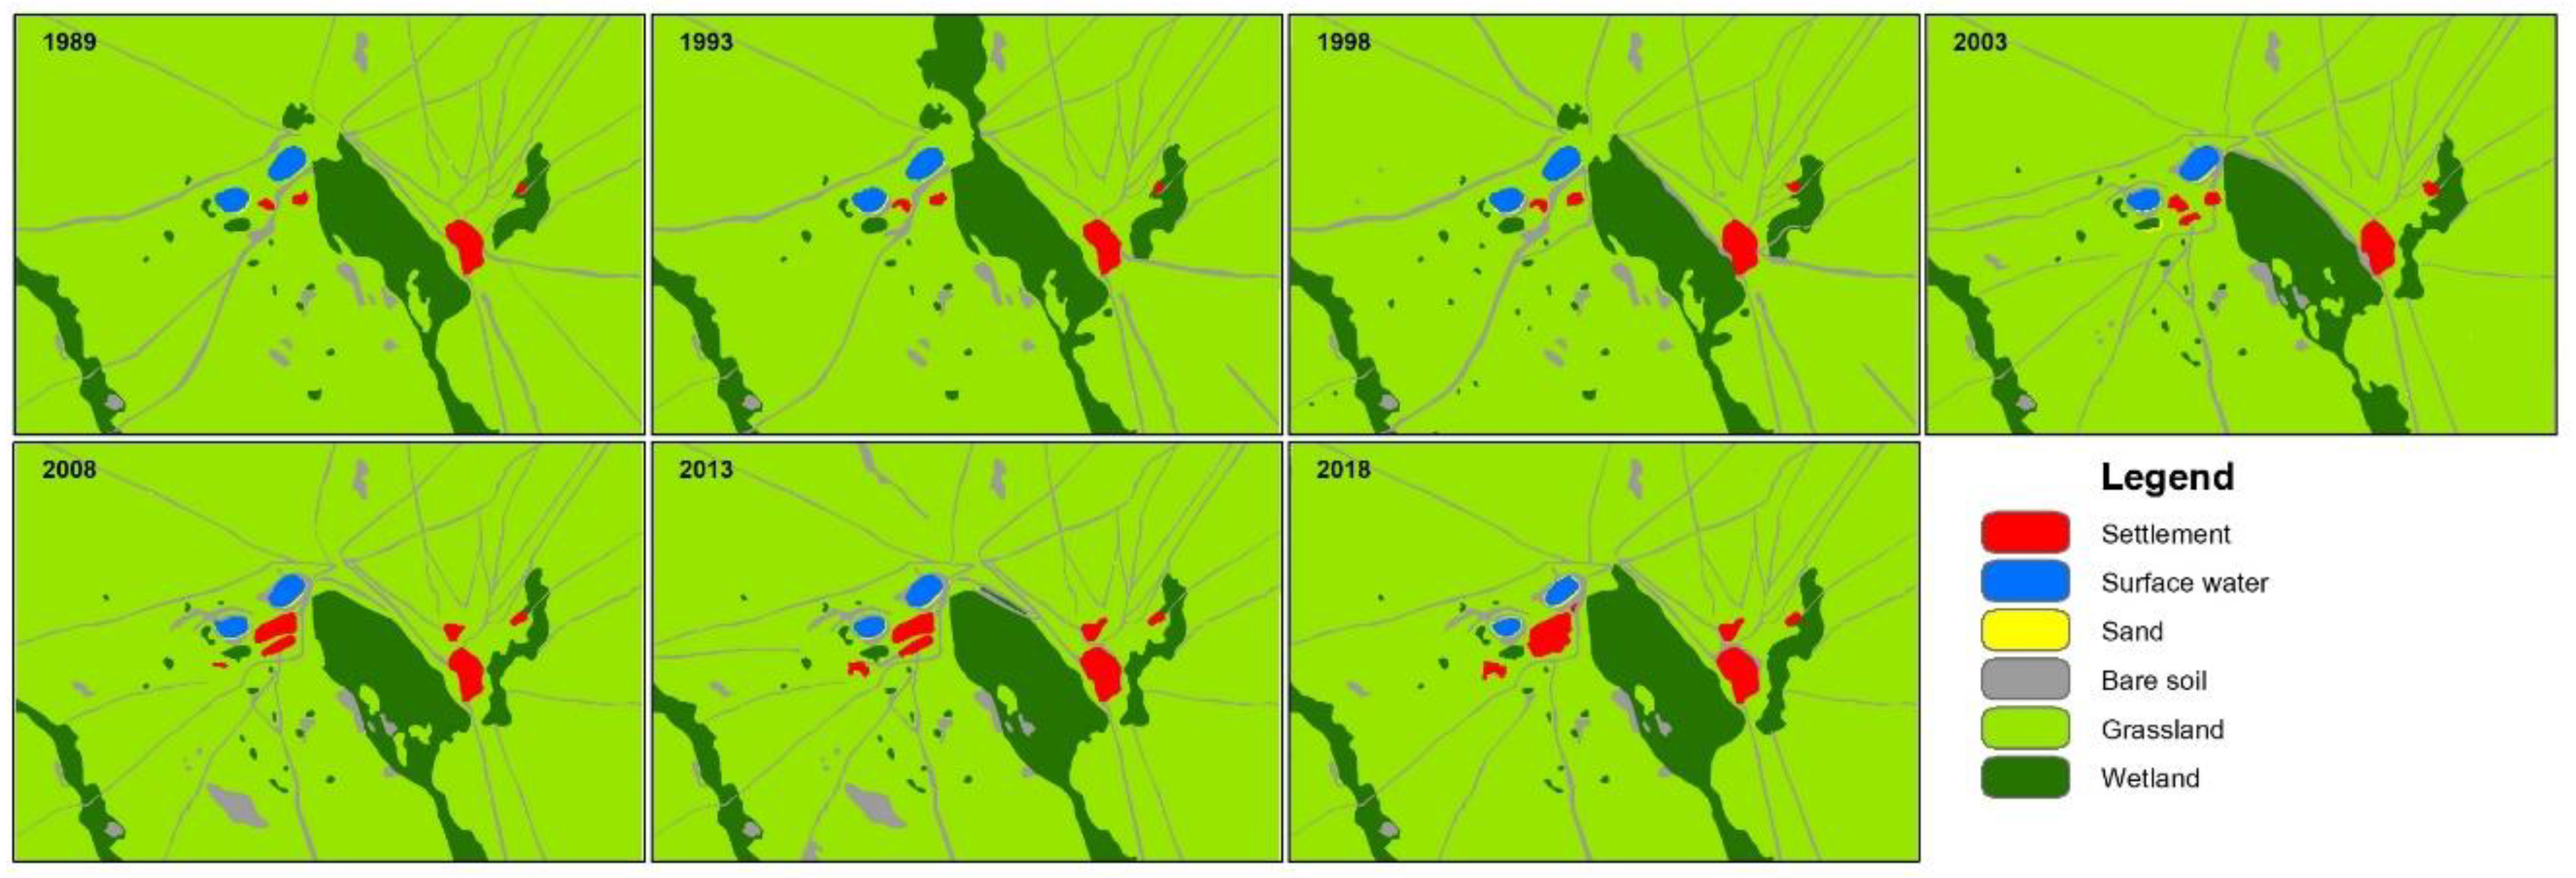
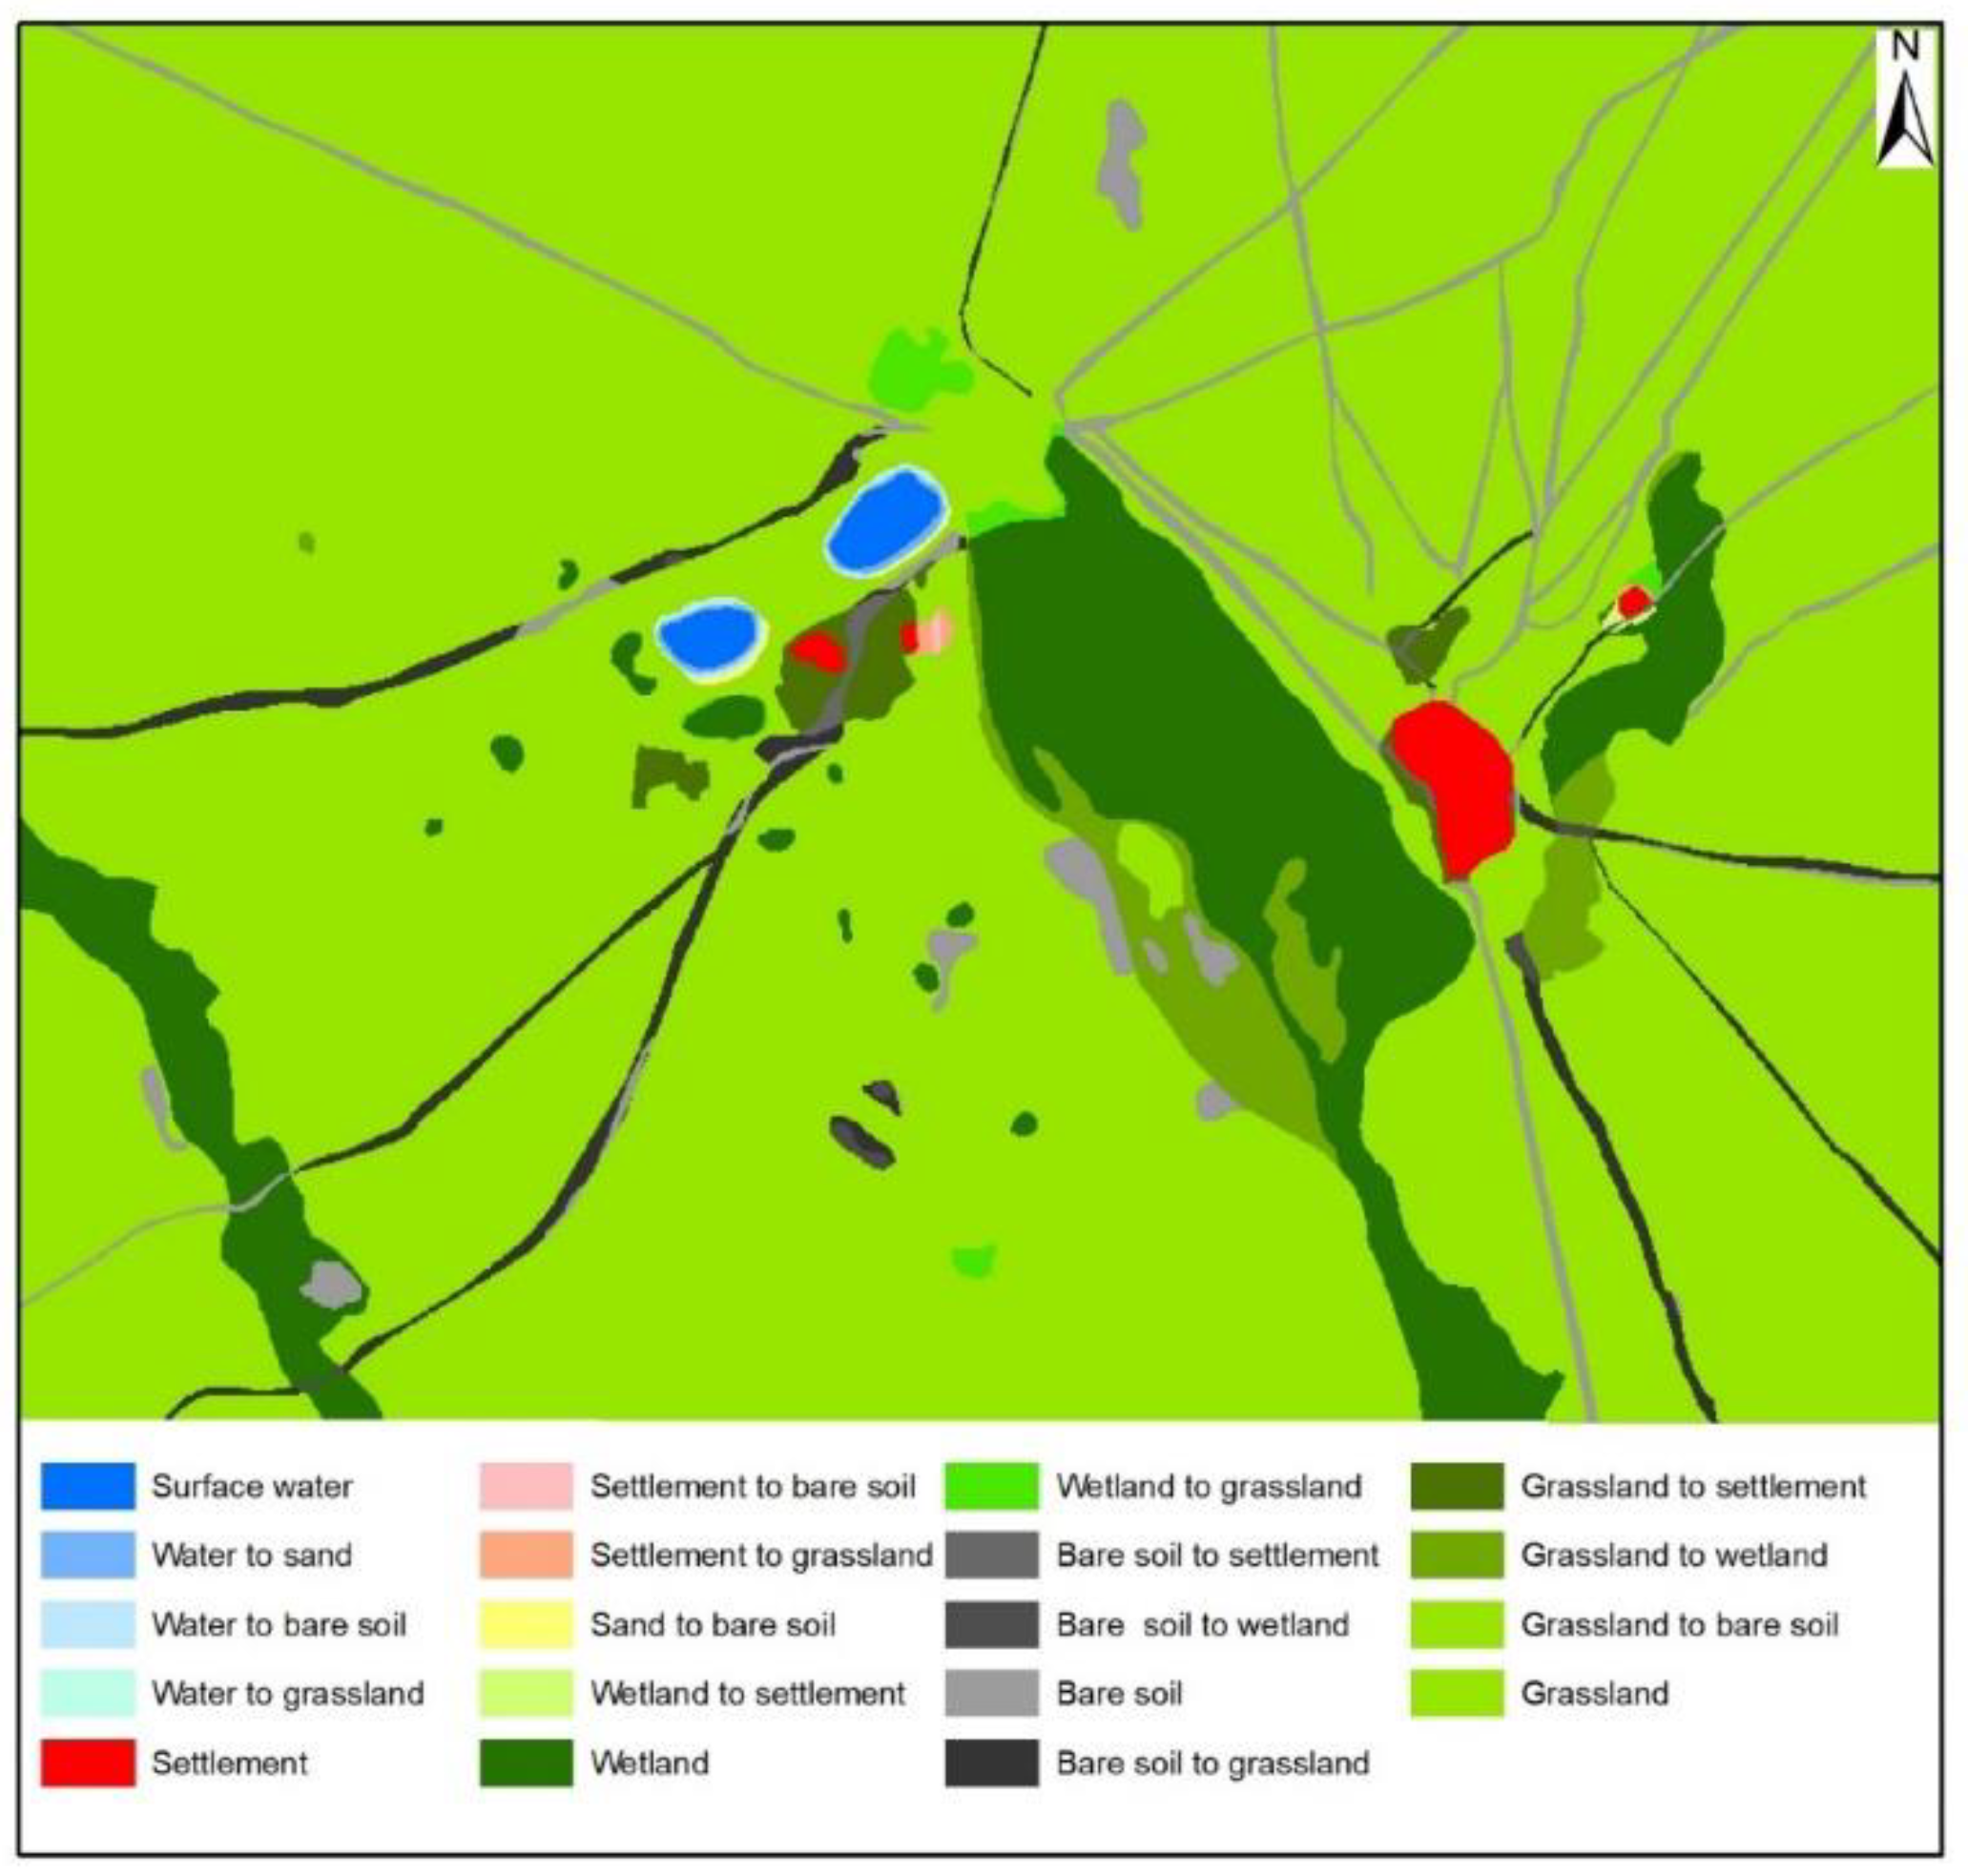
3.1. Land Use/Cover Change

A classified land use/cover map of Avarga Toson Lake area between 1989 and 2018 is presented in Figure 3. The selected survey area was 6823 hectares. Land use was classified into seven categories. These were land cover types in 1989, 1993, 1998, 2003, 2008, 2013, and 2018 as settlements, surface water, sand, wetlands, bare soil/road, bare area, and grassland. Grassland accounted for between 83.1% and 85.4% of the total area, while the sand and water class, which was the area covering the least class, ranged from 0.03% to 0.1% and from 0.45% to 0.6%, respectively, during the 30-year period (Figure 3 and Table 3). The classification results in 1989, 1993, 1998, 2003, 2008, 2013, and 2018 are detailed in Table 3. The percentage of classes based on these results showed the land use/cover practices observed in Avarga Toson Lake area. The total area covered by grassland area for the year 1998 and 2018 were approximately 85.4% (i.e., 5824.8 hectares) and 83.4% (i.e., 5689.6 hectares), respectively. Settlements were found to have significantly increased—i.e., from 0.7% to 1.4% (47.0 hectares to 92.7 hectares)—within the 30 years. Sand areas increased by 0.03% (2.6 hectares) to 0.1% (6.5 hectares) within the 30 years. The bare areas (roads) increased from 4.9% (331.7 hectares) to 5% (402.1 hectares). The total areas of wetland for the year 1998 and 2003 increased from 8.5% (578.5 hectares) to 9.8% (671.2 hectares), while the surface water area reduced from 0.6% (38.4 hectares) to 0.4% (25.3 hectares).
The results showed that a major decline with respect to area coverage in Avarga Toson Lake area was observed in grassland and water classes, whereas the area of settlements, sand, bare soil/rocks, and wetlands classes increased. Grassland shrank by approximately 0.9% for each 5-year period with a relative change of −2.3%, while the water class reduced by approximately 0.1% for each 5-year period with a relative change of −34.1% during the 30-year period. Share of settlements was 0.7% of the total area, which increased up to 1.4%; it significantly increased from 2008 with a relative change of 97.5%. The sand class increased from a share of 0.03% to 0.1% in the last 5 years of the period, with a very high relative change of 146.4%. Wetlands and bare soil/rocks faced an increment in the total share with a relative change of 16.0% and 1.8%, respectively.
To evaluate the results of land use/cover conversions, land cover changes from 1989 to 2018 were also created and shown in Figure 4. A comparison of each class of 1989 and 2018 showed that there were a marked land use and land cover change over the 30 years. There were two kinds of trends— increasing and decreasing—that occurred in 1989–2018. An increasing trend of land use/cover change in the Avarga Toson Lake area changed by 0.07% for sand, 0.7% for settlement, 1.3% for wetland, and 0.01% for bare soil, while the classification results supported the aforementioned decreasing trend over the past 30 years by 0.2% of water and 2.0% of grassland from 1989 to 2018. Figure 4 further shows that about 2.0% of grassland converted to settlement, wetland, and bare soil land between 1989 and 2018. At the same time, water, settlement, bare soil, and wetland converted to grassland. The relatively large amounts of transformation were observed in grassland to settlement, wetland to grassland, and grassland to wetland.
The conversion between grassland and wetland areas may have changed from year to year due to varying precipitation and temperature (Table 2). The change detection analysis showed that 1989–2018 was associated with the dynamic of normal to above and above to normal rainfalls and continually increasing (8.5% to 9.8%) grassland to wetland in Avarga Toson Lake area (Table 3). The grassland percentage area converted to settlement in area increased by a relative change of 97.5%. This increasing trend of settlement land use change in Avarga Toson Lake area showed that human and economic forces are commonly a major stimulus on the anthropogenic change of land, and this was the main reason for the increasing number of resorts of therapy services for visitors (increasing number of visitors from 1989 to 2018, shown in Table 2) near and around the main water body of Toson Lake.
From 1989 to 2018, about 0.2% of the water body transformed into sand, bare soil, and grassland. Approximately 0.07% of the total changed area dried up to sand and approximately 0.13% to bare soil and grassland. The water analyses resulted in a depletion of water and ended up dried up and replaced by either compact surfaces or barren land.

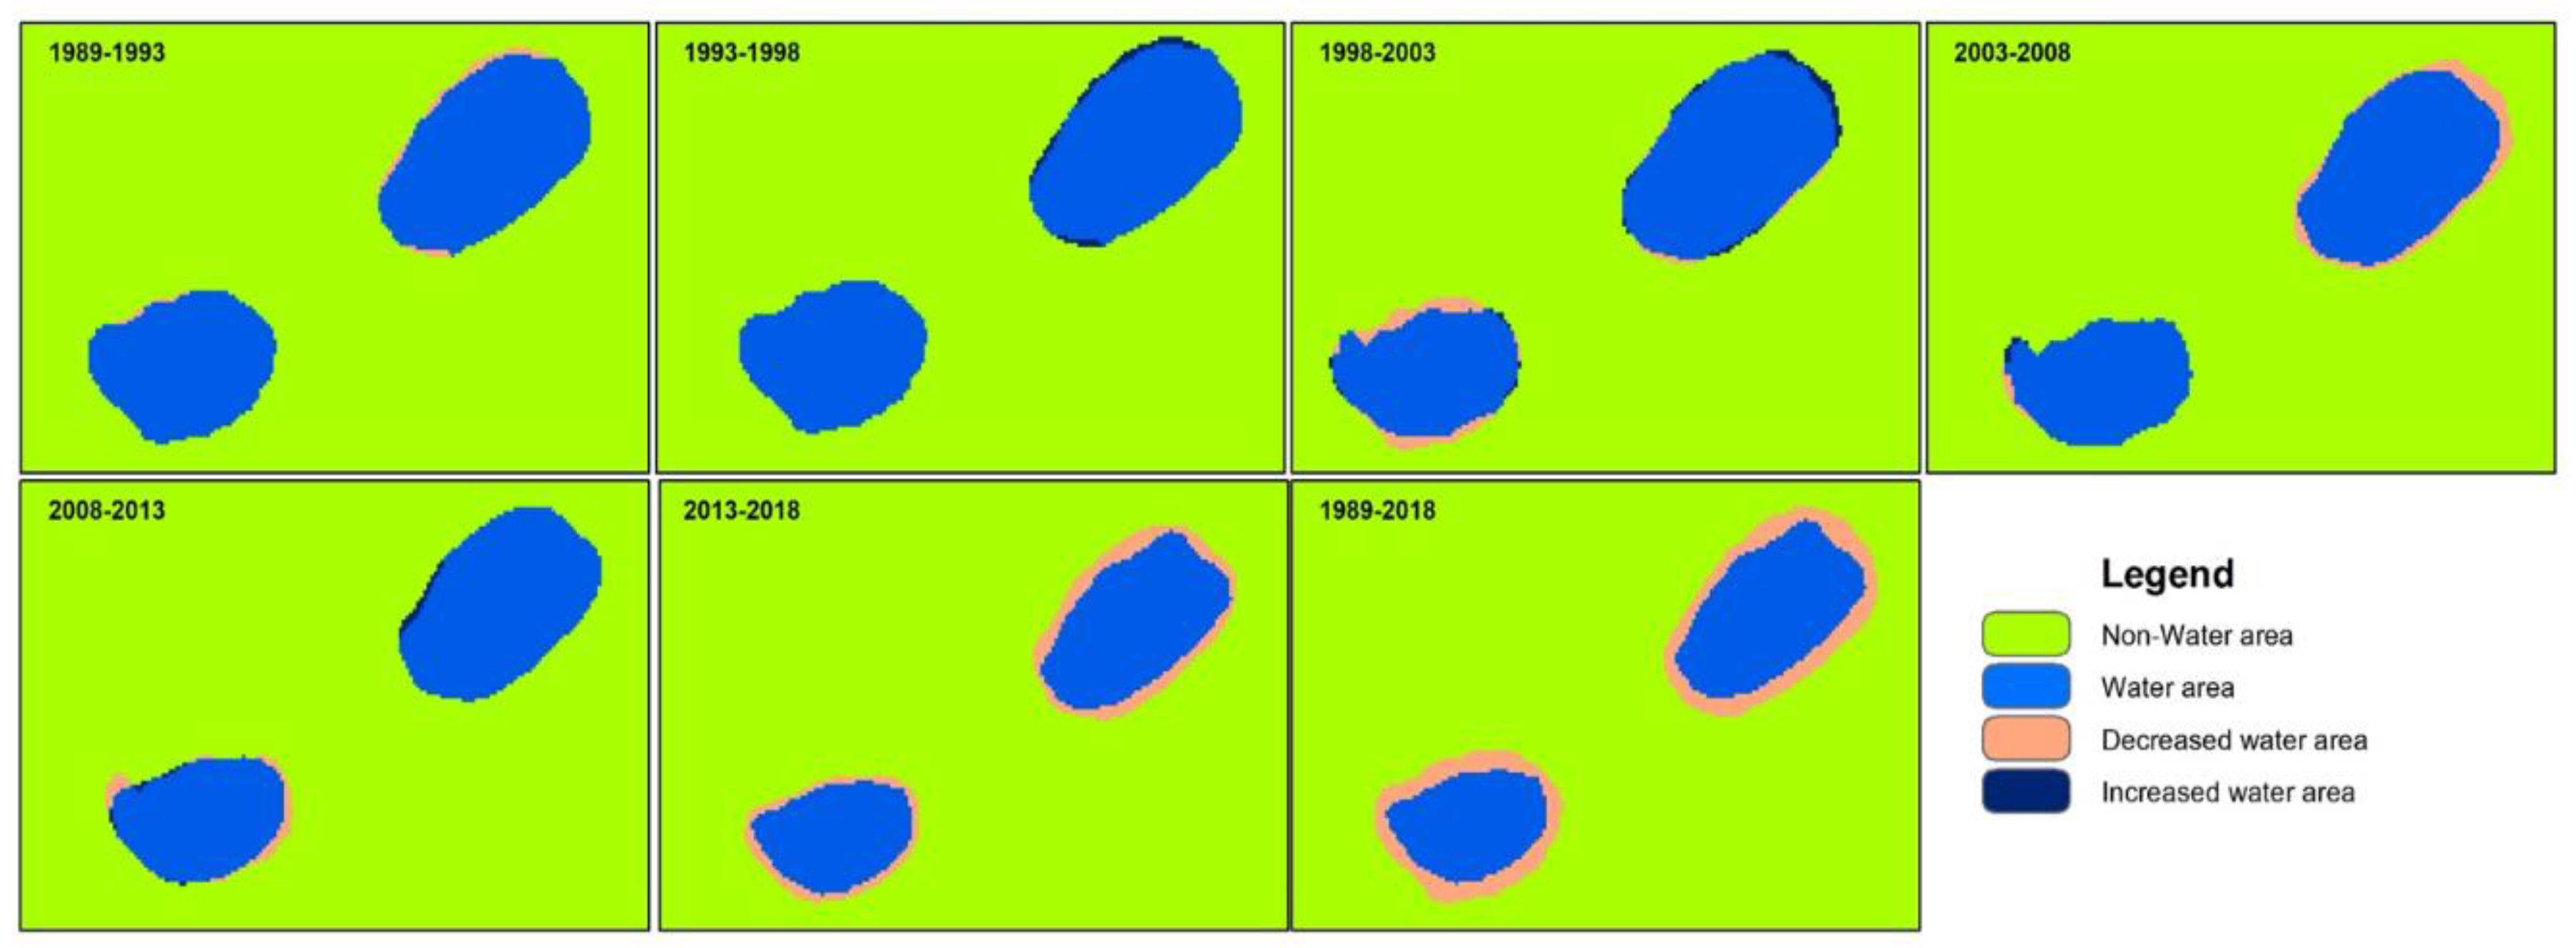
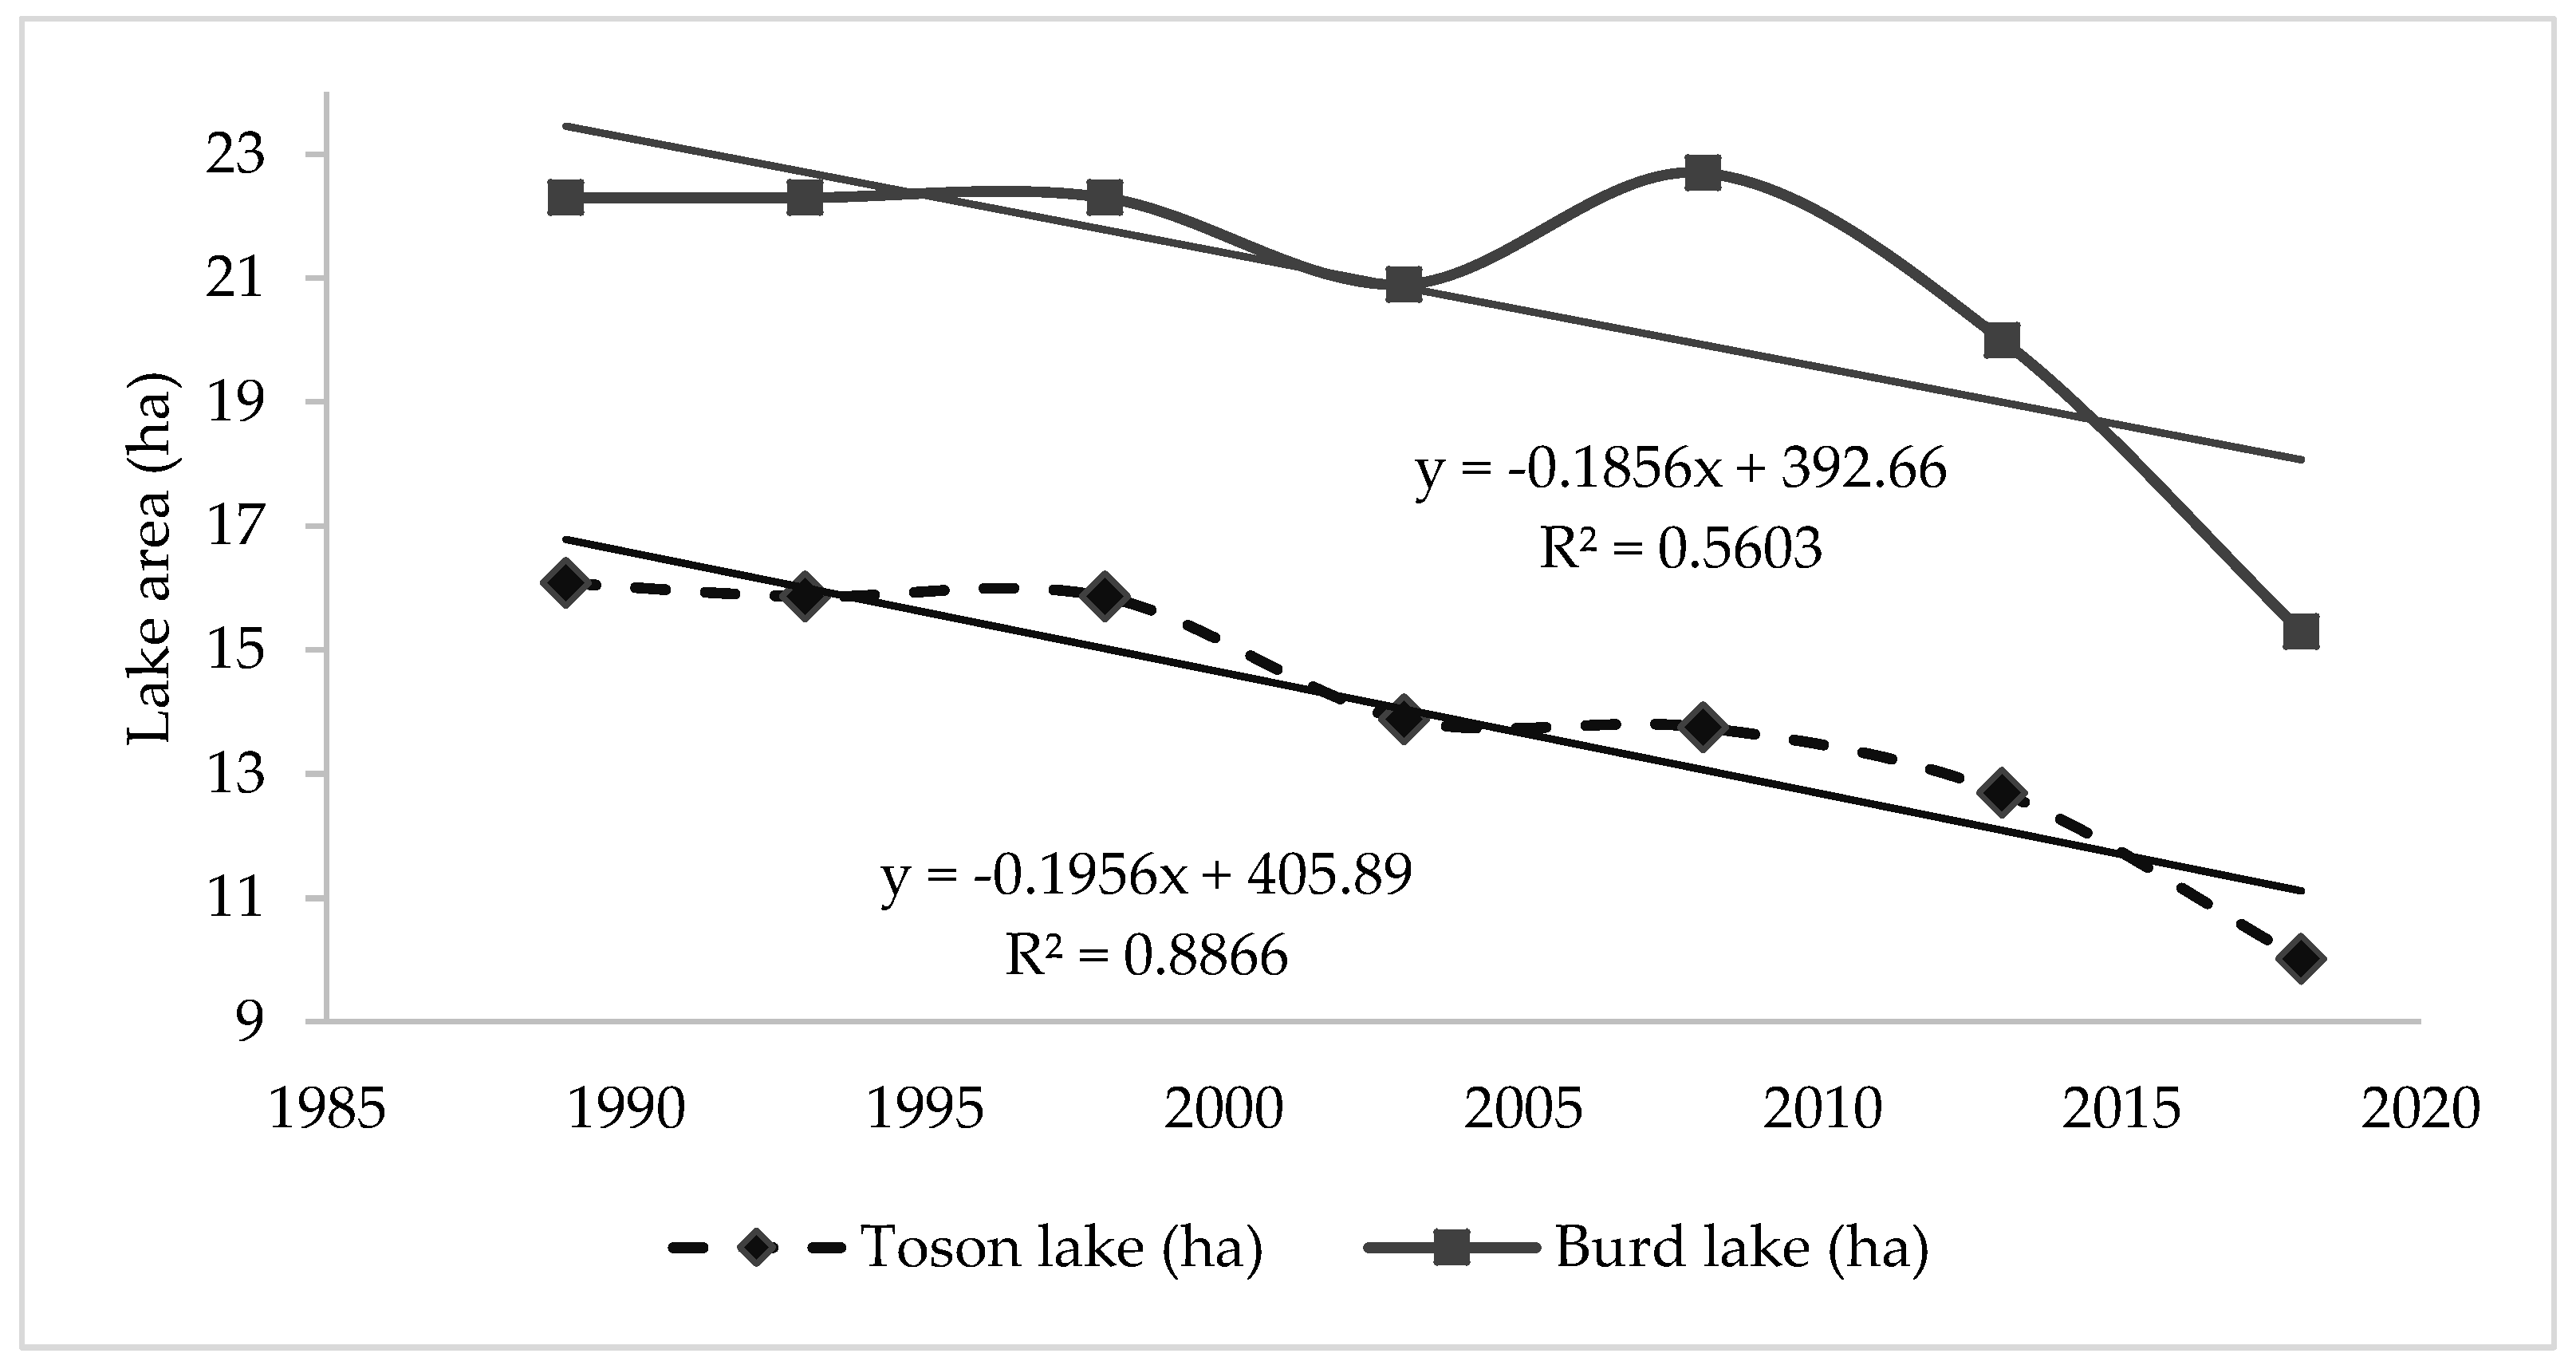
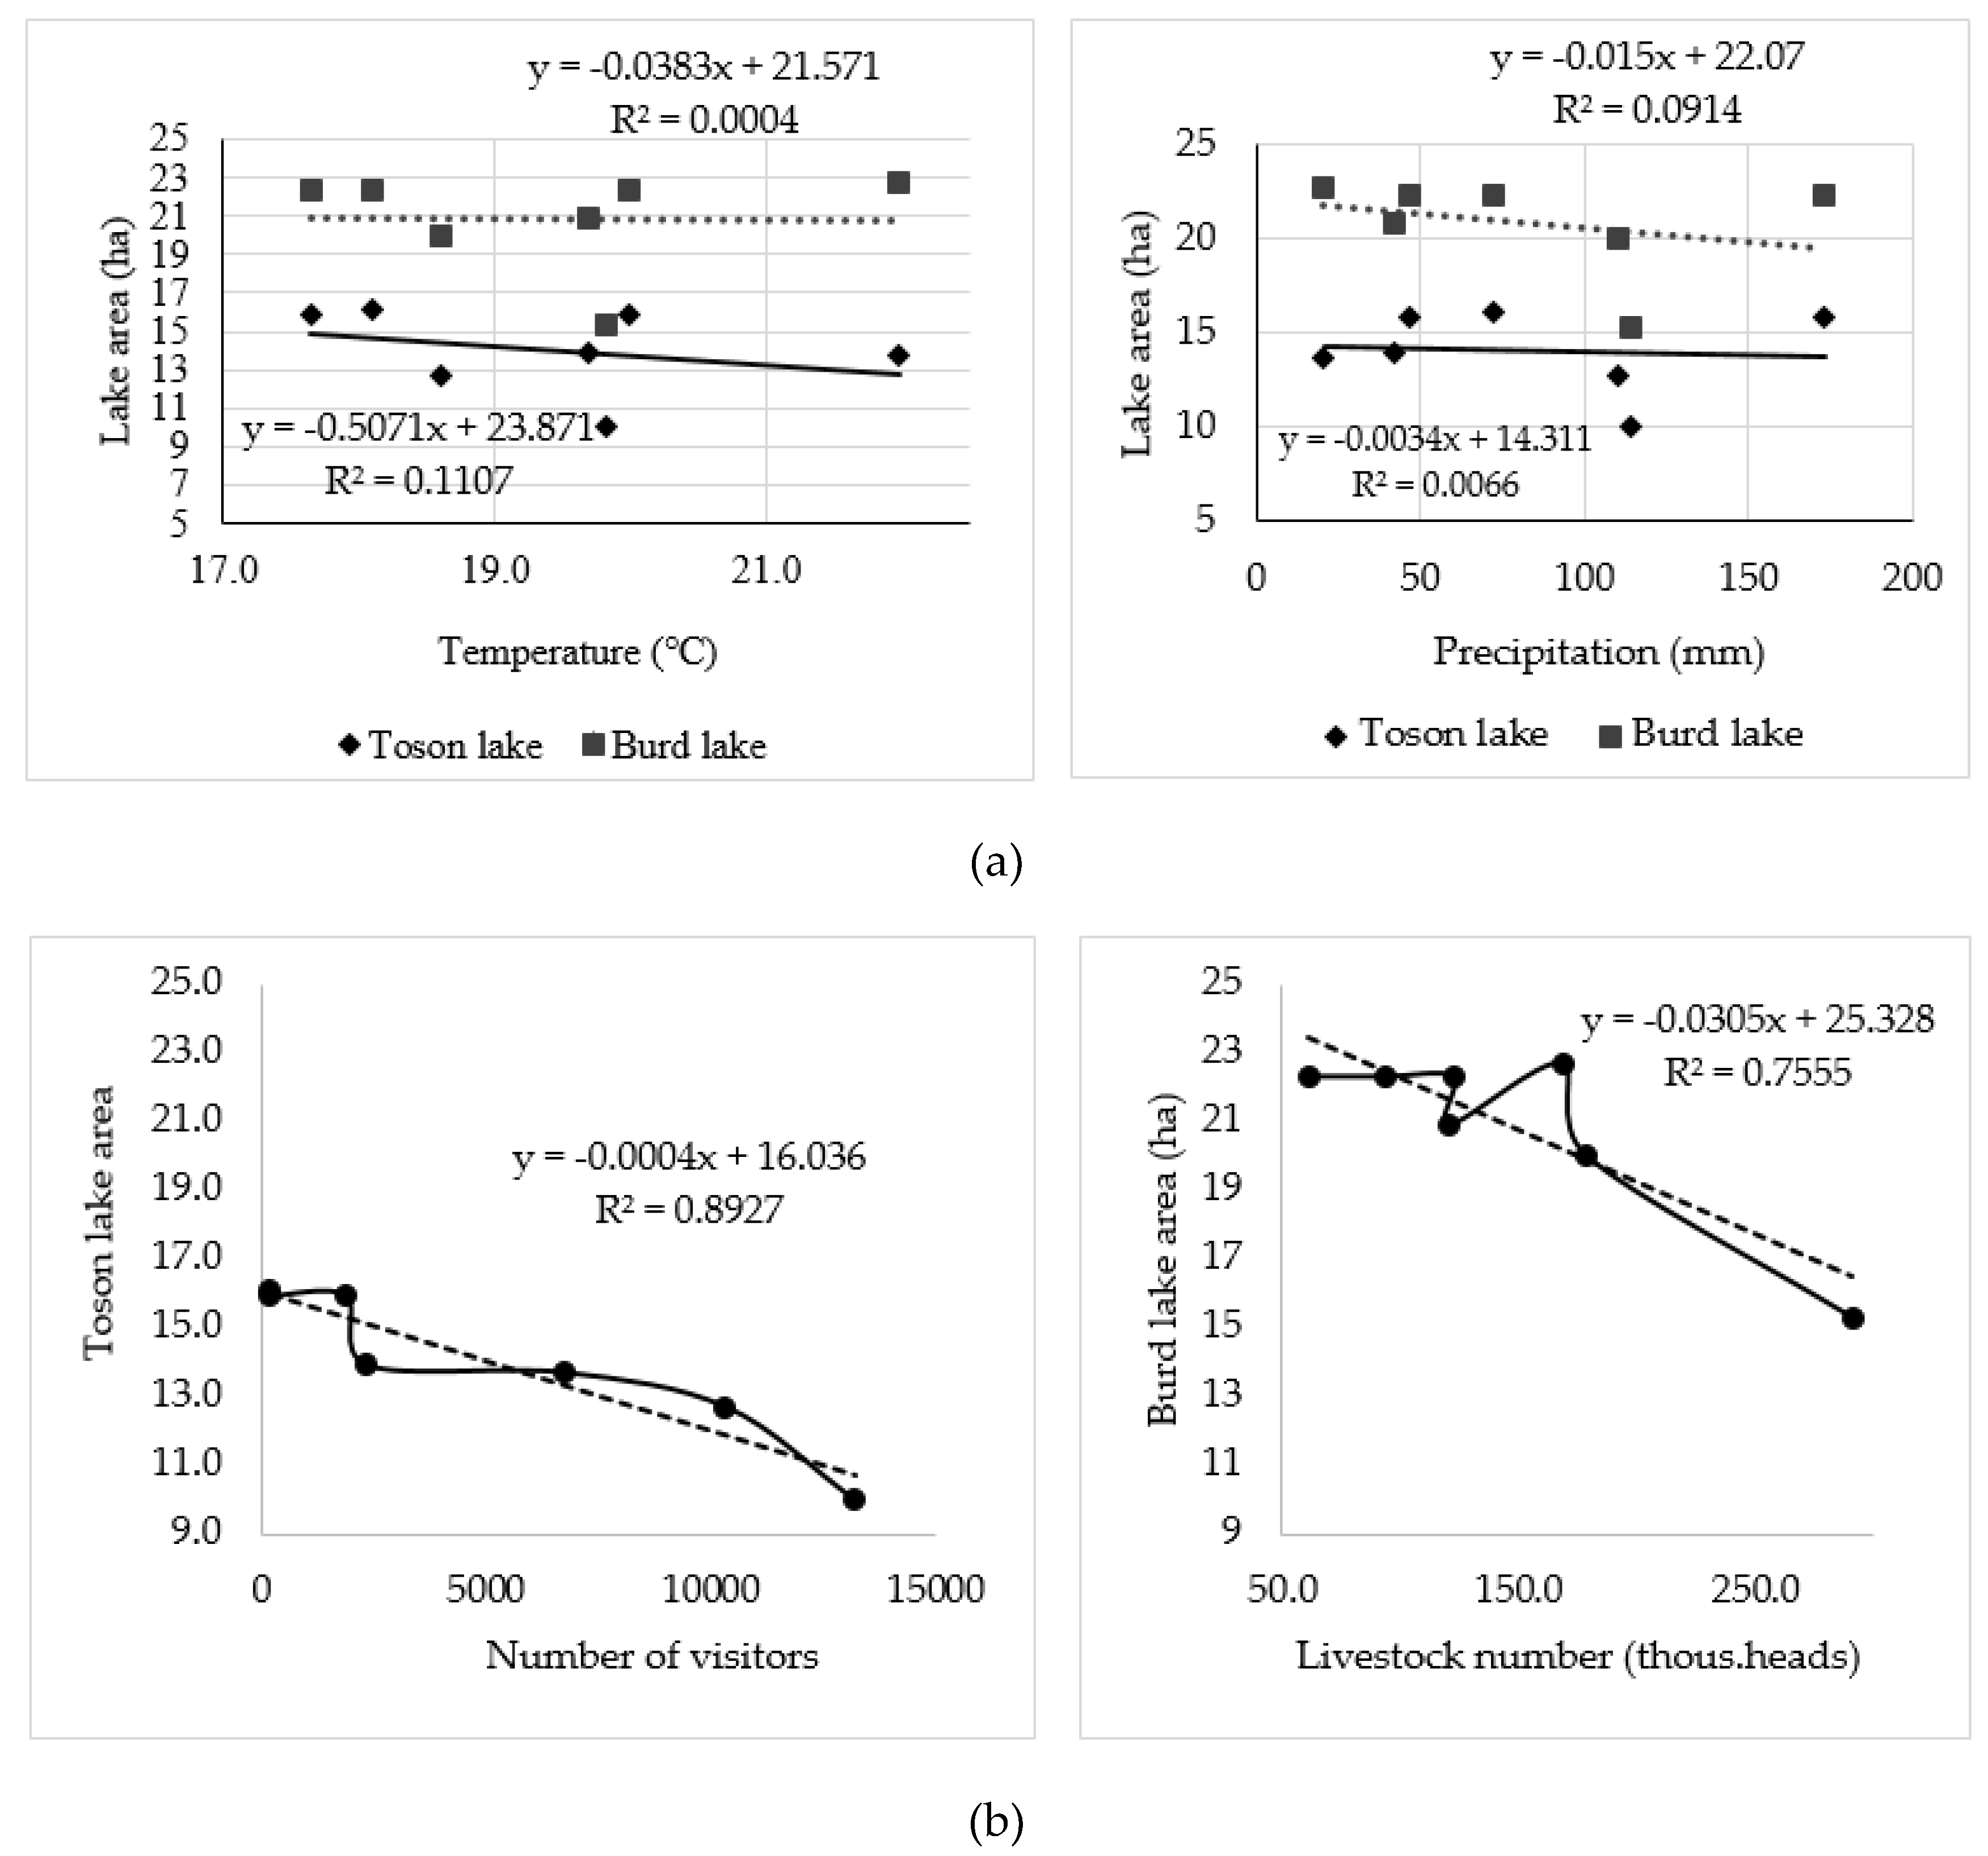
3.2. Changes of Water Surface Area and Impacting Factors

The changes of water surface area maps shown in Figure 5 and statistics shown in Table 4 were also generated from the aforementioned classified images. To evaluate the results on water bodies as Toson and Burd Lakes area conversions, the change maps were illustrated for 1989 to 1993, 1993 to 1998, 1998 to 2003, 2003 to 2008, 2008 to 2013, 2013 to 2018, and 1989 to 2018 (Figure 5 and Table 4). Table 4 observed that the Toson Lake water area changed (1.4%) between 1989 (16.1 ha) and 1993 (15.9 ha) and marginally changed by 12.5% from 1998 to 2003 and 21.1% from 2013 to 2018. The Burd Lake water area was constant between 1989 and 1998 (with about 22.3 ha). The water covering area significantly decreased by about 6.3% from 1998 to 2003 (20.9 ha), 11.9% from 2008 (22.7 ha) to 2013 (20.0 ha), and 23.5% from 2013 to 2018 (15.3 ha) during the 30-year period.
Moreover, changes of the surface water area in the Toson and Burd lakes area are also shown in Figure 5. These results indicated that during the twenty nine-year period (i.e., 1989–2018, Figure 6), the area of Toson Lake was shown to mainly decrease. Increased cases were obtained for Burd Lake from 1993 to 1998, 1998 to 2003, and 2008 to 2013, while significantly decreasing changes occurred between 2013 and 2018. The classification indicated that Toson Lake covered 16.1 ha area and Burd Lake 22.3 ha in 1989, and these areas reduced to 10.0 ha for Toson Lake and 15.3 ha for Burd in 2018. Thus, the areas of Toson Lake and Burd Lake diminished by 21.1% and 23.5%, respectively, within 30 years.
The lake area, to compare by each five-year period, was estimated from the classified images of the Toson and Burd lakes. Yearly data were calculated by taking the average monthly water covering area (Figure 6) and comparing them. A graphic analysis was performed by deriving the root mean square error (RMSE) and R2 values as 0.88 (Toson) and 0.56 (Burd), respectively, for a comparison between the observation of lake area and the years of 1989, 1993, 1998, 2003, 2008, 2013, and 2018. The correlation suggested that the lake covering area in and around Avarga Toson Lake continued to decrease at a rapid rate as observed now, and resulted in decreased surface water in 2013 and 2018. Similar trends have been observed in both water of the Toson and Burd lakes, as shown in Figure 6 and Table 4.
Figure 7 describes the relationships between lake water area and climate variables. The correlation analyses showed that among the meteorological station data near Avarga Toson Lake area, the water area had the weakest and most positive correlation with temperature (R2 = 0.11 for Toson and R2 = 0.0004 for Burd) and precipitation (R2 = 0.006 for Toson and R2 = 0.09 for Burd). Thus, it did not show an affecting indicator between lake area and climate variables. In contrast, Toson Lake area was most strongly correlated with number of visitors (R2 = 0.89). Burd Lake area was also strongly correlated with number of livestock (R2 = 0.75). Lake area had slightly high correlations with socio-economic variables, such as the Toson Lake area changes with number of visitors and Burd Lake area with number of livestock (Figure 7b). Socio-economic variables and their impacts were directly and indirectly associated with changes in lake surface water area from 1989 to 2018. It can also be noticed that a rapid decrease in water surface area occurred from 1989 to 2018 due to intensive human activities and tourist camps near lakes, which occurred due to the absence of authority regulation, while from 1989 to 2018, no substantial increases were observed, as the tourist camp encroached on the area of the lakes.

4. Discussion

The number of livestock has increased over the last few years and there is a lack of grazing capacity throughout the country. Around the lake and rivers, a large number of livestock have concentrated in these areas and they have suffered overgrazing. The monitoring of changes in land cover/use in the lake catchment areas and the subsequent environmental responses are essential for water resource management and water quality assessment [45,46]. Our findings indicate that an increase of tourism combined with intensified irrigation possibly increase land degradation. This practically means that the impact of socio-economic drivers is higher than the impact of climate change. Moreover, although climate change will affect water surface area conditions, these changes in the land uses were expected to have a significant impact on water quality and the ecology of the studied lakes. Land cover varies with weather factors, but at the current time, this change is due to harmful human activities. In 2016, the local government studied the possibility of the proper use of land and natural resources in the Soum territory, assessed the suitability of the land, and developed a territorial development plan based on it. As part of this work, the lake has a designated normal protection zone (200 m) and a special protection zone (100 m). In order to pay special attention to Toson Lake and preserve its original appearance, a decision was made not to allow livestock to enter the lake within a 5 km radius between 15 June and 20 August [47]. It is interesting to note that in our study, an absolute change in the area of the lake increased by 2.7 ha from 2013 to 2018, which is a significant change. This suggests that the decision not to allow livestock into the lake for 5 km was right, but the fact that it is seasonal means it does not significantly reduce human impact on the lake. Our results demonstrate that from 1989 to 2018, Mongolia’s Avarga Toson Lake areas (particularly, changes of water surface area and impacting factors) have changed towards a more human-dominated landscape (Figure 6 and Figure 7). The land use/land cover changes seem to be associated with changes in human activity [7,32,45], which appear to be inversely related to the increase in bare land cover and decrease in water surface. Similar patterns of land use/land cover change have already been found in other parts of the world [6,23,32,33,41]. In the case of the research focusing on the analysis of changes in land cover and land use, and even more so in the case of studies comparing the situation in surface water area from different countries [6,20,23], the rapid pace of land use and land cover is impacted by human activities [2,13,32,33], loss of natural areas [10,17], and also to promote land use sustainability [8,18,19].
Based on these results, we recommend that it is necessary to conduct a specialized study in the field of geoecological and hydrogeological research to reflect the natural features of the study area, the ecology and current general status of natural resources, and to provide a professional evaluation. Moreover, the local government needs regulations and has implications for land use control. Recently, they have started to play a necessary role in the protection of lakes at a government level by limiting tourism for one year and trying to find solution of sustainable management. However, no significant action has been taken in practice land use zones in and around water bodies. In the meantime, the protection of lake water bodies is still largely ignored. The time-break policy processes for lake water protection and the tourism business has made it difficult for business entities and water protection managers to adopt effective measures to address the water-related problems in an integrated and coordinated manner. With regard to policy, social impacts could be substantially reduced if the information flow between government, herders, and business entities for tourism was optimized. The study highly recommends that the government considers the use of the requirements for land management system and policy in this region.

5. Conclusions

Human driving forces were identified as the main factors causing the social–economic situation in Avarga Toson Lake area, especially from the 1990s. In this study, we performed an assessment of the relative effects of human activities on the changes of lake water surface over the past 30 years. The temporal and spatial distributions of the lake water surface area from 1989 to 2018 showed that this decreasing phenomenon began in 1998 for Toson Lake and in 2003 for Burd Lake. The land use/land cover time series indicated that the grassland around Avarga Toson Lake area was replaced with residential land and decreased water land changed to bare soil. The area of settlement land increased by 97.5% and water surface area decreased by 34.1% during the 30 years. The increase in settlement land was very fast, particularly when 2003 decreased in water surface area until 2008, respectively. The contribution of human activities to the changes of water surface area was very significant in this case study.
The water area of the two lakes—Toson Lake and Burd Lake—has decreased year by year. On a month-to-month basis, there is more change in Toson Lake in July. This indicator can be linked to frequent activities at the health resort of the Avarga Toson. There are many factors affecting the Burd Lake area. Local citizens migrate closer to the Avarga Toson resort between 15 June and 15 August and a sociological survey has revealed that they (local community) provide guests with accommodation, food, horse riding, dairy, and meat. Furthermore, water from the Burd Lake is used for livestock.
The findings revealed that significant decreasing changes occurring in the lake surface water area were caused by human activities in the Avarga Toson Lake area. Lake water protection policies have quite recently been initiated in Mongolia and their importance is gradually being recognized by the local government. As important ecological entities, surface water bodies should be more carefully considered both at a strategic level (i.e., use of water resources with herders’ livestock, therapy business, and settlement planning) and at a local action level (i.e., zoning and on-site design). At a strategic level, proactive land use planning for settlement and business development should consider water issues at the initial stage before negative impacts occur. At the local level, an on-site water-sensitive design approach should be advocated so as to eliminate the negative cumulative effect by local incremental construction.
Therefore, the main conclusion of this paper is that beyond socioeconomic factors as driven by land use change, political and institutional failure may amplify the decreasing effect of the water surface area. Additionally, even if policy adoption is relatively sufficient in the country, the public institutional capacity to implement a successful sustainable land management model regarding land access, land development, land resources protection, land market, and investments in infrastructure remains very limited.

Author Contributions

Conceptualization, C.L., and A.B.; methodology, U.M. and S.D.; software, D.G. and S.B.; validation, U.M., D.G., Z.A. and S.B.; formal analysis, D.G. and B.B.; investigation, U.M.; resources, U.M.; data curation, U.M., S.D., D.G., N.B. and Z.A.; writing—original draft preparation, U.M. and B.B.; writing—review and editing, B.B., U.M., A.B. and C.L.; visualization, Z.A. and B.B.; supervision, C.L.; project administration, A.B., C.L. and U.M.; funding acquisition, C.L., and A.B. All authors have read and agreed to the published version of the manuscript.

Funding

This research was funded by National Natural Science Foundation of China (31761143001, 31870316), Natural Science Foundation of Beijing (7202109), Minzu University of China (KLEM-ZZ201904, KLEM-ZZ201906, YLDXXK201819), and Ministry of Ecology and Environment of China (2019HB2096001006).

Acknowledgments

Enkhjargal Dalaibaatar and Byambakhuu Gantumur from the National University of Mongolia provided useful comments. We are grateful to all of them.

Conflicts of Interest

The authors declare that there is no conflict of interest.

References

  1. Nacun, B.; Nendel, C.; Hu, Y.; Lakes, T. Land-use change and land degradation on the Mongolian Plateau from 1975 to 2015—A case study from Xilingol, China. Land Degr. Dev. 2018, 29, 1595–1606. [Google Scholar]
  2. Liu, W.; Wu, W.; Thakuriah, P.; Wang, J. The geography of human activity and land use: A big data approach. Cities 2020, 97, 102523. [Google Scholar] [CrossRef]
  3. Liu, Y.; Zhuang, Q.; Chen, M.; Pan, Z.; Tchebakova, N.; Sokolov, A.; He, Y. Response of evapotranspiration and water availability to changing climate and land cover on the Mongolian Plateau during the 21st century. Glob. Planet. Chang. 2013, 108, 85–99. [Google Scholar] [CrossRef]
  4. John, R.; Chen, J.; Lu, N.; Wilske, B. Land cover/land use change in semi-arid Inner Mongolia: 1992–2004. Environ. Res. Lett. 2009, 4, 45010. [Google Scholar] [CrossRef]
  5. Gantumur, B.; Wu, F.; Zhao, Y.; Vandansambuu, B.; Dalaibaatar, E.; Itiritiphan, F.; Shaimurat, D. Implication of relationship between natural impacts and land use/land cover (LULC) changes of urban area in Mongolia. In Proceedings of the Remote Sensing Technologies and Applications in Urban Environments II, Warsaw, Poland, 11–12 September 2017; Volume 10431, p. 104310M. [Google Scholar]
  6. Hossen, H.; Negm, A. Change detection in the water bodies of Burullus Lake, Northern Nile Delta, Egypt, using RS/GIS. Proc. Eng. 2016, 154, 951–958. [Google Scholar] [CrossRef]
  7. Ning, J.; Liu, J.; Kuang, W.; Xu, X.; Zhang, S.; Yan, C. Spatiotemporal patterns and characteristics of land-use change in China during 2010–2015. J. Geogr. Sci. 2018, 28, 547–562. [Google Scholar] [CrossRef] [Green Version]
  8. Desta, H.; Lemma, B.; Gebremariam, E. Identifying sustainability challenges on land and water uses: The case of Lake Ziway watershed, Ethiopia. Appl. Geogr. 2017, 88, 130–143. [Google Scholar] [CrossRef]
  9. Liu, J.; Zhang, C.; Kou, L.; Zhou, Q. Effects of climate and land use changes on water resources in the Taoer River. Adv. Meteorol. 2017, 2017, 1031854. [Google Scholar] [CrossRef] [Green Version]
  10. Falcucci, A.; Maiorano, L.; Boitani, L. Changes in land-use/land-cover patterns in Italy and their implications for biodiversity conservation. Landsc. Ecol. 2007, 22, 617–631. [Google Scholar] [CrossRef]
  11. Cegielska, K.; Noszczyk, T.; Kukulska, A.; Szylar, M.; Hernik, J.; Dixon-Gough, R.; Kovács, K.F. Land use and land cover changes in post-socialist countries: Some observations from Hungary and Poland. Land Use Policy 2018, 78, 1–18. [Google Scholar] [CrossRef]
  12. Senetra, A. Changes of the land use patterns in Polish and Lithuanian trans-border rural area. Baltica 2013, 26, 157–168. [Google Scholar] [CrossRef] [Green Version]
  13. Liu, J.; Zhang, Z.; Xu, X.; Kuang, W.; Zhou, W.; Zhang, S.; Jiang, N. Spatial patterns and driving forces of land use change in China during the early 21st century. J. Geogr. Sci. 2010, 20, 483–494. [Google Scholar] [CrossRef]
  14. Li, X.; Chen, D.; Duan, Y.; Ji, H.; Zhang, L.; Chai, Q.; Hu, X. Understanding land use/land cover dynamics and impacts of human activities in the Mekong Delta over the last 40 years. Glob. Ecol. Conser. 2020, 22, e00991. [Google Scholar] [CrossRef]
  15. Lambin, E.F.; Geist, H.J.; Lepers, E. Dynamics of land-use and land-cover change in tropical regions. Ann. Rev. Environ. Resour. 2003, 28, 205–241. [Google Scholar] [CrossRef] [Green Version]
  16. Muriithi, F.K. Land use and land cover (LULC) changes in semi-arid sub-watersheds of Laikipia and Athi River basins, Kenya, as influenced by expanding intensive commercial horticulture. Remote Sens. Appl. Soc. Environ. 2016, 3, 73–88. [Google Scholar] [CrossRef]
  17. Lepers, E.; Lambin, E.F.; Janetos, A.C.; DeFries, R.; Achard, F.; Ramankutty, N.; Scholes, R.J. A synthesis of information on rapid land-cover change for the period 1981–2000. BioScience 2005, 55, 115–124. [Google Scholar] [CrossRef]
  18. Dewan, A.M.; Yamaguchi, Y. Land use and land cover change in Greater Dhaka, Bangladesh: Using remote sensing to promote sustainable urbanization. Appl. Geogr. 2009, 29, 390–401. [Google Scholar] [CrossRef]
  19. Young, J.; Watt, A.; Nowicki, P.; Alard, D.; Clitherow, J.; Henle, K.; Niemela, J. Towards sustainable land use: Identifying and managing the conflicts between human activities and biodiversity conservation in Europe. Biodivers. Conser. 2005, 14, 1641–1661. [Google Scholar] [CrossRef]
  20. Papastergiadou, E.S.; Retalis, A.; Kalliris, P.; Georgiadis, T. Land use changes and associated environmental impacts on the Mediterranean shallow Lake Stymfalia, Greece. Hydrobiologia 2007, 584, 361–372. [Google Scholar] [CrossRef]
  21. Shahab, S.; Viallon, F.X. Swiss land improvement syndicates: ‘Impure’ Coasian solutions? Plan. Theory 2020. [Google Scholar] [CrossRef]
  22. Shahab, S.; Viallon, F.X. A transaction-cost analysis of Swiss land improvement syndicates. Town Plan. Rev. 2019, 90, 545–565. [Google Scholar] [CrossRef]
  23. Sand-Jensen, K.; Riis, T.; Vestergaard, O.; Larsen, S.E. Macrophyte decline in Danish lakes and streams over the past 100 years. J. Ecol. 2000, 88, 1030–1040. [Google Scholar] [CrossRef]
  24. Sand-Jensen, K.; Pedersen, N.L.; Thorsgaard, I.; Moeslund, B.; Borum, J.; Brodersen, K.P. 100 years of vegetation decline and recovery in Lake Fure, Denmark. J. Ecol. 2008, 96, 260–271. [Google Scholar] [CrossRef]
  25. Burrough, P.A.; McDonnell, R.A. Principle of Geographic Information Systems; Oxford University Press: Oxford, UK, 1998. [Google Scholar]
  26. Cieślak, I.; Biłozor, A.; Źróbek-Sokolnik, A.; Zagroba, M. The use of geographic databases for analyzing changes in land cover—A case study of the region of Warmia and Mazury in Poland. ISPRS Int. J. Geo-Inf. 2020, 9, 358. [Google Scholar] [CrossRef]
  27. Williams, D.R.; Yan, Y.; Jackson, J.S.; Anderson, N.B. Racial differences in physical and mental health: Socio-economic status, stress and discrimination. J. Health Psychol. 1997, 2, 335–351. [Google Scholar] [CrossRef] [Green Version]
  28. Hansen, M.C.; Loveland, T.R. A review of large area monitoring of land cover change using Landsat data. Remote Sens. Env. 2012, 122, 66–74. [Google Scholar] [CrossRef]
  29. Xie, Y.; Sha, Z.; Yu, M. Remote sensing imagery in vegetation mapping: A review. J. Plant Ecol. 2008, 1, 9–23. [Google Scholar] [CrossRef]
  30. Bu, H.; Sharma, L.K.; Denton, A.; Franzen, D.W. Comparison of satellite imagery and ground-based active optical sensors as yield predictors in sugar beet, spring wheat, corn, and sunflower. Agron. J. 2017, 109, 299–308. [Google Scholar] [CrossRef] [Green Version]
  31. Kuenzer, C.; Leinenkugel, P.; Vollmuth, M.; Dech, S. Comparing global land-cover products—Implications for geoscience applications: An investigation for the trans-boundary Mekong Basin. Int. J. Remote Sens. 2014, 35, 2752–2779. [Google Scholar] [CrossRef] [Green Version]
  32. Chang, B.; Li, R.; Zhu, C.; Liu, K. Quantitative impacts of climate change and human activities on water-surface area variations from the 1990s to 2013 in Honghu Lake, China. Water 2015, 7, 2881–2899. [Google Scholar] [CrossRef] [Green Version]
  33. Verschuren, D.; Johnson, T.C.; Kling, H.J.; Edgington, D.N.; Leavitt, P.R.; Brown, E.T.; Hecky, R.E. History and timing of human impact on Lake Victoria, East Africa. Proc. Biol. Sci. 2002, 269, 289–294. [Google Scholar] [CrossRef] [PubMed] [Green Version]
  34. Dorjsuren, P. Some Results of Investigation in the Avarga Toson Lake; Theoretical Conference; State Press: Ulaanbaatar, Mongolia, 1971. (In Mongolia) [Google Scholar]
  35. Namnandorj, O.; Tseren, S.; Nyamdorj, U. The Mineral Water of the Republic of Mongolia; State Press: Ulaanbaatar, Mongolia, 1966; p. 468. [Google Scholar]
  36. Yadamsuren, G.; Tseveendorj, D. The Amount of Skin Diseases Treated by the Clay of Avarga Toson Lake; National Center for Dermatology: Ulaanbaatar, Mongolia, 1980. (In Mongolia) [Google Scholar]
  37. Tserensodnom, J. Catalogue of Mongolian Lakes; State Press: Ulaanbaatar, Mongolia, 2000; pp. 1–69. (In Mongolia) [Google Scholar]
  38. Available online: http://earthexplorer.usgs.gov (accessed on 5 March 2020).
  39. Ji, L.; Geng, X.; Sun, K.; Zhao, Y.; Gong, P. Target detection method for water mapping using landsat 8 OLI/TIRS imagery. Water 2015, 7, 794–817. [Google Scholar] [CrossRef] [Green Version]
  40. Rokni, K.; Ahmad, A.; Selamat, A.; Hazini, S. Water feature extraction and change detection using multitemporal landsat imagery. Remote Sens. 2014, 6, 4173–4189. [Google Scholar] [CrossRef] [Green Version]
  41. Tuvshin, G.; Khosbayar, T.; Davaadorj, D. The methodology of studying changes in the Gobi region’s lake area. Proc. Mong. Acad. Sci. 2018, 58, 28. [Google Scholar]
  42. Wang, J.; Sheng, Y.; Tong, T.S.D. Monitoring decadal lake dynamics across the Yangtze Basin downstream of Three Gorges Dam. Remote Sens. Env. 2014, 152, 251–269. [Google Scholar] [CrossRef]
  43. McFeeters, S.K. The use of the normalized difference water index (NDWI) in the delineation of open water features. Int. J. Remote Sens. 1996, 17, 1425–1432. [Google Scholar] [CrossRef]
  44. Lu, S.; Wu, B.; Yan, N.; Wang, H. Water body mapping method with HJ-1A/B satellite imagery. Int. J. Appl. Earth Obs. 2011, 13, 428–434. [Google Scholar] [CrossRef]
  45. Fraterrigo, J.M.; Downing, J.A. The influence of land use on lake nutrients varies with watershed transport capacity. Ecosystems 2008, 11, 1021–1034. [Google Scholar] [CrossRef]
  46. Nielsen, A.; Trolle, D.; Søndergaard, M.; Lauridsen, T.L.; Bjerring, R.; Olesen, J.E.; Jeppesen, E. Watershed land use effects on lake water quality in Denmark. Ecol. Appl. 2012, 22, 1187–1200. [Google Scholar] [CrossRef]
  47. Working Group of Delgerkhaan Soum Development Report. Develop a Territorial Plan for Delgerkhaan Soum, Khentii Province. Available online: https://www.gazar.gov.mn/p/520-108 (accessed on 28 May 2020).
Figure 1. Study area of Avarga Toson Lake area, Delgerkhaan Soum, Khentii Province.
Sustainability 12 06070 g001
Figure 2. Schematic presentation of the methodology used in this study.
Sustainability 12 06070 g002
Figure 3. Classified maps of land use/cover for 1989, 1993, 1998, 2003, 2008, 2013, and 2018 in the study site.
Sustainability 12 06070 g003
Figure 4. Major land use conversion in Avarga Toson Lake area from 1989 to 2018.
Sustainability 12 06070 g004
Figure 5. Changes of surface water area in Toson and Burd lakes area for 1989 to 1993, 1993 to 1998, 1998 to 2003, 2003 to 2008, 2008 to 2013, 2013 to 2018, and 1989 to 2018.
Sustainability 12 06070 g005
Figure 6. Lake area for every 5 years of changes (from 1989 to 2018).
Sustainability 12 06070 g006
Figure 7. Identification of impacting factors for changes of each lake covering area: (a) climate; and (b) socio-economic condition.
Sustainability 12 06070 g007
Table 1. Information of Landsat satellite images (specifications of the imageries used in the study).
MayJuneJulyAugust
19891988.05.01 TM1990.06.24 TM1989.07.15 TM1989.08.07 TM
19931993.05.22 TM1992.06.04 TM1994.07.21 TM1993.08.10 TM
19981998.05.29 TM1998.06.21 TM1998.07.07 TM1998.08.24 TM
20032003.05.19 ETM+2003/06.12 TM2003.07.29 TM2003.08.31 TM
20082008.05.16 ETM+2009.06.11 ETM+2008.07.18 TM2008.08.11 ETM+
20132013.05.29 OLI2013.06.06 ETM+2013.07.09 OLI2013.08.21 ETM+
20182018.05.20 OLI2018.06.28 OLI2018.07.07 OLI2018.08.24 OLI
Thematic mapper—TM; enhanced thematic mapper plus—ETM+; operation land imager—OLI.
Table 2. Meteorological and socio-economic data between 1989 and 2018 in Avarga Toson Lake area of Delgerkhaan Soum, Khentii Province, Mongolia.
YearTemperature (°C)Precipitation (mm)Visitors NumberLivestock Number/Thous.Heads/
HorseCattleCamelSheepGoatTotal
198918.172.72005.74.10.441.99.061.0
199317.7173.32007.57.90.462.015.693.3
199820.047.0186010.711.30.372.927.0122.1
200319.742.2234110.86.30.364.938.4120.7
200822.020.7672010.27.40.282.368.2168.2
201318.6110.110,31511.16.80.183.377.3178.5
201819.8114.613,18420.115.60.1139.0115.729,065.0
Table 3. Detail of land use/cover classification area estimates for every 5 years from satellite images.
Land Use/Land Cover ClassSettlementSurface WaterSandBare SoilGrasslandWetland
1989Area (ha)4738.42.6331.75824.8578.5
0.70.604.985.48.5
199337.937.13302.45718.7722.8
0.60.504.483.810.6
199842.238.13.23595780.5600
0.60.605.384.78.8
200351.836.733685717.5646.1
0.80.500.483.89.5
200870.433.43.33765739601
10.505.584.18.8
201376.832.73.1402.15669.6638.7
1.10.505.983.19.4
201892.725.36.5337.75689.6671.2
1.40.40.14.983.49.8
Relative change (%) 1989 and 201897.5−34.1146.41.8−2.316
Table 4. Surface water area of Toson and Burd lakes from 1989 to 2018 and changes in area between the successive years in ha and %.
YearToson Lake Area (ha)PercentageBurd Lake Area (ha)Percentage
198916.1 22.3
199315.9−1.422.30.0
199815.90.022.30.0
200313.9−12.520.9−6.3
200813.8−0.922.78.6
201312.7−7.720.0−11.9
201810.0−21.115.3−23.5

