Article

A Vulnerability Assessment in Scant Data Context: The Case of North Horr Sub-County

1
Interuniversity Department of Regional and Urban Studies and Planning (DIST), Politecnico di Torino & Universita di Torino, 10125 Torino, Italy
2
Department of Environment, Land and Infrastructure Engineering (DIATI), Politecnico di Torino, 10129 Torino, Italy
*
Author to whom correspondence should be addressed.
Sustainability 2020, 12(15), 6024; https://doi.org/10.3390/su12156024
Submission received: 28 May 2020 / Revised: 10 July 2020 / Accepted: 14 July 2020 / Published: 27 July 2020
(This article belongs to the Special Issue Risk-Informed Sustainable Development in the Rural Tropics)

Abstract

:
In Kenyan rural areas belonging to the Arid and Semi-Arid Lands (ASALs), water quantity and water quality are major issues for the local population. In North Horr Sub-County water quality is threatened by nitrate contamination due to fecal matter pollution. This research, hence, aims at assessing the vulnerability of open shallow water sources to nitrate contamination due to fecal intrusion following flooding events and nitrate percolation in groundwater. The present research, indeed, provides, on one hand, new insights into the analysis of the vulnerability in a scant data context; on the other hand, it assesses the adaptation measures contained in the local development plan. Applying the reference definition of the Intergovernmental Panel on Climate Change (IPCC), the results demonstrate that the open shallow water sources in the northern part of the sub-county are more vulnerable to nitrate contamination. Furthermore, the consistency of the results proves the suitability of the methodology selected. Understanding the vulnerability at the local scale is key to planning risk-reduction strategies as well to increasing the local population’s knowledge about flood-related risks and water quality.

1. Introduction

In Kenyan rural areas belonging to the Arid and Semi-Arid Lands (ASALs), water quantity and water quality are major issues for the local population [1,2,3]. Although access to water is the main livelihood concern, water quality has an important impact on health. Therefore, the issue of access to clean and safe water has garnered increased attention.
In North Horr Sub-County, in northern Kenya, water quality is threatened, among others, by nitrate contamination after flooding events.
Flood-related hazards, in fact, are posing serious threats to the local population and are worthy of further study. However, flood-related hazards in Kenya are poorly addressed in the literature. In particular, there is a lack of quantitative flood-related risk and vulnerability assessment, mainly due to scant data issues [4], namely the absence or the difficulty of getting access to data in African countries [5,6,7] as well as problems with data quality (sustainable, continuous, credible, publicly accessible, quality assured dataset) [8]. The most relevant studies are conducted in the framework of vector-borne infectious diseases [9,10,11,12] or water-borne diseases, especially fecal-oral diseases [13,14].
This study focuses on nitrate contamination of water in open shallow water sources due to fecal intrusion following flooding events and nitrate percolation in groundwater. This work evaluates the vulnerability of nitrate (NO3) contamination in open shallow water sources for human and livestock consumption in a scant data context. Understanding the vulnerability to nitrate contamination is pivotal since the consumption of contaminated water can have severe outcomes in humans, such as methemoglobinemia, hypertension, increased infant mortality, central nervous system birth defects, diabetes, spontaneous abortions, respiratory tract infections and changes to the immune system [15,16,17,18,19], as well as methemoglobinemia, spontaneous abortion and even death in livestock [20,21,22].
River and groundwater contamination is generally caused by chemical fertilizer, manure and nitrogenous waste products, all containing nitrogen, used for both agricultural and industrial purposes [23]. Therefore, contamination can affect rural, semi-urban and industrialized areas. In the case here analyzed, the source of nitrates is the deposit of fecal matters. As a consequence of dry climate conditions and pastoralist-related livelihoods, northern Kenya mostly features the availability of open shallow water sources, sometimes found exactly in the riverbed (e.g., open shallow wells) [24]. The seasonal rainfall pattern causes the activation of nitrate contamination hazard. In the case of shallow wells, seasonal streams have an intermittent runoff and pastoralists can let their livestock graze near the well while waiting for watering, allowing the deposit of fecal matter directly into the watercourse. For this reason, there may be direct or indirect contamination of the water source depending on whether “fecal matter is deposited directly into waterways or so close that the potential for wash-in is very high, or via surface runoff and subsurface seepage or drainage” [25]. Although there is certainly a direct pathway of fecal matter in the well during the wet season, it is probable that another means of contamination is nitrate percolation through the permeable surface to the subsurface water reservoir. Nitrate percolation activates during rain events without adequate soil contact time for efficient denitrification and retention [26]. Therefore, soil characteristics modelling is crucial for nitrate vulnerability assessment, but its role in contamination dynamics is not known due to the uniqueness of this means of contamination. Studies in New Zealand focus on nitrate movements along a shallow groundwater flow path in a riparian wetland [26] and on estimating fecal yields from agricultural catchments for water quality purposes [27,28,29]. Another study in Minnesota assesses private wells vulnerability to nitrate leaching, focusing on future extreme rainfall estimates and flood- and nitrate-sensitive well identification [30]. Optimal tools for shallow groundwater risk assessment are the DRASTIC and GOD methods, widely applied in arid contexts [31,32,33,34,35]. The DRASTIC method is considered as one that does not need extensive, site-specific pollution data, but able to provide a solution for evaluating the vulnerability to pollution of groundwater based on known hydrogeological parameters (depth to groundwater, net recharge, aquifer media, soil media, general topography or slope, vadose zone and hydraulic conductivity of the aquifer). The GOD model, indeed, is based on only three parameters (groundwater confinement, overlying strata, and depth to groundwater. However, data availability in a developed context, where the research on nitrate pollution of shallow groundwater is well-developed, is different from a Global South context. In Kenya, these types of data are not available or partially available from project output (difficult to find and obtain) or from a global dataset (based on estimations and not fully reliable). Alternative methods [36,37] require the characteristics of the hazard, i.e., nitrate source yields which are also unknown. In general, therefore, in North Horr Sub-County high spatial and high temporal resolution data, as well as point data, are scarce. Thus, in this paper, a flexible methodology was applied focused on the vulnerability assessment in a scant data context. Since the vulnerability is multidimensional, it is almost impossible to define a universal measurement methodology [38] as well as a finite set of potential indicators [39]. Therefore, using the indications of the Intergovernmental Panel on Climate Change (IPCC) [40,41], nitrate contamination specific sub-indicators of exposure, sensitivity and adaptive capacity were identified and combined in order to obtain the indicator of vulnerability for nitrate contamination hazard in the area. The quantitative approach used in this research to evaluate the vulnerability in the North Horr area is based on a tested methodology [42] applied, for the first time, in a scant data context. Although both qualitative and quantitative methods for the evaluation of the vulnerability from nitrate in open shallow water sources are possible, few studies have tried to tackle the issue with a quantitative approach. The flexible methodology [42] applied aims at linking a quantitative approach with the socio-economic aspect evaluation [40]. This innovative approach introduces new results about the analysis of the water sources’ vulnerability in North Horr Sub-County.
The result of this research may be relevant for other researchers, since this methodology applies to different types of scant data contexts and risks, as well as to decision makers in Marsabit County as an evaluation tool for the measures undertaken to face water issues contained in the development plan.
The remaining part of the paper proceeds as follows. Section 2 gives an overview of the study area and specific key information on the context on which the analysis is based, as well as information on the materials used; Section 3, separated for clarity reasons from Section 2, addresses the methodology of the analysis and the specific issues regarding the construction of sub-indicators of exposure, sensitivity and adaptive capacity. In Section 4, the main results are analyzed and discussed. Section 6 presents the conclusion of this research.

2. Materials

In a scant data context, like in the northern part of Kenya, availability of data is a pivotal issue. The materials here used have two different types of source: public structured data, i.e., climatic data, demographic data, spatial data, and planning strategies and data collected in the framework of projects. In particular, data on water sources are retrieved from the One Health platform, developed by the Italian start-up TriM (at the moment only for internal use) in the framework of the One Health project (http://www.ccm-italia.org/one-health-uomo-animale-ambiente-north-horr-2) and from the international organization Concern Worldwide (https://www.concern.net/) which shared data collected in a joint campaign with governmental institutions. Except for soil-related data, the data collected were post-processed to construct geo-referenced data in the form of a point vector defined at village or water-source level.
In addition, the limiting factors regarding nitrate behavior, mainly due to scant data context, are identified and assessed. Nitrate behavior in soils, indeed, is dependent on soil characteristics of drainage and texture to consider its transport to groundwater. The role of nitrate degradation was intentionally left out. Attenuation factors like denitrification processes and dilution can occur in the aquifer and influence nitrate concentration [43]. However, the kinetic of nitrate reduction is likely a zero-order reaction and estimations are very low (μM/L per year) [44]. For this reason and for a precautionary hypothesis, denitrification processes are not taken into consideration. Dilution processes are already assessed through the sub-indicators of physical drought exposure and catchment area.

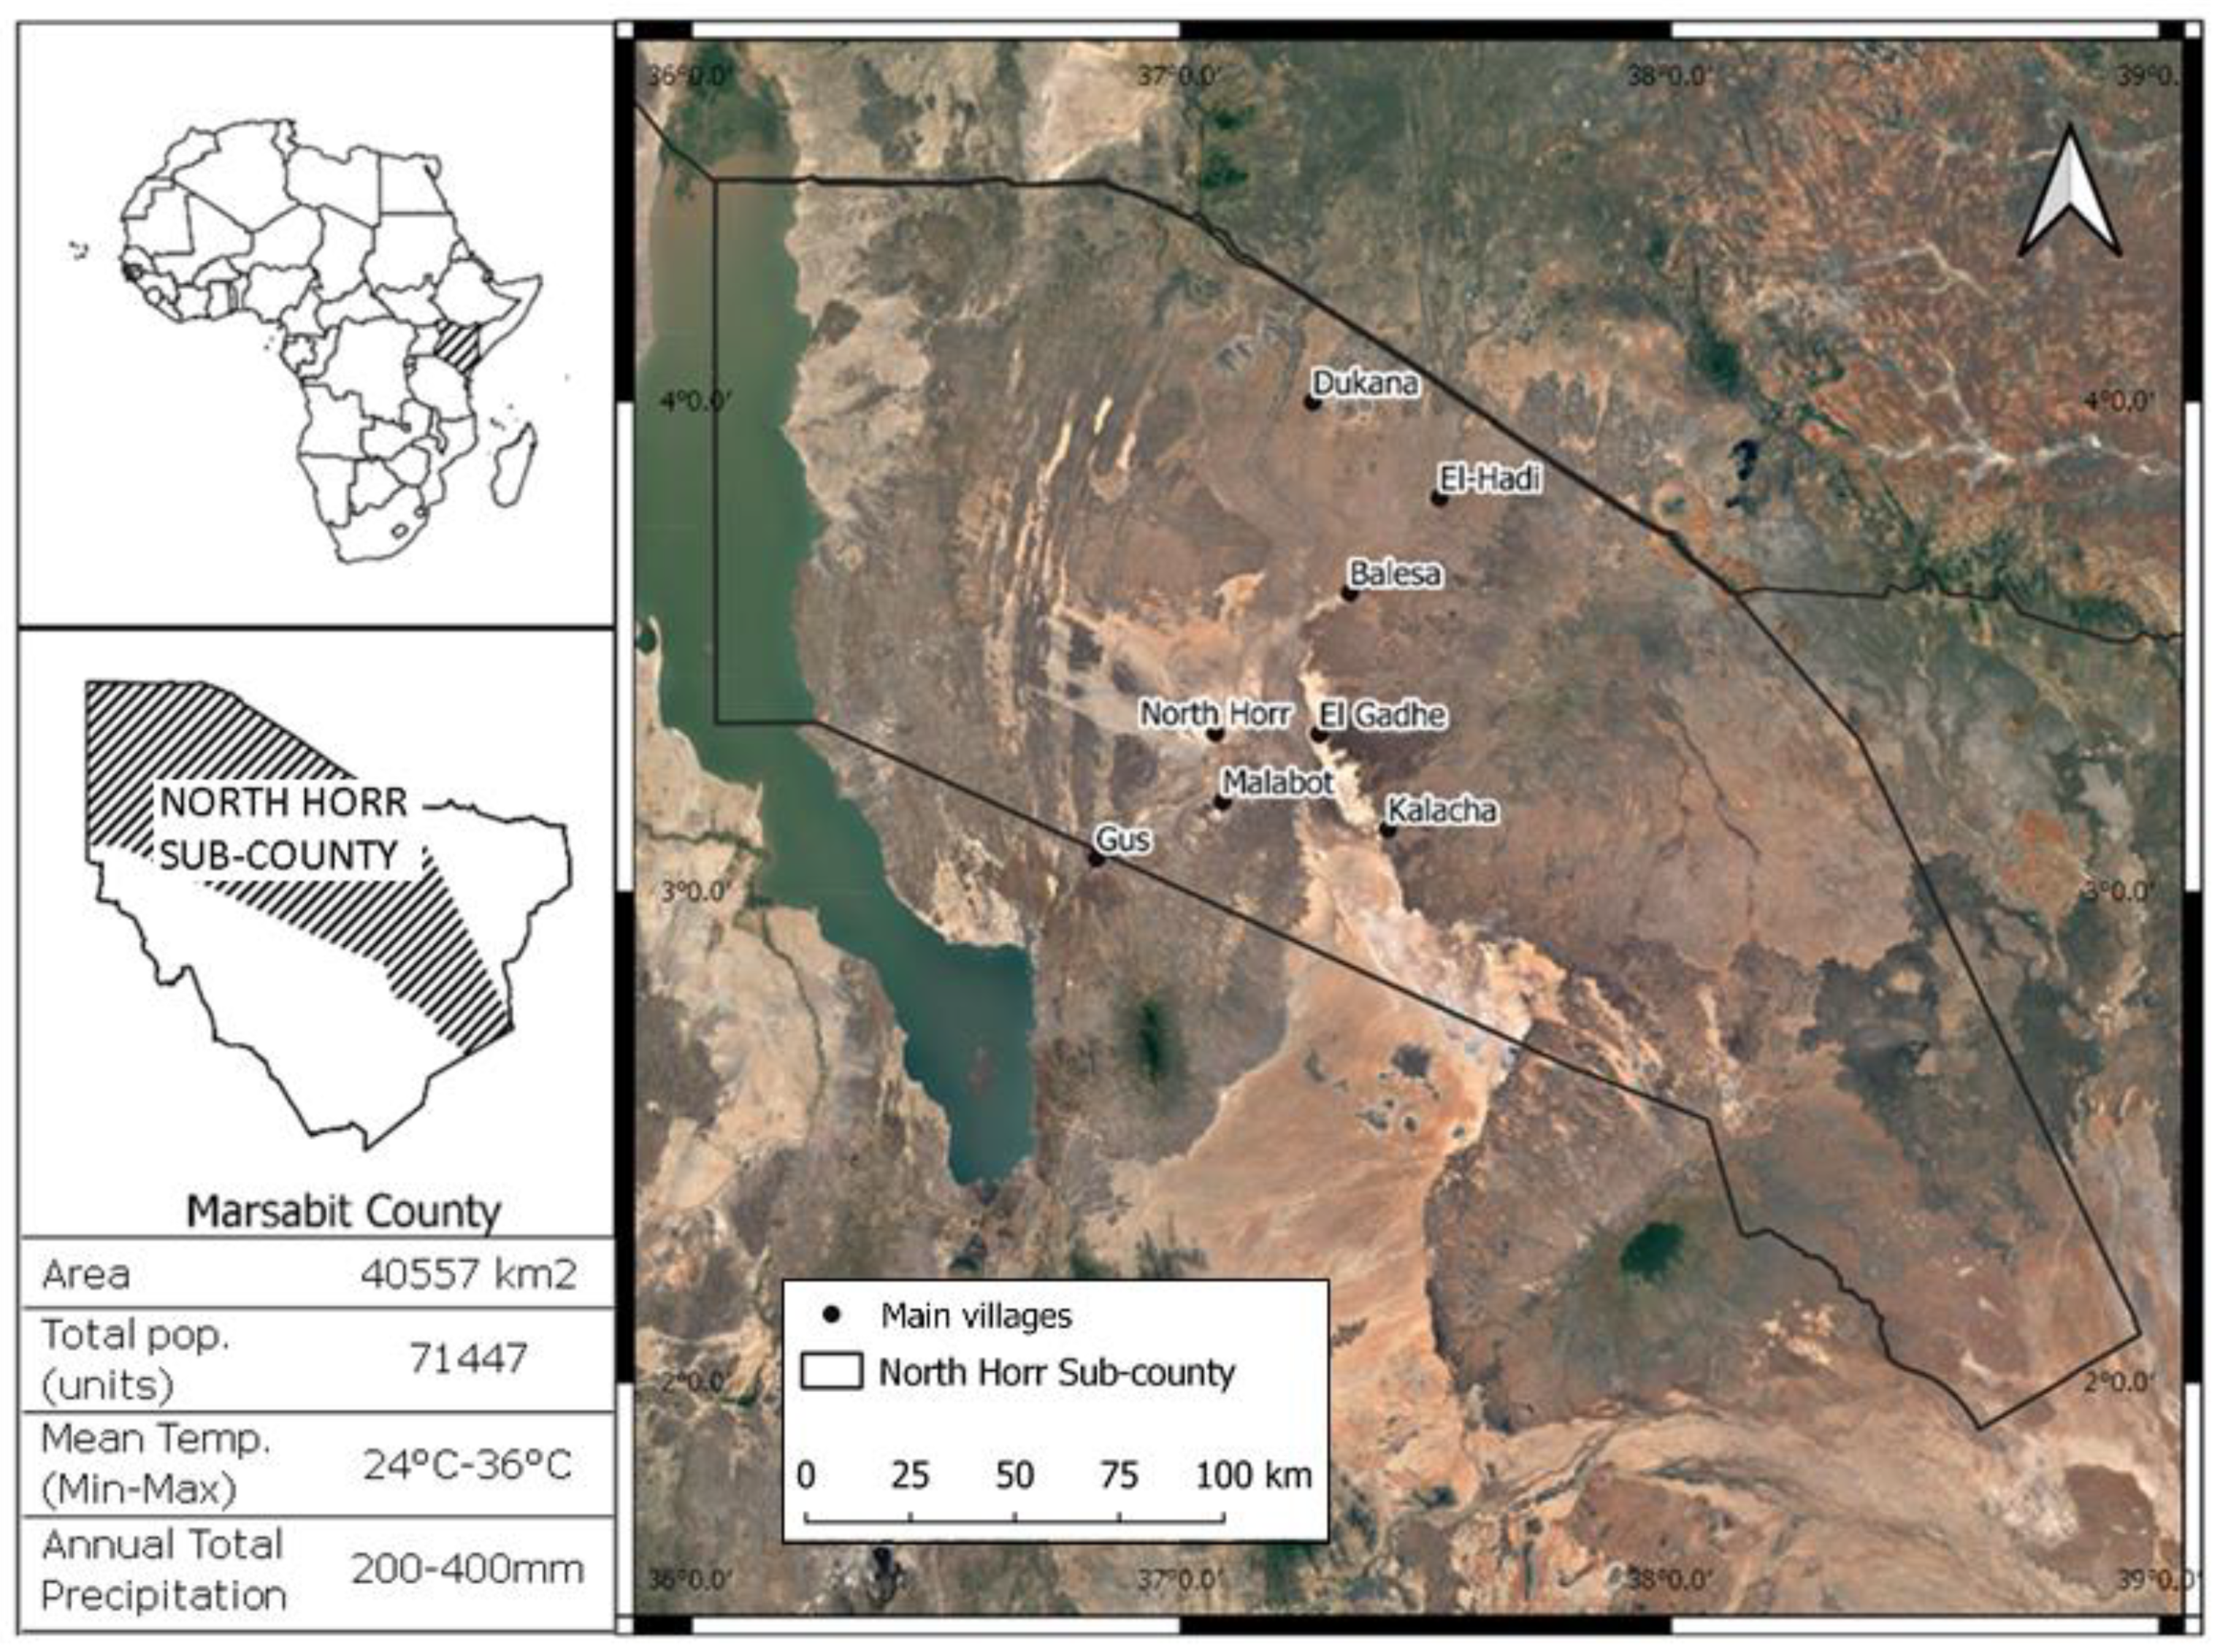
2.1. Study Area: Geographic Positioning and Climatic Context

The area covered by this study (Figure 1) is North Horr Sub-County (Marsabit County) in the northeastern region with a particular focus on the surrounding area of eight main villages.
This region is considered as part of the ASALs since the area is mostly desert and partially covered by a shrub savannah. Local communities are mostly nomadic pastoralists breeding camels, sheep, and goats with traditional extensive livestock practice. This practice relies only on naturally available resources of pastures and water and requires energy-intensive movements of herds. From the onset of the dry season, pastoralists move to the so-called fora pastures and can walk distances up to 40 km to reach the watering points.
Rainfalls have a bimodal pattern (two rainy seasons alternated with two dry seasons) and a high variability of rainfall due to cycles of wet periods and droughts, although the variations of these events are not well known [45,46,47].
For clarity reasons, we will here refer to the example of shallow wells. However, the existence of other shallow water sources is based on similar characteristics. In this region, due to the bimodal rainfall pattern, watercourses have a seasonal pattern and runoff can appear once or twice a year [24]. During the rainy season, the seasonal stream’s flow is restored and the wells in the riverbed are completely inundated. During the dry season, the water supply is provided by wells dug exactly in the streambed. However, the water extracted is not withdrawn from subsurface runoff, but from the porosity of sand substrates or cones of depression trapped between upward dykes formed of clay soil [24,48]. Those water sources are used both for human and livestock consumption and water can be extracted by hand or by means of motor pumps. For watering purposes, herds of livestock descend the riverbank and wait for their turn, also for hours, close to the well. Therefore, fecal matter can be left directly in the riverbed while waiting for watering. When the stream’s flow is restored, nitrate contamination occurs through direct invasion of the fecal matter in the well, added to an indirect component of nitrate percolation in the ground. Thereby, settling water is infected when the water level decreases under the ground level. Then, after the onset of the dry season, water withdrawal and evapotranspiration cause water reduction in the well. Therefore, the concentration of nitrates increases. This process recurs at each season change from wet to dry season.

2.2. Climatic Data

Precipitation data are the result of a quantile mapping bias correction applied to the Kenya Meteorological Department precipitation gridded dataset [49]. Precipitation data cover the study area with high resolution (0.0375 × 0.0375 degrees) for the period 1983–2014 with a decadal temporal resolution.

2.3. Demographic Data

Population data are derived from the National Census 2019 [50]. However, there may have been underestimation bias due to severe difficulties in taking a census in an area where people are mainly nomadic with very low population density of about 4 persons per square kilometer. The Kenya National Bureau of Statistic itself declared that the enumeration of nomadic pastoralist population is complex and therefore may lead to population underestimation in ASALs.

2.4. Water Sources

Water sources in the area are mainly represented by boreholes, shallow wells and pans [51], while piped coverage remains limited [52]. Moreover, 66% of sources have contaminated water, which must be treated before drinking [53].
Water resources and allocation data of all kinds are theoretically available for purchase from Kenya governmental agencies, but in reality these data are often difficult or impossible to obtain [54].
Therefore, water source data, the categories of shallow wells, earth pans and rock catchments are retrieved by the One Health platform and through the Concern Worldwide survey. The Second County Integrated Development Plan for Marsabit establishes the presence of 220 shallow wells, 50 pans and 10 rock catchments in the whole North Horr Sub-County. Through the One Health platform and through Concern Worldwide survey, 54 shallow wells, 6 earth pans/dams and 2 rock catchments are identified and analyzed for nitrate contamination vulnerability in the study area (Table 1). Even if shallow wells are the target for the analysis of nitrate contamination vulnerability, earth pans/dams and rock catchments are also taken into consideration as they are subjected to the same conditions of openness, lack of area protection and confinement.

2.5. Hydraulic Conductivity

The factors that influence the transport and accumulation of nitrate from the land surface to ground water include sediments, rock type and landscape characteristics [43]. However, land characteristics (land use and slope) are here considered negligible factors. The transport capacity of an aquifer is introduced and defined by the fundamental property of hydraulic conductivity (HC) [55]. In fact, the greater the hydraulic conductivity related to the permeability and porosity of the soil, the higher the resulting nitrate infiltration to shallow underground reservoir. The variables taken into consideration are:
  • Vertical HC or texture: Texture class (USDA system [56]) at 7 standard depths predicted using the global compilation of soil ground observations (available at www.isric.org/explore/isric-soil-data-hub).
  • Lateral HC or drainage: Drainage classes are defined according to the Guidelines for Soil Description [56] predicted using the Africa Soil Profiles Database: Very poor, Poor, Imperfect, Moderate, Well, Somewhat Excessive, Excessive (available at www.isric.org/explore/isric-soil-data-hub).

2.6. Civil and Hydraulic Structures
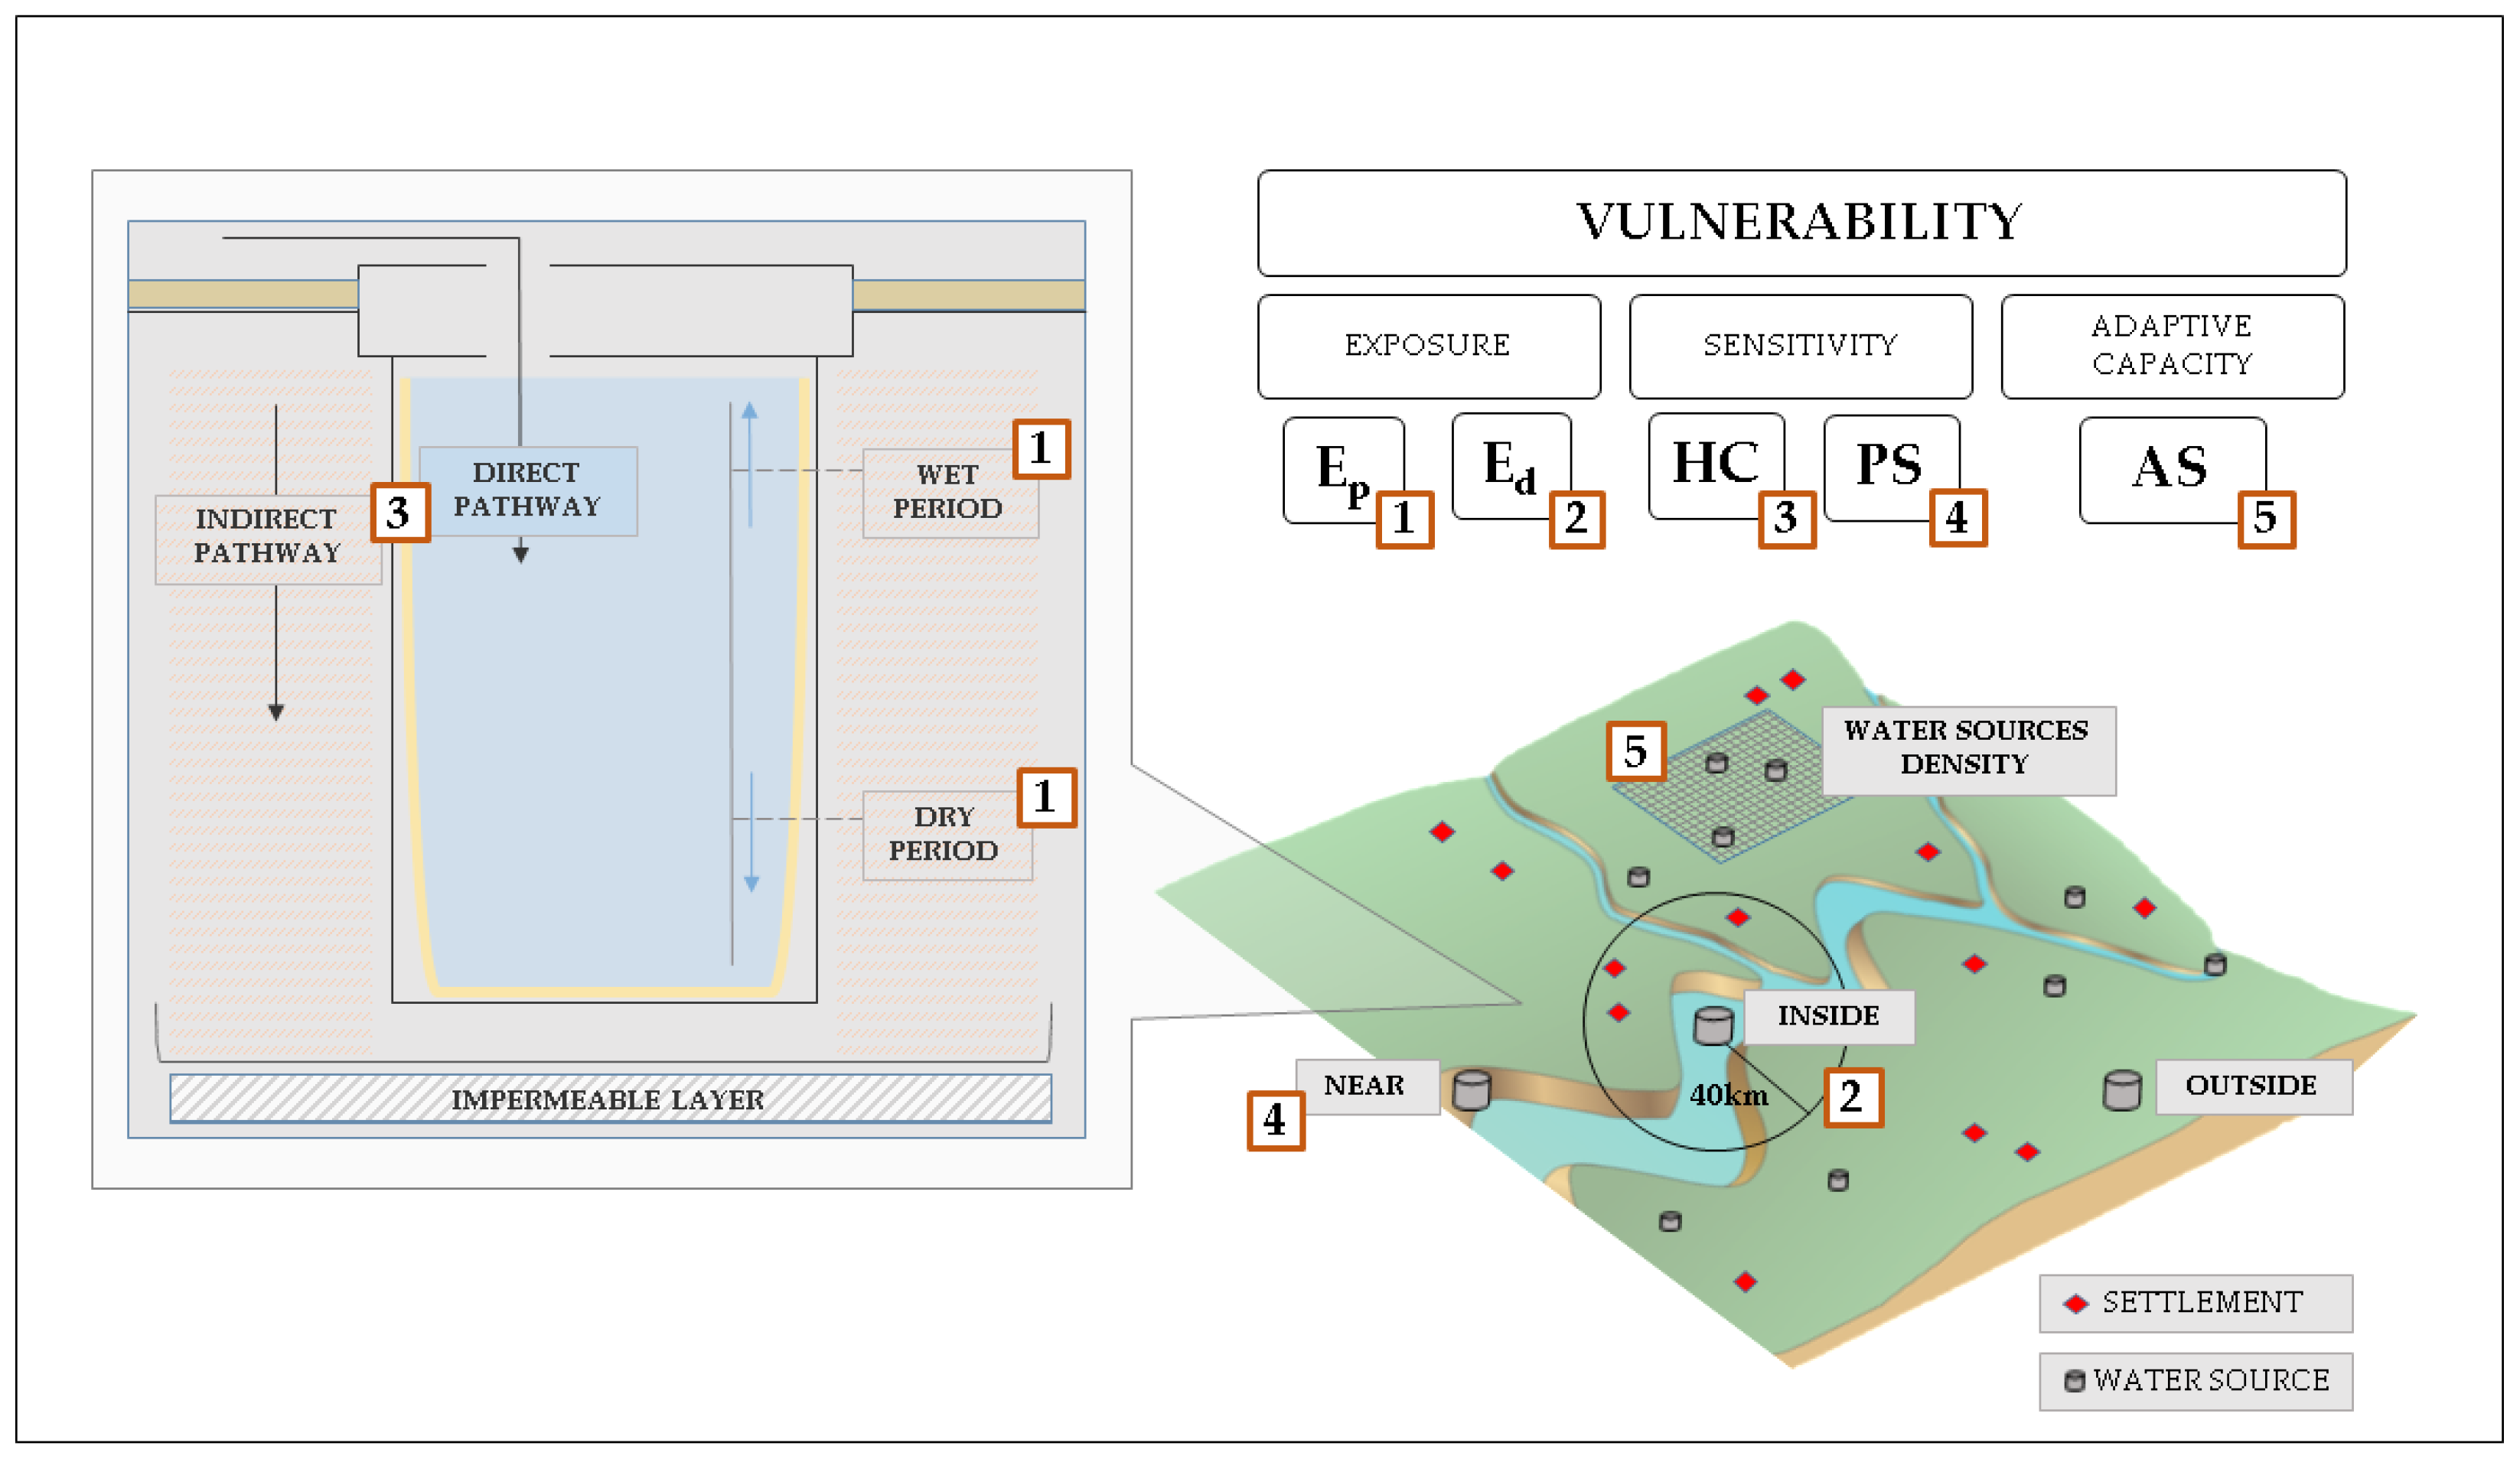
The proposed analysis investigates the vulnerability at water-source level. In order to understand future changes in water source density, attention is drawn to the actions contained in the Marsabit Second County Integrated Development Plan 2018–2022 (SCIDP) [53]. Among the measures that will be undertaken, only new water sources or rehabilitation of existing water sources contained in the SCIDP are taken into consideration.

3. Methods

This study on spatial vulnerability assessment for nitrate contamination of shallow wells in riverbed is based on the identification of the IPCC approach [40,41]. In particular, the concept of vulnerability refers to “the propensity of exposed elements such as human beings, their livelihoods, and assets to suffer adverse effects when impacted by hazard events” and can be seen as a situation-specific determinant of risk [41].
Therefore, considering the context and the hazard, the model used is [42]:
V = E x S A C
Both the Exposure (E) and the Sensitivity (S) represent the negative effects of the changing conditions, while the indicator of Adaptive Capacity (AC) is the parameter which may counteract the negative effect of the impact and therefore improves the vulnerability.
Figure 2 presents an overview of the vulnerability assessment model describing the sub-indicators taken into consideration for the construction of this quantitative vulnerability analysis. As previously mentioned, nitrate contamination of open shallow water sources is a climate-driven issue since the wet periods activate contamination pathways and dry periods reduce the contaminant-to-solution ratio (1). The maximum number of settlements, potentially using the water source, is introduces as a two-way sub-indicator considering the exposure of these settlements and the pressure they bring on water sources (2). Moreover, as highlighted by the literature on the topic, nitrate contamination can occur through direct or indirect pathways (3), therefore sub-indicators of lateral and vertical hydraulic conductivity are taken into consideration. The location of the open shallow water sources (inside, outside or near the stream) (4) is introduced as a sensitivity factor while the adaptation strategies are evaluated through the water sources density (5).
Technical details on the sub-indicators of Exposure, Sensitivity and Adaptive Capacity are provided in Table 2.
The indicators of Exposure, Sensitivity, Adaptive Capacity and Vulnerability are represented with a pixel-based visualization with a resolution of 230 m (based on the highest resolution represented by the Drainage and Texture sub-indicators’ raster resolution), depending on the location of water points, with the aim of providing a local scale vulnerability analysis.

3.1. Exposure

3.1.1. Physical Exposure: Standardized Precipitation Index (SPI) for Drought and Flood Assessment

The SPI [57] is recommended as the main meteorological drought index from the World Meteorological Organization (WMO) [58]. The SPI is used to measure the degree of drought and flood stress through a quantitative description method [42,59,60]. The contamination process, indeed, is influenced both by wet and dry periods. The nitrates contained in fecal matter deposited by livestock contaminate the water through direct and indirect pathways that activate in the wet season. The degree of intensity of the dry period influences the water level in the water source, thus, the contaminants-to-solution ratio. Using the SPI, it is possible to detect the susceptibility of the area to wet and dry conditions.
The single parameter required for its calculation is the precipitation (Equation (2)) and it is generally used as an effective and simple tool for drought assessment. The SPI index can be calculated for different time scales (from 1 to 24 months) in order to assess different drought types and wetness conditions [61,62]. Short time scales (1 to 3 months) are mainly related to soil water content and river discharge in headwater areas; medium time scales (3 to 12 months) are related to reservoir storages and discharge in the medium course of the rivers; long time scales (12 to 24 months) are related to variations in groundwater storage.
S P I = P P σ p
where P is the monthly precipitation (in mm), P is mean monthly precipitation (in mm) and σp is the standard deviation of precipitation.
The SPI index was calculated at village level and for the three existing stations present in a 250 km radius (Lodwar, Marsabit and Moyale town) using the SPI program (available online at www.drought.unl.edu/droughtmonitoring/SPI/SPIProgram.aspx). The SPI index is calculated using the BCKMD dataset, a bias-corrected satellite-derived precipitation dataset based on the KMD dataset (issued by the official national meteorological service dataset, available at http://kmddl.meteo.go.ke:8081/SOURCES/.KMD/) corrected with the GPCC [49].
The SPI index was computed for different time scales depending on the target. For drought detection the 3-month, 6-month and 12-month time scales were computed, while for flood detection the 1-month and 3-month time scales were detected. Specific weight and ranking values were calculated for drought or flood severity and drought or flood frequencies following the method proposed by [63] for drought risk assessment and already applied in risk assessment studies [42]. Using this methodology, the value of the weighted SPI can range from a minimum of 0 to a maximum value of 24.
A known limit of the proposed approach is the presence of many zero rainfall accumulations due to the arid climate. However, if there are many historical zero rainfall accumulations, the estimated gamma distribution may not adequately fit the frequency distribution of the historical rainfall. Therefore, in arid regions, the SPI indicator should be interpreted with care [64]. Despite this, the use of monthly cumulative precipitation in this research significantly reduces the number of zero rainfall accumulations and the analysis of SPI is reliable.

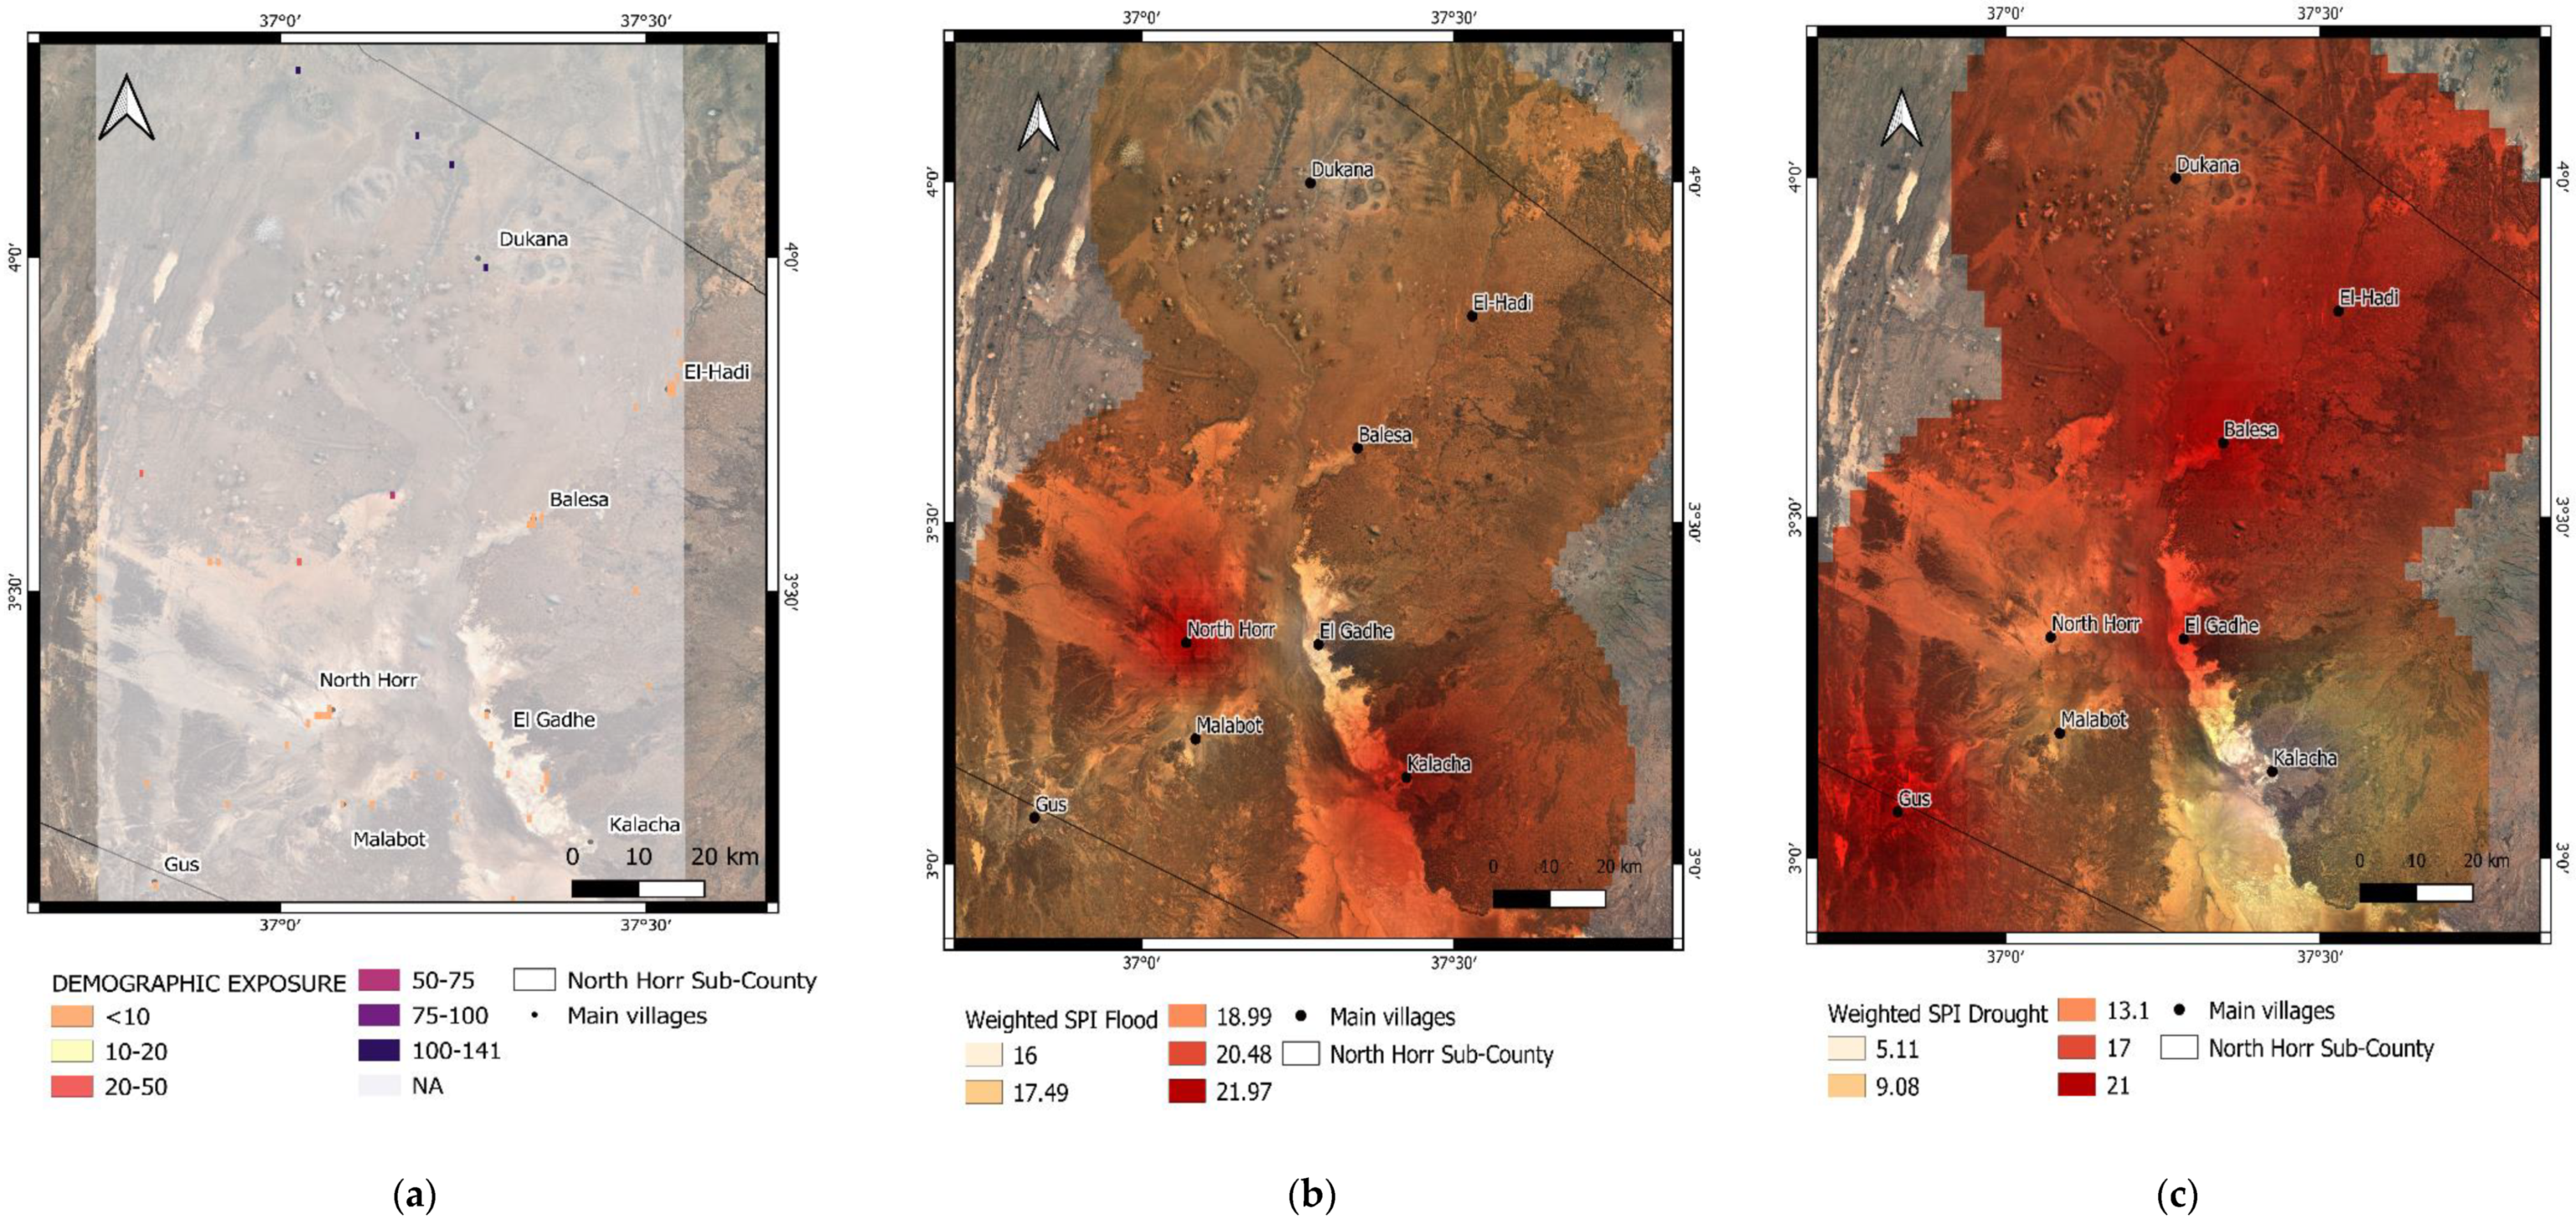
3.1.2. Demographic Exposure

Nitrate contamination affects human and animal populations. However, statistics on animal population are only partially or not at all available. For this reason, since the local population is mainly part-devoted to pastoralism, we can estimate a proportion between human and animal population and we could assume that the greater the human population is, the greater the number of animals would be. However, due to the low population density of the area, the number of settlements was used instead. To understand the sensitivity of the water sources, the demographic exposure was quantified as the potential maximum number of settlements relying on a single water source. In this area, the pastoralists can walk up to 40 km to water their animals. The people in each settlement in a radius of maximum 40 km can potentially reach the water source. However, they would prefer the nearest sources and then gradually move to farther sources. Therefore, the counting of settlements relying on the water source (Nsettlements) is weighted using the inverse of the distance between each settlement and the water source (dx).
N s e t t l e m e n t s =   x = 1 n 1 d x
Thus, settlements that are closer to the water source have higher weights, while the farther ones have lower weights. The values of the weighted maximum number of settlements potentially using the water source range from 1.2 (minimum value) to 480 (maximum value).

3.2. Sensitivity

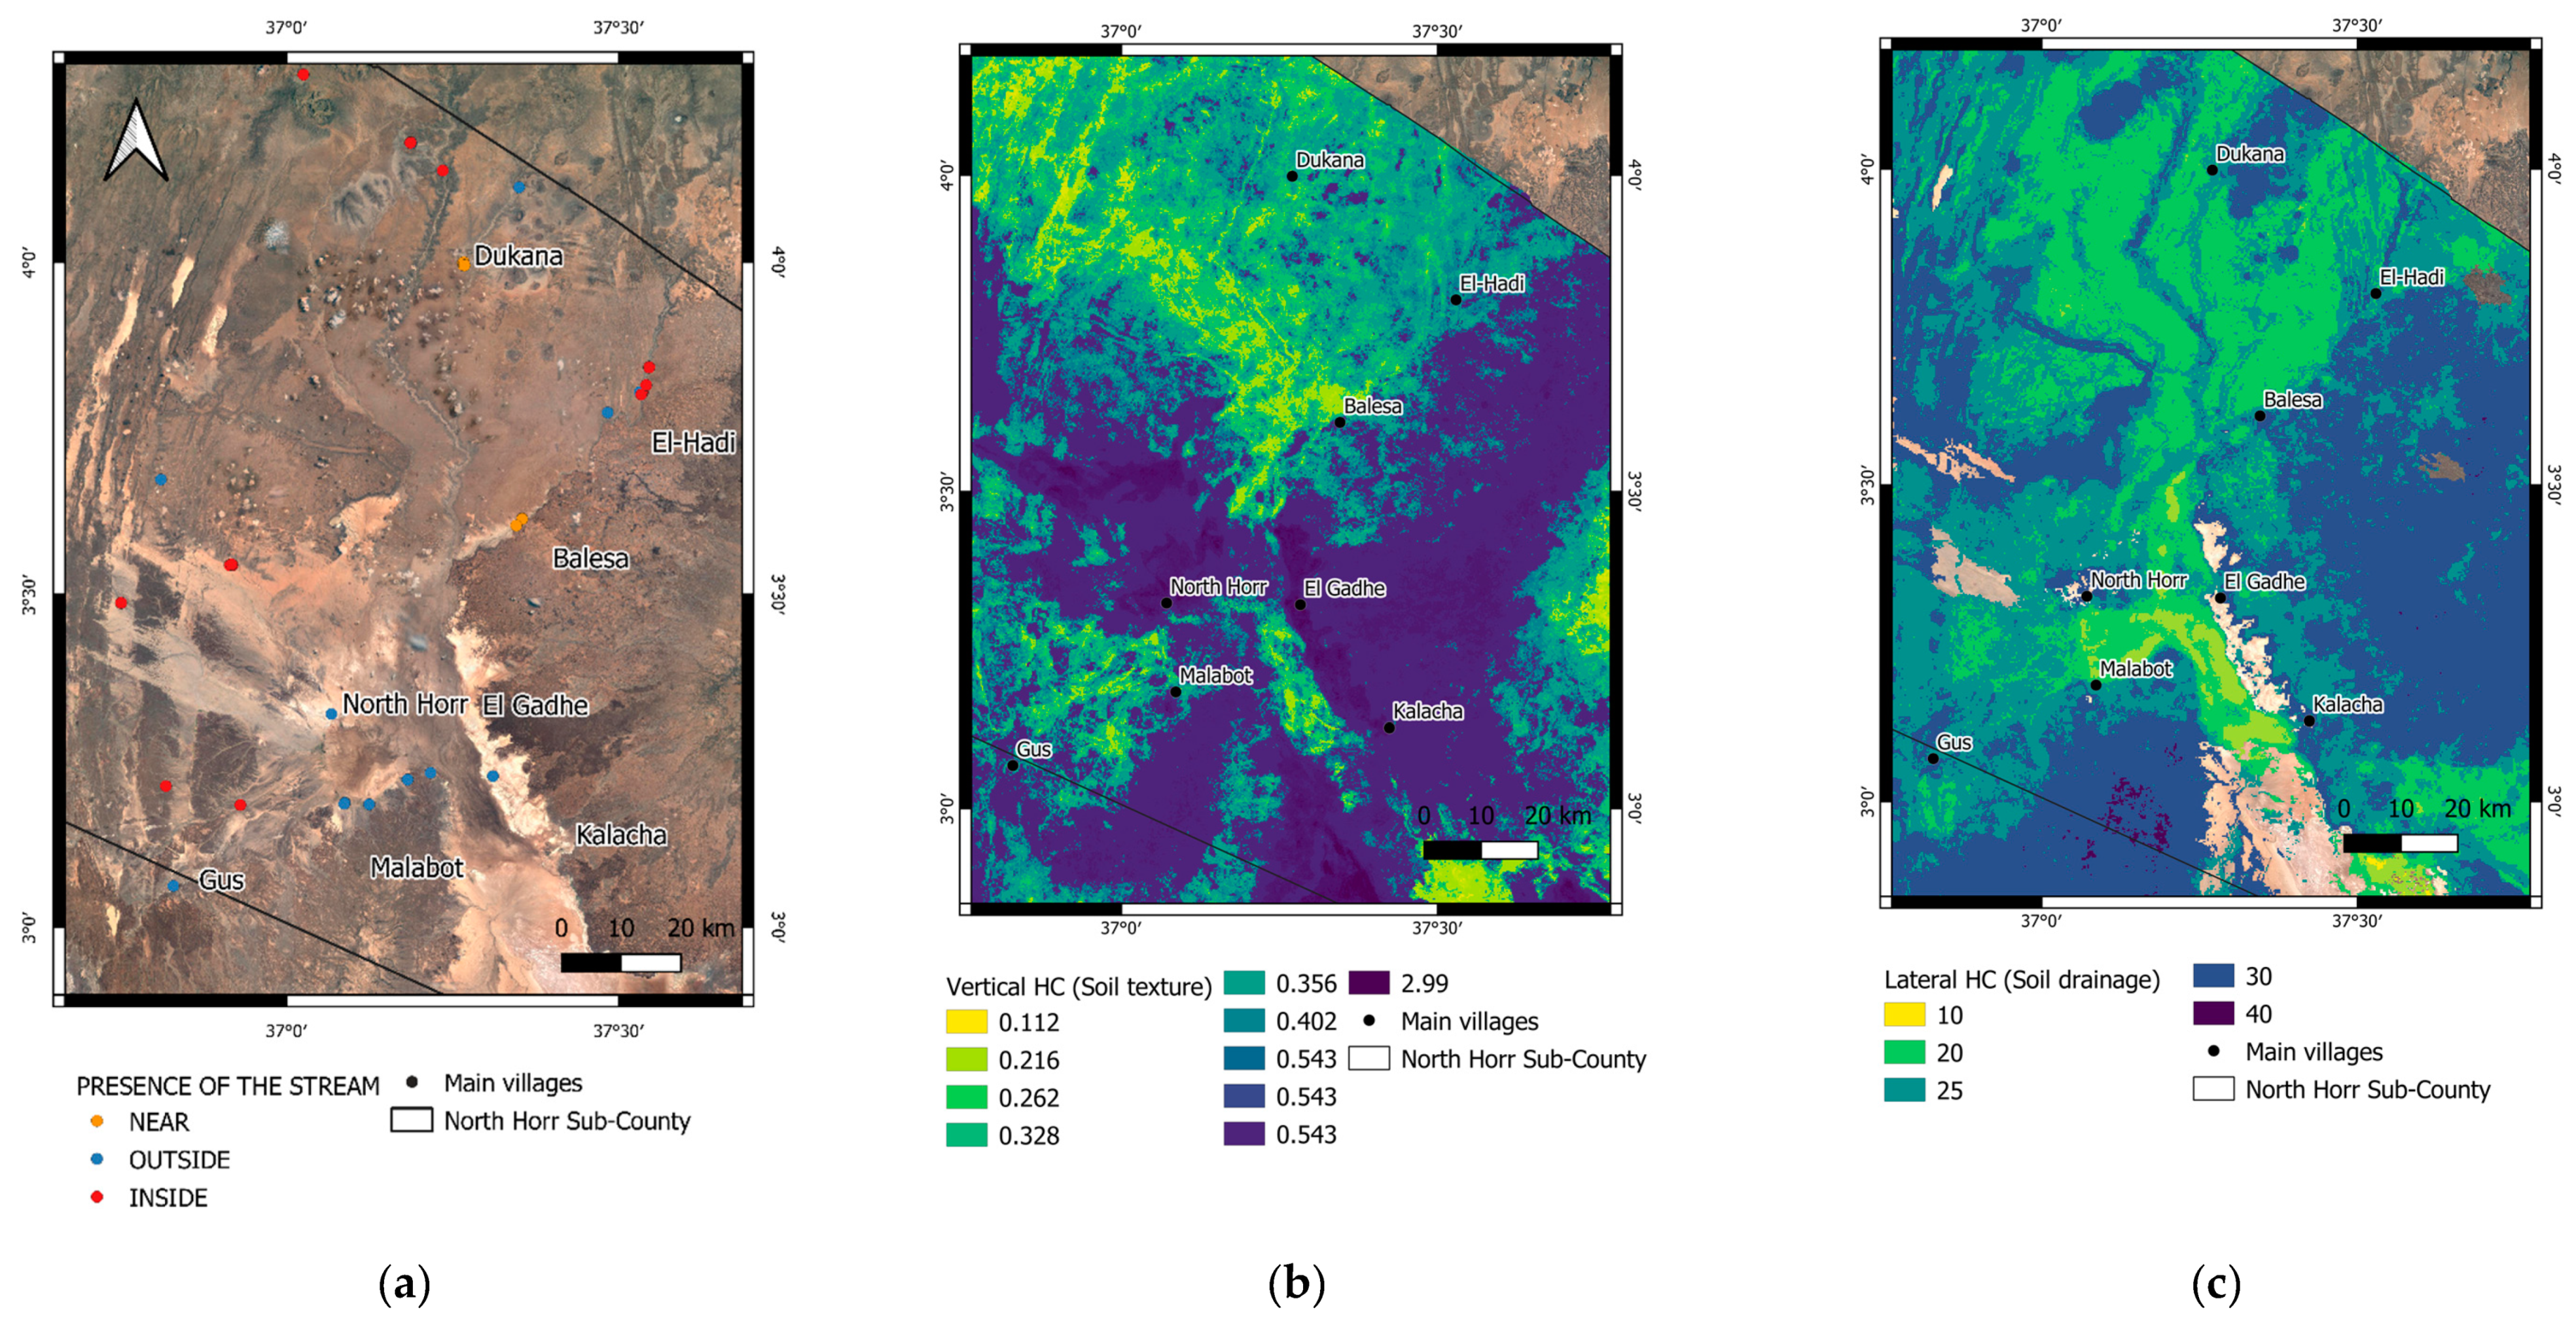
3.2.1. Presence of the Stream

The presence of the stream constitutes a sensitivity sub-indicator due to the already explained contamination dynamics. In fact, the water points situated in the riverbed are highly sensitive, the water points near the stream are moderately sensitive, the water points and springs far from the riverbed show a low sensitivity (classified as “outside”). The inside/near/outside classification of the different water sources is made through the direct comparison of satellite images and the geo-referenced water sources since this operation would not have been possible with automatic processes. The sensitivity is then expressed through quantitative weights (adapted from [65]) (Table 3).

3.2.2. Hydraulic Conductivity

Soil texture and soil drainage classes were reclassified according to coefficients of vertical [66] and lateral [67] hydraulic conductivity respectively (Table 4 and Table 5). The soil texture sub-indicator was then averaged across the seven layers to obtain a single vertical HC layer.

3.3. Adaptive Capacity

The evaluation of the adaptation strategies focused on adaptation actions rather than the development or improvement of the institutional framework since they are long-period approaches or other strategies like risk-transfer methods since they are not problem-solving oriented. Other strategies to avoid vulnerability issue like local and conventional actions were discarded. In fact, local strategies in the ASALs against water scarcity mostly rely on traditional adaptation mechanisms, above all, the adoption of nomadic life or increase of watering distance as closer waterpoints are depleted [68]. Conventional adaptation strategies, such as restriction of water use in pans and boreholes during rainy season until surface runoff has been exhausted, controlling the number of livestock that access the pans and boreholes, and paying infrastructure maintenance fees to help increasing water availability for longer periods, are sparsely adopted. However, a more sedentary life and demographic increase are threatening water availability in inhabited areas [69]. For these reasons, the limits of local adaptation capacity must be overcome through the adaptive actions set in place by local governmental institutions. Based on the SCIDP [53], there are eight actions that contribute to the improvement of water sources: installation of gensets and solar panels, construction of shallow wells, supply of fresh and clean piped water, drilling of boreholes, installation of water towers, construction of a dam, installation of underground tanks piped water filled, water trough (Table 6).
Compared to the current adaptation scenario (AC0), the implementation of the actions stated in the SCIDP will move to a future adaptation scenario (AC1). Therefore, two adaptation scenarios were constructed (AC0 and AC1) where the water sources density in the project area is used as proxy of the sub-indicator of the walking distance to water sources as suggested by [70]. The AC0 scenario, thus, represents water source density ante-SCIDP and the AC1 scenario represents water source density (i.e., ante-SCIDP water sources plus new water sources planned) post-SCIDP.

3.4. Vulnerability

The vulnerability is the summary indicator obtained from the combination, based on Equation (1), of the previously analyzed indicators and sub-indicators. Each indicator (Exposure, Sensitivity and Adaptive Capacity) was rasterized (WGS 84/UTM zone 37 N, 230 m × 230 m) and normalized in the range 0–10 to be comparable. Then, Exposure and Sensitivity were multiplied together obtaining the potential impacts and finally divided by the Adaptive Capacity counteracting the negative effects of the impacts. As per the scale interpretation, high values correspond to high values of each indicator and of vulnerability.

4. Results

4.1. Exposure

4.1.1. Demographic Exposure

The water sources in the surroundings of Dukana show a higher weighted number of settlements and therefore these are the most exposed areas in North Horr Sub-County (see Figure 3a). Some water sources in the western part of the sub-county have a medium demographic pressure. The rest of the water sources are less stressed.

4.1.2. Weighted SPI Index

Although there is a suitable timescale for each specific context, it may be helpful to present results for alternative timescales [71] to observe the variability of the index. SPI index weighted for each main village and station shows different performance according to the time scale (Table 7).
The following considerations on the choice of the timescale for detecting flood and drought spells are since, at this latitude, rainfalls are concentrated into two seasons of three months each. Rain events that trigger fecal matter intrusion in shallow water are extreme events. The 1-month SPI can assess deviation from normal monthly cumulated precipitation better than the 3-month SPI, which can better assess seasonal deviations. Therefore, the 1-month SPI was used as a sub-indicator for physical flood exposure, as it can detect areal susceptibility to wetness conditions (see Figure 3b). The 6-months SPI was preferred to the 3- and 12-month timescale as it can detect two consecutive dry seasons and potentially the onset of a drought period. Therefore, we used it as the sub-indicator for physical drought exposure as it can be very effective in showing reduced streamflow and reservoir levels (see Figure 3c).

4.2. Sensitivity

4.2.1. Presence of the Stream

The greatest number of water sources that are situated exactly in the riverbed is found in the North and in the East of the sub-county. Therefore, this is where it is possible to find the open water sources that are more sensitive to nitrate contamination (see Figure 4a).

4.2.2. Hydraulic Conductivity

The two sub-indicators of hydraulic conductivity (vertical and lateral hydraulic conductivity) describe the permeability to contaminants in the area. In the lowlands in the central-southern part of the North Horr Sub-County there are the greatest rate of vertical hydraulic conductivity due to the presence of the northern part of the Chalbi desert. In the northern part of the sub-county, the vertical hydraulic conductivity decreases with the increase of the altitude (see Figure 4b).
Regarding the lateral hydraulic conductivity, higher values of drainage are found along the watercourses and in the highlands at the starting points of the watersheds (see Figure 4c).

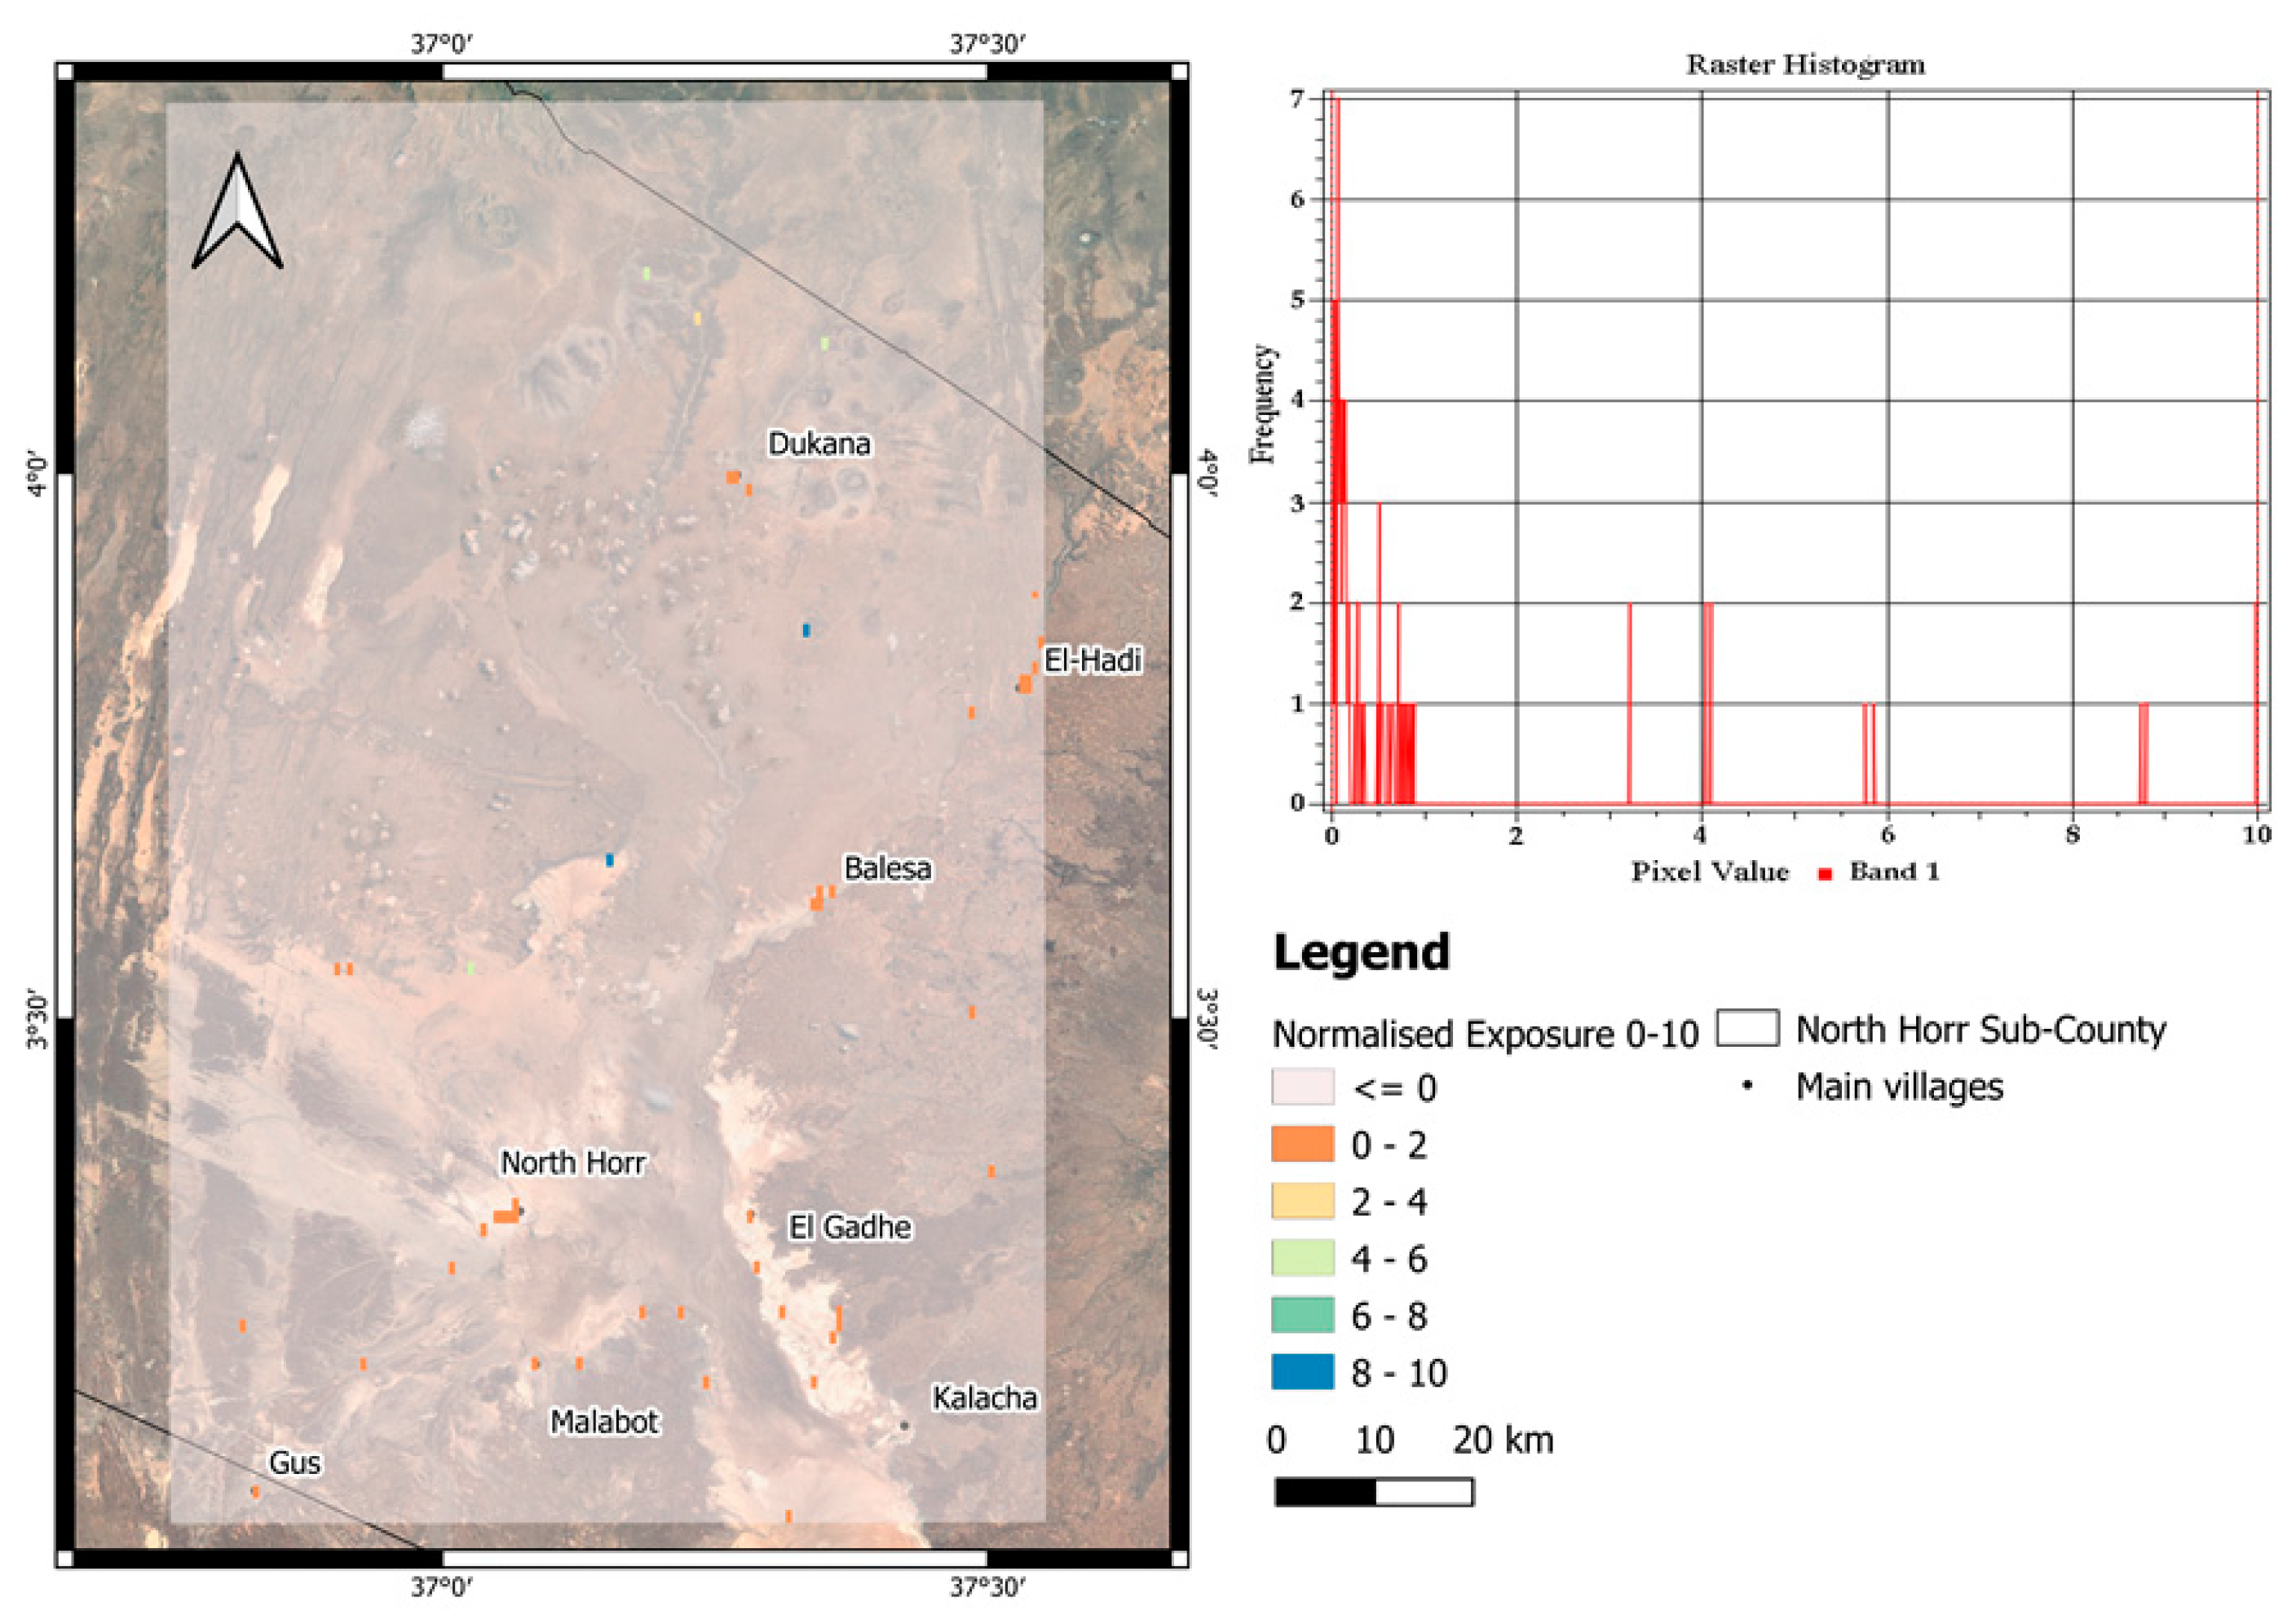
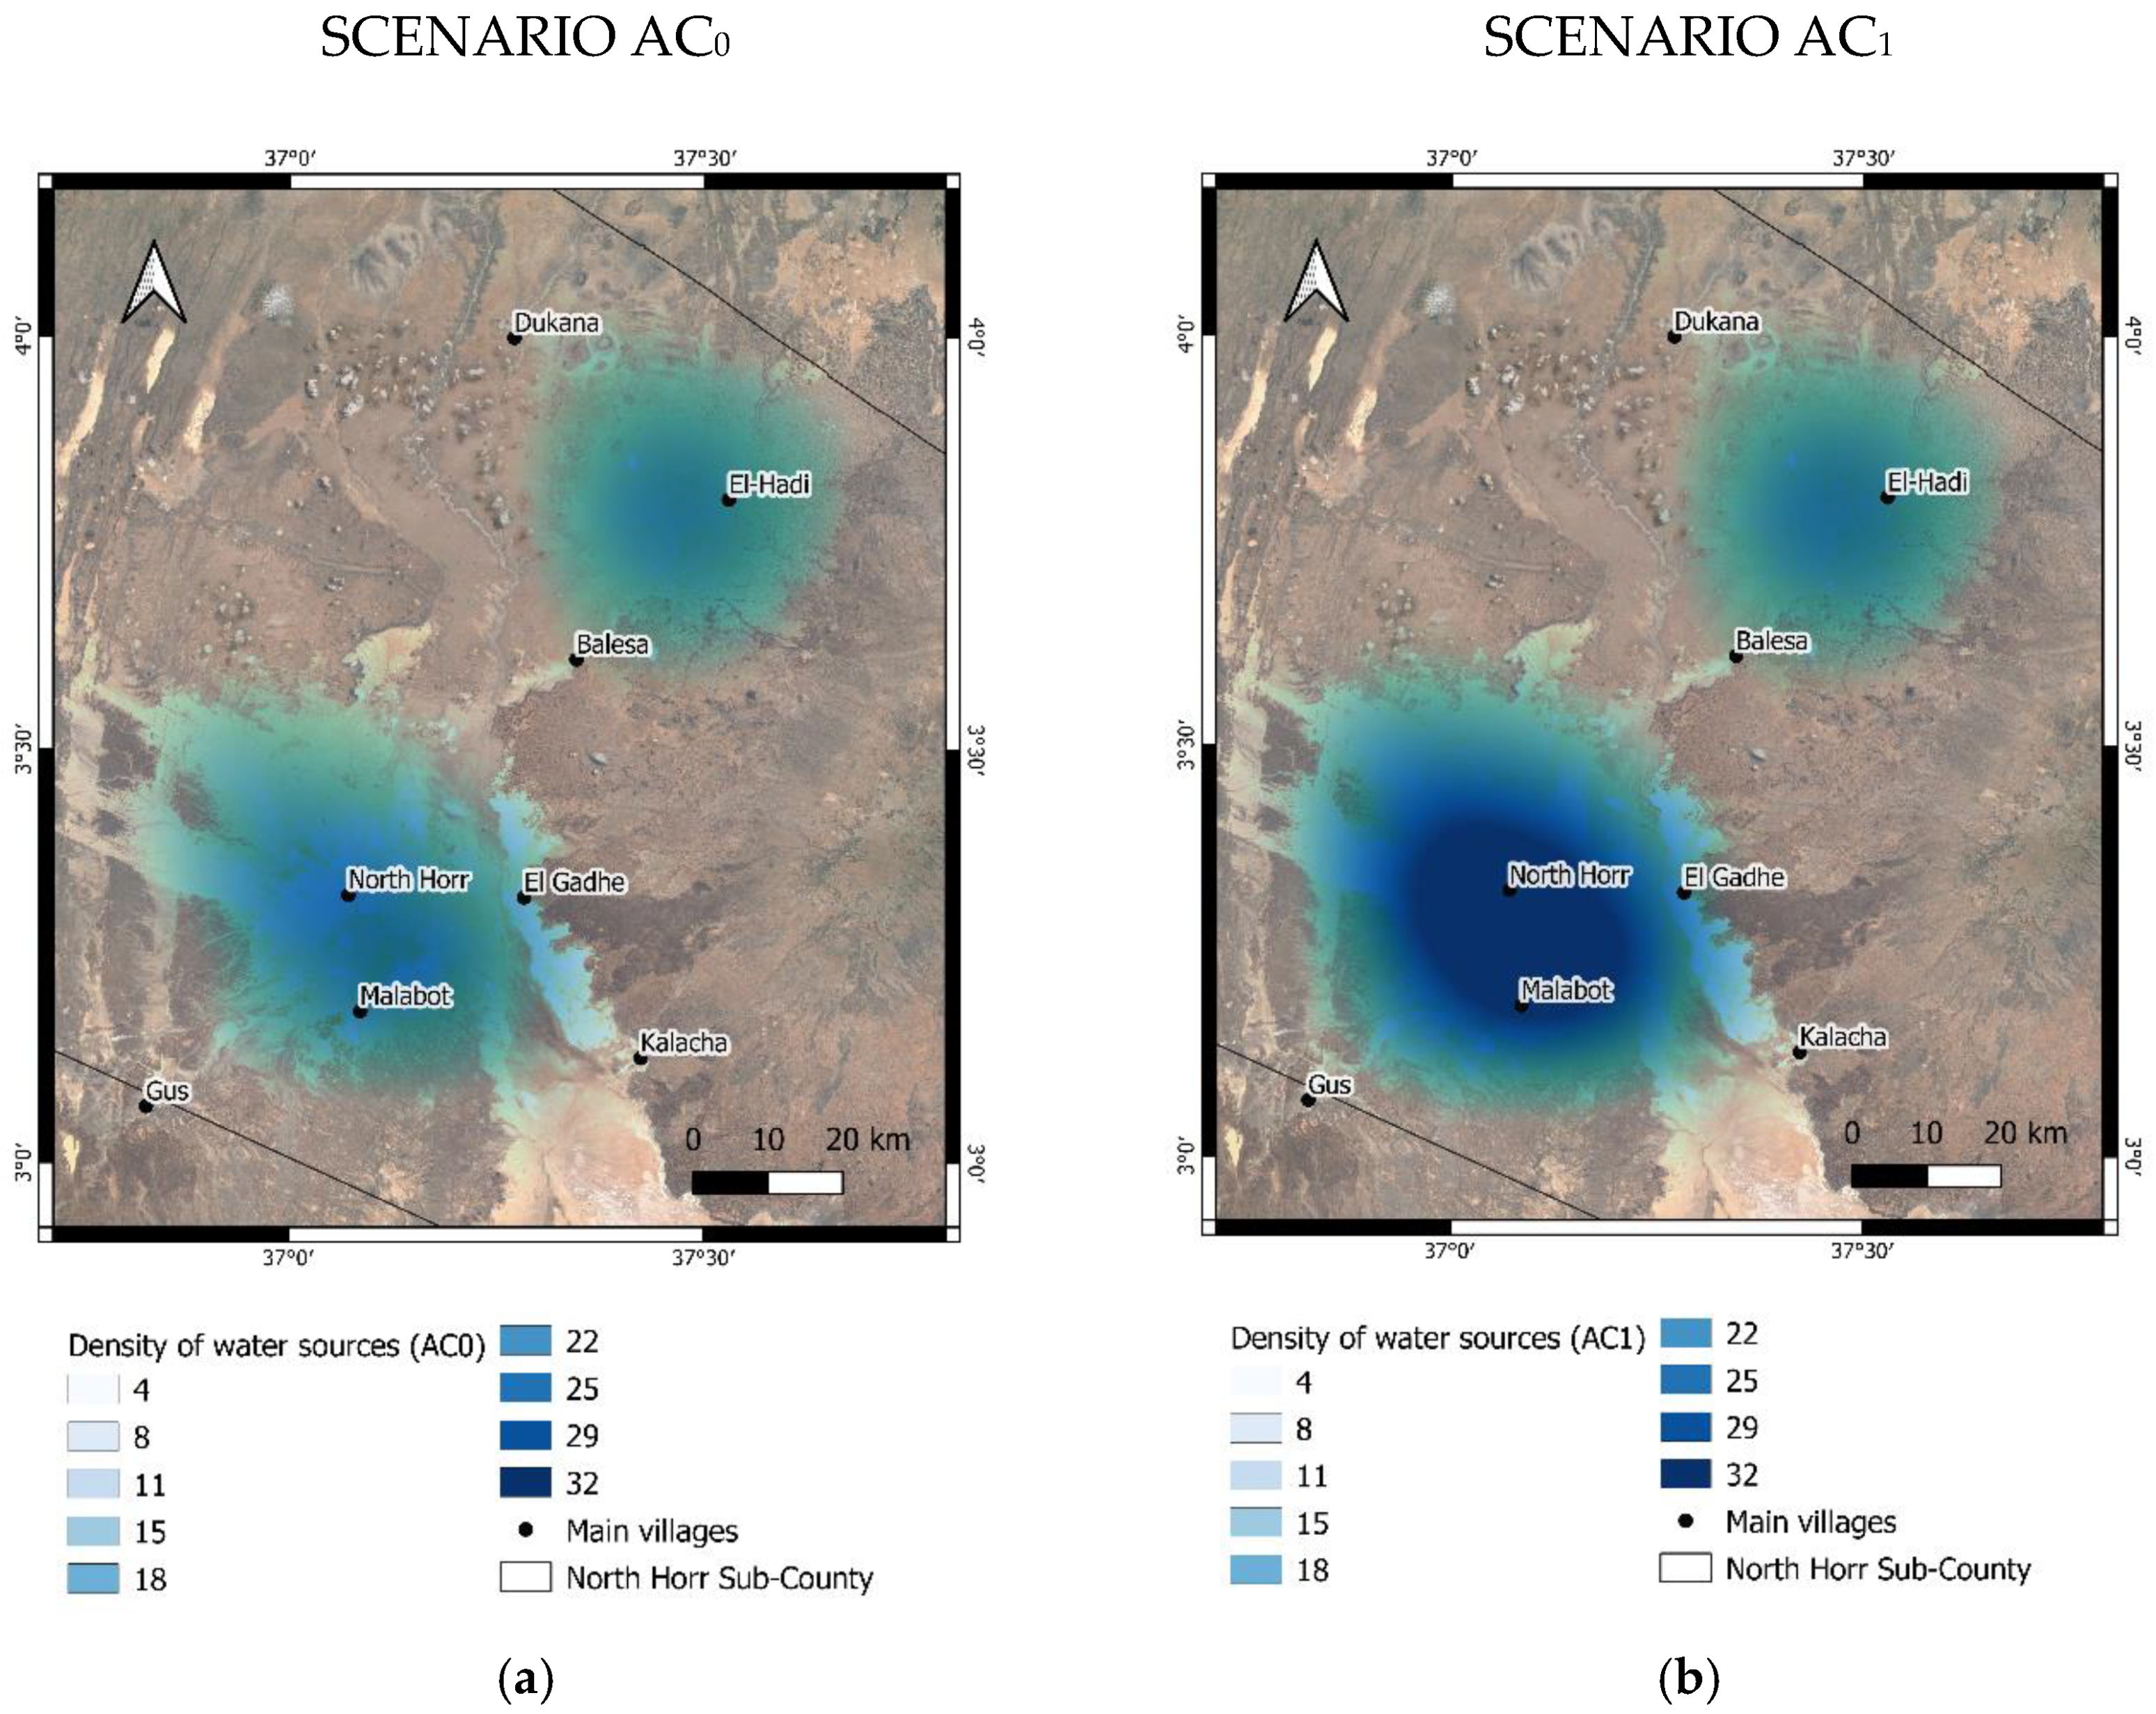
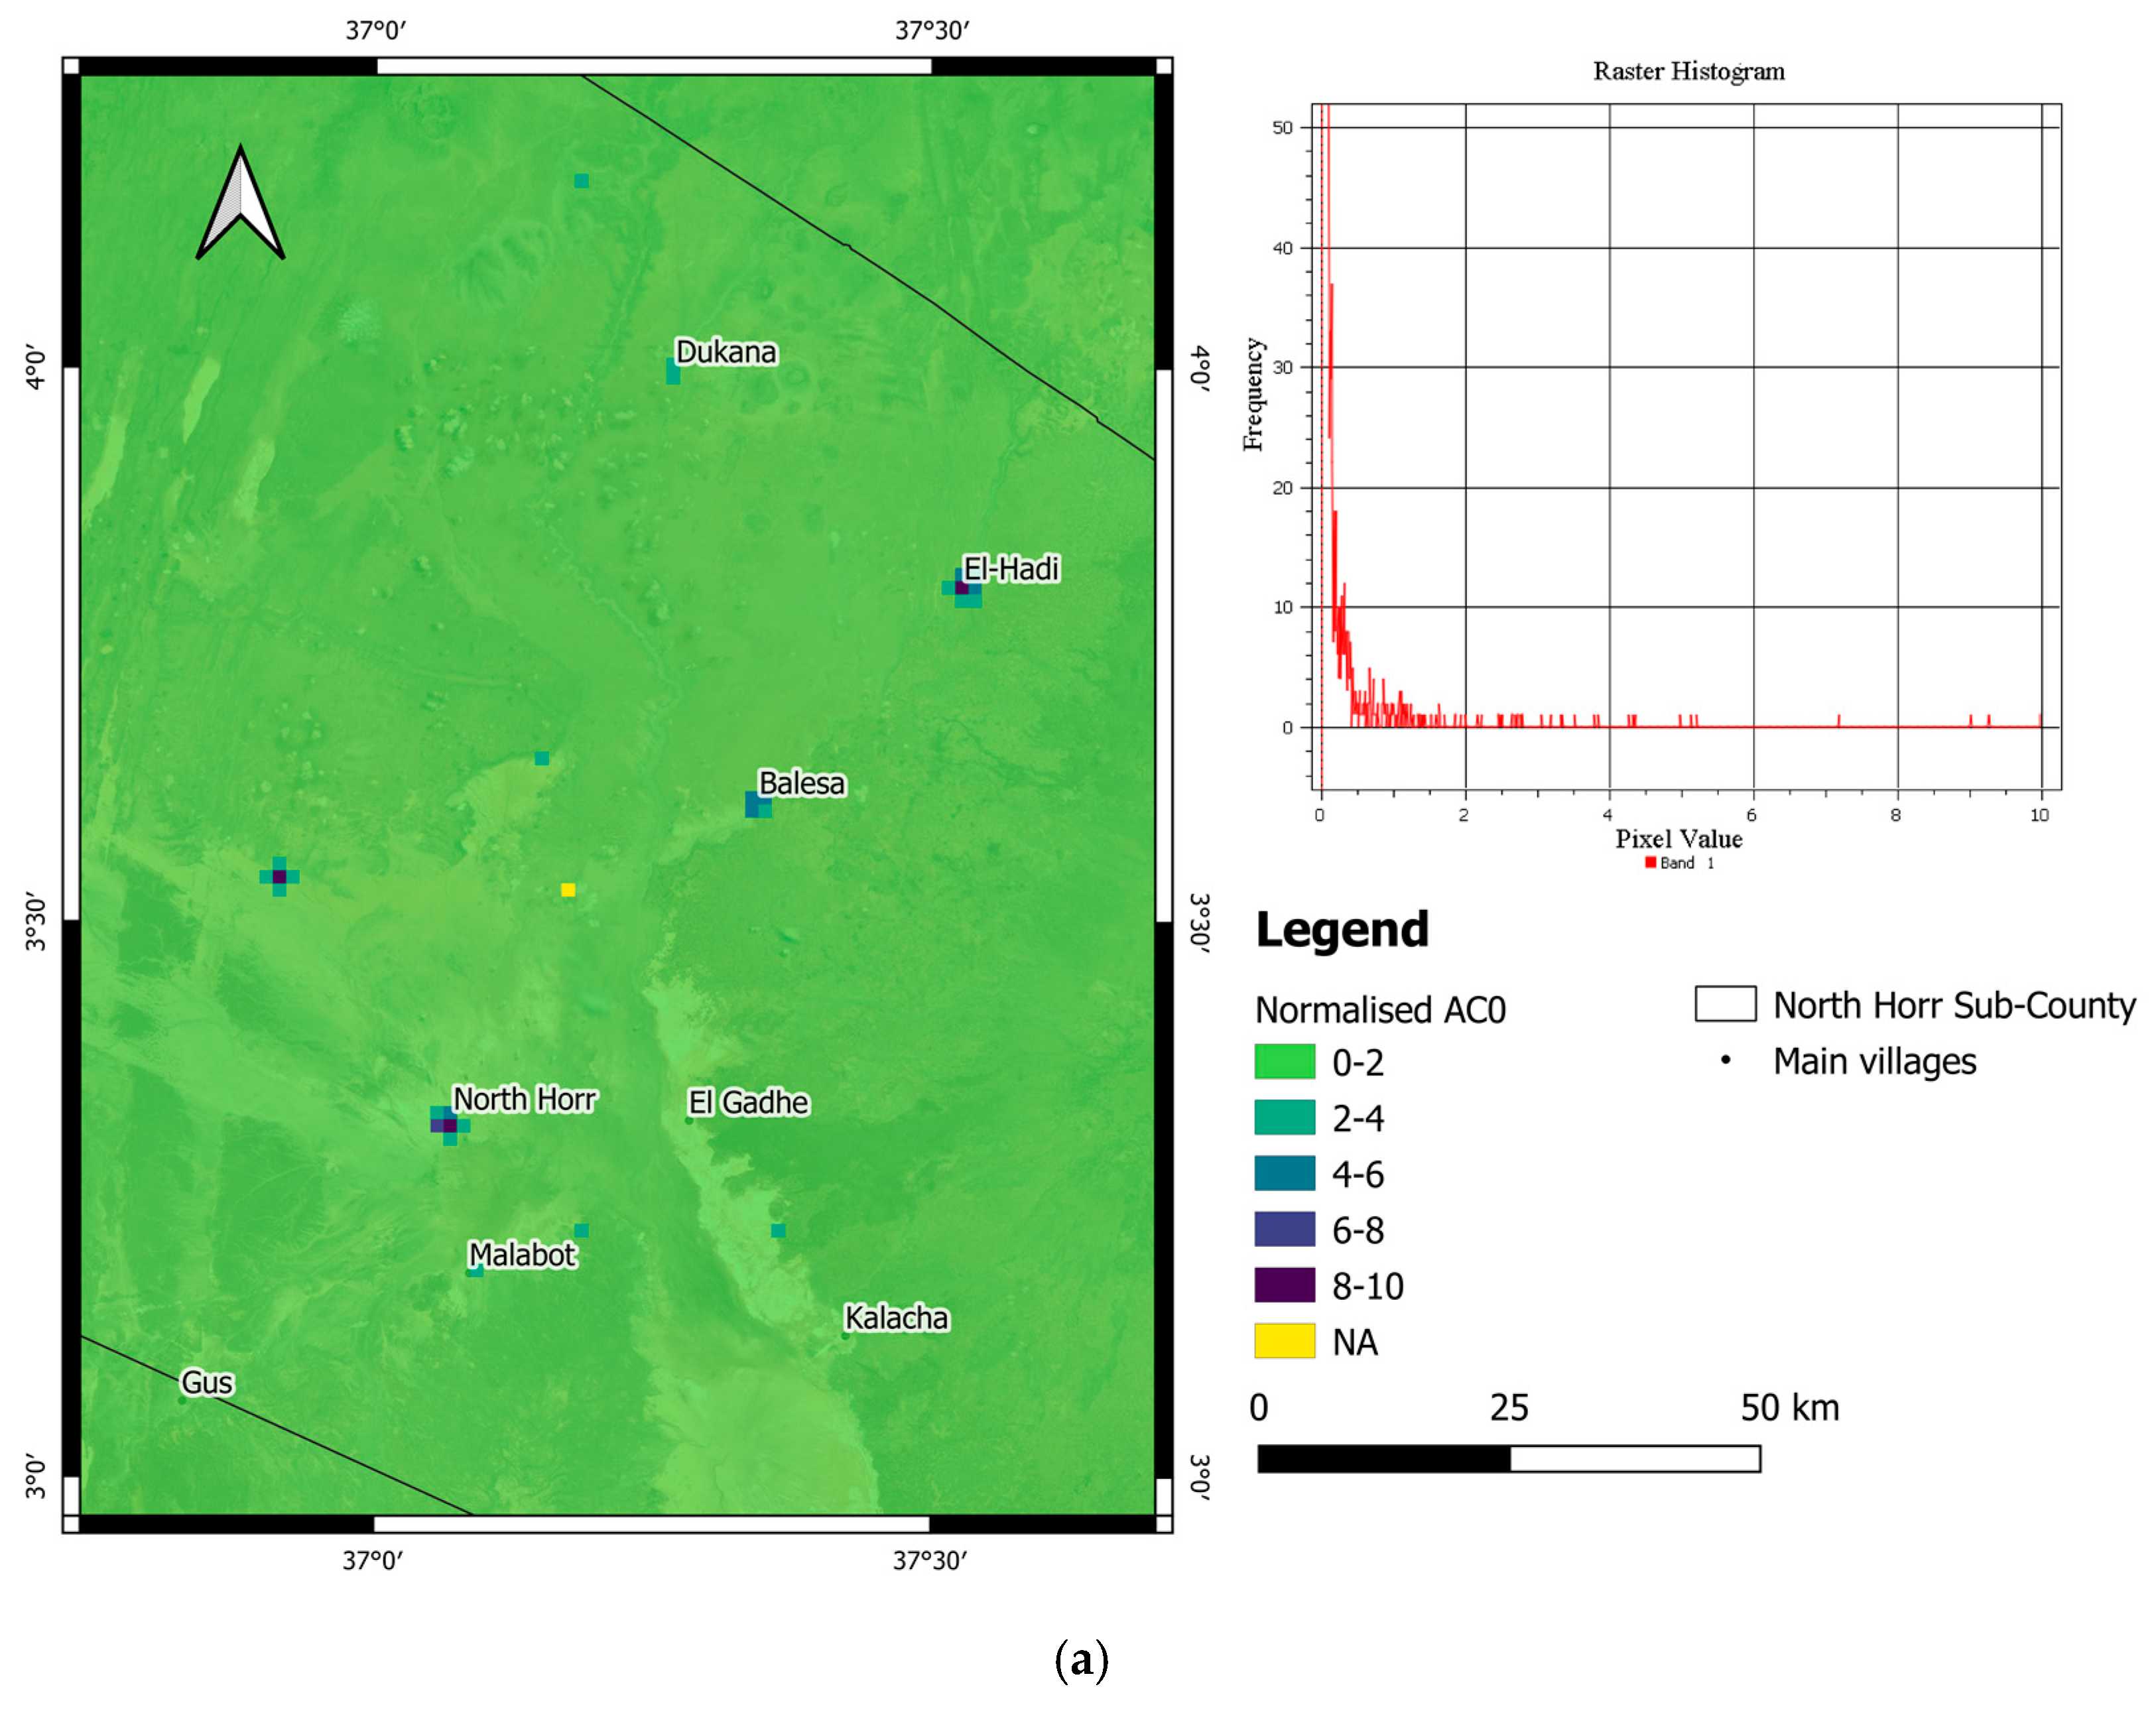
4.3. Adaptive Capacity
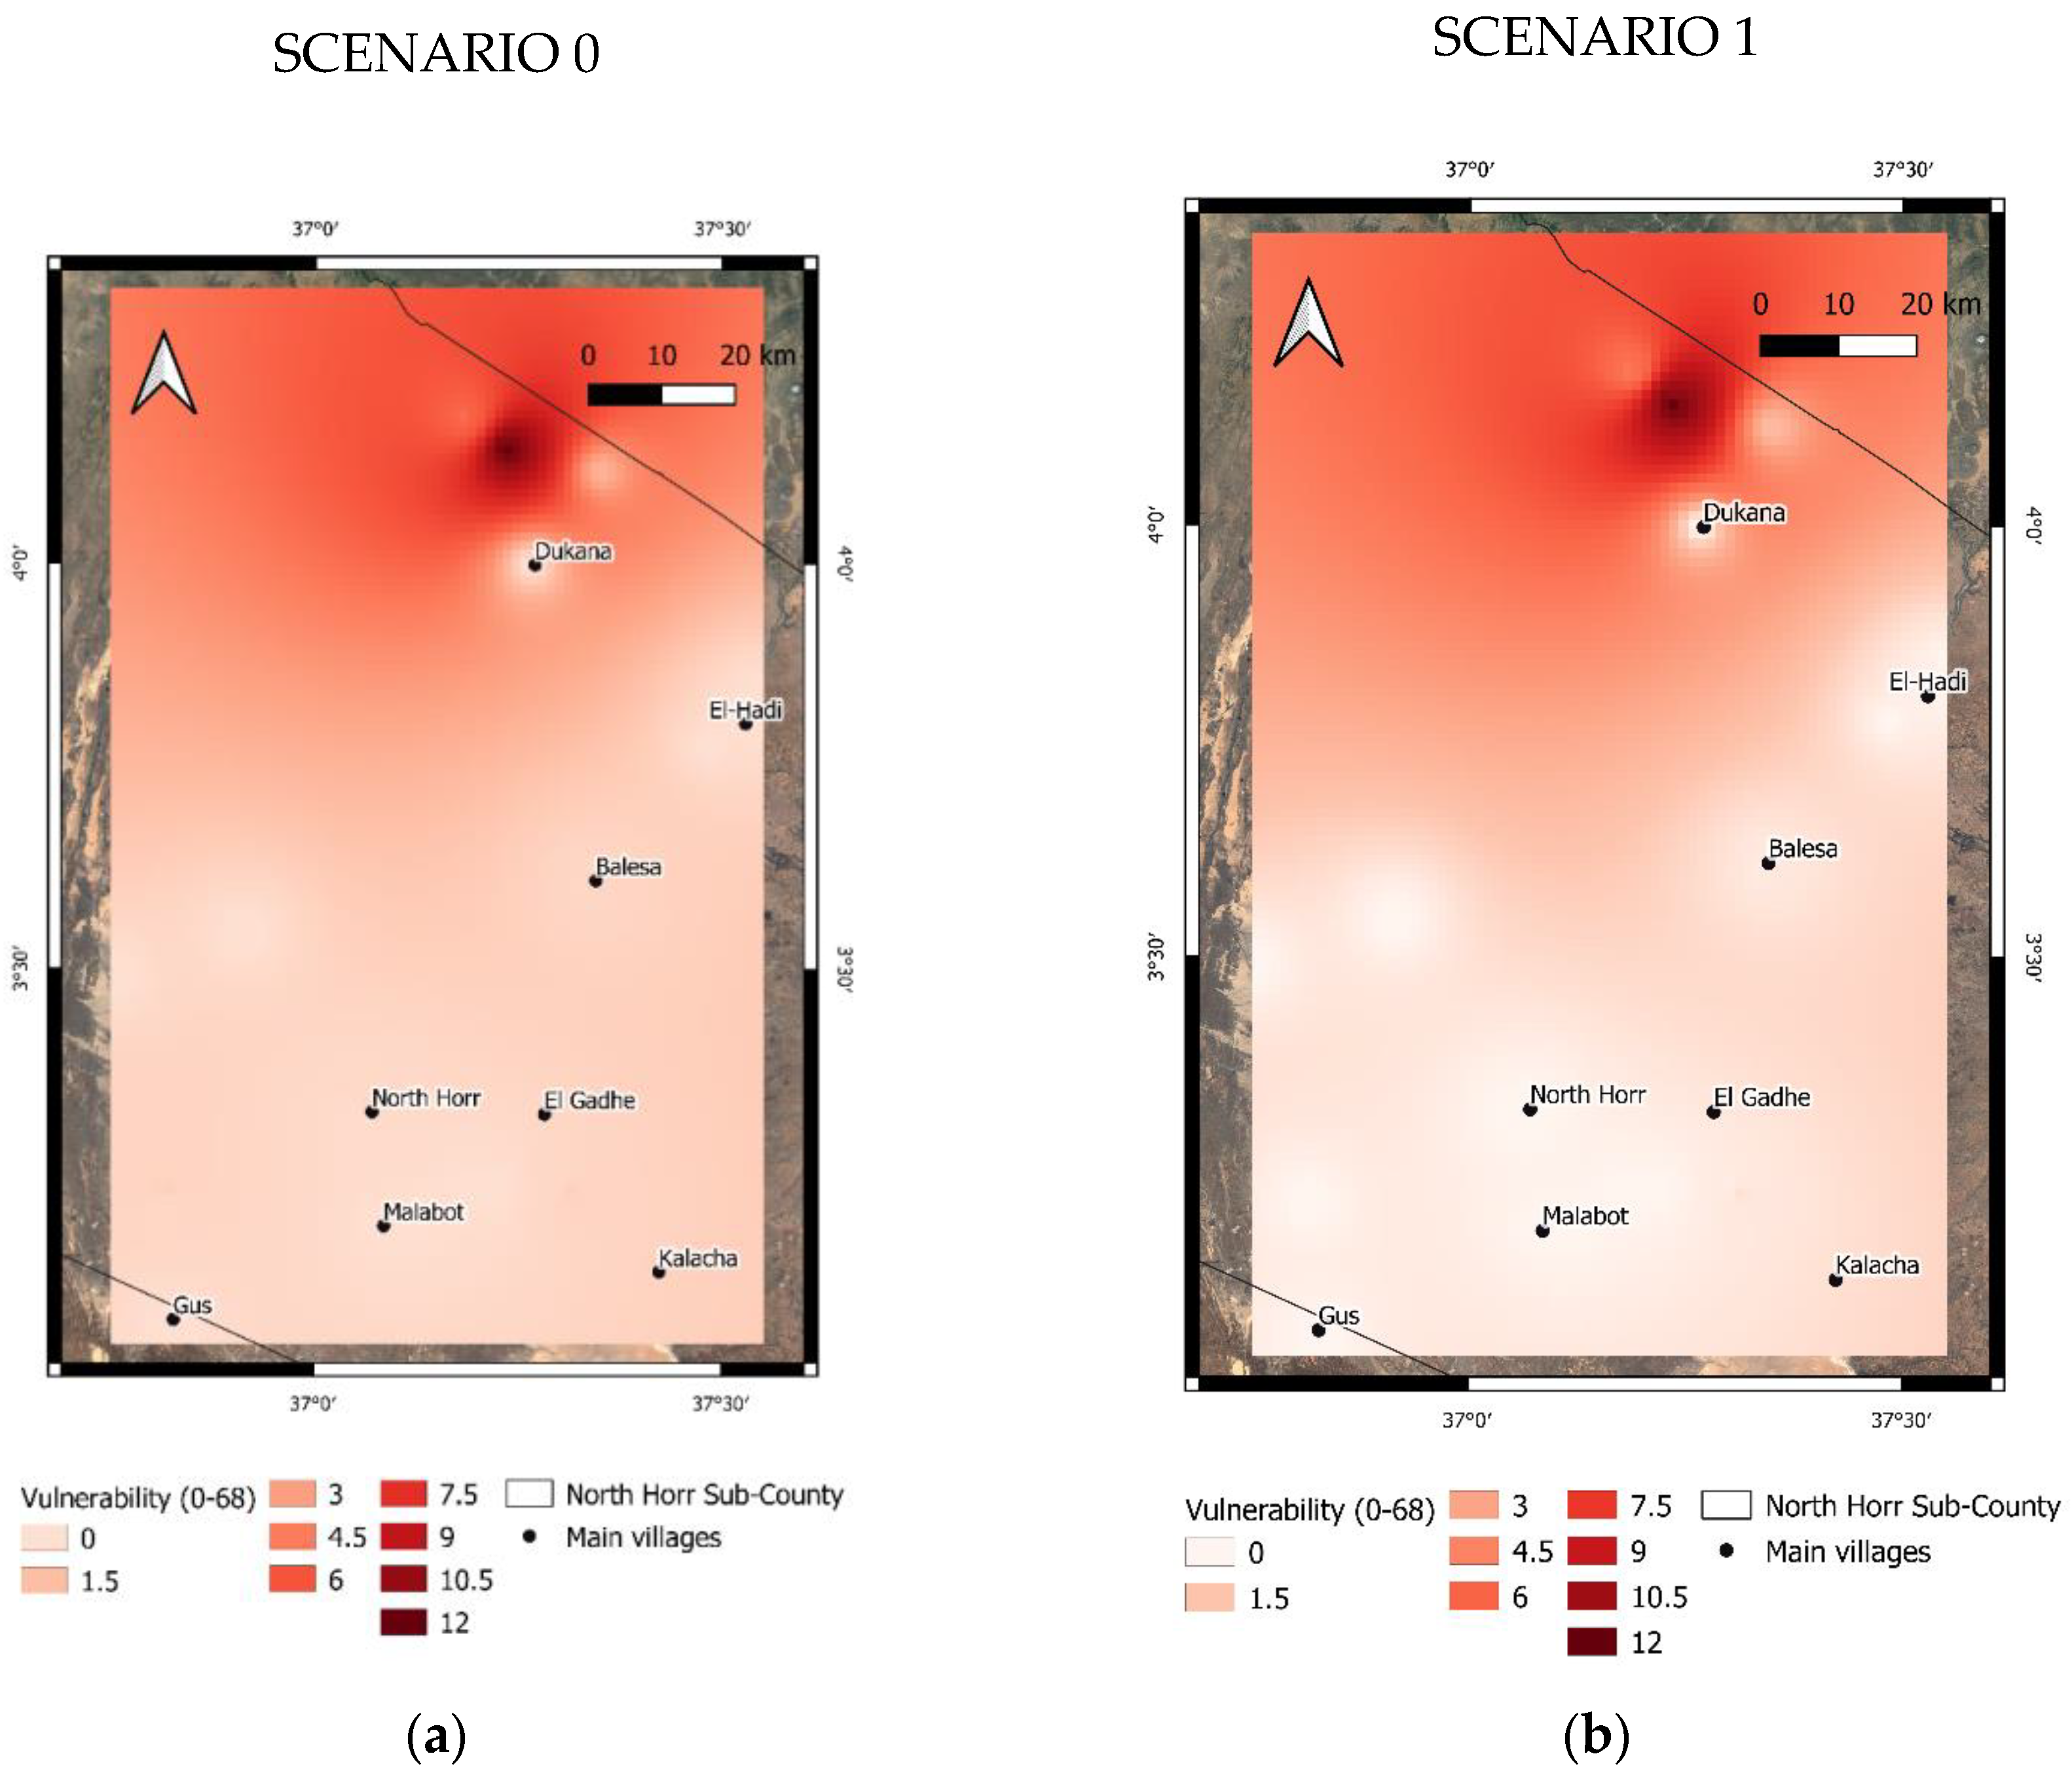
Among the eight actions that contribute to the improvement of water sources, only four contribute significantly to the reduction of the walking distance to safe water sources. These are construction of shallow wells, supply of fresh and clean piped water, drilling of boreholes, installation of underground tanks filled with piped water. Therefore only the following water sources were taken into consideration for the water sources density (Table 8).
The increase of the number of safe water sources in the study areas is considered as an improvement of the adaptation capacity. It lowers the animal gatherings at water sources, it reduces the exploitation of water sources themselves and improves access to water.
The scenario AC0, as said, is the current state of density of water sources, while the scenario AC1 is the possible future scenario if all the planned measures are set in place by the end of 2022. In both scenarios, North Horr and El Hadi are the inhabited centers with the higher concentration of water sources.

4.4. Vulnerability

The vulnerability is the resulting combination of normalised indicators: Normalised Exposure (see Figure 5), Normalised Sensitivity (see Figure 6) combined with the Scenarios AC0 and AC1 (see Figure 7) after their normalization in Normalised AC0 (Figure 8a) and Normalised AC1 (Figure 8b). The vulnerability analysis has a major outcome: both in Scenario 0 and Scenario 1 (Figure 9) the northern part of the sub-county is more vulnerable compared to the rest of area. After the implementation of adaption measures there is a timid improvement in vulnerability values in the southern sub-county (whitish spots). In Scenario 1 (Figure 9b), where there are no new adaptation measures (northern part), the values of vulnerability show no change.

5. Discussion

The result showed that the values of vulnerability in Scenarios 0 and 1 are greater in the northern part of the sub-county (dark red areas) with respect to the southern part (white to light red areas). Very few changes occurred from Scenario 0 to Scenario 1.
In fact, compared to Scenario 0, with the implementation of the adaptation measures—concentrated in the southern and central part of the sub-county—only the areas surrounding Gus, Malabot, North Horr, Kalacha, El Gadhe, Balesa and El-Hadi reduces their vulnerability. The area in the North do not benefit from the adaptation actions. Indeed, the areas in the North that were more vulnerable in Scenario 0 remain the most affected also in Scenario 1, while the areas in the South improve their capacity to adapt to nitrate contamination risk.
The measures contained in the SCIDP that aim to improve water access are concentrated in the southern-central part of the sub-county around the main town of North Horr (Figure 10a). Indeed, it seems possible to observe a radial pattern distribution of the areas of intervention starting from North Horr. As a matter of fact, North Horr is the chief town of the sub-county. Although it is difficult to reach North Horr from Marsabit town passing through the Chalbi desert, the areas in the North are way more difficult to get to and very close to the border with Ethiopia. The organization of similar interventions in the northern area could be challenging from a logistic point of view. Therefore, North Horr seems to be prioritized in the decision-making process. Moreover, the availability of funds is hardly employed in remote areas where the population density is one of the lowest in all of Kenya (about four inhabitants per km2) [50]. In fact, at the moment, funds of sustainable growth are preferably diverted in the areas along the Great North Road (the road going from El Cairo to Cape Town passing through Marsabit County), where a rapid population influx is expected [53].
Besides the low population density in the northern part of the sub-county, the demographic pressure on few water sources is an issue. In fact, a great number of settlements rely on few water sources creating significant stress for water supply dynamics (Figure 10b).
Therefore, remoteness of the northern part of the sub-county, security problems, scarce interest, and high demographic pressure on the scarce number of water source create suitable conditions for water scarcity and low water quality. Despite the SCIDP’s intention to promote the development of the area for the period 2018–2022, the plan will not be able to rectify the asymmetries and enhance the easiest access to quality water. If not addressed soon, the associated consequences could be an increase in migration sometimes identified as urbanization processes and conflict escalation in the area over water resources. Moreover, worsening consequences could be deteriorated by climate changes and, in particular, by more hydro-climatic variability in space and time [72].
To prevent social inequalities in access to clean and safe water, a broader understanding of the existing water quality in Kenya is necessary. However, poor knowledge and application of the Groundwater Vulnerability Assessment are found [73], even if contamination are common problems that affect groundwater quality [74].
These results and the related discussion confirm that the adopted methodology solves the issue of vulnerability assessment in a scant data context. In fact, the methodology proposed can identify the most vulnerable areas of the sub-county, together with most vulnerable shallow water sources, considering a selection of specific available data. Thus, the scant data limit is overcome and addressed. A limitation could be a lack of groundwater NO3 concentration data; however, an in-situ extensive data collection campaign would be a major effort for the abovementioned logistics issues. Thanks to the methodology proposed, more vulnerable areas are identified and a more narrow group of water sources to be analyzed could be selected, as done by [75]. Alternative applications of this methodology could be useful to assess the vulnerability in other scant data contexts as support for decision making or as preliminary assessment for more in-depth analysis of the water sources regarding nitrate contamination processes.

6. Conclusions

This research aimed at assessing the vulnerability of the area to nitrate contamination of water in open shallow water sources due to fecal intrusion following flooding events and nitrate percolation in groundwater. The vulnerability indicator was constructed according to two different scenarios pre- and post-interventions contained in the SCIDP, respectively Scenario 0 and Scenario 1. The result obtained shows the partial inefficacity of the interventions since they are concentrated in the central part of the sub-county, where it is already possible to find most of the water sources of the area. The northern part of the sub-county is remote, insecure, and scarcely populated, therefore, there is limited ability and low interest in improving water access in these areas.
Since the adaptation measures planned do not intervene in the most vulnerable areas, at least until 2022, the reduction of nitrate levels in the water supplied may rely on different control methods based on the acceptable level of human health risk, nitrate-control cost and technical feasibility. These methods include nitrate source control, blending of two or more water supplies and direct treatment of nitrates [76]. These methods of nitrates control should be coupled with an awareness campaign on nitrate contamination control.
Moreover, the consistency of the results confirms the goodness of the proposed methodology for scant data context based on the selection of specific quantitative sub-indicators, combining socio-economic aspects with physical features.
In conclusion, the present study contributed to the understanding of the present and near-future vulnerability of the area, as well as of the limitations of the SCIDP in contrasting the risk of nitrate contamination of shallow water sources. Policymakers should be aware of the existing imbalances between the North and South of the sub-county and try to incorporate these findings, albeit achieved in a scant data context, for future policy planning. At the same time, it is demonstrated that a quantitative approach can be easily used to evaluate the vulnerability to climate changes also in a scant data situation and in remote areas.

Author Contributions

Conceptualization, V.B. and. A.P.; methodology, V.B., A.P., E.C. and M.R.; formal analysis, V.B.; writing—original draft preparation, V.B.; writing—review and editing A.P., V.B., E.C. and M.R.; supervision, A.P., E.C. and M.R. All authors have read and agreed to the published version of the manuscript.

Funding

This research received no external funding.

Acknowledgments

This study is conducted in the framework of the International Cooperation Project “ONE HEALTH: Multidisciplinary approach to promote the health and resilience of shepherds’ communities in North Kenya” funded by the Italian Agency for Development Cooperation (AICS). The authors would like to thank the project coordinator (CCM) and project partners (TriM and VSF-Germany) and the Kenyan Meteorological Department. Finally, a due thank to Concern Worldwide which shared data on water sources collected in a joint campaign with the Government of Kenya.

Conflicts of Interest

The authors declare no conflict of interest.

References

  1. Marshall, S. The water crisis in Kenya: Causes, effects and solutions. Glob. Major. E J. 2011, 2, 31–45. [Google Scholar]
  2. Mulei Kithiia, S. Water quality degradation trends in kenya over the last decade. In Water Quality Monitoring and Assessment; Voudouris, K., Voutsa, D., Eds.; InTech: Rijeka, Croatia, 2012; pp. 509–526. ISBN 9789535104865. [Google Scholar]
  3. Moraa, H.; Otieno, A.; Salim, A. Water Governance in Kenya: Ensuring Accessibility, Service Delivery and Citizen Participation; iHubResearch: Nairobi, Kenya, 2012. [Google Scholar]
  4. UNEP. A Snapshot of the World’s Water Quality: Towards a Global Assessment; United Nations Environment Programme: Nairobi, Kenya, 2016; ISBN 9789280735550. [Google Scholar]
  5. Borel-Saladin, J. Data dilemmas: Availability, access and applicability for analysis in sub-saharan african cities. Urban Forum 2017, 28, 333–343. [Google Scholar] [CrossRef]
  6. Osuteye, E.; Johnson, C.; Brown, D. The data gap: An analysis of data availability on disaster losses in sub-Saharan African cities. Int. J. Disaster Risk Reduct. 2017, 26, 24–33. [Google Scholar] [CrossRef]
  7. Carter, T.R.; Jones, R.; Lu, X.; Bhadwal, S.; Conde, C.; Mearns, L.; Rounsevell, M.; Zurek, M.; Parry, M.; Canziani, O.; et al. New assessment methods and the characterisation of future conditions. Climate Change 2007: Impacts, Adaptation and Vulnerability. In Contribution of Working Group II to the Fourth Assessment Report of the Intergovernmental Panel on Climate Change; Parry, M.L., Canziani, O.F., Palutikof, J.P., van der Linden, P.J., Hanson, C.E., Eds.; Cambridge University Press: Cambridge, UK, 2007; pp. 133–171. [Google Scholar]
  8. Grasso, V.F.; Dilley, M. A Comparative Review Of Country-Level and Regional Disaster Loss and Damage Databases; United Nations Development Programme: New York, NY, USA, 2013. [Google Scholar]
  9. Grady, S.C.; Messina, J.P.; McCord, P.F. Population vulnerability and disability in Kenya’s tsetse fly habitats. PLoS Negl. Trop. Dis. 2011, 5. [Google Scholar] [CrossRef] [PubMed] [Green Version]
  10. Mulefu, F.O.; Mutua, F.N.; Boitt, M. Malaria risk and vulnerability assessment GIS approach. Case study of busia county, Kenya. IOSR J. Environ. Sci. 2016, 10, 104–112. [Google Scholar]
  11. Githeko, A.K.; Lindsay, S.W.; Confalonieri, U.E.; Patz, J.A. Climate change and vector-borne diseases: A regional analysis. Bull. World Health Organ. 2000, 78, 1136–1147. [Google Scholar]
  12. Onyango, E.A.; Sahin, O.; Awiti, A.; Chu, C.; Mackey, B. An integrated risk and vulnerability assessment framework for climate change and malaria transmission in East Africa. Malar. J. 2016, 15, 1–12. [Google Scholar] [CrossRef] [PubMed] [Green Version]
  13. Stoltzfus, J.D.; Carter, J.Y.; Akpinar-Elci, M.; Matu, M.; Kimotho, V.; Giganti, M.J.; Langat, D.; Elci, O.C. Interaction between climatic, environmental, and demographic factors on cholera outbreaks in Kenya. Infect. Dis. Poverty 2014, 3, 37. [Google Scholar] [CrossRef] [Green Version]
  14. Olago, D.; Marshall, M.; Wandiga, S.O.; Opondo, M.; Yanda, P.Z.; Kangalawe, R.; Githeko, A.; Downs, T.; Opere, A.; Kabumbuli, R.; et al. Climatic, socio-economic, and health factors affecting human vulnerability to cholera in the Lake Victoria Basin, East Africa. Ambio 2007, 36, 350–358. [Google Scholar] [CrossRef]
  15. Fewtrell, L. Drinking-water nitrate, methemoglobinemia, and global burden of disease: A discussion. Environ. Health Perspect. 2004, 112, 1371–1374. [Google Scholar] [CrossRef] [Green Version]
  16. Malberg, J.W.; Savage, E.P.; Osteryoung, J. Nitrates in drinking water and the early onset of hypertension. Environ. Pollut. 1978, 15, 155–160. [Google Scholar] [CrossRef]
  17. Fan, A.M.; Steinberg, V.E. Health implications of nitrate and nitrite in drinking water: An update on methemoglobinemia occurrence and reproductive and developmental toxicity. Regul. Toxicol. Pharmacol. 1996, 23, 35–43. [Google Scholar] [CrossRef] [PubMed]
  18. Ward, M.H.; Jones, R.R.; Brender, J.D.; de Kok, T.M.; Weyer, P.J.; Nolan, B.T.; Villanueva, C.M.; van Breda, S.G. Drinking water nitrate and human health: An updated review. Int. J. Environ. Res. Public Health 2018, 15, 1557. [Google Scholar] [CrossRef] [Green Version]
  19. Johnson, C.J.; Kross, B.C. Continuing importance of nitrate contamination of groundwater and wells in rural areas. Am. J. Ind. Med. 1990, 18, 449–456. [Google Scholar] [CrossRef]
  20. MG, B. Environmental factors associated with nitrate poisoning in livestock in Botswana. J. Pet. Environ. Biotechnol. 2012, 3, 131. [Google Scholar] [CrossRef] [Green Version]
  21. Ozmen, O.; Mor, F.; Sahinduran, S.; Unsal, A. Pathological and toxicological investigations of chronic nitrate poisoning in cattle. Toxicol. Environ. Chem. 2005, 87, 99–106. [Google Scholar] [CrossRef]
  22. Campbell, J.B.; Davis, A.N.; Myhr, P.J. Methaemoglonaemia of livestock caused by high nitrate contents of well water. Can. J. Comp. Med. Vet. Sci. 1954, 18, 93–101. [Google Scholar] [PubMed]
  23. WHO. Nitrate and Nitrite in Drinking-Water: Background Document for Development of WHO Guidelines for Drinking Water Quality. Available online: http://www.who.int/water_sanitation_health/dwq/chemicals/nitratenitrite2ndadd.pdfS (accessed on 18 June 2020).
  24. Nissen-Petersen, E. Water from Dry Riverbeds; Danish International Development Agency in Kenya: Nairobi, Kenya, 2006. [Google Scholar]
  25. Collins, R.; Mcleod, M.; Hedley, M.; Donnison, A.; Close, M.; Hanly, J.; Horne, D.; Ross, C.; Davies-Colley, R.; Bagshaw, C.; et al. Best management practices to mitigate faecal contamination by livestock of New Zealand waters. N. Z. J. Agric. Res. 2007, 50, 267–278. [Google Scholar] [CrossRef]
  26. Burns, D.A.; Nguyen, L. Nitrate movement and removal along a shallow groundwater flow path in a riparian wetland within a sheep-grazed pastoral catchment: Results of a tracer study. N. Z. J. Mar. Freshw. Res. 2010, 371–385. [Google Scholar] [CrossRef] [Green Version]
  27. Davies-Colley, R.J.; Nagels, J.W.; Smith, R.A.; Young, R.G.; Phillips, C.J. Water quality impact of a dairy cow herd crossing a stream. N. Z. J. Mar. Freshw. Res. 2004, 38, 569–576. [Google Scholar] [CrossRef] [Green Version]
  28. Collins, R.; Rutherford, K. Modelling bacterial water quality in streams draining pastoral land. Water Res. 2004, 38, 700–712. [Google Scholar] [CrossRef] [PubMed]
  29. Nagels, J.W.; Davies-Colley, R.J.; Donnison, A.M.; Muirhead, R.W. Faecal contamination over flood events in a pastoral agricultural stream in New Zealand. Water Sci. Technol. 2002, 45, 45–52. [Google Scholar] [CrossRef] [PubMed]
  30. Hoppe, B.O.; Raab, K.K.; Blumenfeld, K.A.; Lundy, J. Vulnerability assessment of future flood impacts for populations on private wells: Utilizing climate projection data for public health adaptation planning. Clim. Change 2018, 148, 533–546. [Google Scholar] [CrossRef]
  31. Djoudi, S.; Boulabiez, F.; Pistre, S.; Houha, B. Assessing groundwater vulnerability to contamination in a semi-arid environment using DRASTIC and GOD models, Case of F’kirina Plain, North of Algeria. IOSR J. Environ. Sci. 2019, 13, 39–44. [Google Scholar]
  32. Boulabeiz, M.; Klebingat, S.; Agaguenia, S. A GIS-Based GOD model and hazard index analysis: The quaternary coastal collo aquifer (NE-Algeria). Groundwater 2019, 57, 166–176. [Google Scholar] [CrossRef] [PubMed] [Green Version]
  33. Ghazavi, R.; Ebrahimi, Z. Assessing groundwater vulnerability to contamination in an arid environment using DRASTIC and GOD models. Int. J. Environ. Sci. Technol. 2015, 12, 2909–2918. [Google Scholar] [CrossRef] [Green Version]
  34. Bataineh, S.; Curtis, C.; In, M.’; Alghwazi, Z. Groundwater Resources, the DRASTIC Method and Applications in Jordan. Available online: http://courses.washington.edu/cejordan/SbCcMa_Presentation.pdf (accessed on 7 February 2020).
  35. Zhou, Z.; Ansems, N.; Torfs, P. A Global Assessment of Nitrate Contamination in Groundwater Internship Report; International Groundwater Resources Assessment Center: Delft, The Netherlands, 2015. [Google Scholar]
  36. Martínez-Salvador, C.; Moreno-Gómez, M.; Liedl, R. Estimating pollutant residence time and NO3 concentrations in the Yucatan karst aquifer; considerations for an integrated karst aquifer vulnerability methodology. Water 2019, 11, 1431. [Google Scholar] [CrossRef] [Green Version]
  37. Panagopoulos, Y.; Makropoulos, C.; Baltas, E.; Mimikou, M. SWAT parameterization for the identification of critical diffuse pollution source areas under data limitations. Ecol. Modell. 2011, 222, 3500–3512. [Google Scholar] [CrossRef]
  38. Birkmann, J. Measuring Vulnerability to promote disaster-resilient societies: Conceptual framewors and definitions. In Measuring Vulnerability to Natural Hazards: Towards Disaster Resilient Societies; United Nation University Press: Tokyo, Japan, 2006; pp. 9–54. [Google Scholar]
  39. Science in support of adaptation to climate change. In Proceedings of the Conference of the Parties to the United Nations Framework Convention on Climate Change, Buenos Aires, Argentina, 7 December 2004.
  40. Field, C.B.; Barros, V.R.; Dokken, D.J.; Mach, K.J.; Mastrandrea, M.D.; Bilir, T.E.; Chatterjee, M.; Yuka, K.L.E.; Estrada, O.; Genova, R.C.; et al. Climate Change 2014 Impacts, Adaptation, and Vulnerability Part A: Global and Sectoral Aspects Working Group II Contribution to the Fifth Assessment Report of the Intergovernmental Panel on Climate Change; Cambridge University Press: New York, NY, USA, 2014; ISBN 978-1-107-05807-1. [Google Scholar]
  41. Cardona, O.-D.; van Aalst, M.K.; Birkmann, J.; Fordham, M.; McGregor, G.; Perez, R.; Pulwarty, R.S.; Lisa Schipper, E.F.; Tan Sinh, B.; Décamps, H.; et al. Determinants of risk: Exposure and vulnerability. In Managing the Risks of Extreme Events and Disasters to Advance Climate Change Adaptation; Cambridge University Press: Cambridge, UK; New York, NY, USA, 2012. [Google Scholar]
  42. Belcore, E.; Pezzoli, A.; Calvo, A. Analysis of gender vulnerability to climate-related hazards in a rural area of Ethiopia. Geogr. J. 2019, 1–15. [Google Scholar] [CrossRef]
  43. Nolan, B.T.; Hitt, K.J. Vulnerability of shallow groundwater and drinking-water wells to nitrate in the United States. Environ. Sci. Technol. 2006, 40, 7834–7840. [Google Scholar] [CrossRef]
  44. Tesoriero, A.J.; Puckett, L.J. O2 reduction and denitrification rates in shallow aquifers. Water Resour. Res. 2011, 47. [Google Scholar] [CrossRef]
  45. Orindi, V.A.; Ochieng, A. Case study 5: Kenya seed fairs as a drought recovery strategy in Kenya. IDS Bull. 2005, 36, 87–102. [Google Scholar] [CrossRef] [Green Version]
  46. Karanja, F.; Mutua Nairobi, F. Reducing the Impact of Environmental Emergencies through Early Warning and Preparedness-the Case of el Niño-Southern Oscillation (ENSO); UNFIP/UNEP/NCAR/WMO/DNDR/UNU: Nairobi, Kenya, 2000; Available online: https://profiles.uonbi.ac.ke/coludhe/publications/reducing-impacts-environmental-emergencies-through-early-warning-and-preparedne (accessed on 26 March 2020).
  47. Ogalo, L.; Owiti, Z.; Mutemi, J. Linkages between the Indian Ocean Dipole and East African Rainfall Anomalies. J. Kenya Meteorol. Soc. 2008, 2, 3–17. [Google Scholar]
  48. Kuria, Z. Groundwater distribution and aquifer characteristics in Kenya. In Developments in Earth Surface Processes; Elsevier: Amsterdam, The Netherlands, 2013; Volume 16, pp. 83–107. [Google Scholar]
  49. Vigna, I.; Bigi, V.; Pezzoli, A.; Besana, A. Comparison and bias-correction of satellite-derived precipitation datasets at local level in Northern Kenya. Sustainability 2020, 12, 2896. [Google Scholar] [CrossRef] [Green Version]
  50. Kenya National Bureau of Statistics 2019 Kenya Population and Housing Census Volume 1: Population by County and Sub-County; KNBS: Nairobi, Kenya, 2019; Volume I, ISBN 9789966102096.
  51. Rutten, M. Shallow Wells: A Sustainable and Inexpensive Alternative to Boreholes in Kenya. In Proceedings of the EU Conference Support to Marginal Rural Areas in Somalia, Nairobi, Kenya, 23–26 November 2004. [Google Scholar]
  52. Water Supply and Sanitation in Kenya Turning Finance into Services for 2015 and Beyond An AMCOW Country Status Overview; Water and Sanitation Program: Nairobi, Kenya, 2011.
  53. County Government of Marsabit Second County Integrated Development Plan 2018–2022. Available online: http://marsabit.go.ke/wp-content/uploads/2019/10/Marsabit-CIDP-2018-2022.pdf (accessed on 26 March 2020).
  54. Mumma, A.; Lane, M.; Kairu, E.; Tuinhof, A.; Hirji, R. Kenya Groundwater Governance Case Study; Water Papers; Worldbank: Washington, DC, USA, 2011; Available online: http://water.worldbank.org/water/sites/worldbank.org.water/files/GWGovernanceKenya.pdf (accessed on 26 March 2020).
  55. Di Molfetta, A.; Sethi, R. Ingegneria Degli Acquiferi; Springer Science & Business Media: Milano, Italy, 2012; ISBN 9788847018501. [Google Scholar]
  56. IUSS Working Group WRB. World Reference Base for Soil Resources 2014: International Soil Classification System for Naming Soils and Creating Legends for Soil Maps; Food and Agriculture Organization of the United Nations: Rome, Italy, 2014; ISBN 9789251083697. [Google Scholar]
  57. Mckee, T.B.; Doesken, N.J.; Kleist, J. The relationshio of drought frequency and duration to time scales. In Proceedings of the Eighth Conference on Applied Climatology, Anaheim, CA, USA, 17 January 1993. [Google Scholar]
  58. World Meteorological Organization (WMO). Standardized Precipitation Index User Guide (WMO-No. 1090); World Meteorological Organization: Geneva, Switzerland, 2012. [Google Scholar]
  59. Liu, X.; Wang, Y.; Peng, J.; Braimoh, A.K.; Yin, H. Assessing vulnerability to drought based on exposure, sensitivity and adaptive capacity: A case study in middle Inner Mongolia of China. Chinese Geogr. Sci. 2013, 23, 13–25. [Google Scholar] [CrossRef]
  60. Tahmasebi, A. Pastoral Vulnerability to Socio-Political and Climate Stresses: The Shahsevan of North Iran; LIT Verlag: Münster, Germany, 2013. [Google Scholar]
  61. Liu, D.; You, J.; Xie, Q.; Huang, Y.; Tong, H.; Xie, J.F.; Huang, Q.J.; Tong, Y.Y.; Liu, D. Spatial and temporal characteris-tics of drought and flood in Quanzhou based on Standardized Precipitation Index (SPI) in recent 55 years. J. Geosci. Environ. Prot. 1960, 6, 25–37. [Google Scholar]
  62. Seiler, R.A.; Hayes, M.; Bressan, L. Using the standardized precipitation index for flood risk monitoring. Int. J. Climatol. 2002, 22, 1365–1376. [Google Scholar] [CrossRef]
  63. Shahid, S.; Behrawan, H. Drought risk assessment in the western part of Bangladesh. Nat. Hazards 2008, 46, 391–413. [Google Scholar] [CrossRef]
  64. Copernicus European Drought Observatory. Standardized Precipitation Index (SPI). Available online: https://edo.jrc.ec.europa.eu/edov2/php/index.php?id=1101 (accessed on 24 February 2020).
  65. Huizinga, J.; De Moel, H.; Szewczyk, W. JRC Technical Reports Global Flood Depth-Damage Functions; Publications Office of the European Union: Brussels, Belgium, 2017. [Google Scholar]
  66. Fan, Y.; Miguez-Macho, G. A simple hydrologic framework for simulating wetlands in climate and earth system models. Clim. Dyn. 2011, 37, 253–278. [Google Scholar] [CrossRef]
  67. Ju, W.; Chen, J.M.; Black, T.A.; Barr, A.G.; McCaughey, H.; Roulet, N.T. Hydrological effects on carbon cycles of Canada’s forests and wetlands. Tellus B 2006, 58. [Google Scholar] [CrossRef]
  68. Elema, S.U. Effects of Climate Variability on Water and Pasture Availability in Turbi Division of Marsabit County, Kenya, 2018; Kenyatta University: Nairobi, Kenya, 2018. [Google Scholar]
  69. Hazard, B.; Adongo, C.; Wario, A.; Ledant, M. Comprehensive Study of Pastoral Livelihoods, WASH and Natural Resource Managment in Northern Marsabit; IFRA: Nairobi, Kenya, 2012. [Google Scholar]
  70. WHO. Guidelines for Drinking-Water Quality: Fourth Edition Incorporating the First Addendum; World Health Organization: Geneva, Switzerland, 2014; ISBN 9789241549950. [Google Scholar]
  71. Vicente-Serrano, S.M.; Beguería, S.; Lorenzo-Lacruz, J.; Camarero, J.J.; López-Moreno, J.I.; Azorin-Molina, C.; Revuelto, J.; Morán-Tejeda, E.; Sanchez-Lorenzo, A. Performance of drought indices for ecological, agricultural, and hydrological applications. Earth Interact. 2012, 16, 1–27. [Google Scholar] [CrossRef] [Green Version]
  72. Niang, I.; Ruppel, O.C.; Abdrabo, M.A.; Dube, P.; Leary, N.; Schulte-Uebbing, L.; Field, C.; Dokken, D.; Mach, K.; Bilir, T.; et al. Climate Change 2014: Impacts, Adaptation, and Vulnerability. Part B: Regional Aspects. Contribution of Working Group II to the Fifth Assessment Report of the Intergovernmental Panel on Climate Change; Barros, V.R., Field, C.B., Dokken, D.J., Mastrandrea, M.D., Mach, K.J., Bilir, T.E., Chatterjee, M., Ebi, K.L., Estrada, Y.O., Genova, R.C., et al., Eds.; Cambridge University Press: Cambridge, UK; New York, NY, USA, 2014; pp. 1199–1265. [Google Scholar]
  73. Rendilicha, H.G. A review of groundwater vulnerability assessment in Kenya. Acque Sotter. Ital. J. Groundw. 2018, 7. [Google Scholar] [CrossRef]
  74. REACH. Country Diagnostic Report, Kenya. REACH Working Paper 3; University of Oxford: Oxford, UK, 2015; ISBN 9781874370611. [Google Scholar]
  75. Nyilitya, B.; Mureithi, S.; Boeck, P. Tracking sources and fate of groundwater nitrate in Kisumu City and Kano Plains, Kenya. Water 2020, 12, 401. [Google Scholar] [CrossRef] [Green Version]
  76. Yong Lee, B.W.; Member, S.; Dahab, M.F.; Bogardi, I. Nitrate risk management under uncertainty. J. Water Resour. Plann. Manag. 1992, 118, 151–165. [Google Scholar]
Figure 1. Study area framework. The main figure represents the study area focused on the surroundings of the main eight villages (Dukana, El Hadi, Balesa, El Gadhe, North Horr, Gus, Malabot, Kalacha). The study area is comprised in North Horr Sub-County (Marsabit County) in northern Kenya.
Sustainability 12 06024 g001
Figure 2. Vulnerability assessment model. The reference numbers in the red boxes are used in the text to refer to nitrate contamination dynamics in association with the related sub-indicators.
Sustainability 12 06024 g002
Figure 3. Exposure sub-indicators: (a) demographic exposure, (b) physical flood exposure, and (c) physical drought exposure.
Sustainability 12 06024 g003
Figure 4. Sensitivity sub-indicators: (a) presence of the stream, (b) soil texture, and (c) soil drainage.
Sustainability 12 06024 g004
Figure 5. Normalised Exposure.
Sustainability 12 06024 g005
Figure 6. Normalised Sensitivity.
Sustainability 12 06024 g006
Figure 7. Adaptation sub-indicator: (a) density of water sources (AC0) and (b) density of water sources (AC1).
Sustainability 12 06024 g007
Figure 8. Adaptation indicators: (a) Normalised AC0 and (b) Normalised AC1.
Sustainability 12 06024 g008aSustainability 12 06024 g008b
Figure 9. Vulnerability indicators in two adaptation scenarios (density of water sources): (a) Scenario 0 with the current state of adaptation (b) Scenario 1 with implementation of the measures contained in the SCIDP.
Sustainability 12 06024 g009
Figure 10. (a) Scenario 0 and the planned areas of intervention; (b) Scenario 1 and the demographic exposure.
Sustainability 12 06024 g010
Table 1. Water Source Data in the Study Area.
Shallow WellsEarth Pans/DamsRock CatchmentsTotal Water Points
One Health platform113014
Concern Worldwide433248
546262
Table 2. Indicators and Sub-Indicators of the Vulnerability to Nitrate Contamination.
IndicatorSub-IndicatorsData SourceOriginal Type of SourceOriginal Dimension/ResolutionProjection
Exposure (E)Physical drought and flood exposure (Ep)Weighted SPI indicesBCKMD [49]Point vectorVillage levelWGS 84/UTM zone 37N
Demographic Exposure (Ed)Weighted maximum number of settlements potentially using the water sourceKenya Population Census 2019 (KNBS)Point vectorWater-source levelWGS 84/UTM zone 37N
Sensitivity (S)Hydraulic conductivity (HC)Drainage and
texture
ISRIC http://www.isric.org/explore/isric-soil-data-hubRaster0.002° × 0.002°WGS 84
Presence of the stream (PS)Water source distance from the streamPoint vectorWater-source levelWGS 84/UTM zone 37N
Adaptive Capacity (AC)Adaptive strategies (AS)Density of water sourcesSecond County Integrated Development Plan 2018–2022Point vectorWater-source levelWGS 84/UTM zone 37N
Table 3. Weights Assigned for the Presence of the Stream.
Presence of the StreamWeight
Inside1
Near0.6
Outside0.2
Table 4. Texture Classes Classifies According to the Coefficients of Vertical Hydraulic Conductivity.
Soil Texture
Soil Texture ClassVertical HC (m/Day)
Sand15.206
Loamy Sand13.504
Sandy Loam2.998
Silt Loam0.622
Loam0.605
Sandy Clay Loam0.544
Silty Clay Loam0.121
Clay Loam0.216
Sandy Clay0.190
Silty Clay0.086
Clay0.112
Peat0.691
Table 5. Drainage Classes Classified According to the Coefficients of Lateral Hydraulic Conductivity.
Soil Drainage
Drainage ClassLateral HC (m/Day)
Very poor10
Poor15
Imperfect20
Moderately well25
Well30
Rapid40
Excessive50
Table 6. Adaptation Actions (Installation of Gensets and Solar Panels, Construction of Shallow Wells, Supply of Fresh and Clean Piped Water, Drilling of Boreholes, Installation of Water Towers, Construction of a Dams, Installation of Underground Tanks Piped Water Filled, Water Trough) Divided According to the Intervention Areas.
Place NameGensets and Solar PanelConstruction of Shallow WellsPiped WaterDrilling of BoreholeWater TowersDamUnderground TanksWater Trough
Durte
Barambate
Khob dertu
Elbeso
Konon Gos
Qorqa Gudha
El-Isacko Mala
El-Gufu
Barambate
El-Buka
Boji
Goricha village
Malabot
North Horr
Galas
El Boru Magado
Eredheri
Lag Balal
Tiniqo
Qorqa Diqa
Hurri Diqa
Elmuda
Wanno
Bara
Ruso
Horri Gudha
Table 7. SPI Index at 3-, 6- and 12-Month Timescales for All the Facilities.
Physical Exposure (Ep)
FloodDrought
SPI1SPI3SPI3SPI6SPI12
Facilities
Balesa181392120
Dukana1615111517
El Gadhe161361921
El Hadi1811121920
Gus171962115
Kalacha21143515
Malabot171531319
North Horr221561517
Stations
Lodwar161261815
Marsabit171561218
Moyale151761815
Table 8. Number and Distribution According to the Type of Water Sources Taken into Consideration for the Water Sources Density in AC0 and AC1.
BoreholesEarth Pans/DamsHand-Dug WellsShallow WellsPiped WaterRock CatchmentsSpringsOthers (Underground Tanks, Tanks)
AC01061354021114
AC116613591021116

