Article

Assessing the Effects of Biochar on the Immobilization of Trace Elements and Plant Development in a Naturally Contaminated Soil

by
Paloma Campos
and
José María De la Rosa
*
Instituto de Recursos Naturales y Agrobiología de Sevilla, Consejo Superior de Investigaciones Científicas (IRNAS-CSIC), Reina Mercedes Av. 10, 41012 Seville, Spain
*
Author to whom correspondence should be addressed.
Sustainability 2020, 12(15), 6025; https://doi.org/10.3390/su12156025
Submission received: 29 June 2020 / Revised: 23 July 2020 / Accepted: 24 July 2020 / Published: 27 July 2020
(This article belongs to the Special Issue Sustainable Management of Heavy Metals)

Abstract

:
Soil contamination with trace elements is an important and global environmental concern. This study examined the potential of biochars derived from rice husk (RHB), olive pit (OPB), and a certified biochar produced from wood chips (CWB) to immobilize copper (Cu2+) and lead (Pb2+) in aqueous solution to avoid its leaching and in a pot experiment with acidic Xerofluvent soils multicontaminated with trace elements. After assessing the adsorption potential of Cu2+ and Pb2+ from an aqueous solution of the three studied biochars, the development of Brassica rapa pekinensis plants was monitored on polluted soils amended with the same biochars, to determine their capability to boost plant growth in a soil contaminated with several trace elements. RHB and CWB removed the maximum amounts of Cu2+ and Pb2+ from aqueous solution in the adsorption experiment. The adsorption capacity increased with initial metal concentrations for all biochars. The efficiency in the adsorption of cationic metals by biochars was clearly affected by biochar chemical properties, whereas total specific surface area seemed to not correlate with the adsorption capacity. Among the isotherm models, the Langmuir model was in the best agreement with the experimental data for both cations for CWB and RHB. The maximum adsorption capacity of Cu2+ was 30.77 and 58.82 mg g−1 for RHB and CWB, respectively, and of Pb2+ was 19.34 and 77.52 mg g−1 for RHB and CWB, respectively. The application of 5% of RHB and CWB to the acidic polluted soils improved soil physico-chemical properties, which permitted the development of Brassica rapa pekinensis plants. RHB and CWB have been shown to be effective for the removal of Cu2+ and Pb2+, and the results obtained regarding plant development in the soils contaminated with trace elements indicated that the soil amendments have promising potential for the recovery of land polluted with heavy metals.

1. Introduction

The contamination by toxic heavy metals is a worldwide environmental problem. It encompasses great concerns, such as the pollution of water bodies by the discharge of industrial wastewaters and the pollution of soils by natural processes or anthropogenic activities (including mining). Trace elements are considered hazardous at high levels of concentration and they present long-term persistency and non-biodegradability. Thus, their onsite stabilization is considered the most effective way to reduce the risk of contamination [1]. Traditionally, organic and inorganic amendments such as compost or lime have been used for the remediation of polluted soils [2], but in recent years, biochar has drawn attention. Biochar, the solid carbonaceous residue produced by thermal treatment of biomasses in the absence of oxygen [3], typically considered an organic ameliorant for the restoration of degraded soils [4], has also been proven to be effective in the removal of heavy metals in aqueous solution [5]. Biochar properties, such as its highly porous structure, high specific surface area, cation exchange capacity, and abundant surface functional groups, make it an ideal adsorbent. According to Zhao et al. [6] and Campos et al. [7], biochar properties, including its adsorption capacity, are affected by feedstock and pyrolysis conditions. Biochar is mainly formed by sp2-hybridized carbon atoms and its adsorption behavior is influenced by chemisorbed oxygen atoms [8]. Thus, a complete characterization of biochars is required for fully understanding the adsorption behavior. Several studies have recently been performed for determining biochar adsorption of heavy metals in aqueous solution. Liu and Zhang [9] reported the effectiveness in removing lead from water with biochars from pinewood and rice husk. Chen et al. [10] also reported the effective removal of copper and zinc from aqueous solution by biochars produced from hardwood and corn straw. From these results, biochar is hypothesized to be effective in the reduction of lixiviation of contaminants in polluted soils. Biochar could be an effective amendment for the remediation of polluted flooded soils and sediments. The utilization of biochar as amendment for the recovery of polluted soils does not eliminate the pollutants as extractive techniques, but it reinforces the immobilization of the pollutants, making them less bioavailable. Thus, a great adsorption ability of biochars is required for an effective remediation of these soils. However, the effects of biochar application are not general, and the responses of biochar utilization will also depend on soil physical and chemical properties [11]. For example, increases in soil pH are commonly found when biochar is applied to an acidic soil. Plant growth has been reported to be more enhanced in acidic soils amended with biochar than in alkaline soils [12]. The remediation of soils contaminated with heavy metals is very complex due to their potential toxicity and persistence [13]. Jiang et al. [14] studied the immobilization potential of biochar produced from rice straw in a simulated polluted Ultisol. They found that the addition of biochar increased the soil pH and made the soil surface charge more negative, thus enhancing the decrease of acid soluble Cu2+ and Pb2+. Antonangelo and Zhang [15] reported the reduction in the bioaccessibility of heavy metals after the application of biochars produced from switchgrass and poultry litter in a soil contaminated with Zn, Pb, and Cd. Although the immobilization of heavy metals using biochar has been well studied in artificially polluted soils, to our knowledge, little is known about the remediation potential in naturally multicontaminated soils. Moreover, there is a lack of understanding regarding the relation of trace element adsorption between aqueous solution and the real immobilization potential when biochar is mixed with soil.
In this study, we researched biochars produced from rice husk and olive pit, agricultural wastes hugely produced in the Mediterranean countries [16], and a certified biochar produced from wood chips, and characterized by determining specific surface area, total acid sites, and iodine number. The latter parameter gives an idea of the microporous structure and it is calculated by adsorption of iodine from solution [17]. Additionally, Fourier-transform infrared (FT-IR) spectroscopy was performed for determining possible differences in the types of carbon that make up biochar and C bonds with potential to adsorb cations. After testing the effectiveness of both biochars produced at a low-cost steel reactor to remove Cu2+ and Pb2+ in a batch adsorption experiment with single-heavy-metal solutions compared to a certified wood biochar (CWB), an incubation experiment in pots was performed to study the effects of biochars on the germination and development of Brassica rapa pekinensis plants, when they are applied to soils multicontaminated with trace elements. The main goals of this study are (i) to assess the efficiency of biochars produced from contrasting agroforest residues to immobilize copper and lead and (ii) to evaluate the suitability of these biochars as soil amendments for the recovery of soils polluted with heavy metals under pot conditions. This study compares whether there is a relationship between the results obtained at a batch experiment in aqueous solution and the potential of biochars as remediation tool for soils contaminated with heavy metals. If this assumption were confirmed, it would facilitate future trials to determine whether the application of certain biochars could really become an environmentally friendly pollution remediation technology for soils polluted with trace elements, which would also allow the valorization of agricultural and forestry biomass residues.

2. Materials and Methods

2.1. Biochar Samples

The materials used for this study consisted of: A biochar from rice husk (RHB), a biochar from olive pit (OPB), and a certified biochar from wood (CWB).
Rice husk is a siliceous rich biomass with low C content, and in contrast olive pit is a lignocellulosic material with a high C content. Orivarzea S.A. (Salvaterra de Magos, Portugal) provided the rice husk material and Cooperativa Nuestra Señora de los Ángeles S.C.A. (Montellano, Spain) provided the olive pit. Feedstock material was dried in an oven (40 °C) during 48 h. Both biochars were produced at a Pyreka reactor (a continuous feed reactor with a screw conveyor; Pyreg, Germany)) under a N2 flux of 2 L min−1 at a temperature increasing up to 500 °C and 12 min of average residence time. The CWB, is a certified biochar produced by Swiss Biochar GmbH (Lausanne, Switzerland) from chips of pine and poplar pyrolyzed under N2 flux with temperature increasing up to 620 °C and 20 min of average residence time. CWB biochar has been added to this study for comparative purposes, since it is a biochar which meets all the requirements described for the European Biochar Certification (EBC). Thus, we hypothesized that CWB owns the adequate properties to be used as amendment for degraded soils.

2.2. Soil Samples

Soil samples used for the greenhouse incubation experiment were obtained from ‘Las Doblas’ site (37°23′7.152″ N, 6°13′43.175″ W), an area located closed to the Guadiamar River, that was affected by the Aznalcóllar mine accident (25 April 1998). The area belongs to a typical dry Mediterranean climate region, with a medium temperature of 17.7 °C and an average annual rainfall of 400 mm [18]. The samples consisted of sandy loam Typic Xerofluvent soils, according to Soil Survey Staff [19], with two levels of acidity and contamination with trace elements: a moderately acid polluted soil (MAPS) and an acid polluted soil (APS). Immediately after the sampling, soils were transported in sealed bags at 4 °C, dried at 40 °C during 48 h and sieved (<2 mm). The studied soils were acidic or moderately acidic and poor in C and N (Table 1, the methods used for soil characterization are described in the next section).

2.3. Physical and Chemical Characteristics

The pH was measured in triplicate in the supernatant of a 1:10 (w/v) biochar:water ratio or 1:2.5 (w/v) soil:water ratio mixtures after 30 min shaking and 30 min resting, using a CRISON glass electrode (pH Basic 20).
The WHC in soil was determined by an adaptation of the Veihmeyer and Hendrickson method [20], which was carried out by Campos et al. [7] to facilitate the analysis of biochars. The maximal WHC, expressed as the percentage relative to the total dry weight of the sample, was calculated using Equation (1):
WHC (%) = (Weight of water retained after 2 h/Initial weight of the sample)·100
For determining the ash content, 1 g of dry sample was heated at 750 °C during 6 h [21].
Total C, total H and total n were measured in triplicate by dry combustion at 100–1050 °C using an elemental analyzer LECO TRUSPEC CHNS MICRO (LECO, St. Joseph, MI, USA). The oxygen content (%) was determined according to the EBC calculations [22].
The total concentrations of Ba, Cd, Cu, Fe, Ni, Pb, Sr, and Zn were determined by ICP-OES (ICP 720-ES, Varian, CA, USA) after digestion of the soils with aqua regia in a microwave oven (Microwave Laboratory Station Mileston ETHOS 900, Milestone s.r.l., Sorisole, Italy).
Iodine number was measured according to the method ASTM D 4607-94 based on adsorption isotherm. Three different weights of dry biochar were transferred to an Erlenmeyer; 10 mL of 5 wt% HCl were added into each flask and boiled for 30 s. Afterward, 100 mL of 0.100 n iodine solution (titrated with standardized sodium thiosulfate) was added to the flasks. The mixtures were shaken during 30 s and filtered by gravity using paper filter Whatman 2 into a beaker. After discarding the first 20 mL, 50 mL of each filtrate was moved to an Erlenmeyer flask and titrated with standardized sodium thiosulfate until the solution turned into a light yellow color; 2 mL of starch indicator solution (1 g starch per 1 L water) was added. The titration continued until a colorless solution was obtained. The amount of iodine per gram of biochar can be determined from the volume of sodium thiosulfate used.
Total surface acidity and basicity were determined by modifying the procedure of Woldetsadik et al. [23]. For determining the total surface acidity, 0.5 g of biochar was added to 50 mL of 0.05 N NaOH and shaken for 48 h. The suspension was centrifuged and filtered. Afterwards, 10 mL of the supernatant aliquot was titrated with 0.05 N HCl. The titration was performed with a Metrohm 725 Dosimat (Metrohm AG, Herisau, Switzerland) fitted with a 691 pH meter (Metrohm AG, Herisau, Switzerland). Total surface basicity was measured, similarly, by adding 0.5 g of biochar to 50 mL of 0.05 N HCl and shaking for 48 h. The slurry was centrifuged and filtered. Finally, the 10 mL filtered aliquot was titrated with 0.05 N NaOH. The total surface acidity and basicity were determined by calculating the base and acid uptake of biochars.

Fourier Transform-Infrared Spectroscopy (FT-IR)

Fourier Transform-Infra Red spectroscopy (FT-IR) was performed in a JASCO® FT/IR-6300 spectrometer (Japan Spectroscopy Corporation, Tokyo, Japan). For each biochar, two KBr pellets were made under high pressure and vacuum with 1% (w/w) biochar-KBr. The spectra were then collected over a range of 600–4000 cm−1 and a resolution of 2 cm−1. In order to improve the signal-to-noise ratio, 60 scans were registered and accumulated for each recorded spectrum. Every spectrum was corrected against a pure KBr pellet. The spectra were corrected with the spectrometer software package of JASCO®.

2.4. Cu2+ and Pb2+ Adsorption Tests

Adsorption tests were performed at room temperature (25 °C) by adapting the protocol of Zhao et al. [6]. The experiments were conducted with mono-metal solutions of 0.05, 0.1, 0.5, 1, 2 and 5 mM of Cu2+ and Pb2+ as initial concentrations, by dissolving the required amounts of CuSO4·5 H2O and Pb(NO3)2·5 H2O (all 99% from Panreac) in 0.01 M NaNO3. All the chemicals were analytical grade.
Biochar samples were homogenized and milled in agate mortar and pestle. Subsequently, 20 mg of each biochar was placed in polyethylene tubes and 20 mL of each heavy metal solution was added. The tubes were shaken at 25 rpm on a rotatory mixer during 48 h to ensure the equilibrium status. After agitation, the content of the tubes was filtered through 0.45 µm syringe nylon-membrane filters to remove all biochar particles. The heavy metal concentration in the aqueous phase was measured by ICP-OES (Horiba Jobin Yvon, model Ultima 2; Horiba Ltd., Kioto, Japan). In addition, the same procedure was conducted without biochar to ensure the accuracy of the measurements. Each test was performed in triplicate.
The adsorption percentage of the three biochars for each cation was calculated by using Equation (2):
% adsorption = ((C0−Ce)/C0)·100
where C0 is the initial concentration of the ion in solution (mg L−1) and Ce is the concentration of the ion at equilibrium (mg L−1).
The capacity of the adsorbent in mg g−1 is expressed as the amount of adsorbate per adsorbent mass unit and it can be calculated using Equation (3):
qe = ((C0−Ce)·V)/m
where V is the volume of the solution in L and m is the dry weight of the biochar in g.
Monolayer isotherm, multilayer isotherm and others mathematical isotherms were applied to understand the driving forces of the adsorption of both cations on biochar surfaces and to understand the array of dynamics. The equilibrium data were fitted by the linear forms of the Langmuir, Freundlich, Temkin, and Dubinin–Radushkevich (DRK) isotherm models.
Langmuir isotherm model assumes monolayer adsorption as that adsorption can only occur at a finite number of definite localized sites. In the linear form of the isotherm, Ce/qe (g L−1) is plotted against Ce (mg L−1) as the Equation (4):
Ce/qe = (1/(Qo·b)) + ((1/Q0)·Ce)
The representation of these values has a slop of 1·Q0−1, where Q0 (mg g−1) is the Langmuir constant related to the maximum adsorption capacity. b (L mg−1) is the Langmuir constant related to the affinity between the adsorbate and the adsorbent.
The linear form of the Freundlich isotherm can be plotted as Equation (5):
ln qe = ln KF + (1/n)·ln Ce
where KF (mg g−1)(L mg−1)1/n is the Freundlich constant related with the adsorption capacity of the adsorbent and n is the Freundlich constant related with the adsorption intensity and its degree of heterogeneity.
Temkin model covers adsorbate-adsorbent interactions. In the linear form of the Temkin isotherm, qe is plotted against ln Ce according to the Equation (6):
qe = B·ln A + B·ln Ce
where B can be calculated as B = RT/b, being R the gas constant (8.314 J mol−1 K−1), T the absolute temperature (K) and b the Temkin constant related to heat of sorption (J mol−1). Finally, A is the Temkin isotherm constant (L g−1).
The Dubinin–Radushkevich (DRK) isotherm is related to a multilayer physical adsorption process. The linearized form of DRK isotherm is written in Equation (7):
ε = RT·ln (1 + (1/Ce))
The best fitting model between the experimental and the modelled data was determined based on the value of the regression coefficient, R2.

2.5. Development of Brassica rapa Pekinensis: A Pot Experiment with Trace Element Contaminated Soils

Soil–biochar mixtures (Table 2) were prepared in plastic pots with doses of 2 and 5% w/w of biochar:soil, which are biochar doses commonly applied in pot studies (samples: MAPS_2%RHB, MAPS_5%RHB, MAPS_2%OPB, MAPS_5%OPB, APS_2%RHB, APS_5%RHB, APS_2%OPB, APS_5%OPB). Previously conducted tests in similar soils showed that the application of 2% CWB did not cause significant changes in plant development. Thus, for comparison purposes, mixtures of 5% w/w of CWB:soil were prepared (samples: MAPS_5%CWB, APS_5%CWB).
Biochars were used as produced without milling with an average grain size in the range of 2–6 mm. Four replicates (n = 4) were prepared for each mixture and pots with 200 g of soil without biochar were used as control (samples: MAPS_Control, APS_Control; n = 4). Three certified seeds of Brassica rapa pekinensis were sown in each pot, which were randomly placed in a greenhouse at 25 °C and 12 h light/day for 63 days. Soil moisture was adjusted and maintained to 60% of the maximum water holding capacity (WHC). After 63 days of experiment, soil and plants analysis were performed.

2.5.1. Soil Analysis

At the end of the pot experiment, soil pH was measured in the supernatant of a 1:5 (w/v) soil: CaCl2 ratio mixture after shaking 30 min and resting 30 min using a pH meter (CRISON pH Basic 20). Electrical conductivity (EC) was measured in the supernatant of a 1:5 (w/v) soil:distilled-water ratio after shaking 30 min and resting 30 min using a conductivimeter (CRISON EC Basic 30).
WHC was measured with an adaptation of the method of Veihmeyer and Hendrickson [20]. The water retained by 2 g of sample over a filter paper Whatman 2 was weighed after 2 h. The maximal WHC (100% WHC) is expressed as the percentage relative to the total dry weight of the sample.

2.5.2. Plant Germination and Development

During the pot experiment, germination and survival of Brassica rapa plants were determined by counting the number of living plants after 4, 8, 16, 25, 31, and 63 days. Shoot length (mm) was also determined after 4, 8, 16, 25, 31, and 63 days. To evaluate the biomass production and water content per plant at 31 and 63 days, shoots were cut, dried at 60 °C during 72 h and weighed. Chlorophyll was extracted with dimethyl sulfoxide (DMSO) at 65 °C by using the Hiscox and Israelstam [24] method. Equations proposed by Wellburn [25] for determining chlorophyll a, b and total chlorophyll content (mg of chlorophyll g−1 of fresh weight) were used. Finally, roots were hand-separated from the soil, dried (72 h at 60 °C) and weighed. The root-to-shoot ratio was calculated by dividing root dry weight by the sum of leaf and stem dry weights.

2.6. Data Analysis

All the results are shown as mean values ± Standard Error (SE). The Shapiro–Wilk test was used for testing normality, whereas the Levene test was used for testing homoscedasticity. One-way analysis of variance (ANOVA) and Tukey’s Honestly Significant Difference (HSD) test were performed to study the effects of biochar application on soil properties and plant development. Finally, the Kruskal Wallis test followed by the Man–Whitney U test were performed for non-normal variables. The significance level for the tests was 0.05. Regression analysis was used for evaluating the isotherm models and R2 was used to indicate the fitness of the models. Statistical analyses were carried out using IBM SPSS Statistics 26.0 (SPSS, Chicago, IL, USA).

3. Results and Discussion

3.1. Biochar Properties

Table 3 comprises the physical and chemical properties of biochars. The three biochars were alkaline (pH > 9). Nevertheless, notable differences were found in the WHC. RHB showed a much greater WHC (595%) than the woody-biochars (70–243%). Campos et al. [7] also reported greater WHC for RHB than OPB, which could be due to the water retention between the silicon layers. WHC for RHB and woody-biochars in this study are greater than that found by Varela Milla et al. [25]. In contrast, the specific surface area (SSA-BET) of OPB (473 m2 g−1) and CWB (403 m2 g−1) were greater than RHB (292 m2 g−1) (Table 3). Varela Milla et al. [26] also reported the greatest surface area for wood biochar than for RH biochar. SSA-BET of CWB is in accordance with the results reported by James et al. [27], which attributed a surface area over 400 m2 g−1 for wood chips biochar. SSA-BET of RHB are similar to the obtained results of RHB produced at 650 °C by Pariyar et al. [28] and produced at 800 °C by Jindo et al. [29], which indicate that applying a higher temperature to this material would not result in higher SSA-BET.
Iodine number, which is a parameter based on the capacity of iodine adsorption, provides a complementary idea of the micropore structure because iodine molecules are mainly adsorbed into micropores [30]. In fact, Hernandez-Magliano and Capareda [31] maintained that iodine number best represents the real adsorptive power of the adsorbent than the commonly analyzed specific surface area (SSA-BET). Iodine index was greater for RHB (180 mg g−1) than for CWB (149 mg g−1) and OPB (123 mg g−1). Dissanayake et al. [17] and Phuong et al. [32] reported lower iodine numbers (between 90 and 150 mg g−1) for RHB produced at 500 °C than those reported here (180 mg g−1).
Total surface acidity reflects the total number of acid functional groups on the surface of biochar, such as carboxyl, phenolic, and lactonic groups, which could be related to the ability to retain certain ions. The total surface acidity of the studied biochars ranged from 0.17 for OPB to 1.70 meq g−1 for RHB. The total basicity values of the three biochars were lower than the values for the acidic sites. This result is in accordance with the results reported by Woldetsadik et al. [23], Singh et al. [33] and Uras et al. [34]. Li et al. [35] attributed the low basicity of biochars to pyrolysis temperatures lower than 600 °C.
The low H/Cat ratios (0.3–0.4) indicate a high degree of carbonization and condensation [36], which is in agreement with the predominance of aryl C in biochars produced from the same raw material and pyrolysis temperature reported by De la Rosa et al. [3] and Campos et al. [7].
The broad signals in the FT-IR spectra appearing at around 3000 and 3600 cm−1 are assigned to O-H vibrations (Figure 1). The peak at 1690 cm−1 for CWB is related with aromatic C = C bending and alkene C = C stretching, whereas the peaks at 1550 cm−1 and 1430 cm−1 have been attributed to graphite moieties and to aromatic C = C skeletal vibrations, respectively [37]. The band at 1060 cm−1 together with signals at 805 and 468 cm−1 confirmed the Si-O-Si vibrations, Si-C and Si-O bonds for the RHB [38]. The peak at about 900 cm−1 which is present in the 3 samples can assigned to the band of the out-of-plane bending for CO32- but other small peaks which are present below 1000 cm−1 can also be assigned to bending of C-H aromatic out of the plane.

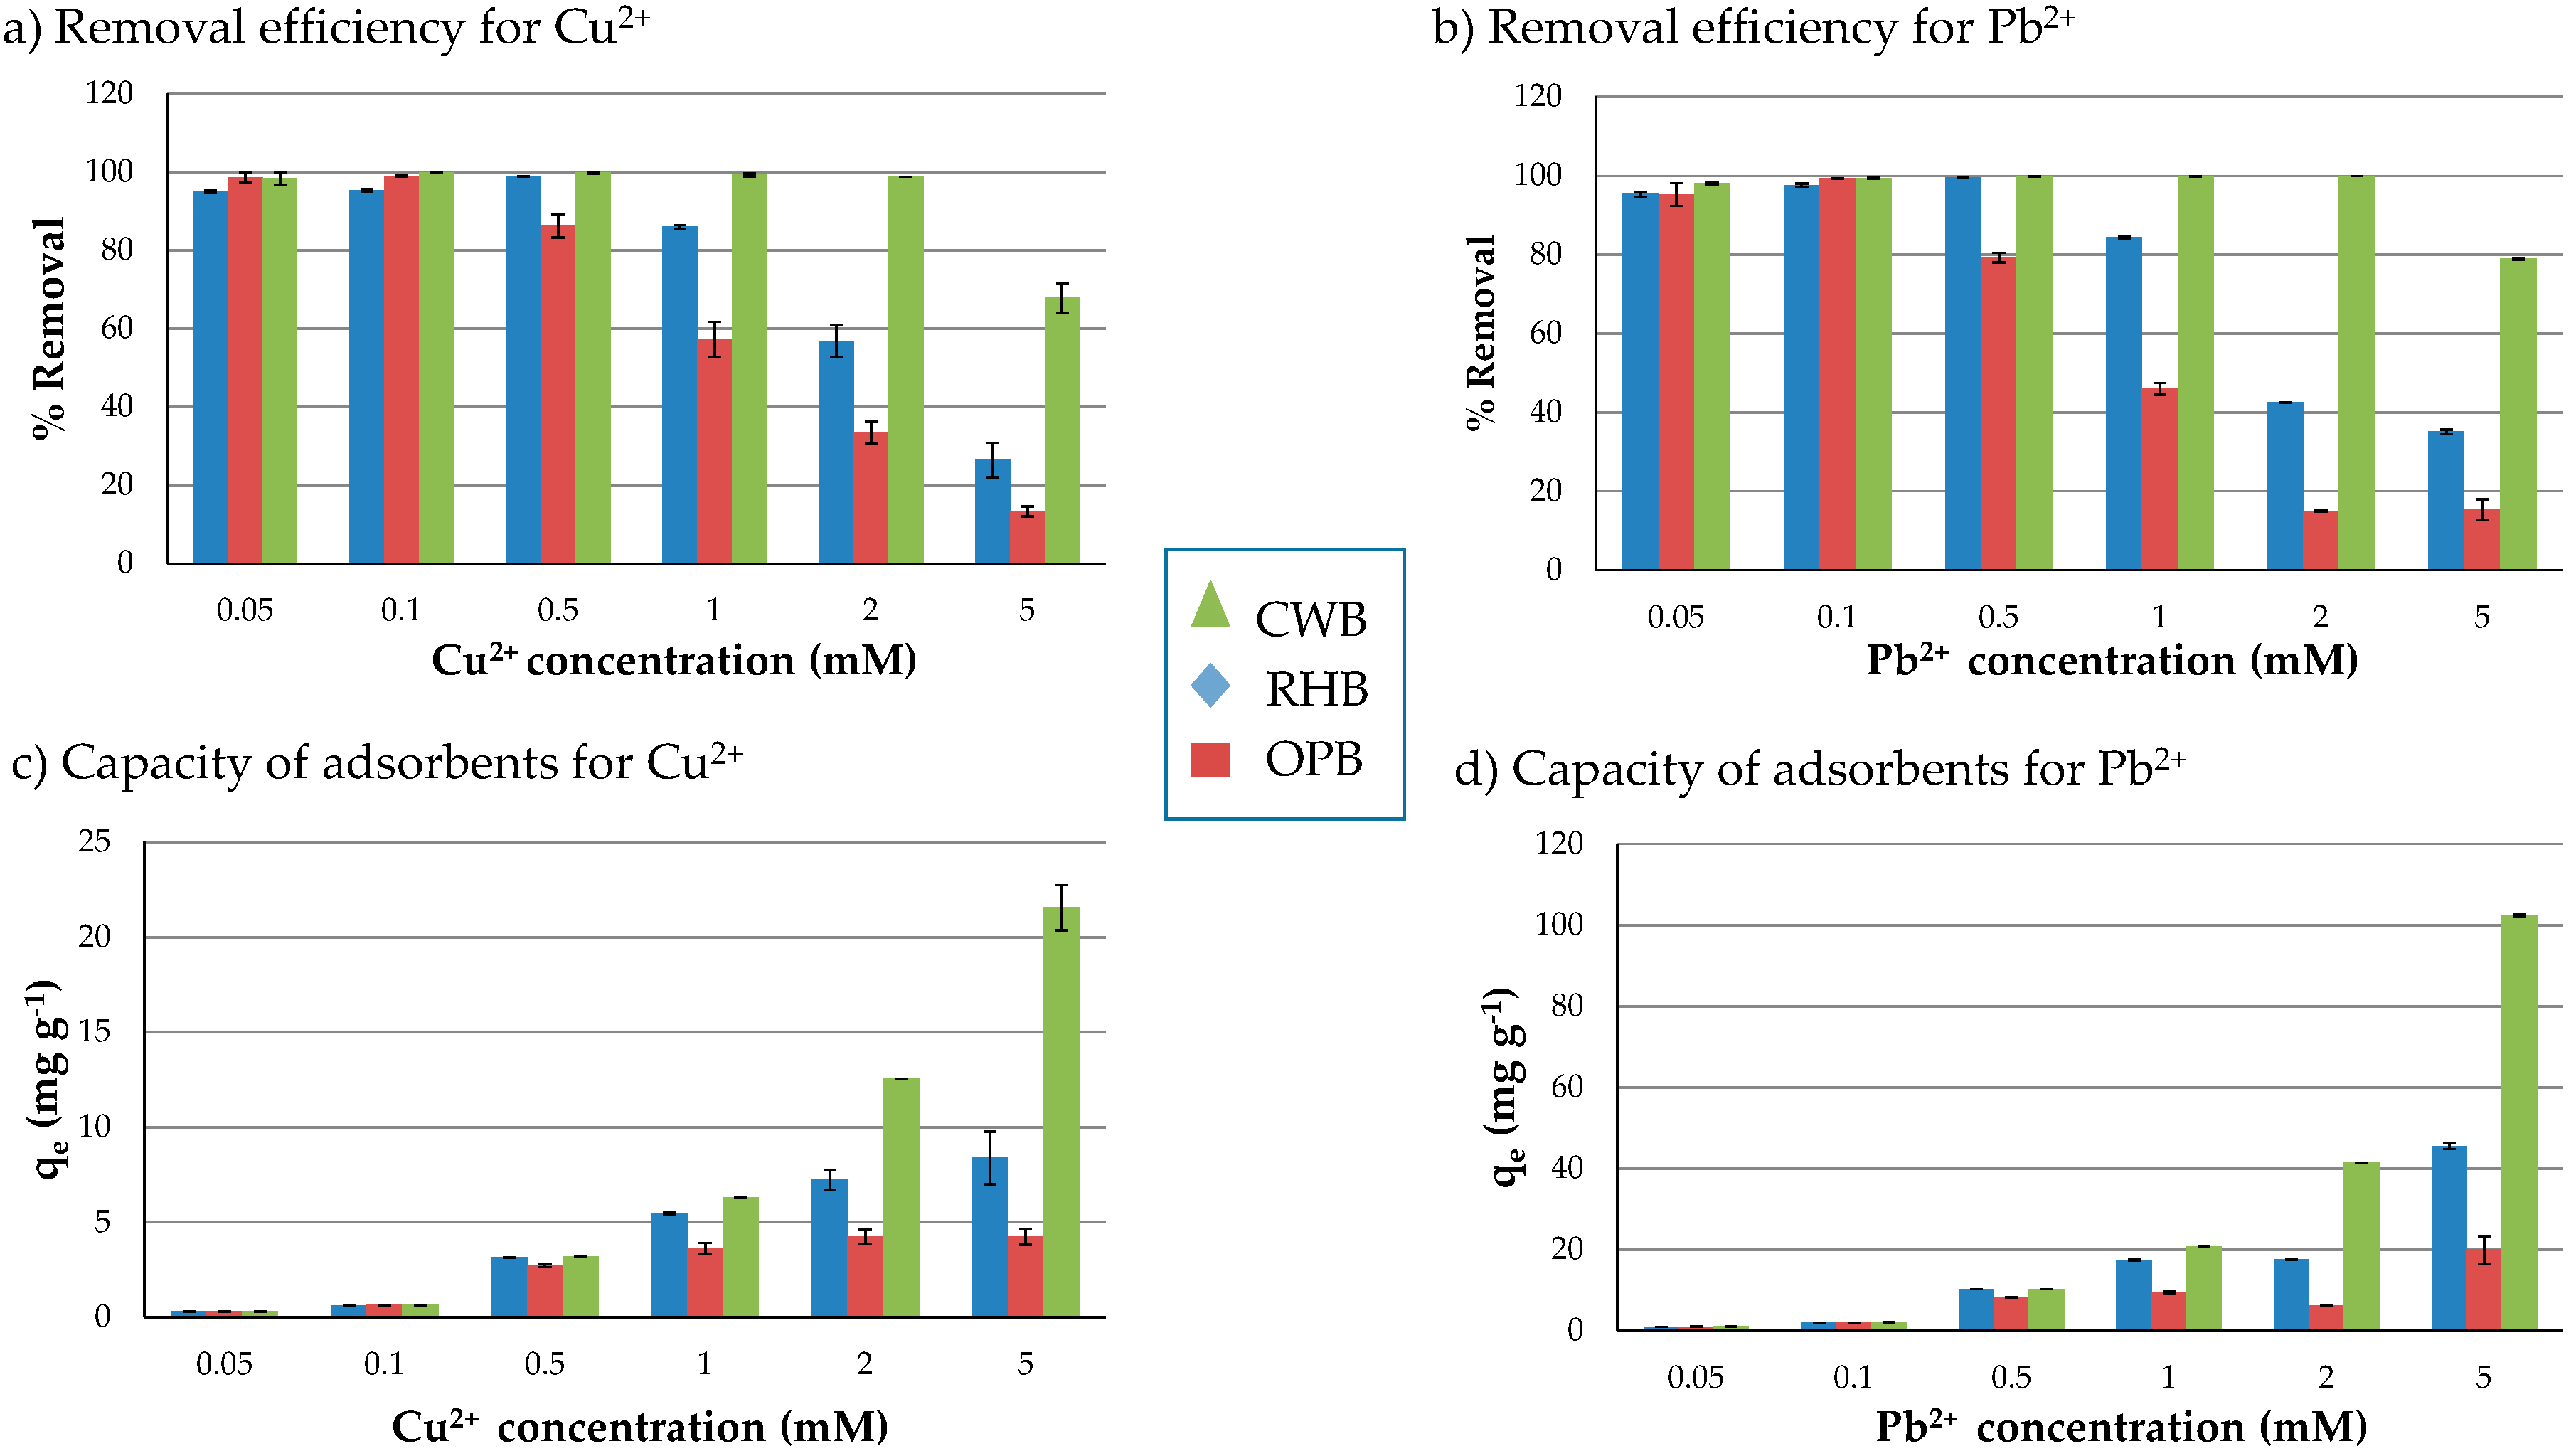
3.2. Cu2+ and Pb2+ Adsorption Capacity of Biochars

The effects of the initial metal concentrations on the adsorption capacity by the biochars were examined by varying the initial Cu2+ and Pb2+ concentrations from 0.1 to 5 mmol L−1 (Figure 2). Figure 2a,b show the percentage of removal of each cationic metal from the aqueous solution by the three biochars with increasing cation concentration. For both metals, CWB showed the greatest removal efficiency for all the concentrations tested, followed by RHB. Specifically, the percentage of removal by CWB for Cu2+ adsorption remained constant at around 100% for concentrations up to 2 mM of Cu2+ and it decreased until 68% when the initial concentration was 5 mM (Figure 2a). For RHB, the removal percentage was about 60% for initial concentration of Cu2+ of 2 mM, whereas for OPB the removal was already lower than 60% for 1 mM of Cu2+ and decayed to less than 20% at 5 mM. The removal of lead followed a similar tendency to that of copper. CWB showed 100% of removal until 2 mM of Pb2+ and 79% for 5 mM (Figure 2b). For RHB, the removal percentage was greater than 80% for concentrations ≤ 1 mM and 50% for Cu2+ concentrations ≥ 2 mM. The percentage of Pb2+ removal for OPB was 46 at 1 mM and it was lower than 20% for ≥ 2 mM. This test shows that despite the high SSA-BET of OPB a rapid filling of the binding sites occurs on the surface of this biochar. Thus, the saturation of the sorption sites and the reduction of removal efficiency arises at very low concentrations of the ion. El-Ashtoukhy et al. [39] also reported decreases in cation removal as the initial amount increased due to saturation of the active sites of the adsorbent. Great adsorption by biochars may suggest a high potential to reduce metal lixiviation when applied to polluted soils. Thus, the biochars produced from RH could be effective in the remediation of soil when the leachable concentration of metal ions is lower than 2 mM. The CWB could be effective until leachable concentrations of 5 mM.
Figure 2c,d show the capacity of the adsorbents, reporting that increasing the initial amounts of cations caused an increase in the amount of the metal adsorbed per adsorbent mass unit. A higher capacity to adsorb Pb2+ than Cu2+ is observed for all the biochars tested. Samsuri et al. [40] also reported greatest adsorption capacity for Pb2+ than Cu2+ in RHB, possibly due to the fewest number of electrons in the outermost valence of Pb2+ allowing it to bind more effectively with functional groups of donor sites on biochar surface. The greatest capacity measured was 21.6 mg g−1 for Cu2+ and 102.4 mg g−1 for Pb2+ on CWB. Moreover, the lowest values were measured for the OPB with 4.2 and 20.0 mg g−1 for Cu2+ and Pb2+, respectively. The lack of correlation between SSA-BET and adsorption capacity of the biochars indicates that the physical adsorption of both cations to biochar surface was not the dominant mechanism [41]. OPB showed the greatest SSA-BET, whereas it also showed the lowest percentage of removal for both cations. Xu et al. [42] also reported high sorption of metals on biochars with low SSA-BET. In the same way, iodine index, which is typically related to the microporous surface structure, was greater for RHB than for CWB, whereas the adsorption capacity followed the opposite trend. These results indicate that the adsorption capacity of ions isprobably more related with the chemical properties than the physical properties of biochars.

Isotherm Models in Adsorption Tests

Regression coefficients of the isotherms for the adsorption of Copper and Lead show that the best fit of the experimental data was the Langmuir model isotherm for RHB and CWB (R2 ≥ 0.9975; Table 4). Contrastingly, Pellera et al. [43] reported that the Freundlich model best explained the adsorption of Cu2+ by RHB produced at 600 °C. CWB showed a greater Langmuir affinity value (b) and maximum adsorption capacity (Qm) for both cations than RHB. CWB showed a greater adsorption capacity for Pb2+ than for Cu2+ (77.52 mg g−1 and 58.82 mg g−1, respectively; Table 4). Nevertheless, RHB showed a greater adsorption capacity for Cu2+ (30.77 mg g−1) than for Pb2+ (19.34 mg g−1). The adsorption capacity of Cu2+ by RHB was similar to the values reported by Samsuri et al. [40], but greater than the values reported previously for other biochars produced under contrasting conditions [9,10]. In the case of OPB, the best fitting isotherm for Cu2+ adsorption was the Temkin model, whereas for Pb2+ it was the Freundlich isotherm with correlation coefficients of 0.9989 and 0.7966, respectively. The differences in the mechanisms were due to the complexity of the cation–substrate interactions. Pb and Cu cations have an affinity for carboxyl and hydroxyl groups and they can easily react with the unshared pair of electrons in O, N, P and S atoms of functional groups [40,44]. Possible mechanisms for Pb2+ and Cu2+ adsorption may include complexation with the oxygenated functional groups and cation-π interactions [45]. In this study, biochars from the same pyrolysis conditions did not induce similar adsorption mechanisms. RHB and CWB showed a better fit with the Langmuir isotherm. This consists of a monolayer adsorption process assuming no interactions between adsorbed cations and that the adsorption sites have equivalent adsorption energies. This result suggests that CWB and RHB probably have enough acidic sites to adsorb Pb2+ and Cu2+ at the studied concentrations in a monolayer without interactions between them. In contrast, OPB presented very few acid sites, thus the adsorption mechanism at its surface was different. For Pb2+ at OPB, the well-fitted isotherm was the Freunlinch model that consists of adsorption onto heterogeneous surfaces, whereas for Cu2+, the best fit was the Temkin model, which assumes a uniform distribution of binding energies up to a maximum binding energy [45].

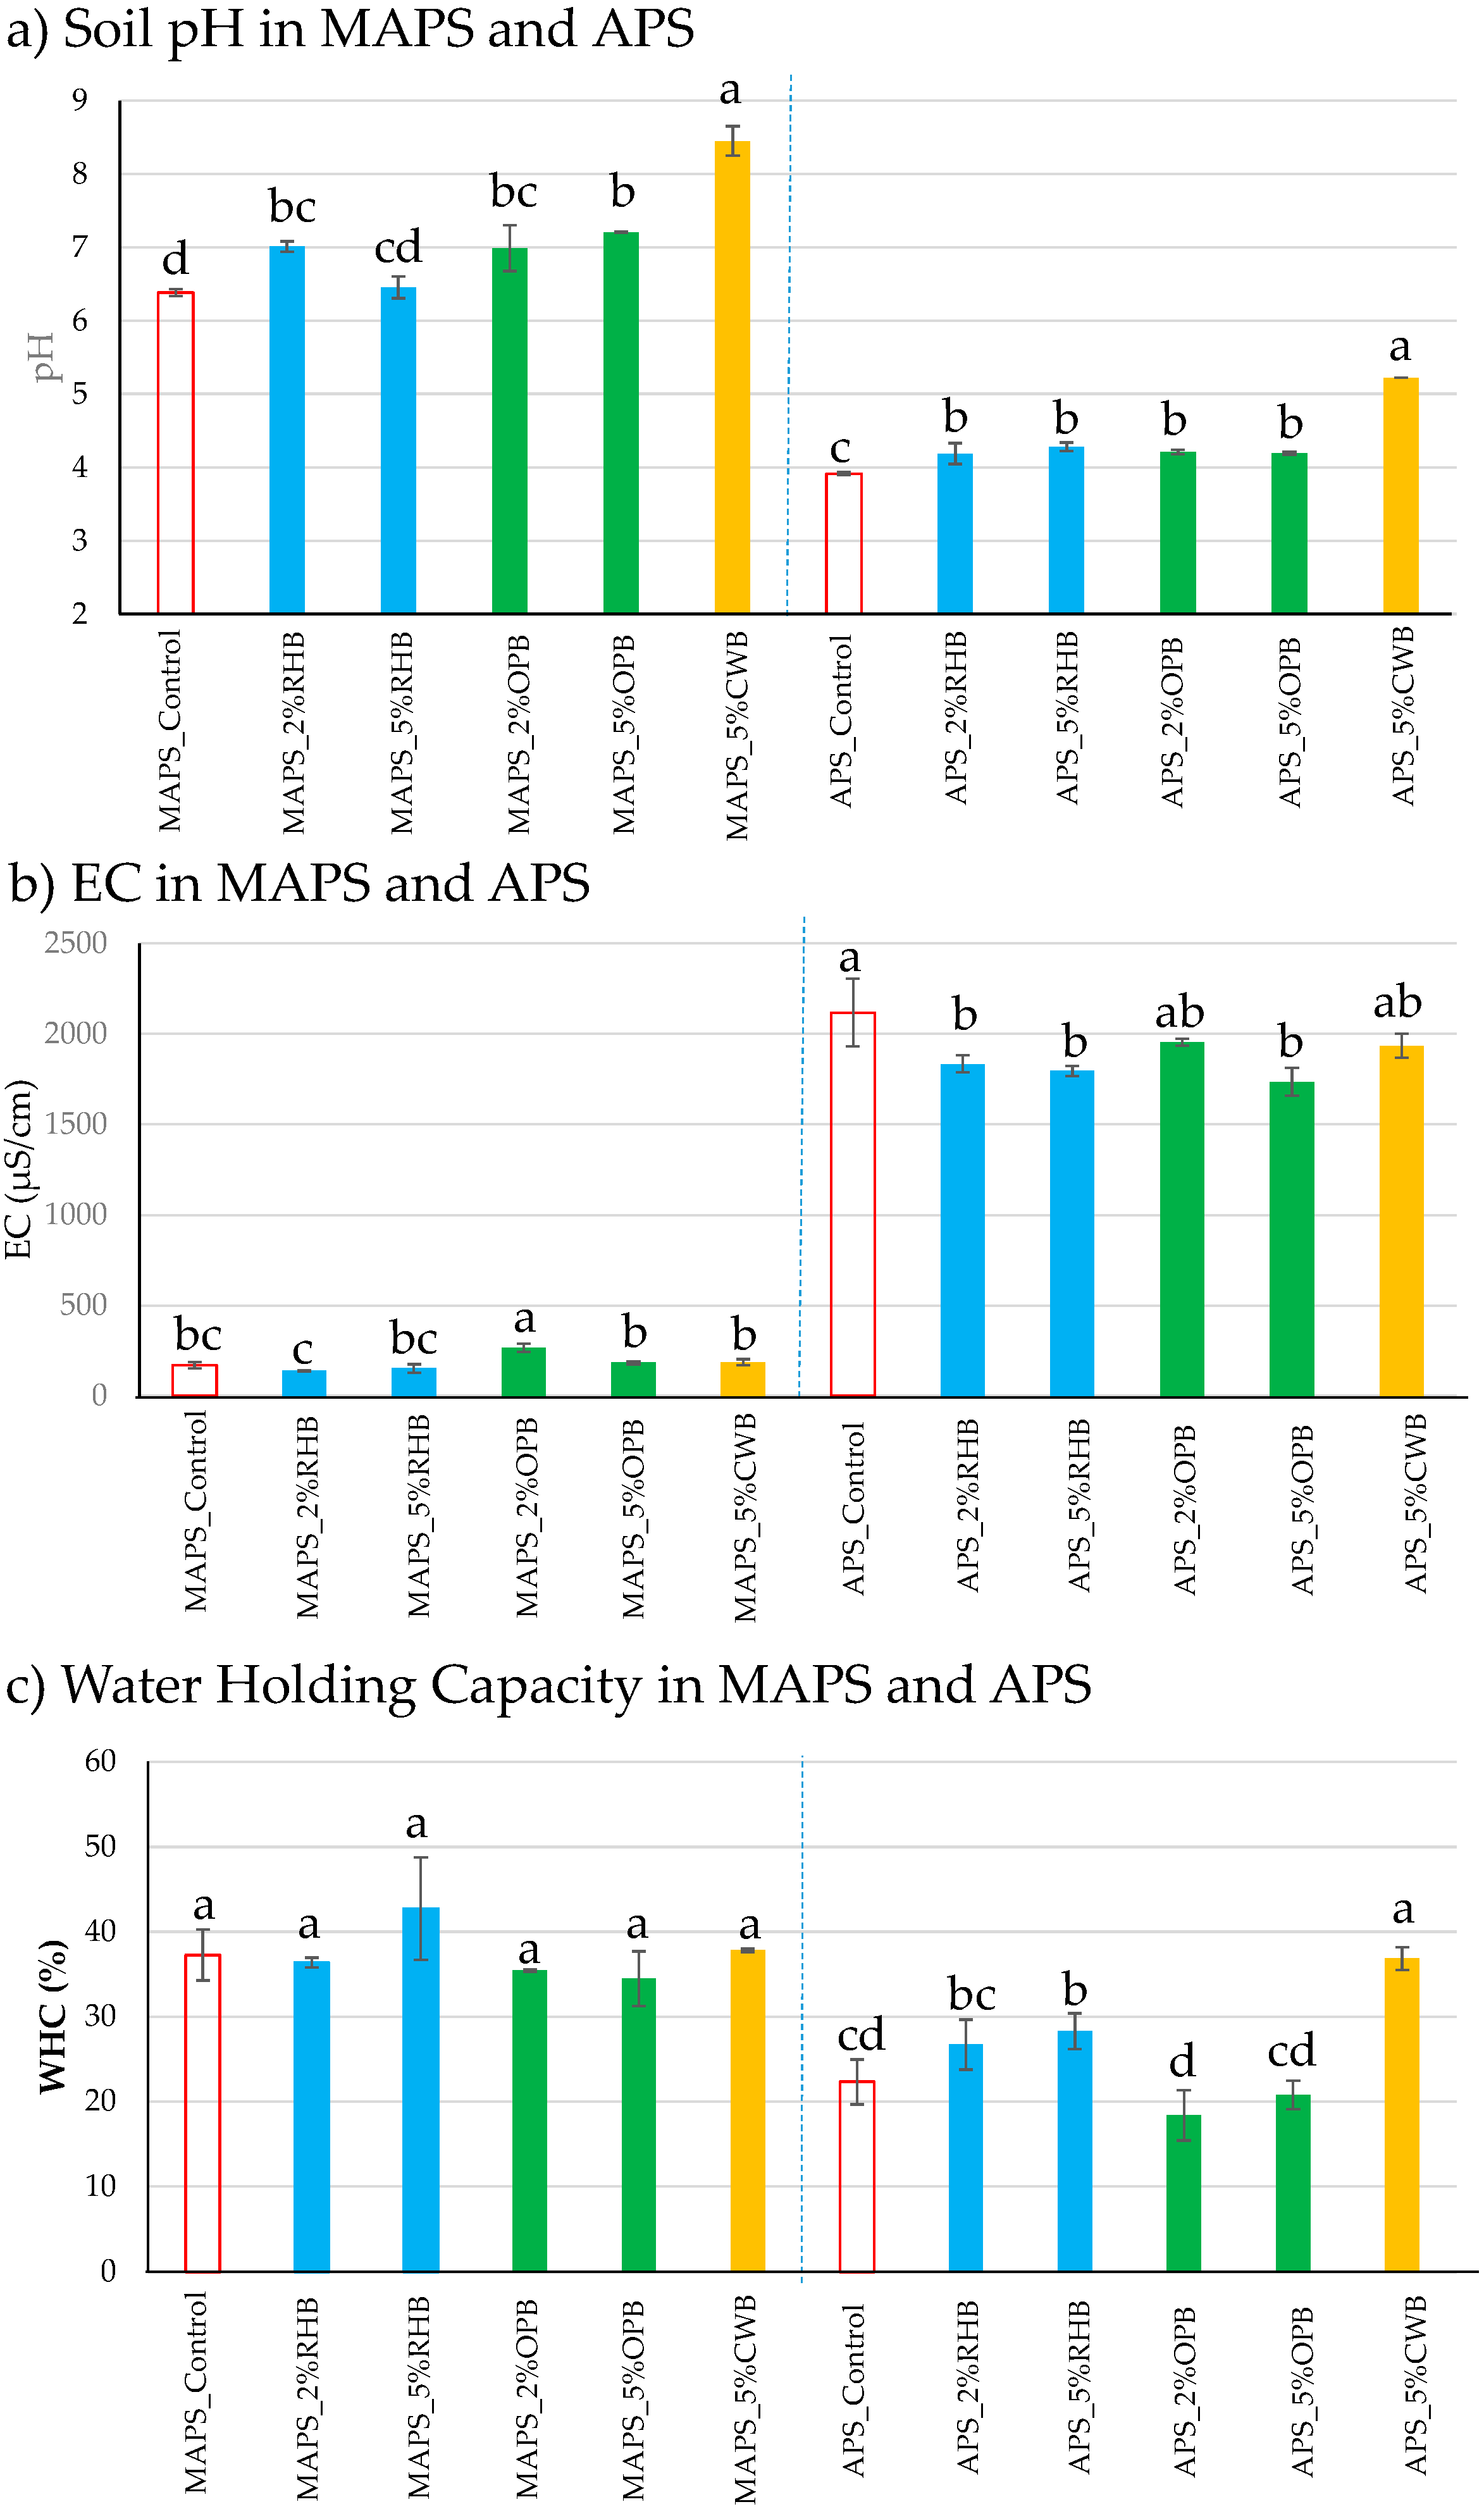
3.3. Effects of Biochar Amendments on Soil Properties

As expected, the addition of biochar to acidic and moderately acidic soils significantly increased soil pH (APS and MAPS; Figure 3a) due to the high alkalinity of the three biochars applied (Table 3). In both soils, the greatest increases in pH were achieved after the application of the certified biochar produced from wood chips (CWB). Nevertheless, no significant difference was observed regarding the soil pH between biochar doses for the same biochar. In general, the addition of biochars to acidic soils increases soil pH [46,47,48] and may reduce the mobilization of trace elements [49].
The electrical conductivity (EC) of MAPS samples was much lower than that of APS (Figure 3b). The high EC values of APS samples are probably due to the abundance of soluble salts. This result is consistent with its high Na content, which is double that of MPS (Table 1). In MAPS, EC was not altered due to biochar addition in comparison with the un-amended pots (MAPS_Control), with the exception of the slight increase in the application of 2% of OPB. However, for APS the application of 2 and 5% of RHB and 5% of OPB reduced EC in comparison to the control pots. Chintala et al. [46], Alotaibi and Schoenau [50] and Al-Wabel et al. [51] reported significant increases in soil EC after biochar addition due to extremely high contents of salts in the biochars. High EC in soils may have negative effects on plant health, reducing water and nutrient uptake. According to Soil Survey Division Staff [52], soils with ≥ 2000 μs cm−1 are considered saline. Thus, APS_Control can be described as a saline soil.
Concerning the water holding capacity (WHC), biochar amendment did not modify the WHC of MAPS (Figure 3c), but the application of 5% of RHB and CWB significantly increased WHC in APS, which has been attributed to the high porosity and organic carbon content of biochar. Yu et al. [53] demonstrated a direct relationship between biochar dose and soil WHC. However, other authors have shown that this trend is non-linear [4].

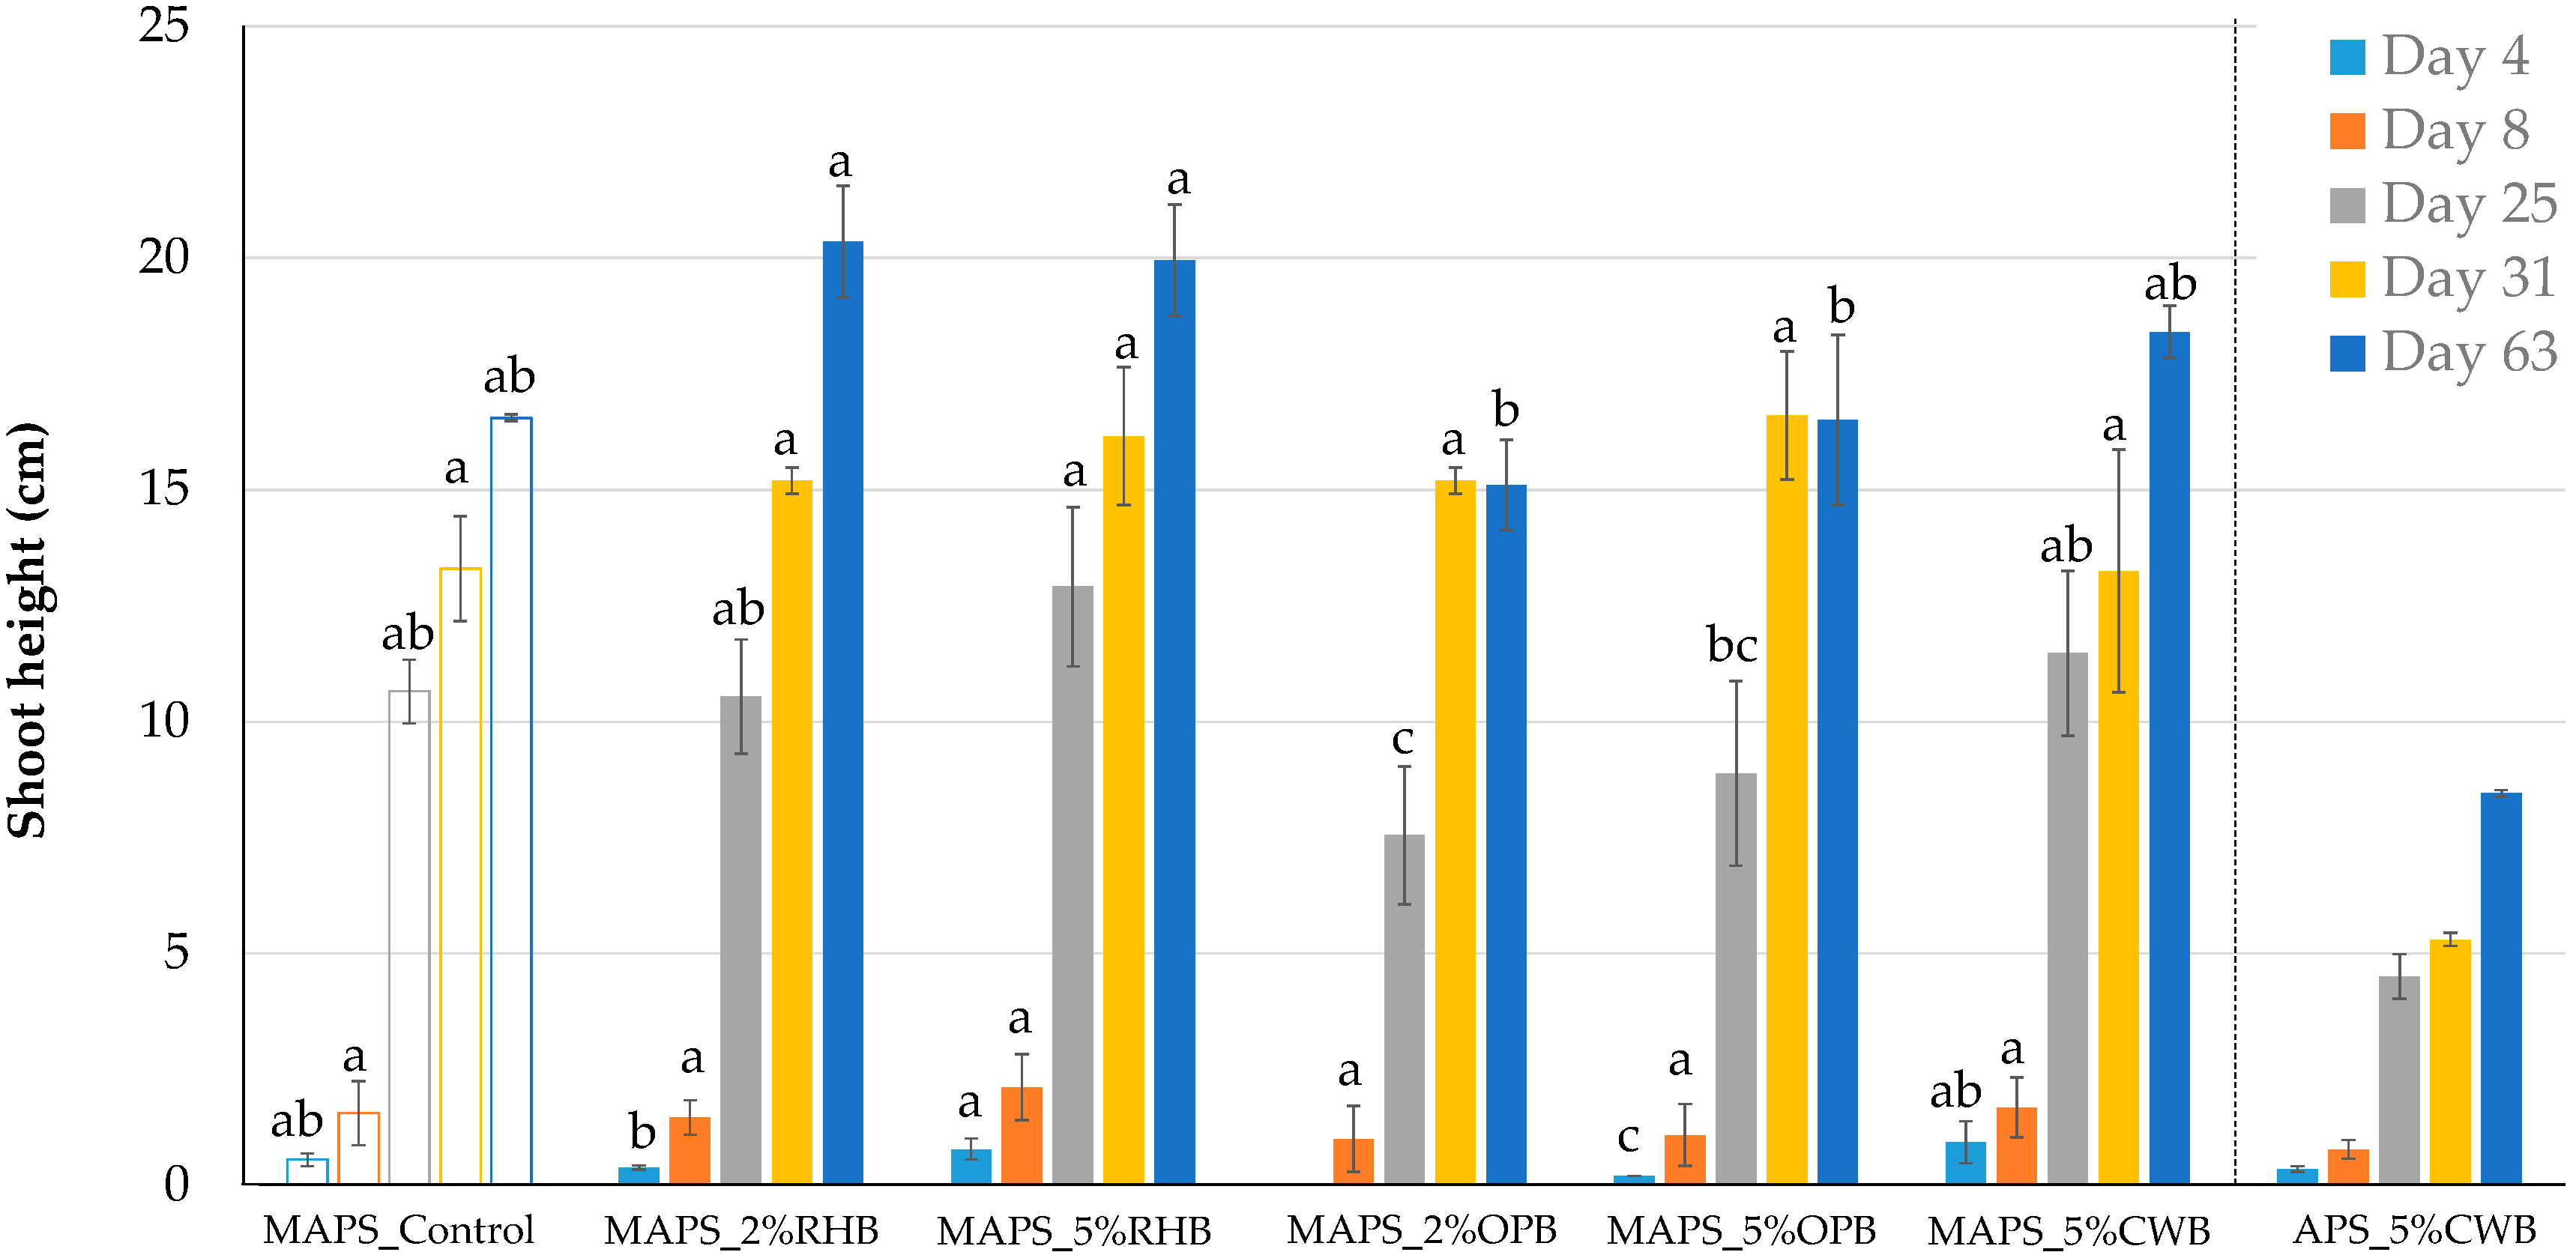
3.4. Effect of Biochar Amendments on Plant Germination and Growth

The germination and survival rates of Brassica rapa plants were contrastingly different for APS and MAPS (Table 5). No plant germination in any of the APS pots was observed except for the amendment with 5% of CWB, which also increased the soil WHC. The lack of plant development for the APS is a consequence of the properties of this degraded soil. As was previously shown, it has a very acidic pH, high EC and high trace element content [54]. In the case of the treatment with 5% of CWB, despite germination being delayed (by day 4 only 44% of the plants had germinated), the plant survival of this treatment encompassed 78%. A certain slowing down of germination was alsoobserved in some RHB amended pots for MAP soils. Regarding plant survival rates, they were significantly lower (p < 0.05) for the pots amended with OPB than for the rest of the treatments. The effects of biochar on germination are still under debate, as several authors found contradictory results. Song et al. [55] studied the phytotoxicity of biochar and reported a phytostimulatory effect rather than a phytotoxic effect. Liopa-Tsakalidi and Barouchas [56] also reported increases in germination after biochar addition. Nevertheless, Solaiman et al. [57] reported increases, no changes and decreases in plant germination after the application of five different biochars. Paneque et al. [58] also showed no differences in germination with the application of biochars from sewage sludge to a Calcic Cambisol.
In order to have more information on the average health status of the plants, the chlorophyll contents of plant leaves were determined in the middle and at the end of the pot experiment (Table 5). Curiously, the concentrations of chlorophyll a, chlorophyll b and total chlorophyll were significantly lower (p < 0.05) for MAPS amended with CWB than for the control soil after 31 days of incubation, but increased non-significantly at the end of the experiment. Hashmi et al. [59] reported increments in chlorophyll pigments after the application of Pongamia pinnata L. leaf waste biochar in Pisum sativum L. exposed to nutritional stress. Danish et al. [60] also found increments in chlorophyll content in spinach after the application of banana peel waste biochar to a soil contaminated with chromium. Nevertheless, Chrysargyris et al. [61] reported a decrease in chlorophyll b content with the application of 7.5% of biochar from forest wood. It is necessary to study in more detail the effects of biochar on this parameter, in order to reach valid conclusions.
On the contrary, biochar addition caused a clear effect on the height of plant shoots (Figure 4). After 4 days of the experiment, shoot height was greater in the pots amended with 5% of biochar than those amended with 2% of biochar. Application of 2 and 5% of RHB to MAPS significantly increased shoot height at the end of the incubation in contrast with the application of OPB, which reduced plant height. Similarly, Swagathnath et al. [62] reported wide-ranging trends in shoot height after the application of biochar. High concentrations of heavy metals in soil cause adverse effects on plant growth. Thus, an enhancement of shoot height in soils contaminated with heavy metals after biochar addition could point to an improvement of soil properties that would facilitate the recovery of the functions of these soils.
Another indicator used to assess the effect of biochar on plant development has been the dry weight of aerial parts and roots (Table 6). In MAPS pots, the dry weight of aerial biomass increased with the application of 5% of RHB and CWB in comparison with those amended with OPB, but no difference was found in comparison with the control pots. Further, the addition of 5% of RHB and CWB increased the dry weights of roots as seen in the increase of the root-to-shoot ratio for those treatments. This result is an indicator of a greater plant root development caused by biochar.

4. Conclusions

This study showed that the CWB and RHB biochars have a great capability for the adsorption of Cu2+ and Pb2+. In general, acidic sites on biochar surfaces were recognized as the key structural features leading the adsorption of the studied heavy metals. In the case of rice husk and olive pit biochars produced under similar pyrolysis conditions, the adsorption mechanisms of metallic cations were determined by the feedstock nature and composition, which resulted in different adsorption mechanisms. RHB showed an efficient adsorption of Cu2+ and Pb2+ up to concentrations of 5 mM, which makes it a valid tool to reduce metals lixiviation in polluted soils. This study revealed that the application of 5% of CBW and RHB, and to a lesser extent 2%, to a moderately acid soil polluted with heavy metals increased soil pH and enhanced plant development. Nevertheless, the application of OPB did not produce significant progress. This study confirmed that the performance of adsorption and pot experiments is a fast and effective strategy to assess the suitability of biochars as soil amendments for the recovery of soils polluted with heavy metals.

Author Contributions

J.M.D.l.R. and P.C. conceived the work. Conceptualization, J.M.D.l.R. and P.C.; methodology, P.C.; formal analysis, P.C.; resources, J.M.D.l.R.; data curation, P.C.; writing—original draft preparation, P.C.; writing—review and editing, J.M.D.l.R.; supervision, J.M.D.l.R.; project administration, J.M.D.l.R.; funding acquisition, J.M.D.l.R. All authors have read and agreed to the published version of the manuscript.

Funding

This research was funded by the Spanish Ministry of Economy, Industry and Competitiveness—MINEICO and AEI/FEDER funds of the European Union (CGL2016-76498-R project; José M. De la Rosa “Ramón y Cajal” post-doctoral contract) and Fundación Tatiana Pérez de Guzmán el Bueno (Paloma Campos contract).

Acknowledgments

Orivarzea S.A. and Cooperativa Nuestra Señora de los Ángeles S.C.A. are thanked for providing the feedstock. Thanks are due to Thomas Bucheli for facilitating the access to the pyrolysis reactor at Agroscope Zurich and Nikolas Hagemann is thanked for his help during the production of the biochars. Águeda Sánchez Martín and María Luisa Sánchez Martín are thanked for their technical assistance for ICP-MS analysis.

Conflicts of Interest

The authors declare no conflict of interest.

References

  1. Suman Raj, D.S.; Aparna, C.; Rekha, P.; Bindhu, V.H.; Anjaneyulu, Y. Stabilization and solidification technologies for the remediation of contaminated soils and sediments: An overview. Land Contam. Reclamat. 2005, 13, 23–48. [Google Scholar] [CrossRef]
  2. Madejón, P.; Domínguez, M.T.; Gil-Martínez, M.; Navarro-Fernández, C.M.; Montiel-Rozas, M.M.; Madejón, E.; Murillo, J.M.; Cabrera, F.; Marañón, T. Evaluation of amendment addition and tree planting as measures to remediate contaminated soils: The Guadiamar case study (SW Spain). Catena 2018, 166, 34–43. [Google Scholar] [CrossRef]
  3. De la Rosa, J.M.; Paneque, M.; Miller, A.Z.; Knicker, H. Relating physical and chemical properties of four different biochars and their application rate to biomass production of Lolium perenne on a Calcic Cambisol during a pot experiment of 79 days. Sci. Total Environ. 2014, 499, 175–184. [Google Scholar] [CrossRef] [Green Version]
  4. Paneque, M.; De la Rosa, J.M.; Franco-Navarro, J.D.; Colmenero-Flores, J.M.; Knicker, H. Effect of biochar amendment on morphology, productivity and water relations of sunflower plants under non-irrigation conditions. Catena 2016, 147, 280–287. [Google Scholar] [CrossRef] [Green Version]
  5. Amin, M.T.; Alazba, A.A.; Shafiq, M. Removal of Copper and Lead using Banana Biochar in Batch Adsorption Systems: Isotherms and Kinetic Studies. Chem. Eng. J. Arab. J. Sci. Eng. 2018, 43, 5711–5722. [Google Scholar] [CrossRef]
  6. Zhao, J.J.; Shen, X.-J.; Domene, X.; Alcañiz, J.-M.; Liao, X.; Palet, C. Comparison of biochars derived from different types of feedstock and their potential for heavy metal removal in multiple-metal solutions. Sci. Rep. 2019, 9, 9869. [Google Scholar] [CrossRef] [Green Version]
  7. Campos, P.; Miller, A.Z.; Knicker, H.; Costa-Pereira, M.F.; Merino, A.; De la Rosa, J.M. Chemical, physical and morphological properties of biochars produced from agricultural residues: Implications for their use as soil amendment. J. Waste Manag. 2020, 105, 256–267. [Google Scholar] [CrossRef]
  8. Boehm, H.P. Surface oxides on carbon and their analysis: A critical assessment. Carbon 2002, 40, 145–149. [Google Scholar] [CrossRef]
  9. Liu, Z.G.; Zhang, F.S. Removal of lead from water using biochars prepared from hydrothermal liquefaction of biomass. J. Hazard. Mater. 2009, 167, 933–939. [Google Scholar] [CrossRef]
  10. Chen, X.; Chen, G.; Chen, L.; Chen, Y.; Lehmann, J.; McBride, M.B.; Hay, A.G. Adsorption of copper and zinc by biochars produced from pyrolysis of hardwood and corn straw in aqueous solution. Bioresour. Technol. 2011, 102, 8877–88884. [Google Scholar] [CrossRef]
  11. Agegnehu, G.; Bird, M.I.; Nelson, P.N.; Bass, A.M. The ameliorating effects of biochar and compost on soil quality and plant growth on a Ferralsol. Soil Res. 2015, 53, 1–12. [Google Scholar] [CrossRef]
  12. Atkinson, C.J.; Fitzgerald, J.D.; Hipps, N.A. Potential mechanisms for achieving agricultural benefits from biochar application to temperate soils: A review. Plant Soil 2010, 337, 1–18. [Google Scholar] [CrossRef]
  13. Wood, J.L.; Liu, W.; Tang, C.; Franks, A.E. Microorganisms in heavy metal bioremediation: Strategies for applying microbial-community engineering to remediate soils. AIMS Bioeng. 2016, 3, 211–229. [Google Scholar] [CrossRef]
  14. Jiang, J.; Xu, R.-K.; Jiang, T.-Y.; Li, Z. Immobilization of Cu(II), Pb(II) and Cd(II) by the addition of rice straw derived biochar to a simulated polluted Ultisol. J. Hazard. Mater. 2012, 229, 145–150. [Google Scholar] [CrossRef] [PubMed]
  15. Antonangelo, J.A.; Zhang, H. Heavy metal phytoavailability in a contaminated soil of northeastern Oklahoma as affected by biochar amendment. Environ. Sci. Pollut. Res. 2019, 26, 33582–33593. [Google Scholar] [CrossRef]
  16. FAOSTAT. Crops Production. 2014. Available online: http://www.fao.org/faostat/en/#data/QC (accessed on 15 June 2020).
  17. Dissanayake, D.K.R.P.L.; Dharmakeerthi, R.S.; Karunarathna, A.K.; Dandeniya, W.S. Changes in Structural and Chemical Properties of Rice Husk Biochar Co-pyrolysed with Eppawala Rock Phosphate. J. Sustain. Trop. Agric. Res. 2018, 30, 19–31. [Google Scholar] [CrossRef]
  18. Agencia Española de Meteorología, AEMET. 2020. Available online: https://datosclima.es/Aemet2013/Tempestad2013 (accessed on 30 June 2020).
  19. Soil Survey Staff. Keys to Soil Taxonomy, 12th ed.; USDA-Natural Resources Conservation Service: Washington, DC, USA, 2014. [Google Scholar]
  20. Veihmeyer, F.J.; Hendrickson, A.H. The moisture equivalent as a measure of the field capacity of soils. Soil Sci. 1931, 32, 181–193. [Google Scholar] [CrossRef]
  21. Rice, E.W.; Baird, R.B.; Eaton, A.D.; Clesceri, L.S. Standard Methods for the Examination of Water and Wastewater, 22nd ed.; American Public Health Association, American Water Works Association, Water Environment Federation: Washington, DC, USA; Denver, CO, USA; Alexandria, VA, USA, 2012. [Google Scholar]
  22. EBC. European Biochar Certificate-Guidelines for a Sustainable Production of Biochar; European Biochar Foundation (EBC): Arbaz, Switzerland, 2012; Available online: http://www.europeanbiochar.org/en/download (accessed on 19 April 2019).
  23. Woldetsadik, D.; Drechsel, P.; Keraita, B.; Marschner, B.; Itanna, F.; Gebrekidan, H. Effects of biochar and alkaline amendments on cadmium immobilization, selected nutrient and cadmium concentrations of lettuce (Lactuca sativa) in two contrasting soils. SpringerPlus 2016, 5, 397. [Google Scholar] [CrossRef] [Green Version]
  24. Hiscox, J.D.; Israelstam, G.F. A method for the extraction of chlorophyll from leaf tissue without maceration. Can. J. Bot. 1978, 57, 1332–1334. [Google Scholar] [CrossRef]
  25. Wellburn, A.R. The spectral determination of chlorophylls a and b, as well as total carotenoids, using various solvents with spectrophotometers of different resolution. J. Plant Physiol. 1994, 144, 307–313. [Google Scholar] [CrossRef]
  26. Varela Milla, O.; Rivera, E.B.; Huang, W.-J.; Chien, C.-C.; Wang, Y.-M. Agronomic properties and characterization of rice husk and wood biochars and their effect on the growth of water spinach in a field test. J. Soil Sci. Plant Nutr. 2013, 13, 251–266. [Google Scholar] [CrossRef] [Green Version]
  27. James, R.A.; Yuan, W.; Boyette, M.D.; Wang, D.; Kumar, A. Characterization of biochar from rice hulls and wood chips produced in a top-lit updraft biomass gasifier. Trans. ASABE 2016, 59, 749–756. [Google Scholar] [CrossRef] [Green Version]
  28. Pariyar, P.; Kumari, K.; Kumar Jain, M.; Jadhao, P.S. Evaluation of change in biochar properties derived from different feedstock and pyrolysis temperature for environmental and agricultural application. Sci. Total Environ. 2020, 713, 136433. [Google Scholar] [CrossRef] [PubMed]
  29. Jindo, K.; Mizumoto, H.; Sawada, Y.; Sanchez-Monedero, M.A.; Sonoki, T. Physical and chemical characterization of biochars derived from different agricultural residues. Biogeosciences 2014, 11, 6613–6621. [Google Scholar] [CrossRef] [Green Version]
  30. Yenisoy-Karakas, S.; Aygün, A.; Günes, M.; Tahtasakal, E. Physical and chemical characteristics of polymerbased spherical activated carbon and its ability to adsorb organics. Carbon 2004, 42, 477–484. [Google Scholar] [CrossRef]
  31. Hernandez-Maglinao, J.; Capareda, S.C. Improving the Surface Areas and Pore Volumes of Bio-char Produced from Pyrolysis of Cotton Gin Trash via Steam Activation Process. Int. J. Eng. Sci. 2019, 3, 15–18. [Google Scholar]
  32. Phuong, D.T.; Miyanishi, T.; Okayama, T.; Kose, R. Pore characteristics & adsorption capacities of biochars derived from rice residues as affected by variety and pyrolysis temperature. Am. J. Innov. Res. Appl. Sci. 2016, 2, 179–189. [Google Scholar]
  33. Singh, B.; Singh, B.P.; Cowie, A.L. Characterization and evaluation of biochars for their application as a soil amendment. Aust. J. Soil Res. 2010, 48, 516–525. [Google Scholar] [CrossRef]
  34. Uras, Ü.; Carrier, M.; Hardie, A.G.; Knoetze, J.H. Physico-chemical characterization of biochars from vacuum pyrolysis of South African agricultural wastes for application as soil amendments. J. Anal. Appl. Pyrol. 2012, 98, 207–213. [Google Scholar] [CrossRef]
  35. Li, M.; Liu, W.; Lou, Z.; Wang, Y.; Zhang, Y.; Qian, G. Method to Characterize Acid-Base Behavior of Biochar: Site Modeling and Theoretical Simulation. Sustain. Chem. Eng. 2014, 2, 2501–2509. [Google Scholar] [CrossRef]
  36. Chun, Y.; Sheng, G.Y.; Chiou, C.T.; Xing, B.S. Compositions and sorptive properties of crop residue-derived chars. Environ. Sci. Technol. 2004, 38, 4649–4655. [Google Scholar] [CrossRef] [PubMed]
  37. Francioso, O.; Sanchez-Cortez, S.; Roldán, M.E.; Certini, G. Structural characterization of charcoal size-fractions from a burnt Pinus pinea forest by FT-IR, Raman and surface-enhanced Raman spectroscopies. J. Mol. Struct. 2011, 994, 155–162. [Google Scholar] [CrossRef]
  38. Soltani, N.; Bahrami, A.; Pech-Canul, M.I.; González, L.A. Review on the physicochemical treatments of rice husk for production of advanced materials. Chem. Eng. J. 2015, 264, 899–935. [Google Scholar] [CrossRef]
  39. El-Ashtoukhy, E.-S.Z.; Amin, N.K.; Abdelwahab, O. Removal of lead (II) and copper (II) from aqueous solution using pomegranate peel as a new adsorbent. Desalination 2008, 223, 162–173. [Google Scholar] [CrossRef]
  40. Samsuri, A.W.; Sadegh-Zadeh, F.; She-Bardan, B.J. Characterization of biochars produced from oil palm and rice husks and their adsorption capacities for heavy metals. Int. J. Environ. Sci. Technol. 2014, 11, 967–976. [Google Scholar] [CrossRef]
  41. Inyang, M.I.; Gao, B.; Yao, Y.; Xue, Y.; Zimmerman, A.; Mosa, A.; Pullammanappallil, P.; Sik Ok, Y.; Cao, X. A review of biochar as a low-cost adsorbent for aqueous heavy metal removal. Crit. Rev. Environ. Sci. Technol. 2016, 46, 406–433. [Google Scholar] [CrossRef]
  42. Xu, X.; Cao, X.; Zhao, L. Comparison of rice husk- and dairy manure-derived biochars for simultaneously removing heavy metals from aqueous solutions: Role of mineral components in biochars. Chemosphere 2013, 92, 955–961. [Google Scholar] [CrossRef]
  43. Pellera, F.-M.; Giannis, A.; Kalderis, D.; Anastasiadou, K.; Stegmann, R.; Wang, J.-Y.; Gidarakos, E. Adsorption of Cu (II) ions from aqueous solutions on biochars prepared from agricultural by-products. J. Environ. Manag. 2012, 96, 35–42. [Google Scholar] [CrossRef]
  44. Thirumavalavan, M.; Lai, Y.L.; Lee, J.F. Fourier transform infrared spectroscopic analysis of fruit peels before and after the adsorption of heavy metals ions from aqueous solution. J. Chem. Eng. Data 2011, 56, 2249–2255. [Google Scholar] [CrossRef]
  45. Wu, Q.; Xian, Y.; He, Z.; Zhang, Q.; Wu, J.; Yang, G.; Zhang, X.; Qi, H.; Ma, J.; Xiao, Y.; et al. Adsorption characteristics of Pb(II) using biochar derived from spent mushroom substrate. Sci. Rep. 2019, 9, 15999. [Google Scholar] [CrossRef] [Green Version]
  46. Chintala, R.; Mollinedo, J.; Schumacher, T.E.; Malo, D.D.; Julson, J.L. Effect of biochar on chemical properties of acidic soil. Arch. Agron. Soil Sci. 2014, 60, 393–404. [Google Scholar] [CrossRef]
  47. Si, L.; Xie, Y.; Ma, Q.; Wu, L. The Short-Term Effects of Rice Straw Biochar, Nitrogen and Phosphorous Fertilizer on Rice Yield and Soil Properties in a Cold Waterlogged Paddy Field. Sustainability 2018, 10, 537. [Google Scholar] [CrossRef] [Green Version]
  48. Bista, P.; Ghimire, R.; Machado, S.; Pritchett, L. Biochar Effects on Soil Properties and Wheat Biomass vary with Fertility Management. Agronomy 2019, 9, 623. [Google Scholar] [CrossRef] [Green Version]
  49. Ondrasek, G.; Rengel, Z. The Role of Soil Organic Matter in Trace Element Bioavailability and Toxicity. In Abiotic Stress Responses in Plants; Ahmad, P., Prasad, M., Eds.; Springer: New York, NY, USA, 2011. [Google Scholar] [CrossRef]
  50. Alotaibi, K.D.; Schoenau, J.J. Addition of Biochar to a Sandy Desert Soil: Effect on Crop Growth, Water Retention and Selected Properties. Agronomy 2019, 9, 327. [Google Scholar] [CrossRef] [Green Version]
  51. Al-Wabel, M.I.; Usman, A.R.; Al-Farraj, A.S.; Ok, Y.S.; Abduljabbar, A.; Al-Faraj, A.I.; Sallam, A.S. Date palm waste biochars alter a soil respiration, microbial biomass carbon, and heavy metal mobility in contaminated mined soil. Environ. Geochem. Health 2017, 1–18. [Google Scholar] [CrossRef]
  52. Soil Survey Division Staff. Soil Survey Manual. Soil Conservation Service; Agriculture Handbook 18; U.S. Department of Agriculture: Washington, DC, USA, 1993.
  53. Yu, O.-Y.; Raichle, B.; Sink, S. Impact of biochar on the water holding capacity of loamy sand soil. Int. J. Energy Environ. Eng. 2013, 4, 44. [Google Scholar] [CrossRef] [Green Version]
  54. Abdul Halim, N.S.; Abdullah, R.; Karsani, S.A.; Osman, N.; Panhwar, Q.A.; Ishak, C.F. Influence of Soil Amendments on the Growth and Yield of Rice in Acidic Soil. Agronomy 2018, 8, 165. [Google Scholar] [CrossRef] [Green Version]
  55. Song, S.; Arora, S.; Laserna, A.K.C.; Shen, Y.; Thian, B.W.Y.; Chin Cheong, J.; Tan, J.K.T.; Chiam, Z.; Lee Fond, S.; Ghosh, S.; et al. Biochar for urban agriculture: Impacts on soil chemical characteristics and on Brassica rapa growth, nutrient content and metabolism over multiple growth cycles. Sci. Total Environ. 2020, 727, 138742. [Google Scholar] [CrossRef]
  56. Liopa-Tsakalidi, A.; Barouchas, P.E. Effects of biochar of pepperoncini (Capsicum annuum L cv. Stavros) germination and seedling growth in two soil types. Aust. J. Crop Sci. 2017, 11, 264–270. [Google Scholar] [CrossRef]
  57. Solaiman, Z.M.; Murphy, D.V.; Abbott, L.K. Biochars influence seed germination and early growth of seedlings. Plant Soil 2012, 353, 273–287. [Google Scholar] [CrossRef]
  58. Paneque, M.; Knicker, H.; Kern, J.; De la Rosa, J.M. Hydrothermal Carbonization and Pyrolysis of Sewage Sludge: Effects on Lolium perenne Germination and Growth. Agronomy 2019, 9, 363. [Google Scholar] [CrossRef] [Green Version]
  59. Hashmi, S.; Younis, U.; Danish, S.; Muhammad Munir, T. Pongamia pinnata L. Leaves Biochar Increased Growth and Pigments Syntheses in Pisum sativum L. Exposed to Nutritional Stress. Agriculture 2019, 9, 153. [Google Scholar] [CrossRef] [Green Version]
  60. Danish, S.; Ahmad Tahir, F.; Khalid Rasheed, M.; Ahmad, N.; Arif Ali, M.; Kiran, S.; Younis, U.; Irshad, I.; But, B. Effect of foliar application of Fe and banana peel waste biochar on growth, chloyophyll content and accessory pigments synthesis in spinach under chromium (IV) toxicity. Open Agric. 2019, 4. [Google Scholar] [CrossRef]
  61. Chrysargyris, A.; Prasad, M.; Kavanagh, A.; Tzortzakis, N. Biochar Type and Ratio as a Peat Additive/Partial Peat Replacement in Growing Media for Cabbage Seedling Production. Agronomy 2019, 9, 693. [Google Scholar] [CrossRef] [Green Version]
  62. Swagathnath, G.; Rangabhashiyam, S.; Murugan, S.; Balasubramanian, P. Influence of biochar application on growth of Oryza sativa and its associated soil microbial ecology. Biomass Convers. Bioref. 2019, 9, 341–352. [Google Scholar] [CrossRef]
Figure 1. Fourier Transform Infrared (FT-IR) spectra of the studied biochars.
Sustainability 12 06025 g001
Figure 2. Removal efficiency of Cu2+ (a) and Pb2+ (b) by biochars and capacity of adsorbents for Cu2+ (c) and Pb2+ (d) determined by adding 20 mL of solution with increasing concentration of cation (0.05–5 mM) to 20 mg of biochar (n = 3).
Sustainability 12 06025 g002
Figure 3. Effect of biochar addition on soil properties under greenhouse conditions at the end of the pot experiment (day 63): (a) pH in moderately acid and acid polluted soils; (b) Electrical conductivity in moderately acid and acid polluted soils; (c) Water holding capacity in moderately acid and acid polluted soil. Different letters indicate significant differences between treatments for each soil (p < 0.05).
Sustainability 12 06025 g003
Figure 4. Height of Brassica rapa pekinensis after 4, 8, 25, 31, and 63 days of experiment in control and amended MAPS and in APS amended with 5% of CWB. Different letters indicate significant differences between treatments for each sampling in MAPS (p < 0.05).
Sustainability 12 06025 g004
Table 1. Characterization of studied soils.
Total Content of Trace Elements (mg kg−1)
pHWHC (%)Ash (%)C (g kg−1)N (g kg−1)C/NNaBaCdCuFeNiPbSrZn
MAPS6.5 ± 0.151.5 ± 1.294.9 ± 0.917 ± 12.0 ± 0.78301.793.31.56215.536945.715.6156.538.6293.5
APS3.6 ± 0.132.7 ± 2.494.7 ± 0.78 ± 00.9 ± 0.48698.047.11.28240.653023.315.6569.053.7249.3
Table 2. Details of the experimental design for the pot experiment with trace element contaminated soils.
Treatment/CodeSoilBiochar DoseFeedstockPyrolysis Conditions
MAPS_ControlModerately acid polluted soil-
MAPS_2%RHBModerately acid polluted soil2%Rice husk500 °C, 12 min
MAPS_5%RHBModerately acid polluted soil5%Rice husk500 °C, 12 min
MAPS_2%OPBModerately acid polluted soil2%Olive pit500 °C, 12 min
MAPS_5%OPBModerately acid polluted soil5%Olive pit500 °C, 12 min
MAPS_5%CWBModerately acid polluted soil5%Wood chips620 °C, 20 min
APS_ControlAcid polluted soil-
APS_2%RHBAcid polluted soil2%Rice husk500 °C, 12 min
APS_5%RHBAcid polluted soil5%Rice husk500 °C, 12 min
APS_2%OPBAcid polluted soil2%Olive pit500 °C, 12 min
APS_5%OPBAcid polluted soil5%Olive pit500 °C, 12 min
APS_5%CWBAcid polluted soil5%Wood chips620 °C, 20 min
Table 3. Elemental analysis, physical and chemical properties of the studied biochars.
TC (%)TH (%)TN (%)O (%)H/CatO/CatC/NAsh Content (%)pHWHC (%)SSA-BET (CO2, m2 g−1)Iodine Index (mg g−1)Total Basicity (meq g−1)Total Acidity (meq g−1)
CWB75.7 ± 0.31.80 ± 0.020.30 ± 0.0618.7 ± 0.230.30.192523.5 ± 0.79.95 ± 0.18243 ± 394031490.95 ± 0.061.69 ± 0.15
RHB53.7 ± 0.11.61 ± 0.020.51 ± 0.249.48 ± 0.220.40.1310634.7 ± 0.510.10 ± 0.01595 ± 222921800.51 ± 0.011.70 ± 0.12
OPB92.7 ± 0.22.52 ± 0.060.16 ± 0.093.58 ± 0.440.30.035851.0 ± 0.39.34 ± 0.0970 ± 134731230.05 ± 0.030.17 ± 0.01
Table 4. Parameters and regression coefficients of different isotherms studied for the adsorption of copper and lead onto the studied biochars.
Isotherm ModelParameterUnitsCu2+Pb2+
RHBOPBCWBRHBOPBCWB
Linear FreundlichKf(mg g−1) (L mg−1)1/n1.471.174.833.572.2913.36
n 2.583.442.242.773.672.63
R2 0.72770.91380.72570.70950.79660.416
Linear LangmuirQ0mg g−130.7717.7958.8219.3419.1277.52
bL mg−10.100.150.220.140.010.23
R2 0.99930.99700.99910.99940.67810.9975
TemkinB 1.070.512.542.161.5512.18
bJ mol−12305.754834.79975.111149.031598.80203.33
AL g−114.0146.7046.8119.237.6718.46
R2 0.94050.99890.9630.80030.66740.7906
Dubinin–Radushkevich (DRK)Qmmg g−10.010.000.010.030.010.10
bmol2 kJ−2−0.132700−0.039100−0.030700−0.0000003−0.0000001−0.0000001
EJ mol−11.943.584.041290.992672.612236.07
R2 0.89090.97350.67530.72560.41650.4997
Table 5. Germination and survival of Brassica rapa pekinensis and contents in chlorophyll a, chlorophyll b, and total chlorophyll in Brassica leaves after 31 and 63 days of experiment.
Germination and Plant Survival (%)Chl a (mg g−1 FW)Chl b (mg g−1 FW)Total chl (mg g−1 FW)
Day 4Day 8Day 19Day 25Day 31Day 31Day 63Day 31Day 63Day 31Day 63
MAPS_Control67 ± 33 ab100 ± 0 a100 ± 0 a89 ± 19 a89 ± 19 a0.30 ± 0.10 a0.16 ± 0.03 a0.16 ± 0.05 a0.12 ± 0.04 a0.46 ± 0.14 a0.29 ± 0.07 a
MAPS_2%RHB42 ± 14 b83 ± 14 ab83 ± 14 ab83 ± 14 ab83 ± 14 ab0.28 ± 0.04 ab0.17 ± 0.02 a0.13 ± 0.02 ab0.15 ± 0.01 a0.32 ± 0.05 ab0.32 ± 0.04 a
MAPS_5%RHB100 ± 0 a100 ± 0 a100 ± 0 a100 ± 0 a100 ± 0 a0.21 ± 0.03 ab0.17 ± 0.07 a0.11 ± 0.01 ab0.16 ± 0.05 a0.28 ± 0.09 ab0.32 ± 0.12 a
MAPS_2%OPB0 ± 0 c17 ± 29 c17 ± 29 c17 ± 29 c17 ± 29 cn.d.0.17 ± 0.04 an.d.0.18 ± 0.04 an.d.0.35 ± 0.08 a
MAPS_5%OPB17 ± 29 bc50 ± 25 bc42 ± 14 bc42 ± 14 bc42 ± 14 bc0.26 ± 0.04 ab0.17 ± 0.04 a0.13 ± 0.01 ab0.18 ± 0.03 a0.39 ± 0.04 a0.35 ± 0.07 a
MAPS_5%CWB89 ± 19 a100 ± 0 a100 ± 0 a100 ± 0 a100 ± 0 a0.11 ± 0.01 b0.19 ± 0.04 a0.06 ± 0.01 b0.18 ± 0.04 a0.17 ± 0.00 b0.37 ± 0.09 a
APS_5%CWB44 ± 1978 ± 1978 ± 1978 ± 1978 ± 190.19 ± 0.010.11 ± 0.010.11 ± 0.010.12 ± 0.020.30 ± 0.010.23 ± 0.03
Chl a: chlorophyll a; Chl b: chlorophyll b and Total Chl: total chlorophyll; FW: Fresh weight; n.d.: not determined. Different letters indicate significant differences between treatments in MAPS (p < 0.05).
Table 6. Dry weights and root-to-shoot ratios for Brassica rapa penkinensis in control and amended soils after 31 and 63 days.
Dry Weight Biomass (g)Dry Weight Roots (g)Root-to-Shoot Ratio
Day 31Day 63Day 31Day 63Day 31Day 63
MAPS_Control0.170.22 ± 0.01 ab0.0040.057 ± 0.0420.020.26
MAPS_2%RHB0.200.24 ± 0.02 ab0.0750.036 ± 0.0180.370.15
MAPS_5%RHB0.450.36 ± 0.03 a0.0680.157 ± 0.0451.530.44
MAPS_2%OPBn.d.0.10 ± 0.02 bn.d.0.007 ± 0.029n.d.0.07
MAPS_5%OPB0.060.13 ± 0.03 b0.0330.033 ± 0.0180.530.26
MAPS_5%CWB0.260.32 ± 0.02 a0.0510.140 ± 0.0240.200.44
APS_5%CWBn.d.0.03 ± 0.010.0010.010 ± 0.001n.d.0.35
n.d.: not determined. Different letters indicate significant differences between treatments in MAPS (p < 0.05). No letters indicate no significant differences.

