Article

Spatial Compatibility of Implementing Nature-Based Solutions for Reducing Urban Heat Islands and Stormwater Pollution

1
Institute of Sanitary Engineering and Water Pollution Control, University of Natural Resources and Life Sciences, Vienna (BOKU), Muthgasse 18, 1190 Vienna, Austria
2
Kompetenzzentrum Wasser Berlin gGmbH (KWB), Cicerostraße 24, D-10709 Berlin, Germany
*
Author to whom correspondence should be addressed.
Sustainability 2020, 12(15), 5967; https://doi.org/10.3390/su12155967
Submission received: 10 June 2020 / Revised: 15 July 2020 / Accepted: 16 July 2020 / Published: 24 July 2020
(This article belongs to the Special Issue Urban Stormwater Management by Green Infrastructure)

Abstract

:
Cities worldwide are facing several challenges connected to urbanization and climate change. Several cities have identified the implementation of nature-based solutions (NBS) as an option to mitigate several challenges at once. However, can two different aims be reached with NBS in the same location? This question has not yet been addressed. This paper discusses the spatial compatibility of NBS implementation strategies to tackle (1) urban heat island (UHI) effects and (2) water pollution at the same location. The evaluation is based on a spatial analysis of Berlin. We found a positive correlation of high UHI and median high stormwater pollution loads for zinc, total suspended solids, Polycyclic Aromatic Hydrocarbons and Terbutryn. Out of more than 14,000 building/street sections analyzed, 2270 showed spatial matching of high UHI and high stormwater pollution loads. In the majority of building/street sections, stormwater pollution was high for three out of the four parameters. We conclude that the compatibility of NBS implementation for both challenges depends both on the implementation strategies for NBS and on the specific NBS measures. Our spatial analysis can be used for further planning processes for NBS implementation.

1. Introduction

Cities worldwide are facing challenges from urbanization, including air pollution, urban heat islands (UHI), pollution of surface water and pluvial flooding. A total of 55% of the world’s population is living in cities and increased urbanization is expected [1], which would augment these challenges. Additionally, these challenges of urbanization are expected to be further increased by climate change [2]. As a result, a transition to more sustainable cities as promoted in the sustainable development goals of the United Nations [3] is needed. Nature-based solutions (NBS) are one promising option to achieve this transition and to mitigate the challenges [4].
NBS, in our understanding, include natural green and blue spaces in urban areas, but also engineered systems incorporating green or blue elements, such as infiltration swales, artificial ponds or plant-based treatment systems. The systems utilize natural processes and intend to bring nature into cities [4]. NBS are promoted because they are flexible and can serve several purposes simultaneously [5]. In urban water management [6], they can decrease urban pluvial flooding through water retention [7], reduce surface water pollution through reduced runoff [8] and restore the natural water balance [9]. They can also mitigate the urban heat island (UHI) effect through shading and evapotranspiration [10] and reduce air pollution by interception and absorption [11]. NBS provide additional benefits such as increased biodiversity [12], increased human well-being [13] and added social values [14].
Many scientific papers address the multifunctionality of NBS [15,16] a feature especially important for growing cities [17]. These multiple functions of NBS are included in many multi-criteria decision support systems [18,19]. Wang et al. [20] integrated hydraulic performance, pollution control, greenhouse gas emissions and rainwater usage into their decision support system to take multiple benefits into account. Their decision support system was applied to Chizhou city in China. Morales-Torres et al. [21] consider water quality, hydraulic and energy aspects of the implementation of NBS in Benaguasil in Spain. Radinja et al. [22] used the reduction in combined sewer overflows (CSO) as well as the influence on amenity and biodiversity as criteria for the selection of NBS in Girona in Spain. These examples show that multiple benefits play an important role in the selection of NBS.
Pursuing multiple objectives with NBS primarily implemented for stormwater management has been a factor for success in several cases. The integration of NBS into urban structures was used for urban and economic revitalization in two American cities [23]. Multiple case studies recognized the increasing quality of life in redeveloped areas through NBS [24,25,26]. Besides aesthetic improvements, ecological functions such as wildlife habitat and increased water quality have been considered in the planning of NBS [27,28].
Other urban challenges have been integrated into the design of NBS for stormwater management in several cities [27]. The positive role of NBS in climate change adaptation in combination with their ability to meet other urban challenges led to their widespread inclusion into planning strategies. Strategic plans for Berlin [29], Vienna [30] and several communities in the US [31] link stormwater management to UHI mitigation. UHI is the phenomenon that air temperature is higher in the city than in the surrounding countryside [32]. It is clear that local framework conditions need to be considered to fully utilize the co-benefits of NBS [12]. However, the various challenges might be spatially distributed in a way that limits the multifunctionality of NBS. While UHI effects might occur in one part of a city, stormwater management could be a priority in another part. Furthermore, different NBS strategies might be more or less suited to address these effects of spatial distribution. Conflicts of different strategies are expected but their extent is unknown.
The aim of this paper is, therefore, to investigate the spatial distribution of urban challenges as a basis to evaluate if NBS can be used to tackle them simultaneously. This paper presents a systematic analysis of the spatial distribution of two exemplary cases, mitigation of the UHI effect and water pollution caused by untreated stormwater runoff. Data on the spatial distribution of stormwater pollution and UHI are combined to investigate the spatial matching of the two challenges. We then evaluate, if the implementation strategies for NBS allow mitigating both, UHI effect and water pollution, at the same location.

2. Materials and Methods

2.1. Study Area

The analysis was based on existing information for the city of Berlin, Germany. In Figure 1 land use data as well as the district borders of Berlin are illustrated. All building blocks and street segments shown in the map were used for the analysis. In Berlin, both UHI effect and water pollution have been identified as urban challenges. UHI effects are especially distinct in densely built up areas during night time in summer [33]. Higher intensities of UHI are expected in the future [34]. As a consequence, the reduction in UHI is a major focus in the climate adaptation program of the city of Berlin [29]. Water pollution in Berlin has different sources. In areas with combined sewer systems, the main problems are caused by rainfall events leading to combined sewer overflows discharging organic pollution and nutrients from untreated sewage [8]. Stormwater pollution accounts only for a small part of the pollution in these areas. In areas with separate sewer systems, water pollution is mainly caused by stormwater runoff [35]. Given the severity of the issue, surface water pollution during storm events has been identified as a major focus in the local implementation plan for the EU Water Framework Directive [36].

2.2. Data

Data on the UHI effect for Berlin are publicly available in the form of a climate analysis map [37]. These data are available at the block/street section level. These based on the results of the physical urban climate model FITNAH [38] and combines daily heat stress and “tropical night index”. The latter was only considered for housing areas. The UHI effect in the map is classified into the four categories described above (“non-existent”, “weak”, “medium”, “strong”). This classification follows the methodology described by the VDI directive 3787 Part 1 [39] and is based on the difference between mean z-score at a specific block or street section and the Berlin mean value of all blocks and street sections for summer weather conditions. Details on the model approach are given in [40], details on the combined evaluation are given in [37].
Stormwater pollution data were taken from a detailed monitoring program of stormwater runoff from five catchments with different but homogenous spatial structures in Berlin, which covered more than 100 inorganic and organic trace pollutants based on flow proportional composite sample taken over the course of more than one year [35,41]. The spatial structures were defined as “old buildings”, “new buildings”, “single family houses”, “commercial areas” and “major streets”. Spatial concentration patterns were combined at the block/street section level with spatial runoff calculated with the water balance model ABIMO 3.2 [42] to calculate city-wide annual loads [43,44]. This combination results in area-specific load estimates in [g/ha/yr] at the block/street section level, which were used in the present study for four selected water quality parameters: Polycyclic Aromatic Hydrocarbons (PAH), total suspended solids (TSS), zinc and Terbutryn.

2.3. Data Analysis

The spatial distribution of average annual pollution loads was compared with UHI hotspots in Berlin. The spatial comparison was used to determine the possibility of reducing UHI and water pollution at the same location. Both aspects were studied individually for ~14,000 blocks and street segments.
The UHI effect was classified into four categories (non-existent, weak, medium, high), following the available characterization for Berlin (see above). For stormwater pollution, four parameters that significantly differ in measured runoff concentrations between different spatial structures were selected as indicators. TSS, PAH, zinc and Terbutryn were indicators for pollution from both traffic and different building materials. The four parameters were also relevant for surface water systems concerning ecotoxicity (mostly PAH and Terbutryn), high concentrations (zinc and PAH) and potentially associated pollutants (TSS) [35,41]. Blocks and street segments were assigned area-specific pollution loads in [g/ha/yr] for all four parameters, based on an extensive stormwater monitoring program in Berlin (see below).
The distribution of pollution load over the four categories of UHI was visually analyzed using boxplots showing both the 50% quantile (box) and the 90% quantile (whiskers) of the data. In addition, a linear regression analysis with a linear model was performed using the software package R to analyze the relationship between the UHI effect and stormwater pollution load of the individual parameters. For the evaluation of the data correlation, a Spearman rank correlation coefficient was calculated using the median values for stormwater pollution load. The categories of the UHI effect were translated to equidistant ordinal values. As the sample size of four was very low, the results were used to detect a tendency regarding the correlation rather than a final evaluation.
The spatial matching of high UHI and high stormwater pollution was analyzed by dividing both criteria into two classes: “high” and “low” pressure. For UHI, the categories “medium” and “high” were subsumed as “high” and the categories “non-existent” and “weak” as “low”. For stormwater pollution, the selection of the ”high” versus ”low” effect was less evident since the effect of pollution depends on the receiving surface or groundwater body. To allow a systematic spatial assessment, the mean value of the 90% value range of each parameter was used for the classification. This was calculated as follows:
m e a n 90 % = 5 % v a l u e + 95 % v a l u e 2
Values above the mean90% were classified as “high” and those below as “low”. The mean90% was used to identify high stormwater pollution. For all the parameters, the mean90% was higher than the mean and median values of the measurements for each of the four parameters. This led to a more stringent selection of areas. Moreover, using the mean90% led to a different number of areas classified as “high” for the four pollutants. This difference in the number of areas in the two classes depending on the pollutant considered was a realistic setting. The stormwater pollution in an area was classified as high if at least one parameter was classified as high in this area. We also analyzed how well the parameters matched, by identifying areas where two, three or all four parameters were classified as “high”.

3. Results

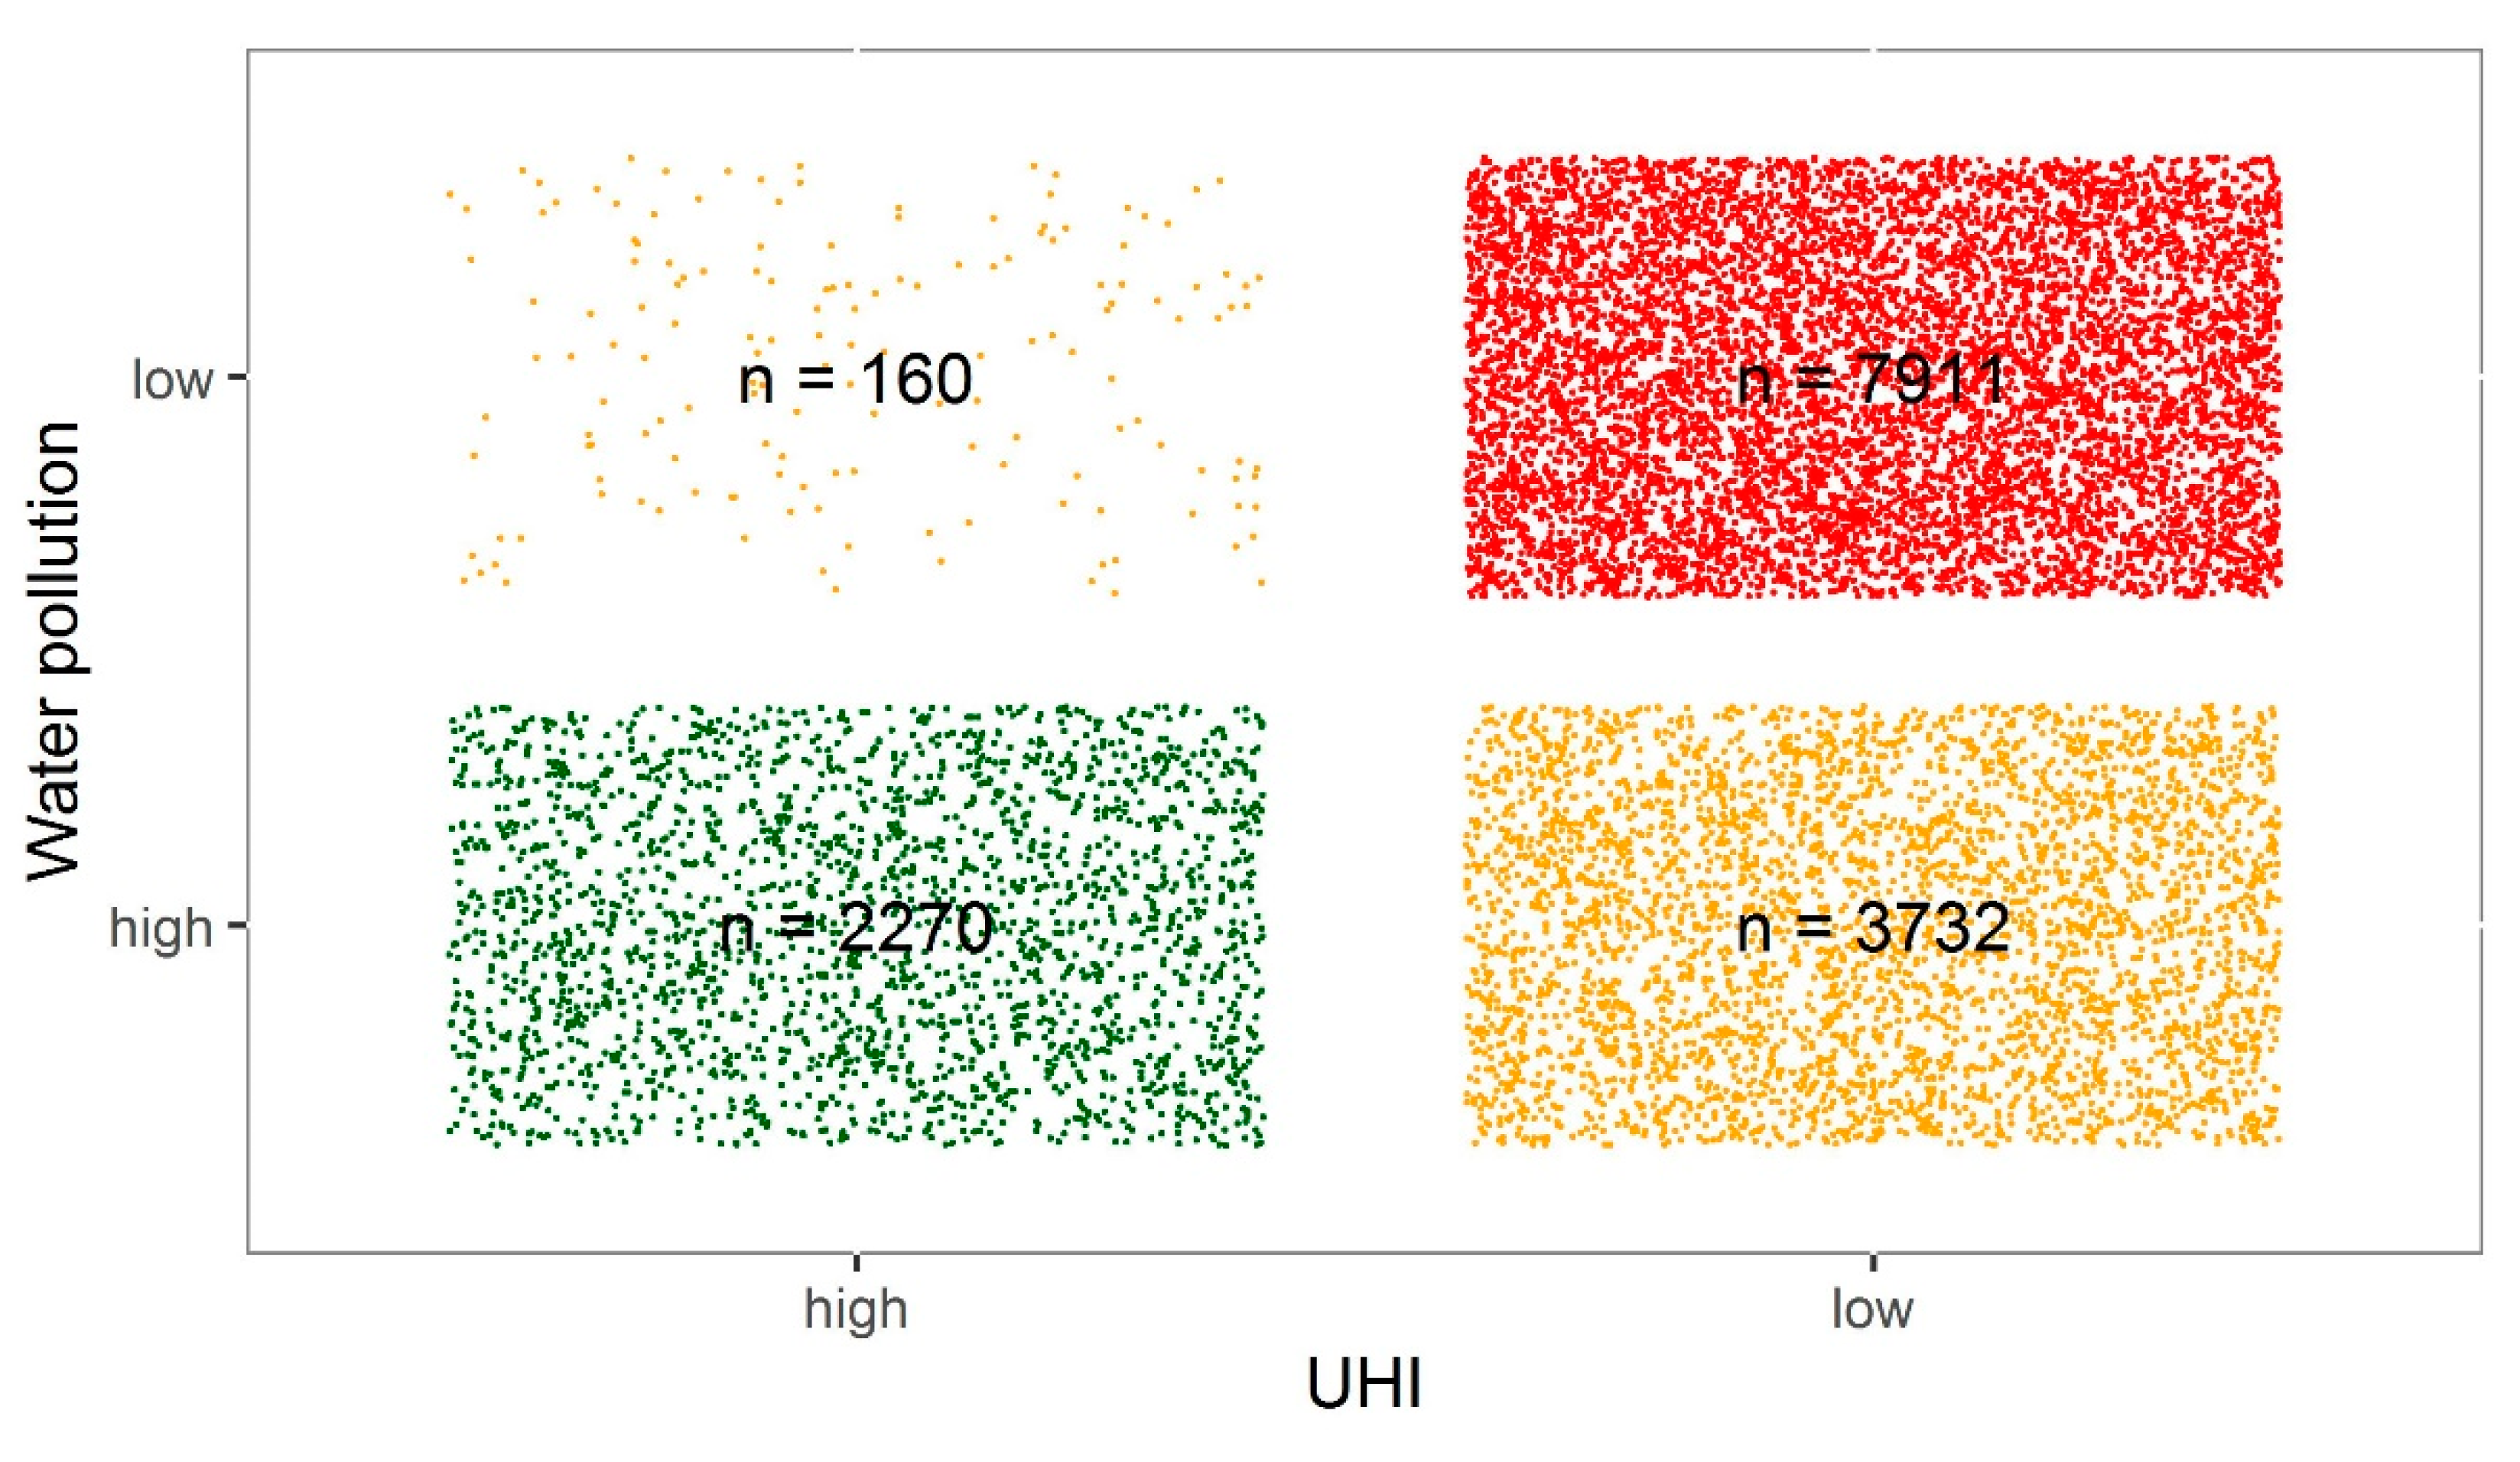
3.1. Distribution of UHI and Water Pollution

Figure 2 shows the distribution of pollution loads for the four parameters by the UHI effect. The pollution load for any parameter and the UHI effect show no linear relationship (R2 below 0.3 for all parameters). Medians of specific loads and UHI were, however, positively correlated for all four parameters. The Spearman correlation coefficient was 1 for TSS and PAH and 0.8 for Terbutryn and Zinc. Moreover, the highest median loads were found for high UHI effect, except for zinc and Terbutryn. Even though the correlation coefficient showed a perfect fit, the result should be cautiously interpreted as a tendency towards a positive correlation due to the small sample size.
Load ranges in one UHI class are generally high, mostly > 100% of medians or means. For zinc, the highest range in the 90% quantile was found in the UHI class “medium” with around 4298 g/ha/yr. For PAH the highest range (around 10 g/ha/yr) was found in the UHI class “non-existent”. Terbutryn and TSS showed the largest range in the UHI class “high” with around 0.28 g/ha/yr and 937 kg/ha/yr, respectively. While a general spatial matching of the two challenges can be expected based on Figure 1, the extent of the match of the two challenges is not defined.

3.2. Spatial Matching

The spatial matching of the high pollution load and high UHI was analyzed in detail by counting matching blocks/street sections. For this analysis, the definition of high and low described in Section 2.1 was used. Figure 3 indicates that UHI reduction and stormwater pollution reduction through NBS matched for a large number of blocks/street sections in Berlin. Out of the areas, 2270 showed both high pollution load and high UHI and 7911 had low pollution and low UHI. The positive matching was even more evident when looking only at areas where at least one of the two criteria was high. Approximately 93% of the areas with a high UHI also exhibited high stormwater pollution and almost 38% of the areas with high stormwater pollution also had a high UHI.
The matching areas (2270) were then analyzed in more detail. As stormwater pollution was considered high if one of the parameters was classified as high, the matching of the four parameters (PAH, Terbutryn, TSS, zinc) was evaluated as well. Figure 4 shows the distribution of matching areas over the city of Berlin. Since only 160 areas showed high UHI and low pollution, Figure 4 also represents an UHI map for Berlin. Matching areas were predominantly located in the center of Berlin, with a higher proportion of imperviousness, while in the suburban areas single-family homes with s lower imperviousness were more common. In 1757 of the 2270 areas, at least three parameters had a high pollution load, while the number of areas where only one (and no other) parameter was high was limited (110). The number of areas where all four parameters were high was low as well (250). These areas concentrated in the city center.
Table 1 shows the number of areas with a high pollution load for different combinations of the four parameters. The lowest number of areas with a high pollution load was found for TSS. The largest number of areas was found for PAH. The combination of TSS and Terbutryn or zinc limited the number of areas, where the pollution load of more than one parameter was high. Consequently, the number of areas, where both TSS and Terbutryn or zinc were high was the same as the number of areas, where all parameters were high. All areas with a high TSS load also had a high PAH load. Furthermore, all areas with high zinc and high Terbutryn load showed a high PAH load as well. However, there were also some areas where only PAH (31), Terbutryn (7) or zinc (72) loads were high.

4. Discussion

4.1. Compatibility of NBS Strategies

The spatial distribution of urban challenges influences the potential of fully taking advantage of the multifunctionality of NBS. An investigation of spatial matching of high pollution loads and UHI in Berlin showed that the challenges coincide at many locations. Particularly, 91% of blocks/street sections with high UHI can be matched with high pollution. In contrast, “only” 38% of sites with high pollution can be matched with high UHI. The simple reason is that there are ~2.5 times more sites with a pollution than with an UHI challenge. The example shows the obvious: The advantage to address multiple challenges by NBS is limited by the challenge with the least spatial extent.
In the present example, the number of locations is linked to the applied threshold value in the distinction between high and low stormwater pollution as well as high and low UHI. As previously described, the threshold value set for stormwater pollution is higher than the median or mean value of the individual parameters. These stricter threshold values can lead to a reduction in areas where both challenges represent a high pressure, which can facilitate the prioritization of areas for NBS implementation as other studies have shown [45]. If the median or mean values are used as thresholds, the threshold value for the characterization of high stormwater pollution is reduced. This leads to an increase in the number of matching areas by 152 and 56, respectively. It also shows, however, that the increase is small, as the number of matching areas is mostly limited by the threshold selected for the UHI. In realistic applications, it may make sense to apply varying thresholds depending on local impacts (e.g., UHI in areas with high-risk inhabitants or pollution in the catchment of a sensitive urban lake or river).
While the spatial matching of the two challenges has been presented in detail in the results section, the spatial compatibility of NBS implementation depends on the NBS strategies of the city regarding the different challenges. If the strategy is to mitigate both water pollution and UHI at all sites, the strategies are spatially compatible in Berlin. If the application of NBS to reduce water pollution, however, depends on the type of sewer system in the area, the spatial compatibility might be influenced. In combined sewer systems, an alternative strategy could be to implement NBS for UHI mitigation primarily in areas with low stormwater pollution, as stormwater pollution may limit NBS implementation, e.g., infiltration (groundwater pollution) or rainwater harvesting (water quality requirements for irrigation or sanitary use). The suitability of NBS measures is discussed in detail below. Different strategies can be followed depending on the framework conditions. While the spatial matching of the challenges can be easily determined, the spatial compatibility of addressing them with NBS needs to be discussed in a broader context. The implications of different strategies are discussed for two examples. The first strategy is to mitigate high stormwater pollution and high UHI at all locations with NBS. The second strategy is to mitigate high UHI with NBS but to evaluate the implementation of NBS for the mitigation of water pollution depending on the sewer system. In districts with separate sewer systems, areas with a high pollution load are prioritized regarding NBS implementation since polluted stormwater is otherwise directly discharged into the river without treatment. In districts with combined sewers, river pollution mainly occurs during combined sewer overflows (CSO). CSO can be reduced by reducing stormwater runoff, notwithstanding its pollution. Moreover, stormwater pollution in combined sewer systems is at least partially reduced in wastewater treatment plants (WWTP) [35]. To utilize the stormwater pollution reduction in wastewater treatment plants, areas with lower pollution loads are prioritized for NBS implementation in the example of combined sewer systems.
While the first strategy leads to the results presented above with 2270 compatible areas, the second strategy leads to a different result. Separate sewer systems are mainly located in the outer areas of the city, while combined sewer systems are located in the city center. Figure 5 shows that areas with high stormwater pollution in the outer areas of the city (with a separate sewer system) do not have a high UHI effect. The areas with high stormwater pollution and high UHI are mainly located in areas with combined sewer systems, where NBS for high stormwater pollution are not prioritized in this strategy. Furthermore, as previously analyzed (Figure 2), the number of areas with low stormwater pollution and high UHI is generally small. Hence, the second strategy results in a reduction in compatible areas to 600. This exemplifies the influence of the NBS strategy on the spatial compatibility of reducing UHI and stormwater pollution. Nevertheless, the presented spatial analysis can provide valuable input for strategic planning on targeted NBS implementation or decision support for NBS positioning.

4.2. Settlement Structures and Urban Challenges

Settlement structures are relevant to this analysis regarding their impact (i) on existing UHI or pollution challenges and (ii) on the NBS implementation potential.
The challenge of specific pollution loads depends on the emission rate per impervious area and the imperviousness of the area. The emission rates for individual parameters are further linked to specific settlement structures. As shown in Figure 5, the high pollution loads of zinc and Terbutryn mainly stem from building areas, while high TSS loads are predominantly found on streets. PAH, on the other hand, is high both at building blocks as well as on street segments [35]. Similarly, the challenge of UHI is typically high in areas with a high imperviousness. As a result, most matching areas in Figure 3 are in the densely built-up city center.
An evaluation by settlement structure (Table 2) shows that only 3% (61) of the total number of matching areas (2270) is in low or moderate density sites. Densely built living and mixed-use areas are the most prominent settlement structures with 78% (1778) of the total number of matching areas. The number of streets is low (11% (258) of the total number of matching areas), because not all the pollutants are high in road runoff and only road sections in densely built areas show high UHI. The distribution, however, changes, when looking at the size of the matching areas. While the areas with a low or moderate imperviousness still only cover a small part, the proportion of streets increases covering about 40% (3668.2 ha) of the total size of matching areas. The areas with a high imperviousness and density, however, still dominate with 47% (4250.1 ha).
The implementation potential of NBS and their accessibility for the city also depends on settlement structures [46]. Areas with a higher imperviousness and density offer the highest restrictions for NBS implementation due to limited space availability. The results described above can be used to prioritize areas with a high implementation potential for specific NBS [45]. Identifying publicly owned areas to start with NBS implementation could also be an option. Here, especially the large street areas could be considered to mitigate water pollution and UHI at the same location due to their ownership.

4.3. Suitability of NBS Measures

A total of 2270 blocks/street sections that match the high pollution of at least one parameter with the heat island effect call for NBS that can both reduce heat stress and pollution transfer to surface waters (Figure 2). According to an extensive evaluation of stormwater Best Management Practices for various goals under Berlin settings in the project KURAS [47,48], NBS suitable for both aims are infiltration/rain gardens (particularly if combined with trees), ponds, rainwater harvesting for irrigation and vegetated retention soil filters/treatment wetlands. However, while the implementation of NBS reduces pollution of receiving rivers and lakes at the catchment level, pollutants may be partly diverted to the local environment, where the NBS are located. For instance, infiltration swales can lead to a transfer of stormwater pollutants to the groundwater, as demonstrated by Hensen et al. [49] for biocides. Non-degradable pollutants, such as heavy metals, can accumulate in the soil of NBS, as shown by Tedoldi et al. [50]. Artificial ponds protect receiving surface waters, but are subject to major pollution themselves limiting their ecosystem value, as shown by Karlsson et al. [51]. This partial diversion of pollution without treatment may not only harm the local environment (e.g., by groundwater/soil contamination), but can also limit the NBS potential in heat reduction (e.g., if trees or irrigated plants are harmed by leached out biocides transported in stormwater [52]).
One option to overcome this problem lies in a combination of technical stormwater treatment with NBS. According to Riechel et al. [47], stormwater can be treated technically with sedimentation tanks, decentralized filter elements (typically used for road runoff) or particle lamella filters. The listed technical stormwater treatment options, however, mostly retain TSS and particle-bound substances (such as PAH and partly Zn). If the stormwater runoff is treated with technical measures, NBS that cannot tackle pollution but can reduce heat islands, such as green roofs, green facades and artificial streams/fountains, could also be included. A combined approach would increase planning options but also increase engineering effort.
As a second option, NBS could be placed in high density areas with heat islands but be fed by stormwater with low pollution. This would be interesting for combined sewer areas, where the polluted stormwater runoff is predominantly treated in WWTP (see strategy 2 above). Unfortunately, there are only 160 areas with a high heat island effect but low pollution (Figure 2). It would also be possible to use stormwater from less polluted areas to feed NBS, such as ponds, tree trenches or rainwater harvesting in areas with heat islands. Of the 2270 high pollution and heat island sites, 236 have neighboring (impervious) areas with low pollution. So, in total, this second option would be feasible for 396 or 16% of all 2410 areas with the heat island effect.
It has become clear that several NBS can tackle pollution and heat. A combination of (technical) treatment with NBS at one site or the linking of polluted with non-polluted sites in combined sewer systems would reduce environmental impact and increase planning options.

5. Conclusions

In this study, a positive correlation between the median stormwater pollution load and UHI was observed. A total of 2270 areas of Berlin exhibit high UHI and high stormwater pollution, representing 15% of all Berlin blocks/street sections, 38% of blocks/street sections with high pollution or 91% of blocks/street sections with high UHI. Most of these 2270 areas show high stormwater pollution loads for more than one water quality parameter. The result can be explained by the important impact of imperviousness on both stormwater pollution and UHI.
The opportunity of the spatial matching of different challenges for NBS implementation depends on strategic aims. In the example for UHI and stormwater pollution, the resulting focus areas differ greatly between aim one “reduce UHI and pollution to receiving surface waters or sewer” and aim two “reduce UHI and the pollution directed to NBS”. Under aim one NBS are implemented where the two challenges are high. In this case, high spatial compatibility is found in Berlin. Under aim two NBS are implemented at low pollution sites with high UHI (for combined sewer systems). This leads to a greatly reduced spatial compatibility.
For both strategies, several multifunctional single NBS or combined NBS are available. Apart from the possible impact of pollution on NBS functionality, NBS implementation potential needs to be accounted for. In the example, matching UHI and pollution areas are predominantly located in sites with a high imperviousness and high density, which make implementation a particular challenge.
Overall, the presented approach can be used for strategic planning on targeted NBS implementation. With similar data the approach can be transferred to other cities with temperate climates. The results gained with this approach provide information on where urban challenges are located and can provide a basis for decision makers on where to prioritize investments. Today, NBS are typically implemented when windows of opportunity exist, i.e., for areas with new planning activities in combination with motivated stakeholders [53]. The presented approach can complement this opportunity-driven implementation practice with city-wide implementation strategies, e.g., by adding a focus on hotspots, where several challenges occur. Furthermore, existing NBS implementation strategies of a city can be evaluated and extended based on findings on the spatial distribution of urban challenges. It is suggested to extend the approach by further challenges (such as biodiversity or flood prevention) and link it to locally feasible and effective NBS or combinations of NBS as a basis for urban planning.

Author Contributions

Conceptualization, L.S. and A.M.; methodology, L.S. and A.M.; software, L.S.; validation, L.S., A.M. and T.E.; formal analysis, L.S.; investigation, L.S.; writing—original draft preparation, L.S. and A.M.; writing—review and editing, L.S., A.M. and T.E.; visualization, L.S.; supervision, T.E.; project administration, T.E.; funding acquisition, T.E. All authors have read and agreed to the published version of the manuscript.

Funding

The contribution of the third author was partly funded by the German Federal Ministry of Education and Research in the framework of the project “netWORKS4” (funding number 01 UR1622C). The first author was supported by the Doctoral School “Human River Systems in the 21st Century (HR21)” of the University of Natural Resources and Life Sciences, Vienna.

Acknowledgments

We would like to thank two anonymous reviewers for their valuable comments and Verena Winiwater for a lingual and structural review of an earlier version of this manuscript. The work was only possible thanks to publicly available geodata of the city of Berlin.

Conflicts of Interest

The authors declare no conflict of interest.

References

  1. United Nations. The World’s Cities in 2018: Data Booklet; Statistical Papers–United Nations (Ser. A), Population and Vital Statistics Report; UN: New York, NY, USA, 2018; ISBN 978-92-1-047610-2. [Google Scholar]
  2. Bazaz, A.; Bertoldi, P.; Buckeridge, M.; Cartwright, A.; de Coninck, H.; Engelbrecht, F.; Jacob, D.; Hourcade, J.-C.; Klaus, I.; de Kleijne, K.; et al. Summary for Urban Policymakers–What the IPCC Special Report on 1.5C Means for Cities; Indian Institute for Human Settlements. 2018. Available online: http://iihs.co.in/knowledge-gateway/summary-for-urban-policymakers-what-the-ipcc-special-report-on-1-5c-means-for-cities-2/ (accessed on 25 May 2020).
  3. United Nations Transforming Our World: The 2030 Agenda for Sustainable Development. 2015. Available online: https://sustainabledevelopment.un.org/post2015/transformingourworld (accessed on 25 May 2020).
  4. Langergraber, G.; Pucher, B.; Simperler, L.; Kisser, J.; Katsou, E.; Buehler, D.; Mateo, M.C.G.; Atanasova, N. Implementing nature-based solutions for creating a resourceful circular city. Blue-Green Syst. 2020, 2, 173–185. [Google Scholar] [CrossRef]
  5. European Commission. Directorate-General for Research and Innovation Towards an EU Research and Innovation Policy Agenda for Nature-Based Solutions & Re-Naturing Cities: Final Report of the Horizon 2020 Expert Group on ’Nature-Based Solutions and Re-Naturing Cities’: (Full Version); Publications Office of the European Union: Luxembourg, 2015; ISBN 978-92-79-46051-7. [Google Scholar]
  6. Liu, L.; Jensen, M.B. Green infrastructure for sustainable urban water management: Practices of five forerunner cities. Cities 2018, 74, 126–133. [Google Scholar] [CrossRef]
  7. Viavattene, C.; Ellis, J.B. The management of urban surface water flood risks: SUDS performance in flood reduction from extreme events. Water Sci. Technol. 2012, 67, 99. [Google Scholar] [CrossRef] [PubMed]
  8. Riechel, M.; Matzinger, A.; Pawlowsky-Reusing, E.; Sonnenberg, H.; Uldack, M.; Heinzmann, B.; Caradot, N.; von Seggern, D.; Rouault, P. Impacts of combined sewer overflows on a large urban river–Understanding the effect of different management strategies. Water Res. 2016, 105, 264–273. [Google Scholar] [CrossRef]
  9. Leimgruber, J.; Krebs, G.; Camhy, D.; Muschalla, D. Model-Based Selection of Cost-Effective Low Impact Development Strategies to Control Water Balance. Sustainability 2019, 11, 2440. [Google Scholar] [CrossRef] [Green Version]
  10. Kabisch, N.; Bonn, A.; Korn, H.; Stadler, J. Nature-Based Solutions to Climate Change Adaptation in Urban Areas Linkages between Science, Policy and Practice; Springer Nature: Cham, Switzerland, 2017; ISBN 978-3-319-56091-5. [Google Scholar]
  11. Gopalakrishnan, V.; Ziv, G.; Hirabayashi, S.; Bakshi, B.R. Nature-Based Solutions Can Compete with Technology for Mitigating Air Emissions Across the United States. Environ. Sci. Technol. 2019, 53, 13228–13237. [Google Scholar] [CrossRef]
  12. Colléony, A.; Shwartz, A. Beyond Assuming Co-Benefits in Nature-Based Solutions: A Human-Centered Approach to Optimize Social and Ecological Outcomes for Advancing Sustainable Urban Planning. Sustainability 2019, 11, 4924. [Google Scholar] [CrossRef] [Green Version]
  13. Panno, A.; Carrus, G.; Lafortezza, R.; Mariani, L.; Sanesi, G. Nature-based solutions to promote human resilience and wellbeing in cities during increasingly hot summers. Environ. Res. 2017, 159, 249–256. [Google Scholar] [CrossRef]
  14. Frantzeskaki, N. Seven lessons for planning nature-based solutions in cities. Environ. Sci. Policy 2019, 93, 101–111. [Google Scholar] [CrossRef]
  15. Chatzimentor, A.; Apostolopoulou, E.; Mazaris, A.D. A review of green infrastructure research in Europe: Challenges and opportunities. Landscape Urban Plan. 2020, 198, 103775. [Google Scholar] [CrossRef]
  16. Parker, J.; de Baro, M.E.Z. Green Infrastructure in the Urban Environment: A Systematic Quantitative Review. Sustainability 2019, 11, 3182. [Google Scholar] [CrossRef] [Green Version]
  17. Hansen, R.; Olafsson, A.S.; van der Jagt, A.P.N.; Rall, E.; Pauleit, S. Planning multifunctional green infrastructure for compact cities: What is the state of practice? Ecol. Indic. 2019, 96, 99–110. [Google Scholar] [CrossRef]
  18. Kuller, M.; Bach, P.M.; Ramirez-Lovering, D.; Deletic, A. Framing water sensitive urban design as part of the urban form: A critical review of tools for best planning practice. Environ. Modell. Softw. 2017, 96, 265–282. [Google Scholar] [CrossRef]
  19. Oral, H.V.; Carvalho, P.; Gajewska, M.; Ursino, N.; Masi, F.; van Hullebusch, E.D.; Kazak, J.K.; Exposito, A.; Cipolletta, G.; Andersen, T.R.; et al. A review of nature-based solutions for urban water management in European circular cities: A critical assessment based on case studies and literature. Blue-Green Syst. 2020, 2, 112–136. [Google Scholar] [CrossRef] [Green Version]
  20. Wang, M.; Sweetapple, C.; Fu, G.; Farmani, R.; Butler, D. A framework to support decision making in the selection of sustainable drainage system design alternatives. J. Environ. Manag. 2017, 201, 145–152. [Google Scholar] [CrossRef]
  21. Morales-Torres, A.; Escuder-Bueno, I.; Andrés-Doménech, I.; Perales-Momparler, S. Decision Support Tool for energy-efficient, sustainable and integrated urban stormwater management. Environ. Model. Softw. 2016, 84, 518–528. [Google Scholar] [CrossRef]
  22. Radinja, M.; Comas, J.; Corominas, L.; Atanasova, N. Assessing stormwater control measures using modelling and a multi-criteria approach. J. Environ. Manag. 2019, 243, 257–268. [Google Scholar] [CrossRef]
  23. Keeley, M.; Koburger, A.; Dolowitz, D.P.; Medearis, D.; Nickel, D.; Shuster, W. Perspectives on the Use of Green Infrastructure for Stormwater Management in Cleveland and Milwaukee. J. Environ. Manag. 2013, 51, 1093–1108. [Google Scholar] [CrossRef]
  24. Alexandre, K. When it rains: Stormwater management, redevelopment, and chronologies of infrastructure. Geoforum 2018, 97, 66–72. [Google Scholar] [CrossRef]
  25. Fryd, O.; Jensen, M.B.; Ingvertsen, S.T.; Jeppesen, J.; Magid, J. Doing the first loop of planning for sustainable urban drainage system retrofits: A case study from Odense, Denmark. Urban Water J. 2010, 7, 367–378. [Google Scholar] [CrossRef]
  26. Papakos, T.H.; Gould, M.; Brunner, J. Redeveloping Brownfields with LID Design. In Proceedings of the Low Impact Development 2010: Redefining Water in the City; American Society of Civil Engineers: San Francisco, CA, USA, 2010; pp. 1684–1697. [Google Scholar]
  27. Kim, G. An integrated system of urban green infrastructure on different types of vacant land to provide multiple benefits for local communities. Sustain. Cities Soc. 2018, 36, 116–130. [Google Scholar] [CrossRef]
  28. Shapiro, N.; Valentine, B. Green Street Retrofit in an Urban Trasportation Infrastructure. In Proceedings of the 2010 Green Streets and Highways Conference, Denver, CO, USA, 14–17 November 2010; American Society of Civil Engineers: Denver, CO, USA, 2011. [Google Scholar]
  29. SenStadtUm Stadtentwicklungsplan Klima. KONKRET. Klimaanpassung in der Wachsenden Stadt (Urban Development Plan Climate. KONKRET. Climate Change Adaptation in a Growing City); Senatsverwaltung für Stadtentwicklung und Umwelt: Berlin, Germany, 2016. (In German) [Google Scholar]
  30. MA22 Urban Heat Islands. Strategieplan Wien (Strategy plan Vienna) In German; Magistrat der Stadt Wien, Wiener Umweltschutzabteilung–Magistratsabteilung 22. 2015. Available online: https://www.wien.gv.at/umweltschutz/raum/uhi-strategieplan.html (accessed on 25 May 2020).
  31. U.S. EPA Heat Island Reduction Activities. In Reducing Urban Heat Islands: Compendium of Strategies. Draft; 2008. Available online: https://www.epa.gov/heatislands/heat-island-compendium (accessed on 25 May 2020).
  32. Oke, T.R. Boundary Layer Climates, 2nd reprinted ed.; Routledge: London, UK, 2009; ISBN 978-0-415-04319-9. [Google Scholar]
  33. Fenner, D.; Meier, F.; Scherer, D.; Polze, A. Spatial and temporal air temperature variability in Berlin, Germany, during the years 2001–2010. Urban Clim. 2014, 10, 308–331. [Google Scholar] [CrossRef]
  34. Stadtentwicklungsplan Klima: Urbane Lebensqualität im Klimawandel Sichern (Urban Development Plan Climate: Securing Urban Quality of Life in the Context of Climate Change); Brandl, H. (Ed.) Senatsverwaltung für Stadtentwicklung, Kommunikation: Berlin, Germany, 2011; ISBN 978-3-88961-322-6. (In German) [Google Scholar]
  35. Wicke, D.; Matzinger, A.; Rouault, P. Relevanz organischer Spurenstoffe im Regenwasserabfluss Berlins–Abschlussbericht (Relevance of Trace Organic Substances in Berlin’s Stomwater Runoff–Final Report) In German. 2015. Available online: https://www.kompetenz-wasser.de/wp-content/uploads/2017/11/abschlussbericht_ogre_final_rev2.pdf (accessed on 25 May 2020).
  36. Senatsverwaltung für Gesundheit, Umwelt und Verbraucherschutz Ergänzender Länderbericht Berlins zum Entwurf des Bewirtschaftungsplans für den deutschen Teil der Flussgebietseinheit Elbe–Dokumentation der Umsetzung der EG-Wasserrahmenrichtlinie in Berlin (Supplementary country report of Berlin on the draft management plan for the German part of the Elbe river basin district–documentation of the implementation of the EC Water Framework Directive in Berlin); Senatsverwaltung für Gesundheit, Pflege und Gleichstellung: Berlin, Germany, 2009. (In German)
  37. Senate Department for Urban Development and Housing 04.11 Climate Model Berlin—Planning Advices Urban Climate (Edition 2016). Available online: https://www.stadtentwicklung.berlin.de/umwelt/umweltatlas/edin_411.htm (accessed on 24 February 2020).
  38. Groß, G. Numerical Simulation of Canopy Flows; Springer: Berlin, Germany, 1993. [Google Scholar]
  39. VDI. VDI 3787 Part 1–Environmental Meteorology Climate and Air Pollution Maps for Cities and Regions; Verein Deutscher Ingenieure: Düsseldorf, Germany, 2015. Available online: https://standards.globalspec.com/std/1126312/VDI%203787%20BLATT%202 (accessed on 5 June 2020).
  40. Senate Department for Urban Development and Housing 04.10 Climate Model Berlin–Analysis Maps (Edition 2016). Available online: http://www.stadtentwicklung.berlin.de/umwelt/umweltatlas/edb410_06_zusatz.htm#A9 (accessed on 24 February 2020).
  41. Wicke, D.; Matzinger, A.; Sonnenberg, H.; Caradot, N.; Schubert, R.-L.; Rouault, P.; Heinzmann, B.; Dünnbier, U.; von Seggern, D. Spurenstoffe im Regenwasserabfluss Berlins (Trace substances in Berlin’s stormwater runoff) In German. KA Korrespondenz Abwasser Abfall 2017, 5, 394–404. [Google Scholar]
  42. Glugla, G.; Goedecke, M.; Wessolek, G.; Gürtig, G. Langjährige Abflussbildung und Wasserhaushalt im urbanen Gebiet Berlin (Long-term runoff formation and water balance in the urban area of Berlin). Wasserwirtschaft 1999, 89, 34–42. (In German) [Google Scholar]
  43. Matzinger, A.; Wicke, D.; Schubert, R.-L.; Quilitzki, J.; Caradot, N.; Heinzmann, B.; Dünnbier, U.; von Seggern, D.; Rouault, P. Micropollutants in stormwater runoff–Load estimation at city scale. In Proceedings of the 17th IWA Conference on Diffuse Pollution (DIPCON), Berlin, Germany, 13–18 September 2015; p. 5. [Google Scholar]
  44. Wicke, D.; Matzinger, A.; Sonnenberg, H.; Schubert, R.-L.; Caradot, N.; Heinzmann, B.; von Seggern, D.; Rouault, P. Micropollutants in stormwater runoff–citywide loads and comparison with sewage inputs. In Proceedings of the 10th IWA Micropol and Ecohazard Conference, Vienna, Austria, 17–20 September 2017. [Google Scholar]
  45. Simperler, L.; Himmelbauer, P.; Ertl, T.; Stoeglehner, G. Prioritization of stormwater management sites in urban areas. J. Environ. Manag. 2020, 265, 110507. [Google Scholar] [CrossRef]
  46. Simperler, L.; Himmelbauer, P.; Stöglehner, G.; Ertl, T. Siedlungswasserwirtschaftliche Strukturtypen und ihre Potenziale für die dezentrale Bewirtschaftung von Niederschlagswasser (Urban structures and their potential for decentralized stormwater management). Österr. Wasser. Abfallwirtsch. 2018, 595–603. (In German) [Google Scholar] [CrossRef] [Green Version]
  47. Riechel, M.; Remy, C.; Matzinger, A.; Schwarzmüller, H.; Rouault, P.; Schmidt, M.; Offermann, M.; Strehl, C.; Nickel, D.; Sieker, H.; et al. Maßnahmensteckbriefe der Regenwasserbewirtschaftung–Ergebnisse des Projektes KURAS (Description of Measures for Stormwater Management–Results of the KURAS Project) In German; Berlin, Germany. 2017. Available online: http://kuras-projekt.de/fileadmin/Dokumenten_Verwaltung/pdf/KURAS_M_Katalog_20161209_lower.pdf (accessed on 24 February 2020).
  48. Matzinger, A.; Riechel, M.; Schmidt, M.; Corral, C.; Hein, A.; Offermann, M.; Strehl, C.; Nickel, D.; Sieker, H.; Pallasch, M.; et al. Quantification of multiple benefits and cost of stormwater management. In Proceedings of the Novatech, Lyon, France, 28 June–1 July 2016; GRAIE: Lyon, France, 2016. [Google Scholar]
  49. Hensen, B.; Lange, J.; Jackisch, N.; Zieger, F.; Olsson, O.; Kümmerer, K. Entry of biocides and their transformation products into groundwater via urban stormwater infiltration systems. Water Res. 2018, 144, 413–423. [Google Scholar] [CrossRef]
  50. Tedoldi, D.; Chebbo, G.; Pierlot, D.; Branchu, P.; Kovacs, Y.; Gromaire, M.-C. Spatial distribution of heavy metals in the surface soil of source-control stormwater infiltration devices–Inter-site comparison. Sci. Total Environ. 2017, 579, 881–892. [Google Scholar] [CrossRef]
  51. Karlsson, K.; Viklander, M.; Scholes, L.; Revitt, M. Heavy metal concentrations and toxicity in water and sediment from stormwater ponds and sedimentation tanks. J. Hazard. Mater. 2010, 178, 612–618. [Google Scholar] [CrossRef]
  52. Meera, V.; Ahammed, M.M. Water quality of rooftop rainwater harvesting systems: A review. J. Water Supply Res. Technol. 2006, 55, 257–268. [Google Scholar] [CrossRef]
  53. Trapp, J.H.; Nenz, D.; Rouault, P.; Matzinger, A.; Gunkel, M.; Reichmann, B. Planungsprozesse in der wassersensiblen und klimagerechten Stadt–blau-grün-grau gekoppelte Infrastrukturen in der Planungspraxis am Beispiel Berlin (Planning processes in the water-sensitive and climate-friendly city–blue-green-grey coupled infrastructures in planning practice using Berlin as an example). KA Korrespondenz Abwasser Abfall 2019, 66, 929–934. (In German) [Google Scholar]
Figure 1. Land use data and district boarders of Berlin.
Sustainability 12 05967 g001
Figure 2. Distribution of stormwater pollution load from individual areas over the four categories of urban heat island (UHI) effects. Box plots show variation among blocks and street sections in Berlin.
Sustainability 12 05967 g002
Figure 3. Matching of UHI and stormwater pollution. The number of points indicates the number of areas, colors indicate if both criteria are high (green), one is high and one is low (orange) or both are low (red).
Sustainability 12 05967 g003
Figure 4. Spatial distribution of matching areas (high UHI and high stormwater pollution) and the number of stormwater pollution parameters exceeding the mean of the value range of the parameter in this area, not matching areas are illustrated with a grey border.
Sustainability 12 05967 g004
Figure 5. Areas with high water pollution load for the individual parameters (from top left to bottom right: Zinc, Terbutryn, TSS, PAH), colored by the UHI effect in these areas (high UHI effect—dark green, low UHI effect—light blue).
Sustainability 12 05967 g005
Table 1. Number of areas with high UHI and high stormwater pollution considering different combinations of the four parameters.
Considered ParameterNumber of Areas
4 Parameters
PAH, Terbutryn, TSS, Zinc250
3 Parameters
PAH, Terbutryn, TSS250
PAH, Terbutryn, Zinc1757
PAH, TSS, Zinc250
Terbutryn, TSS, Zinc250
2 Parameters
PAH, Terbutryn1769
PAH, TSS508
PAH, Zinc1890
Terbutryn, TSS250
Terbutryn, Zinc1757
TSS, Zinc250
1 Parameter
PAH2191
Terbutryn1776
TSS508
Zinc1962
Table 2. Settlement structures, numbers and size of matching areas with high UHI and high stormwater pollution in Berlin.
Settlement StructureNumber of AreasSize of Areas [ha]
Areas with low sealing and density36.8
Areas with medium sealing and density1062.3
Areas with multi-story development with medium sealing and high density48182.1
Multi-story residential areas with a high degree of sealing and density11272375.3
Highly sealed, dense and mixed-use development6511874.8
Public facilities and special areas70213.1
Office, administration, trade and commerce21.4
Business and industry areas101655.5
Street2583668.2

