Glyphosate Use in the European Agricultural Sector and a Framework for Its Further Monitoring

 ,
,  , ,
, ,
Abstract
1. Introduction
2. Materials and Methods
2.1. Data Collection Process and Scope
2.2. Glyphosate National Sales Data
2.3. Total Pesticide and Herbicide Sales Data
2.4. Share of Glyphosate and Total Pesticides Used in the Agricultural Sector
2.5. Average Use of Glyphosate Per Hectare (AUG)
2.6. Glyphosate Use in the Context of Annual Cropping Systems and Perennial Crops
3. Results
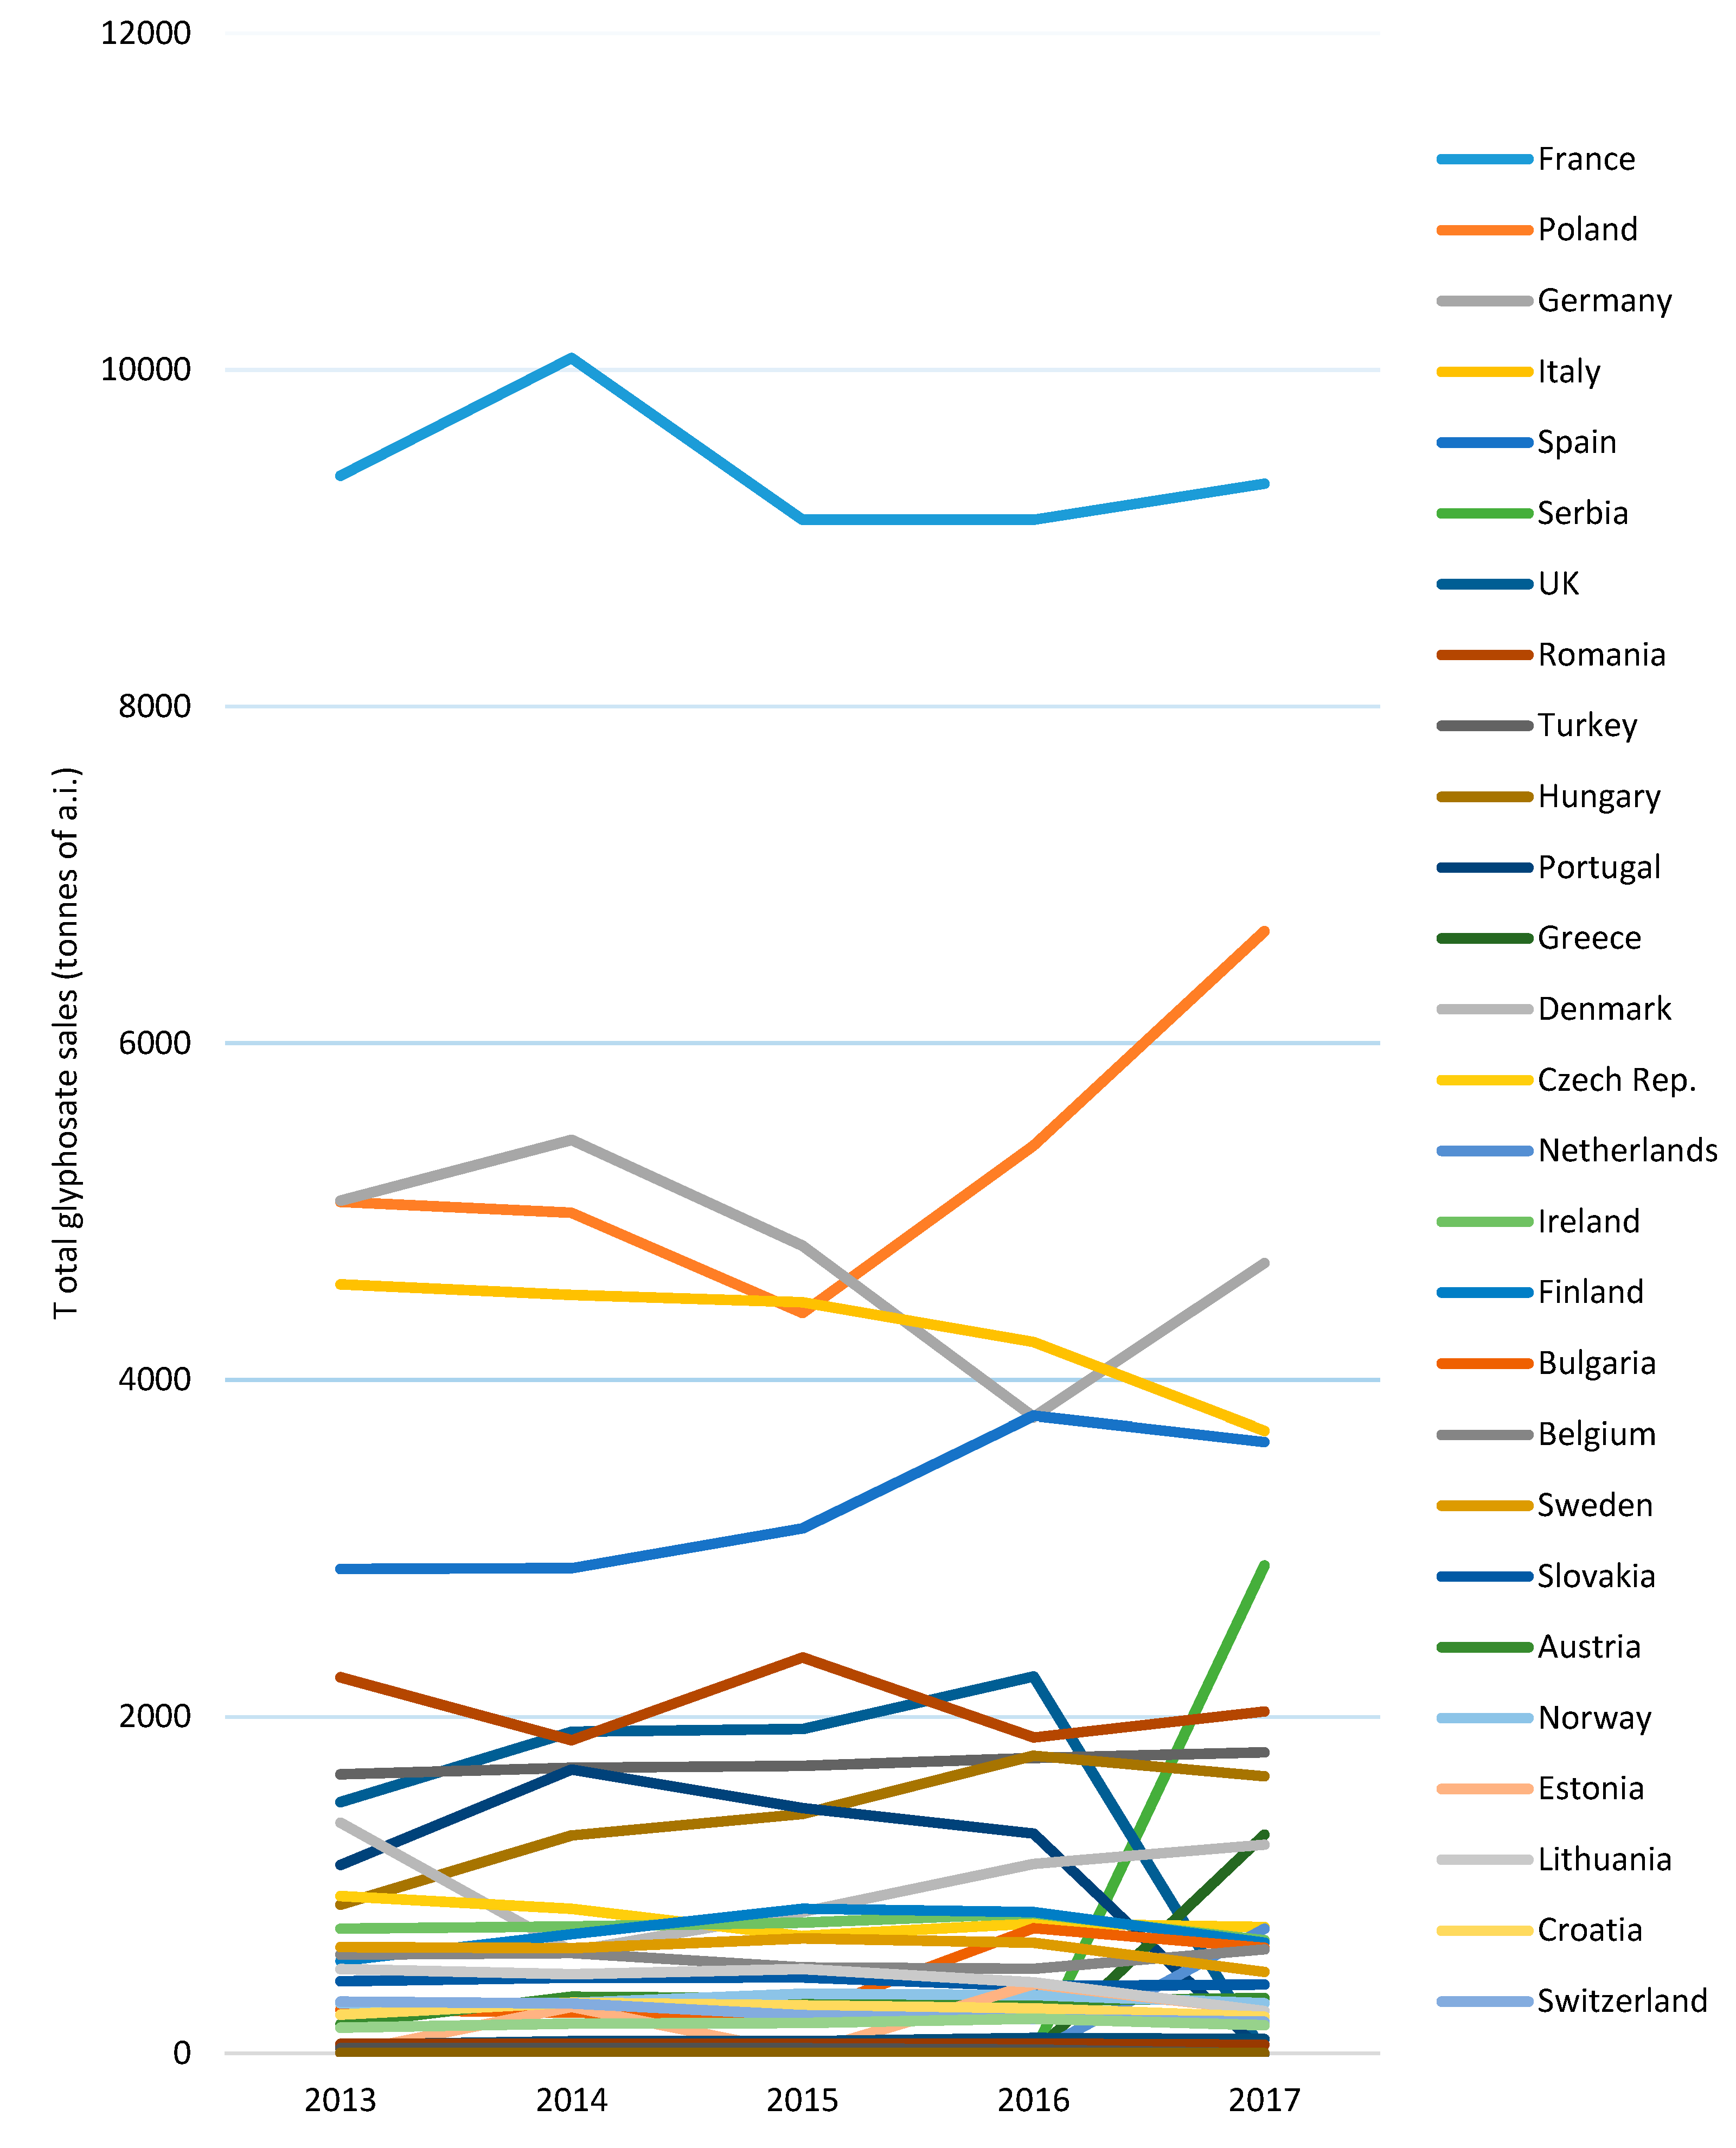
3.1. Glyphosate Sales and Average Use in Europe
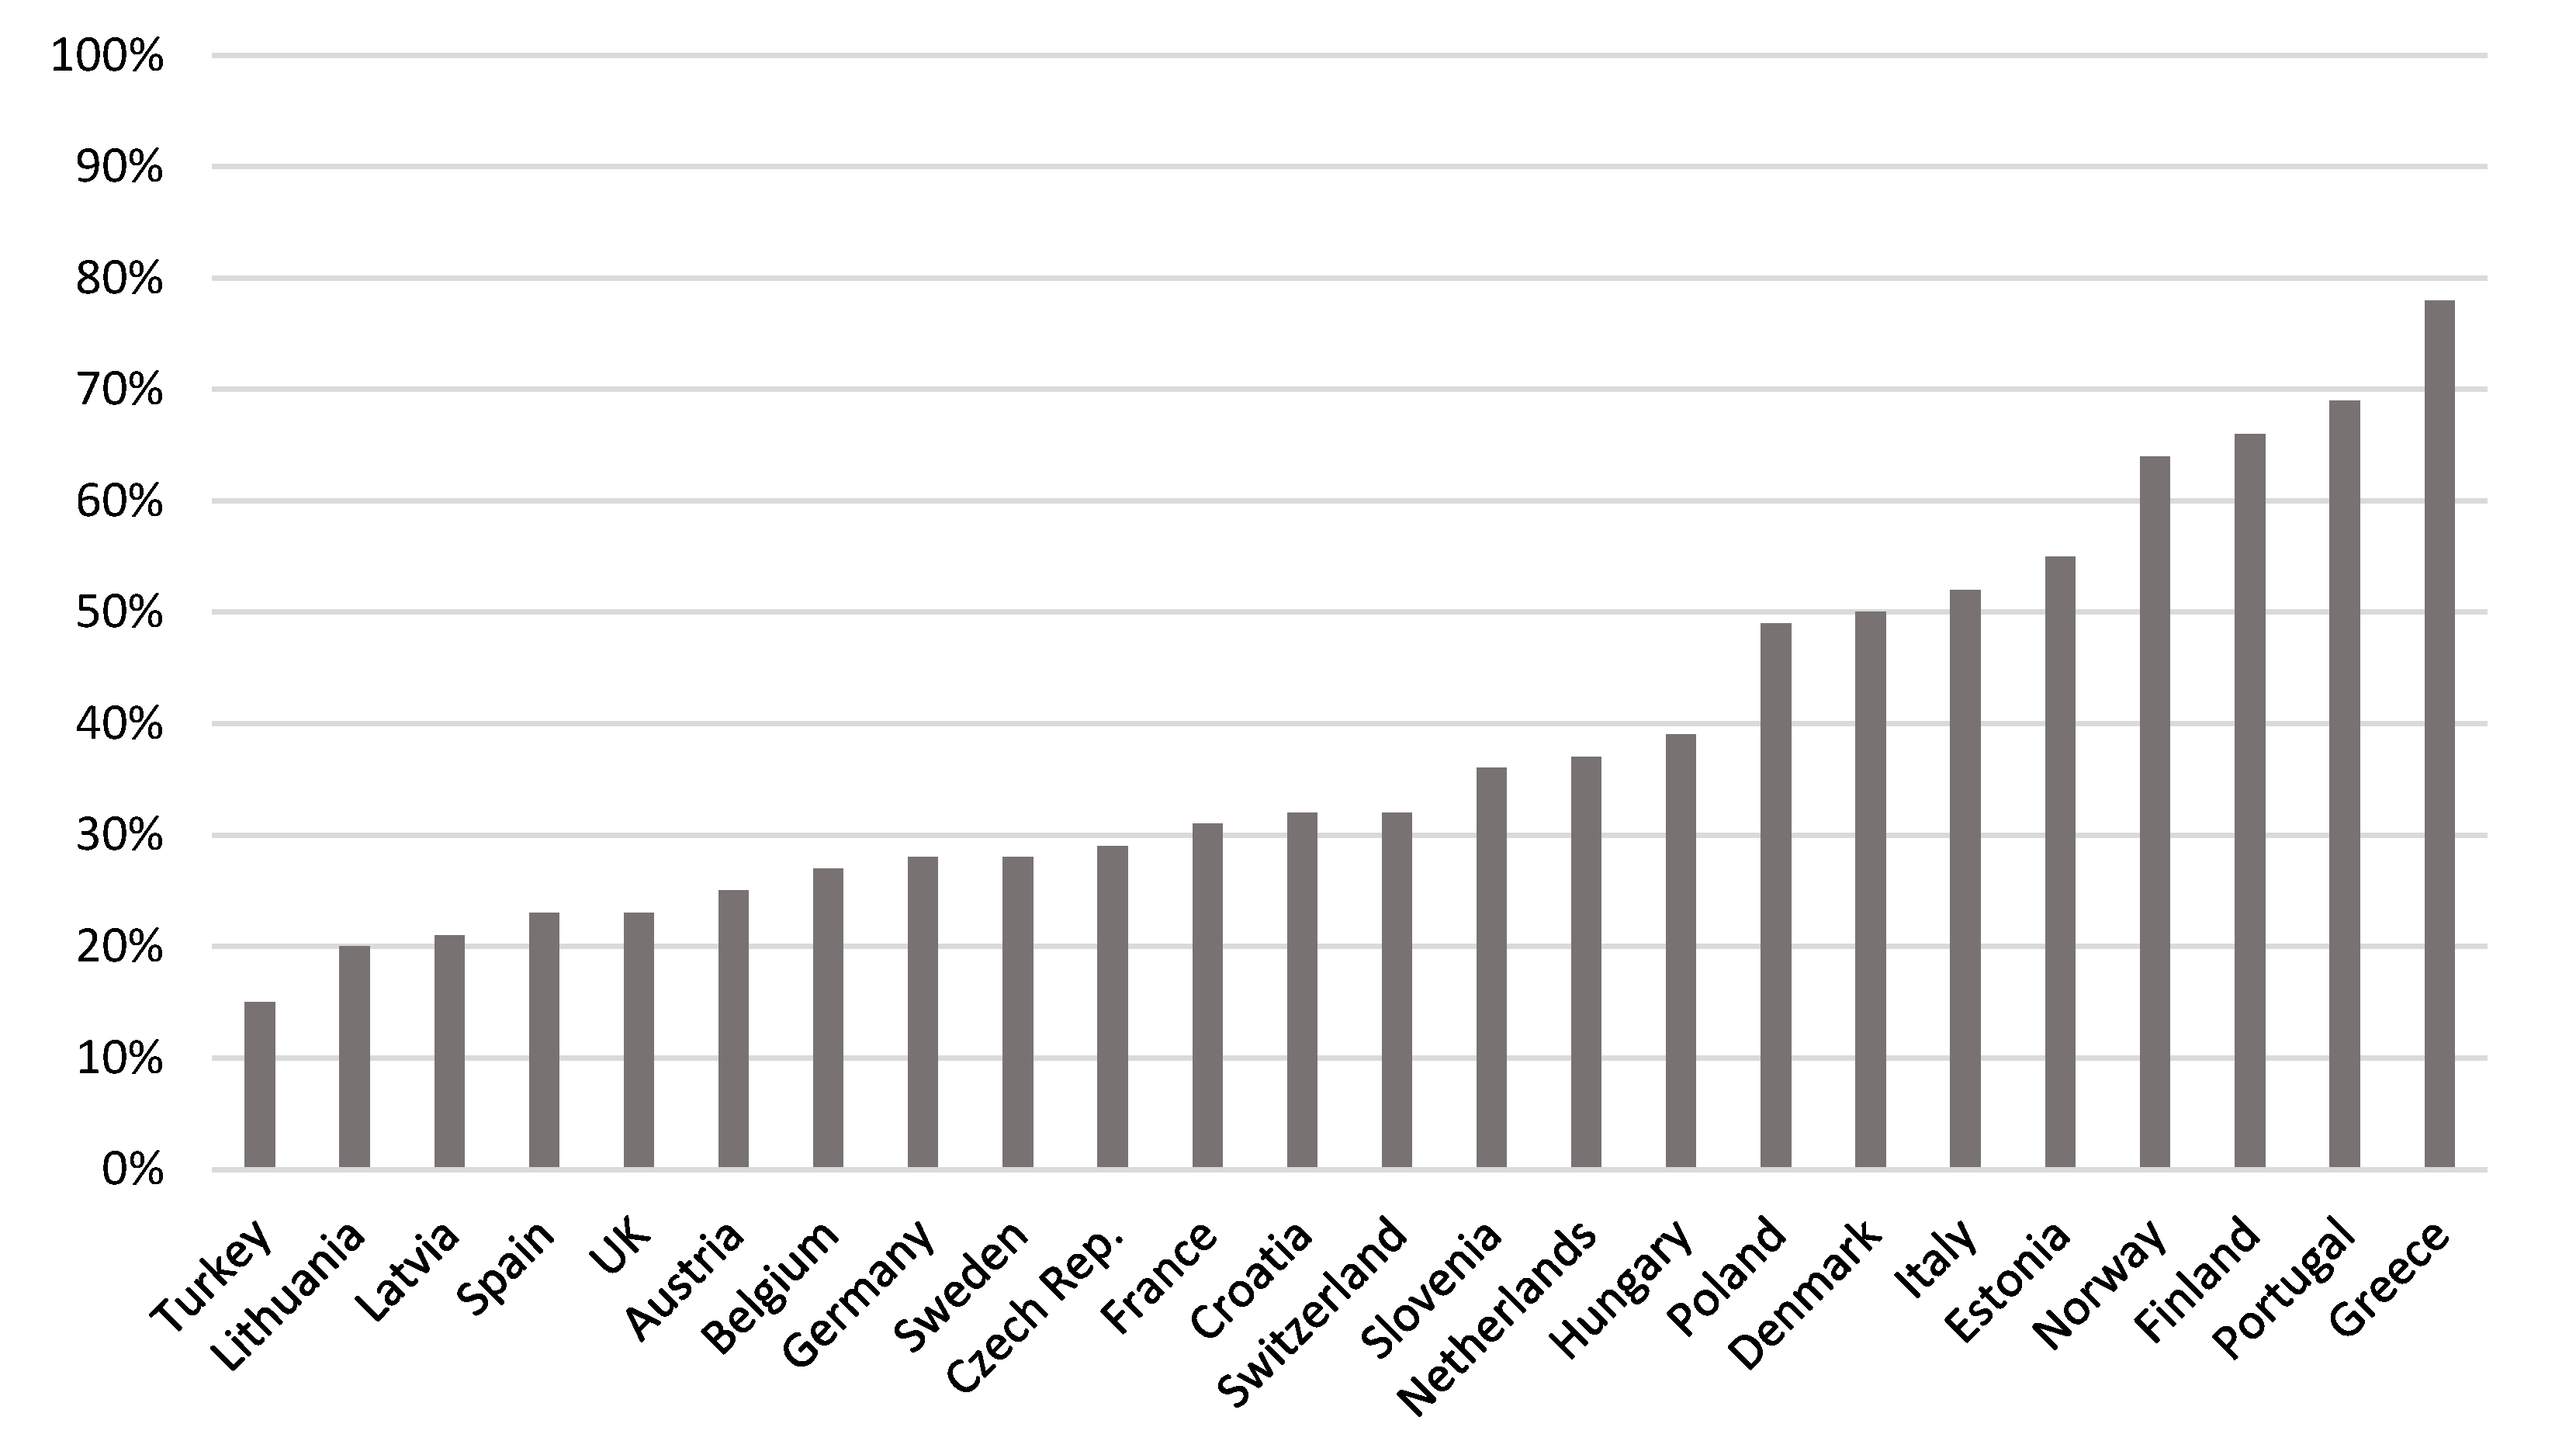
3.2. Glyphosate Sales to the Agricultural Sector
3.3. Use of Glyphosate in Annual Cropping Systems
3.4. Use of Glyphosate in Perennial Crops and Grasslands
4. Discussion
4.1. Comparison of the Use of Glyphosate in Europe and Globally
4.2. Reliability of Data Related to Annual Cropping Systems and Perennial Tree Crops
4.3. Factors Explaining the Differences between Countries
4.4. A Framework for Monitoring Glyphosate Use
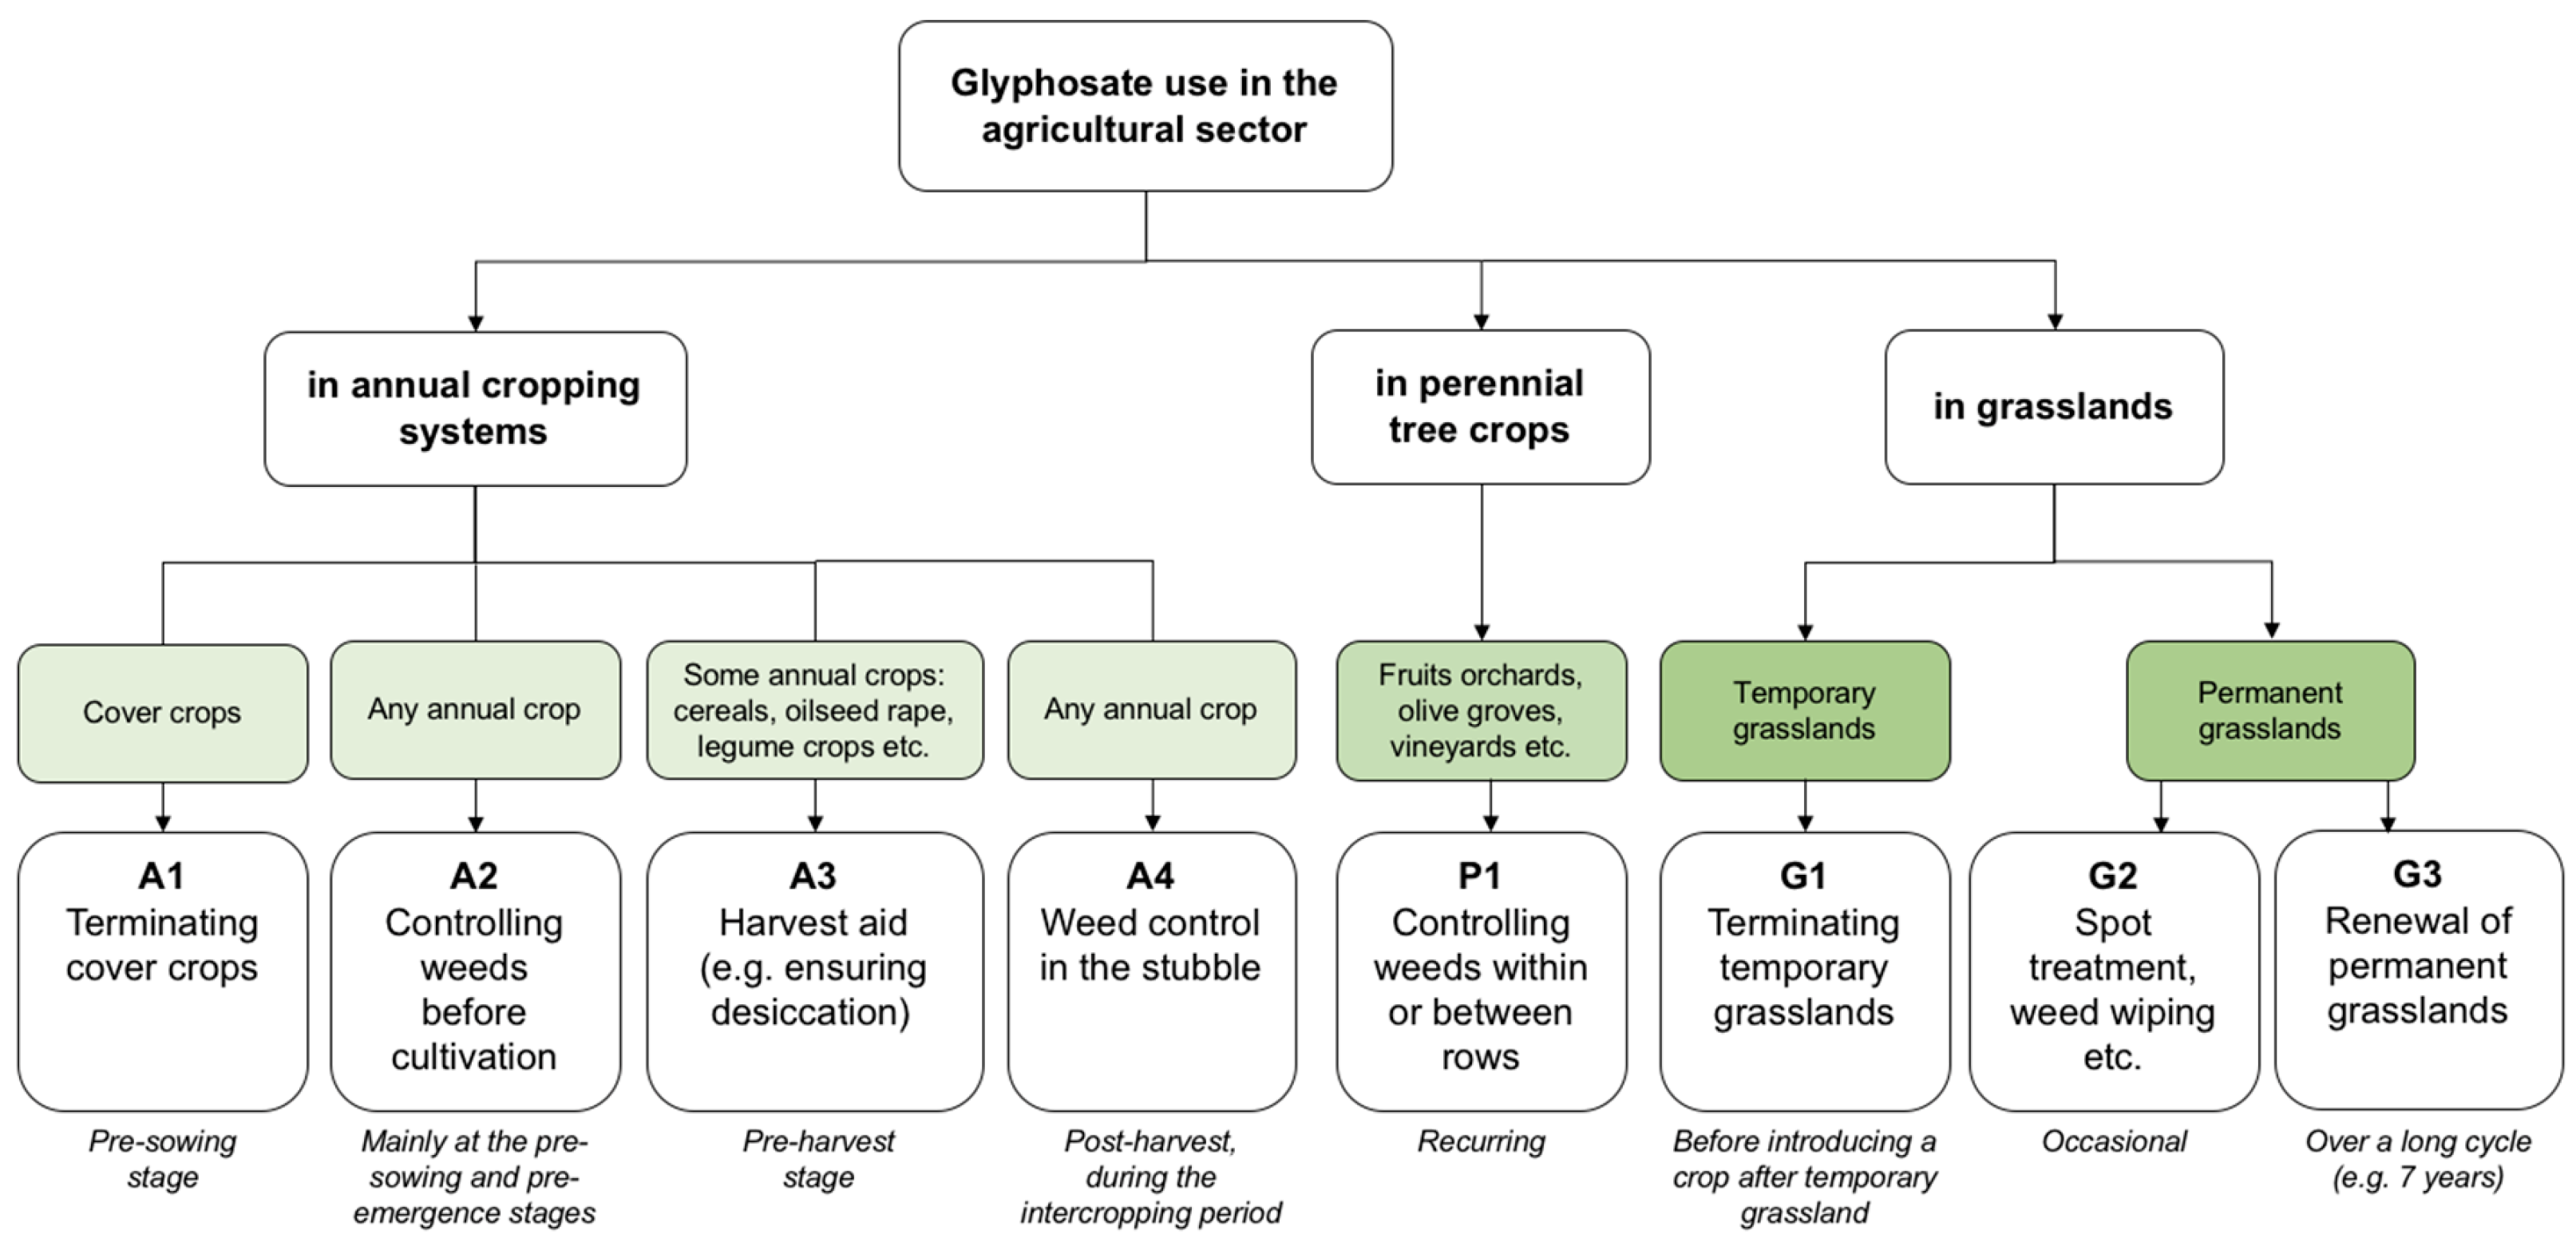
- Type of crop, including annual cropping systems, perennial crops and grassland.
- Purpose for which glyphosate is used, including controlling annual or perennial weeds, managing cover crops, ensuring the desiccation of crops or more generally facilitating harvest, terminating temporary grasslands and the renewal of permanent grassland.
- The rationale behind the use of glyphosate includes occasional and recurrent uses. Occasional glyphosate uses are related to exceptional conditions, such as unfavourable meteorological conditions or specific farm constraints. Recurrent glyphosate uses are widespread practices that are embedded in farming systems, while other agronomic solutions may exist but are not employed. Two types of recurrent uses can be distinguished: glyphosate uses related to structural conditions and systematic glyphosate uses not related to structural conditions. Glyphosate uses related to structural conditions apply when the existing farming equipment or infrastructure is not compatible with the use of non-chemical alternative practices (e.g., aboveground irrigation systems in orchards do not allow for mechanical weed control). In contrast, systematic glyphosate uses not related to structural conditions result from the evolution of farming systems characterized by reduced tillage systems; large-scale farms; and the availability of highly efficient, low-priced herbicides such as glyphosate (e.g., the use of glyphosate for winter crop desiccation or the destruction of cover crops).
4.5. Trends and Factors in the Future Development of Glyphosate Use
Author Contributions
Funding
Acknowledgments
Conflicts of Interest
Appendix A

| Total Sales in Tonnes of a.i. | Estimated Use by the Agricultural Sector 1 in kg of a.i./ha 2 | |||||||
|---|---|---|---|---|---|---|---|---|
| Fungicides and Bactericides | Herbicides. Haulm Destructors and Moss Killers | Insecticides and Acaricides | Total | Fungicides and Bactericides | Herbicides. Haulm Destructors and Moss Killers | Insecticides and Acaricides | Total | |
| Austria | 1992 | 1297 | 1186 | 4474 | 0.88 | 0.57 | 0.52 | 1.98 |
| Belgium | 2496 | 2334 | 536 | 5366 | 1.80 | 1.69 | 0.39 | 3.88 |
| Bulgaria | 1287 | 1699 | 374 | 3360 | 0.24 | 0.31 | 0.07 | 0.62 |
| Croatia | 727 | 669 | 115 | 1511 | 0.47 | 0.43 | 0.07 | 0.97 |
| Cyprus | 818 | 139 | 124 | 1081 | 6.34 | 1.08 | 0.96 | 8.38 |
| Czech Rep. | 1854 | 2562 | 174 | 4590 | 0.55 | 0.76 | 0.05 | 1.37 |
| Denmark | 484 | 2485 | 44 | 3013 | 0.18 | 0.93 | 0.02 | 1.13 |
| Estonia | 117 | 463 | 26 | 606 | 0.13 | 0.52 | 0.03 | 0.68 |
| Finland | 3228 | 1006 | 25 | 4259 | 1.44 | 0.45 | 0.01 | 1.90 |
| France | 29,770 | 30,230 | 3773 | 63,774 | 0.98 | 0.99 | 0.12 | 2.10 |
| Germany | 13,266 | 16,706 | 14,549 | 44,522 | 0.77 | 0.97 | 0.84 | 2.58 |
| Greece | 1686 | 1674 | 893 | 4252 | 0.32 | 0.32 | 0.17 | 0.81 |
| Hungary | 4171 | 4270 | 860 | 9300 | 0.73 | 0.75 | 0.15 | 1.62 |
| Ireland | 634 | 1820 | 54 | 2508 | 0.13 | 0.37 | 0.01 | 0.51 |
| Italy * | 32,643 | 7114 | 2726 | 42,483 | 2.69 | 0.59 | 0.22 | 3.50 |
| Latvia | 267 | 801 | 33 | 1101 | 0.14 | 0.43 | 0.02 | 0.60 |
| Lithuania | 690 | 1252 | 54 | 1996 | 0.23 | 0.42 | 0.02 | 0.66 |
| Luxembourg * | 91 | 61 | 23 | 175 | 0.65 | 0.44 | 0.16 | 1.25 |
| Malta | 102 | 2 | 3 | 107 | 7.92 | 0.19 | 0.24 | 8.35 |
| Netherlands | 4725 | 2902 | 286 | 7912 | 2.45 | 1.51 | 0.15 | 4.11 |
| Norway * | 93 | 467 | 4 | 564 | 0.09 | 0.45 | 0.00 | 0.54 |
| Poland | 6927 | 13,655 | 1819 | 22,402 | 0.45 | 0.88 | 0.12 | 1.44 |
| Portugal | 4181 | 1899 | 943 | 7024 | 1.12 | 0.51 | 0.25 | 1.89 |
| Romania | 4600 | 5486 | 945 | 11,031 | 0.32 | 0.38 | 0.06 | 0.76 |
| Slovakia | 685 | 1105 | 139 | 1929 | 0.36 | 0.58 | 0.07 | 1.01 |
| Slovenia | 795 | 235 | 50 | 1080 | 1.64 | 0.49 | 0.10 | 2.23 |
| Spain * | 37,982 | 16,077 | 6549 | 60,608 | 1.57 | 0.67 | 0.27 | 2.51 |
| Sweden | 265 | 1731 | 31 | 2027 | 0.10 | 0.64 | 0.01 | 0.75 |
| Switzerland | 990 | 599 | 251 | 1840 | 0.65 | 0.39 | 0.16 | 1.21 |
| Turkey | 21,831 | 11,825 | 12,171 | 45,828 | 0.52 | 0.28 | 0.29 | 1.09 |
| UK | 5484 | 9682 | 434 | 15,600 | 0.29 | 0.51 | 0.02 | 0.83 |
| EU28 | 161,965 | 129,359 | 36,767 | 328,091 | 0.88 | 0.70 | 0.20 | 1.78 |
| EU28 +3 | 184,880 | 142,251 | 49,192 | 376,324 | 0.81 | 0.62 | 0.21 | 1.64 |
| Herbicides. Haulm Destructors and Moss Killers (PES_H) | Herbicides based on Phenoxy-Phytohormones (H01) | Herbicides Based on Triazines and Triazinones (H02) | Herbicides Based on Amides and Anilides (H03) | Herbicides Based on Carbamates and Bis-Carbamates (H04) | Herbicides Based on Dinitroaniline Derivatives (H05) | Herbicides Based on Derivatives of Urea, of Uracil or of Sulphonylurea (H06) | Other Herbicides (Including Glyphosate) (H99) | Unclassified Herbicides | |
|---|---|---|---|---|---|---|---|---|---|
| Austria | 1297 | 117 | 187 | 230 | 18 | 54 | 55 | 636 | 0 |
| Belgium | 2334 | 116 | 228 | 302 | 130 | - | 107 | 1393 | 57 |
| Bulgaria | 1699 | 1699 | |||||||
| Croatia | 669 | 18 | 70 | 188 | 9 | 18 | 23 | 343 | 0 |
| Cyprus | 139 | 42 | 1 | 1 | 0 | 1 | 2 | 92 | 0 |
| Czech Rep. | 2562 | 131 | 218 | 598 | 56 | 62 | 208 | 1289 | 0 |
| Denmark | 2485 | 23 | 39 | 99 | 34 | 16 | 9 | 2266 | 0 |
| Estonia | 463 | 61 | 2 | 34 | 0 | 7 | 13 | 333 | 13 |
| Finland | 1006 | 198 | 26 | 7 | 7 | 757 | 12 | ||
| France | 30,230 | 1352 | 709 | 6125 | 391 | 1509 | 1759 | 18,386 | 0 |
| Germany | 16,706 | 1129 | 2374 | 3397 | 237 | 742 | 1175 | 7652 | 0 |
| Greece | 1674 | 80 | 35 | 126 | 2 | 213 | 281 | 937 | 0 |
| Hungary | 4270 | 321 | 307 | 1080 | 8 | 142 | 124 | 2287 | 0 |
| Ireland | 1820 | 1820 | |||||||
| Italy | 7486 | 299 | 370 | 978 | 14 | 332 | 176 | 5319 | 0 |
| Latvia | 801 | 134 | 2 | 109 | 0 | 18 | 16 | 521 | 0 |
| Lithuania | 1252 | 236 | 191 | 32 | 679 | 114 | |||
| Luxembourg | 61 | 4 | 12 | 0 | 2 | 33 | 10 | ||
| Malta | 2 | 1 | 1 | 1 | |||||
| Netherlands | 2902 | 339 | 332 | 199 | 51 | 1605 | 376 | ||
| Norway | 467 | 70 | 369 | 29 | |||||
| Poland | 13,655 | 1740 | 728 | 149 | 250 | 7989 | 2799 | ||
| Portugal | 1899 | 55 | 80 | 163 | 2 | 52 | 28 | 1520 | 0 |
| Romania | 5486 | 940 | 281 | 1475 | 23 | 105 | 269 | 2393 | 0 |
| Slovakia | 1105 | 52 | 62 | 232 | 21 | 88 | 60 | 591 | 0 |
| Slovenia | 235 | 9 | 17 | 56 | 0 | 17 | 7 | 129 | 0 |
| Spain | 15,224 | 277 | 815 | 26 | 658 | 11,465 | 1984 | ||
| Sweden | 1731 | 1731 | |||||||
| Switzerland | 599 | 43 | 72 | 87 | 21 | 21 | 36 | 319 | 0 |
| Turkey | 11,825 | 1668 | 162 | 366 | 154 | 830 | 615 | 8031 | 0 |
| UK | 9682 | 301 | 1390 | 254 | 610 | 4583 | 2545 | ||
| EU28+3 | 141,771 | 8839 | 6885 | 18,392 | 1748 | 4478 | 6324 | 81,915 | 13,189 |
| Share of the total herbicide sales | 6% | 5% | 13% | 1% | 3% | 4% | 58% | 9% |
Appendix B


References
- International Agency for Research on Cancer. Some Organophosphate Insecticides and Herbicides; IARC Monographs on the Evaluation of Carcinogenic Risks to Humans: Lyon, France, 2015. [Google Scholar]
- Duke, S.O.; Powles, S.B. Glyphosate: A once-in-a-century herbicide. Pest Manag. Sci. 2008, 64, 319–325. [Google Scholar] [CrossRef] [PubMed]
- Benbrook, C.M. Trends in glyphosate herbicide use in the United States and globally. Environ. Sci. Eur. 2016, 28, 3. [Google Scholar] [CrossRef] [PubMed]
- FAO Statistics on Pesticides Use. Available online: http://www.fao.org/faostat/en/#data/RP/visualize (accessed on 31 March 2020).
- OECD Environmental Indicators for Agriculture: Pesticides Sales. Available online: https://stats.oecd.org/Index.aspx?DataSetCode=AEI_OTHER (accessed on 31 March 2020).
- Woodburn, A.T. Glyphosate: Production, pricing and use worldwide. Pest Manag. Sci. 2000, 56, 309–312. [Google Scholar] [CrossRef]
- Benbrook, C.M. How did the US EPA and IARC reach diametrically opposed conclusions on the genotoxicity of glyphosate-based herbicides? Environ. Sci. Eur. 2019, 31, 2. [Google Scholar] [CrossRef]
- Van Bruggen, A.H.C.; He, M.M.; Shin, K.; May, V.; Jeong, K.C.; Finckh, M.R.; Morris, J.G., Jr. Environmental and health effects of the herbicide glyphosate. Sci. Total Environ. 2018, 616, 255–268. [Google Scholar] [CrossRef]
- Van Straalen, N.M.; Legler, J. Decision-making in a storm of discontent. Science 2018, 360, 958. [Google Scholar] [CrossRef]
- Székács, A.; Darvas, B. Re-registration Challenges of Glyphosate in the European Union. Front. Environ. Sci. 2018, 6, 78. [Google Scholar] [CrossRef]
- Clausing, P. Glyphosate: The European Controversy—A Review of Civil Society Struggles and Regulatory Failures. Camb. Univ. 2019, 4, 351–356. [Google Scholar] [CrossRef]
- Landrigan, P.J.; Belpoggi, F. The need for independent research on the health effects of glyphosate-based herbicides. Environ. Health 2018, 17, 51. [Google Scholar] [CrossRef] [PubMed]
- Richmond, M.E. Glyphosate: A review of its global use, environmental impact, and potential health effects on humans and other species. J. Environ. Stud. Sci. 2018, 8, 416–434. [Google Scholar] [CrossRef]
- Citizens Initiative ECI(2017)000002. 2017. Available online: https://europa.eu/citizens-initiative/initiatives/details/2017/000002_en (accessed on 31 March 2020).
- Murphy, F.; Schwarz-Goerlich, A. Austrian Parliament Backs EU’s First Total Ban of Weedkiller Glyphosate; Reuters: Vienna, Austria, 2019. Available online: www.reuters.com/article/us-austria-glyphosate/austrian-parliament-backs-eus-first-total-ban-of-weedkiller-glyphosate-idUSKCN1TX1JR (accessed on 31 March 2020).
- Peng, W.; Lam, S.S.; Sonne, C. Support Austria’s glyphosate ban. Science 2020, 367, 257. [Google Scholar] [CrossRef] [PubMed]
- Germany Set to Ban Glyphosate from End of 2023; Deutsche Welle: Bonn, Germany, 2019. Available online: www.dw.com/en/germany-set-to-ban-glyphosate-from-end-of-2023/a-50282891 (accessed on 31 March 2020).
- Kudsk, P.; Mathiassen, S. Pesticide regulation in the European Union and the glyphosate controversy. Weed Sci. Pr. 2020, 68, 214–222. [Google Scholar] [CrossRef]
- Powles, S.B. Evolved glyphosate-resistant weeds around the world: Lessons to be learnt. Pest Manag. Sci. 2008, 64, 360–365. [Google Scholar] [CrossRef] [PubMed]
- Heap, I.; Duke, S.O. Overview of glyphosate-resistant weeds worldwide. Pest Manag. Sci. 2018, 74, 1040–1049. [Google Scholar] [CrossRef]
- Friends of the Earth Europe. Introducing Glyphosate, the World’s Biggest Selling Herbicide; Brussels, Belgium, 2013. Available online: https://www.foeeurope.org/sites/default/files/press_releases/foee_1_introducing_glyphosate.pdf (accessed on 31 March 2020).
- Alternative Methods in Weed Management to the Use of Glyphosate and Other Herbicides; Pesticide Action Network Europe: Brussels, Belgium, 2017.
- Antier, C.; Andersson, R.; Auskalnienė, O.; Barić, K.; Baret, P.V.; Besenhofer, G.; Calha, I.; Carrola Dos Santos, S.; De Cauwer, B.; Chachalis, D.; et al. A Survey on the Uses of Glyphosate in EUROPEAN Countries; INRAE: Paris, France, 2020. [Google Scholar]
- Valavanidis, A. Glyphosate, the Most Widely Used Herbicide. Health and Safety Issues. Why Scientists Differ in Their Evaluation of Its Adverse Health Effects. Athens, Greece, 2018. Available online: http://chem-tox-ecotox.org/wp-content/uploads/2018/03/GLYPHOSATE-REVIEW-12-3-2018-1.pdf (accessed on 31 March 2020).
- Commission Regulation 2017/269; European Commission: Brussels, Belgium, 2017.
- ANSES Phytopharmacovigilance. Synthèse des Données de Surveillance. Appui Scientifique et Technique n 2017-04; ANSES (Agence nationale de sécurité sanitaire alimentation, environnement, travail): Paris, France, 2019.
- International Service for the Acquisition of Agri-biotech Applications. Global Status of Commercialized Biotech/Gm Crops in 2018: Biotech Crops Continue to Address the Challenges of Increased Population and Climate Change; New York, NY, USA, 2018. Available online: www.isaaa.org/resources/publications/briefs/54/default.asp (accessed on 31 March 2020).
- Shaner, D.L. The impact of glyphosate-tolerant crops on the use of other herbicides and on resistance management. Pest Manag. Sci. 2000, 56, 320–326. [Google Scholar] [CrossRef]
- Kassam, A.; Friedrich, R.; Derpsch, R.; Kienzle, J. Overview of the Worldwide Spread of Conservation Agriculture. Field Actions Sci. Rep. 2015, 8. [Google Scholar]
- Kassam, A.; Friedrich, T.; Derpsch, R. Global spread of Conservation Agriculture. Int. J. Environ. Stud. 2019, 76, 29–51. [Google Scholar] [CrossRef]
- Peigné, J.; Casagrande, M.; Payet, V.; David, C.; Sans, F.X.; Blanco-Moreno, J.M.; Cooper, J.; Gascoyne, K.; Antichi, D.; Bàrberi, P.; et al. How organic farmers practice conservation agriculture in Europe. Renew. Agric. Food Syst. 2016, 31, 72–85. [Google Scholar] [CrossRef]
- Les Rencontres de l’Agriculture Biologique de Conservation. Icosysteme. 2018. Available online: https://www.icosysteme.com/2018/03/27/les-rencontres-de-la-b-c-agriculture-biologique-de-conservation/ (accessed on 27 March 2018).
- Fogliatto, S.; Ferrero, A.; Vidotto, F. Current and future scenarios of glyphosate use in Europe: Are there alternatives. In Advances in Agronomy; Academic Press: Cambridge, MA, USA, 2020. [Google Scholar]
- Miljostyrelsen Annual Pesticides Statistics 2009; Danish Ministry of the Environment: Copenhagen, Denmark, 2010.
- Garthwaite, D.G. Pesticide Usage Survey Report 235: Arable Crops in the United Kingdom; Food & Environment Research Agency, DEFRA: Beverley, UK, 2010.
- Garthwaite, D.G.; Barker, I.; Laybourn, R.; Lybourn, R.; Huntly, A.; Parrish, G. Pesticide Usage Survey Report 263, Arable Crops in the United Kingdom; National Statistics, Land Use and Sustainability Team: Fera, Sand Hutton; York, UK, 2014. [Google Scholar]
- Steinmann, H.H.; Dickeduisberg, M.; Theuvsen, L. Uses and benefits of glyphosate in German arable farming. Crop Prot. 2012, 42, 164–169. [Google Scholar] [CrossRef]
- Pre-Harvest-Applications-Weed-Control-and-Desssication. Available online: http://www.glyphosate.eu (accessed on 31 March 2020).
- Garthwaite, D.G. Pesticide Usage Survey Report 225: Orchards & Fruit Stores in Great Britain; Food & Environment Research Agency, DEFRA: Berveley, UK, 2008.
- Cellule d’Animation Nationale DEPHY Ecophyto. Le Glyphosate Dans le Réseau DEPHY FERME: État des Lieux des Usages, des Freins et des Alternatives; French Ministry of the Agriculture and Food: Paris, France, 2018; p. 62.
- Roignant, M. Typology of the Uses and Non Uses of Glyphosate in Fields Crops and Mixed Crops/Stock Farming in Pays de la Loire; Life Sciences [q-bio]: Rennes, France, 2019. [Google Scholar]
- Danne, M.; Musshoff, O.; Schulte, M. Analysing the importance of glyphosate as part of agricultural strategies: A discrete choice experiment. Land Use Policy 2019, 86, 189–207. [Google Scholar] [CrossRef]
- Wiese, A.; Schulte, M.; Theuvsen, L.; Steinmann, H.-H. Interactions of glyphosate use with farm characteristics and cropping patterns in Central Europe. Pest Manag. Sci. 2018, 74, 1155–1165. [Google Scholar] [CrossRef] [PubMed]
- Comont, D.; Hicks, H.; Crook, L.; Hull, R.; Cocciantelli, E.; Hadfield, J.; Childs, D.; Freckleton, R.; Neve, P. Evolutionary epidemiology predicts the emergence of glyphosate resistance in a major agricultural weed. New Phytol. 2019, 223, 1584–1594. [Google Scholar] [CrossRef] [PubMed]
- Jacquet, F.; Delame, N.; Lozano-Vita, X.; Reboud, X.; Huyghe, C. Alternatives au Glyphosate en Viticulture: Evaluation Economique des Pratiques de Désherbage; INRAE: Paris, France, 2019. [Google Scholar]
- Jacquet, F.; Delame, N.; Thoueille, A.; Reboud, X.; Huyghe, C. Alternatives au Glyphosate en Arboriculture: Evaluation Economique des Pratiques de Désherbage; INRAE: Paris, France, 2019. [Google Scholar]
- Reboud, X.; Blanck, M.; Aubertot, J.-N.; Jeuffroy, M.-H.; Munier-Jolain, N.; Thiollet-Scholtus, M.; Huyghe, C. Glyphosate Use and Alternatives in French Agriculture—Avoiding Glyphosate, Taming the Heterogeneities; INRAE: Paris, France, 2019. [Google Scholar]
- Beckie, H.J.; Flower, K.C.; Ashworth, B. Farming without Glyphosate? Plants 2020, 9, 96. [Google Scholar] [CrossRef] [PubMed]
- Europe Glyphosate Market by Crop Type (GM Crops and Conventional Crops), by Application (Crop Based Which includes Grains & Cereals, Oil Seeds and Fruits & Vegetables and Non-Crop Based Which includes Turf & Ornamental Grass and Others), and By Region—Industry Analysis, Size, Share, Growth, Trends, and Forecasts 2018–2023; Market Data Forecast: Hyderabad, India, 2019.
- Glyphosate: Global Market Trajectory & Analytics; Global Industry Analysts: San Jose, CA, USA, 2020. Available online: https://www.strategyr.com/market-report-glyphosate-forecasts-global-industry-analysts-inc.asp (accessed on 31 March 2020).
- Ahuja, K.; Rawat, A. Glyphosate Market Size By Application (Conventional Crops, GM Crops), Industry Analysis Report, Regional Outlook, Application Potential, Price Trends, Competitive Market Share & Forecast, 2016–2024; Global Market Insights: Delaware, DE, USA, 2017. [Google Scholar]
- Glyphosate Market for Conventional Crops and Genetically Modified Crop Applications: Global Industry Perspective, Comprehensive Analysis, and Forecast, 2017–2024; Zion Market Research. New York, NY, USA, 2018. Available online: https://www.zionmarketresearch.com/report/glyphosate-market (accessed on 31 March 2020).
- Dehnen-Schmutz, K.; Bastiaans, L.; Chauvel, B.; Gardi, C.; Heppner, C.; Koufakis, I. Protocol for the Evaluation of Data Concerning the Necessity of the Application of Herbicide Active Substances to Control a Serious Danger to Plant Health Which cannot be Contained by Other Available Means, including Non-Chemical Methods; European Food Safety Authority (EFSA): Parma, Italy, 2016.
- Lucas, V.; De Tourdonnet, S.; Barbier, J.-M.; Cittadini, R.; Gasselin, P. Le Glyphosate en Agriculture de Conservation: Un Cas Illustratif de la Dépendance de L’agriculture Française aux Pesticides. In In Proceedings of the INRA-SFER-CIRAD Social Sciences Research Days, Nantes, France, 13–14 December 2018; p. 30. [Google Scholar]

| Share of Glyphosate Volume Sold to the Agricultural Sector 1 | Data Source 2 | Share of Pesticide Volume Sold to the Agricultural Sector 1 | Data Source 2 | Glyphosate Sales from 2013 to 2017 1 | Data Source 2 | |
|---|---|---|---|---|---|---|
| Austria | x | S1 | xx | S1 | ||
| Belgium | x | S2 | x | S2 | xx | S1 |
| Bulgaria | E | |||||
| Croatia | x | S2 | xx | S1 | ||
| Cyprus | E | |||||
| Czech Rep. | xx | S1 | ||||
| Denmark | x | S1 | x | S2 | xx | S1 |
| Estonia | x | S2 | x | S1 | ||
| Finland | x | S2 | x | S2 | xx | S1 |
| France | x | S1 | xx | S1 | ||
| Germany | xx | S1 | ||||
| Greece | x | S2 | ||||
| Hungary | x | S2 | x | S2 | xx | S1 |
| Ireland | E | |||||
| Italy | xx | S1 | ||||
| Latvia | x | S2 | xx | S1 | ||
| Lithuania | x | S2 | xx | S1 | ||
| Luxembourg | E | |||||
| Malta | E | |||||
| Netherlands | x | S2 | x | S2 | ||
| Norway | x | S2 | x | S2 | xx | S1 |
| Poland | xx | S1 | ||||
| Portugal | xx | S1 | ||||
| Romania | E | |||||
| Serbia | x | S2 | ||||
| Slovakia | E | |||||
| Slovenia | xx | S1 | ||||
| Spain | x | S2 | xx | S2 | ||
| Sweden | x | S1 | x | S1 | xx | S1 |
| Switzerland | xx | S1 | ||||
| Turkey | x | S2 | xx | S1 | ||
| UK | x | S1 | x | S2 | x | S1 |
| Crop | Acreage of the Crop at the EU28+4 Level 1 (1000 ha) | Countries in Which Data Was Available | Acreage Covered by the Survey (1000 ha) | Share of the EU28+4 Crop Acreage Covered by the Survey (%) |
|---|---|---|---|---|
| Annual crops | ||||
| Wheat 2 | 34,246 | Austria, Belgium, Croatia, Estonia, Finland, France, Germany, Hungary, Ireland, Latvia, Lithuania, Norway, Portugal, Serbia, Spain, Sweden, Switzerland, UK | 16,819 | 49% |
| Maize 3 | 16,679 | Austria, Belgium, Croatia, Estonia, France, Germany, Hungary, Ireland, Latvia, Lithuania, Portugal, Serbia, Switzerland, Turkey, UK | 9883 | 59% |
| Rape 4 | 6808 | Austria, Belgium, Estonia, Finland, France, Germany, Hungary, Ireland, Latvia, Lithuania, Norway, Switzerland, UK | 4088 | 60% |
| Perennial crops | ||||
| Olive groves 5 | 5897 | Croatia, Greece, Italy, Portugal, Spain, Turkey | 5867 | >99% |
| Vineyards 6 | 3118 | Austria, Belgium, Croatia, France, Germany, Greece, Hungary, Italy, Portugal, Serbia, Spain, Switzerland, Turkey, UK | 2871 | 92% |
| Fruit orchards 7 | 5436 | Austria, Belgium, Croatia, Finland, France, Germany, Greece, Hungary, Ireland, Latvia, Lithuania, Norway, Portugal, Serbia, Spain, Sweden, Switzerland, Turkey, UK | 4316 | 79% |
| Grasslands | ||||
| Temporary grassland | 9180 1 | Austria, Finland, France, Ireland, Sweden, Switzerland, UK | 6065 | 66% |
| 2013 | 2014 | 2015 | 2016 | 2017 | Shift from 2013 to 2017 (%) | Share of Total EU28+4 Sales in 2017 | Data Source 1 | Herbicide Sales in 2017 (t of a.i.) | Proportion of Glyphosate Compared to All Herbicides in 2017 (%) | |
|---|---|---|---|---|---|---|---|---|---|---|
| Austria | 174 | 338 | 327 | 312 | 329 | 89% | 1% | S | 1297 | 25% |
| Belgium | 587 | 596 | 512 | 503 | 619 | 5% | 1% | S | 2334 | 27% |
| Bulgaria | 261 | 242 | 236 | 744 | 629 | 141% | 1% | E | 1699 | 38% |
| Croatia | 231 | 302 | 285 | 268 | 217 | −6% | <1% | S | 669 | 32% |
| Cyprus | 57 | 57 | 57 | 58 | 51 | −9% | <1% | E | 139 | 38% |
| Czech Rep. | 935 | 859 | 698 | 772 | 751 | −20% | 2% | S | 2562 | 29% |
| Denmark 2 | 1371 | 610 | 842 | 1126 | 1241 | −9% | 3% | S | 2485 | 50% |
| Estonia | nd | 277 | nd | 412 | 253 | nd | 1% | S | 463 | 55% |
| Finland | 550 | 710 | 860 | 840 | 660 | 20% | 1% | S | 1006 | 66% |
| France | 9370 | 10,070 | 9110 | 9110 | 9324 | 0% | 19% | S | 30,230 | 31% |
| Germany | 5065 | 5426 | 4797 | 3780 | 4694 | −7% | 9% | S | 16,706 | 28% |
| Greece | nd | nd | nd | nd | 1300 | nd | 3% | S | 1674 | 78% |
| Hungary | 885 | 1296 | 1423 | 1769 | 1647 | 86% | 3% | S | 4270 | 39% |
| Ireland | 742 | 755 | 777 | 831 | 674 | −9% | 1% | E | 1820 | 38% |
| Italy | 4566 | 4504 | 4460 | 4225 | 3699 | −19% | 7% | S | 7114 | 52% |
| Latvia | 153 | 178 | 181 | 207 | 168 | 10% | <1% | S | 801 | 21% |
| Lithuania | 502 | 470 | 502 | 422 | 253 | −50% | 1% | S | 1252 | 20% |
| Luxembourg | 31 | 33 | 31 | 23 | nd | nd | <1% | E | nd | 38% |
| Malta | 3 | 3 | 2 | 2 | 1 | −66% | <1% | E | 2 | 38% |
| Netherlands 3 | nd | nd | nd | nd | 742 | nd | 2% | S | 2902 | 37% |
| Norway | 299 | 300 | 355 | 346 | 299 | 0% | 1% | S | 467 2 | 64% |
| Poland | 5056 | 4992 | 4397 | 5392 | 6665 | 32% | 13% | S | 13,655 | 49% |
| Portugal | 1120 | 1687 | 1459 | 1307 | nd | nd | 3% | S | 1899 | 69% |
| Romania | 2235 | 1861 | 2353 | 1877 | 2032 | −9% | 4% | E | 5486 | 38% |
| Serbia | nd | nd | nd | nd | 2900 | nd | 6% | S | nd | nd |
| Slovakia | 429 | 450 | 451 | 400 | 409 | −5% | 1% | E | 1105 | 38% |
| Slovenia | 51 | 73 | 73 | 92 | 86 | 68% | <1% | S | 235 | 36% |
| Spain | 2879 | 2883 | 3120 | 3787 | 3633 | 26% | 7% | S | 16,077 | 23% |
| Sweden | 632 | 626 | 683 | 657 | 485 | −23% | 1% | S | 1731 | 28% |
| Switzerland | 308 | 296 | 228 | 204 | 189 | −39% | <1% | S | 599 | 32% |
| Turkey | 1659 | 1698 | 1709 | 1755 | 1789 | 8% | 4% | S | 11,825 | 15% |
| UK | 1494 | 1911 | 1927 | 2240 | nd | nd | 5% | S | 9682 | 23% |
| EU28 4 | 41,814 | 43,355 | 42,000 | 43,319 | 44,250 | +6% | 90% | 129,359 | 34% | |
| EU28+3 4 | 44,081 | 45,649 | 44,292 | 45,624 | 46,527 | +6% | 94% | 142,251 | 33% | |
| EU28+4 4 | 46,981 | 48,549 | 47,192 | 48,524 | 49,427 | +5% | 100% | nd | nd |
| Glyphosate Sales in 2017 2 (Tonnes of a.i.) | Data Source of Glyphosate Sales 2 | Estimated Share of Glyphosate Sales Used by the Agriculture Sector 3 | UAA in Conventional Agriculture 1 (1000 ha) | Average Use of Glyphosate in the Agriculture Sector (AUG) (kg of a.i./ha) | |
|---|---|---|---|---|---|
| Austria | 329 | S | 98% | 2035 | 0.16 |
| Belgium | 619 | S | 60% | 1246 | 0.30 |
| Bulgaria | 649 | E | 90% | 4893 | 0.12 |
| Croatia | 217 | S | 85% | 1400 | 0.13 |
| Cyprus | 53 | E | 90% | 116 | 0.40 |
| Czech Rep. | 751 | S | 90% | 3025 | 0.22 |
| Denmark | 1241 | S | 99% | 2405 | 0.51 |
| Estonia | 253 | S | 90% | 806 | 0.28 |
| Finland | 660 | S | 95% | 2014 | 0.31 |
| France | 9324 | S | 95% | 27,357 | 0.32 |
| Germany | 4694 | S | 90% | 15,549 | 0.27 |
| Greece | 1300 | S | 90% | 4742 | 0.25 |
| Hungary | 1647 | S | 97% | 5153 | 0.31 |
| Ireland | 695 | E | 90% | 4415 | 0.14 |
| Italy | 3699 | S | 90% | 10,935 | 0.30 |
| Latvia | 168 | S | 90% | 1663 | 0.09 |
| Lithuania | 253 | S | 90% | 2701 | 0.08 |
| Luxembourg | 23 4 | E | 90% | 126 | 0.16 |
| Malta | 1 | E | 90% | 12 | 0.07 |
| Netherlands | 742 | S | 90% | 1734 | 0.39 |
| Norway | 299 | S | 95% | 935 | 0.30 |
| Poland | 6665 | S | 90% | 14,003 | 0.43 |
| Portugal | 1307 4 | S | 90% | 3349 | 0.35 |
| Romania | 2095 | E | 90% | 13,119 | 0.14 |
| Serbia | 924 | S | 90% | 3425 | 0.24 |
| Slovakia | 422 | E | 90% | 1722 | 0.21 |
| Slovenia | 86 | S | 90% | 435 | 0.18 |
| Spain | 3633 | S | 90% | 21,759 | 0.15 |
| Sweden | 485 | S | 97% | 2435 | 0.19 |
| Switzerland | 189 | S | 90% | 1368 | 0.12 |
| Turkey | 1789 | S | 85% | 37,760 | 0.04 |
| UK | 2240 4 | S | 80% | 16,974 | 0.11 |
| Total EU28 | 44,250 | S, E | 91% | 166,120 | 0.24 |
| Total EU28+3 | 46,527 | S, E | 91% | 206,184 | 0.20 |
| Total EU28+4 | 49,427 | S, E | 91% | 209,608 | 0.21 |
| Crop | Total Acreage of the Crop at EU28+4 Level 1 (1000 ha) | Acreage Covered by the Survey (1000 ha) | Acreage Treated with Glyphosate within the Scope of the Survey (1000 ha) | Area Not Treated with Glyphosate within the Scope of the Survey (1000 ha) | Range of Glyphosate Dose per Hectare (kg of a.i./ha) |
|---|---|---|---|---|---|
| Annual cropping systems | |||||
| Wheat 2 | 34,246 | 16,819 | 5425 32% | 11,394 68% | 0.50–2.00 |
| Maize 3 | 16,679 | 9883 | 2467 25% | 7417 75% | 0.60–2.70 |
| Rape 4 | 6808 | 4088 | 2127 52% | 1961 48% | 0.40–2.00 |
| Perennial crops | |||||
| Olive groves 5 | 5897 | 5867 | 2631 45% | 3236 55% | 1.67–2.50 |
| Vineyards 6 | 3118 | 2871 | 906 29% | 1965 63% | 0.20–2.50 |
| Fruit orchards 7 | 5436 | 4316 | 2778 64% | 1538 36% | 0.45–2.50 |
| Grasslands | |||||
| Temporary grassland | 9180 1 | 6065 | 1171 19% | 4894 81% | no data |
| Maize | Oilseed Rape 1 | Winter Wheat 2 | ||||
|---|---|---|---|---|---|---|
| Purposes for Which Glyphosate May Be Used | Includes Terminating Previous Cover Crops (A1); Controlling Weeds Pre-Sowing or on Stubble (A2, A4); Ensuring Desiccation or more Generally Using Glyphosate as a Harvest Aid 3 (A3) | |||||
| Percentage of the Crop Area Treated with Glyphosate (I6) | Average Dose Per Year 4 kg of a.i./ha (I7b) | Percentage of the Crop Area Treated with Glyphosate (I6) | Average Dose Per Year 4 kg of a.i./ha (I7b) | Percentage of the Crop Area Treated with Glyphosate (I6) | Average Dose Per Year 4 kg of a.i./ha (I7b) | |
| Austria | 15% | 1.50 | 3% | 1.50 | 5% | 1.50 |
| Belgium 5 | 8% | 0.72–1.08 | 5% | 0.72–1.08 | 17% | 0.72–1.08 |
| Croatia | 5% | 1.80 | nd | nd | >20% | 1.80 |
| Estonia | 7% | 2.70 | 17% | 1.60 | 25% | 1.80 |
| Finland | na | na | 10% | 1.08 | 50% | 0.70–1.08 |
| France 6 | 35% | 0.60 | 35% | 0.40 | 20% | 0.50 |
| Germany | 28% | nd | 72% | nd | 31% | nd |
| Hungary | 1% | 1.80 | 40–50% | 1.40 | >90% | 2.00 |
| Ireland | 22% | nd | 66% | nd | 30% | nd |
| Latvia 7 | 10% | nd | 22% | 1.20 | 25% | 1.15 |
| Lithuania | <5% | 1.08–2.00 | 50–60% | 1.08–2.00 | 50–60% | 0.72–1.08 |
| Netherlands | 5% | nd | nd | nd | 16% | nd |
| Norway | nd | nd | 20–40% | 1.08–1.44 | 20–40% | 1.08–1.44 |
| Portugal | 1% | nd | nd | nd | 2% | nd |
| Serbia | 40% | 1.00 | nd | nd | 40–50% | 1.80 |
| Spain | nd | nd | nd | nd | 27% | nd |
| Sweden | nd | nd | nd | nd | >11% | 0.99–1.22 |
| Switzerland | 22% | 1.60 | 25% | 1.70 | 14% | 1.70 |
| Turkey | 15% | 1.00 | nd | nd | nd | nd |
| UK | 36% | 0.81 | 71% | 1.01 | 48% | 0.71 |
| All countries 8 | 25% | 52% | 32% | |||
| Vineyards | Fruit Orchards | Olive Groves | Temporary Grassland | ||||
|---|---|---|---|---|---|---|---|
| Agronomic Purposes for Which Glyphosate May Be Used | Controlling Weeds between or within Rows (P1) | Terminating Temporary Grassland (G1) | |||||
| Percentage of the Crop Area Treated with Glyphosate (I8) | Average Dose Per Year 1 kg of a.i./ha (I10) | Percentage of the Crop Area Treated with Glyphosate (I8) | Average Dose Per Year 1 kg of a.i./ha (I10) | Percentage of the Crop Area Treated with Glyphosate (I8) | Average Dose per Year 1 kg of a.i./ha (I10) | Percentage of the Crop Area Treated with Glyphosate (I8) | |
| Austria | 55% | 1.80 | 40% | 1.80 | na | na | 1% |
| Belgium 2 | 50% | 0.72–1.08 | 92% | 0.72–1.08 | na | na | nd |
| Croatia | 80% | 2.50 | 70% | 2.50 | 80% | 2.50 | nd |
| Finland | na | na | 20% | 1.80 | na | na | 20% |
| France 3 | 36% | 0.20–1.00 | 90% | 0.81 | nd | nd | 30% |
| Germany | 60–80% | nd | 90% | nd | na | na | nd |
| Greece | 60% | nd | 70% | nd | 60% | nd | nd |
| Hungary | 90% | 2.00 | 92% | 2.00 | na | na | nd |
| Ireland | na | na | 49% | nd | na | na | 82% |
| Italy | 26% | nd | nd | nd | 13% | nd | nd |
| Latvia | nd | nd | 73% | 1.70 | nd | nd | nd |
| Lithuania | nd | nd | 90% | 1.30 | na | na | nd |
| Netherlands | nd | nd | 62% | nd | nd | nd | nd |
| Norway | na | na | 91% | 1.08–2.16 | na | na | nd |
| Portugal | 35% | nd | 21% | nd | 19% | nd | nd |
| Serbia | 50% | 1.80 | 50% | 1.80 | na | na | nd |
| Spain | 13% | nd | 33% | nd | 47% | nd | nd |
| Sweden | na | na | 61% | 0.57 | na | na | 4% |
| Switzerland | 83% | 0.90 | 60% | 0.70 | na | na | 24% |
| Turkey | 95% | 1.80 | 85% | 1.80 | 75% | 1.67 | nd |
| UK | 65% | 0.36 | 79% | 0.45 | na | na | <1% |
| All countries 4 | 32% | 39% | 45% | ||||
| Literature Data | Our Analysis | Consistency Level |
|---|---|---|
| European and National Level Data | ||
| 1. It is estimated that glyphosate is applied on about 30% of arable land [33]. | The survey covered four of the major crops in the European arable land. Within the scope of the survey, 32%, 25%, 52% and 19%, respectively, of the wheat, rape, maize and temporary grassland acreage was treated with glyphosate. | Not possible to check consistency, however there is no contradiction in the data |
| 2. In Denmark, glyphosate accounted for 35% of all pesticide use in agricultural production in 2009 [34]. | In Denmark, the estimated use of glyphosate was 1241 tonnes a.i. in 2017—i.e., 41% of pesticide sales (3013 t). | Consistent |
| Data related to annual cropping systems | ||
| 3. Glyphosate is the top-ranked herbicide in UK arable crop production [35]. | Glyphosate volumes accounted for 23% of all herbicide a.i. in 2017 in the UK. Among the herbicide a.i. volume in the UK in 2017 (Eurostat), 3% are herbicides H02; 14% are herbicides H03; 3% are herbicides H04; 6% are herbicides H06; 47% are herbicides H99 (including an estimated 23% of glyphosate); 26% are unclassified herbicides. Glyphosate is therefore one of the most used herbicide a.i. in UK. It would be necessary to know the details of the 26% of unclassified herbicides and of the remaining 24% of H99 herbicides in order to conclude if glyphosate is indeed the most commonly used herbicide in the UK. | Consistent |
| 4. Survey data for the UK revealed a total crop application area of 30% in 2014 [36]. | The percentage of the wheat, rape and maize acreage treated with glyphosate in 2017 was 36%, 71% and 48%, respectively. The percentage of fruit orchards and temporary grassland treated with glyphosate in 2017 was 79% and <1%, respectively. | Not possible to check consistency, however there is no contradiction in the data |
| 5. In Germany, it has been estimated that glyphosate is used on 4.3 million hectares (39%) of agricultural land each year, with nearly two thirds applied to just three crops—oilseed rape, winter wheat and winter barley [37]. | 28% of the maize acreage, 72% of the oilseed rape acreage and 31% of the winter wheat acreage were treated with glyphosate. In terms of acreage, this represents 993,000 ha of winter wheat treated with glyphosate, 708,000 ha of maize treated with glyphosate and 942,000 ha of oilseed rape treated. In total, that is 2.7 million ha treated with glyphosate in just three annual crops. In addition, 53,000 ha of fruit orchards and 70,000 ha of vineyards were treated with glyphosate. In total, 2.8 million ha of five crops were treated with glyphosate. | Consistent |
| 6. It is estimated that 50% to 60% of sunflower crops in France, Romania and Hungary are treated before harvest with glyphosate [38]. | Sunflower is not included in the survey. As a comparison, in France 35% of the maize acreage, 35% of the oilseed rape acreage and 20% of the winter wheat acreage were treated with glyphosate; in Romania no data was obtained; and in Hungary <1% of the maize acreage, 40–50% of the oilseed rape acreage and 90% of the winter wheat acreage were treated with glyphosate. | Not possible to check consistency |
| Data related to perennial tree crops | ||
| 7. Glyphosate is the most commonly used herbicide in commercial fruit orchards in the UK [39]. | 79% of fruit orchards in UK are treated with glyphosate at least once a year. The average dose is 0.45 kg of a.i./ha. | Not possible to check consistency |
| 8. Regarding fruit orchards, the number of applications per year varies among crops: on average, within the sample studied, one application per hectare per year for apricot, apple and pear trees; two applications for peach and plum trees; and three for clementines [40]. | According to the survey, the annual dose of glyphosate in fruit orchards varied from 0.45 to 2.50 kg a.i./ha/year. Variations may be due to differences in agronomic practices (e.g., herbicide treatments versus their combination with non-chemical weed control practices), the mode of application (across the whole orchard or only in the row) and different practices depending on the fruit tree species or varieties. | Consistent |
| Allocation Rule | Details |
|---|---|
| Rule 1. Allocation from harvest to harvest | After harvest, all treatments are considered as a preparation for the cultivation of the next crop and are therefore allocated to the next crop. Consequently, glyphosate applied after harvest/on stubble is allocated to the next crop. Glyphosate applied right before sowing is allocated to the crop being sown. Desiccation treatments are allocated to the treated crop. |
| Rule 2. Allocation from field preparation to post-harvest treatments | Glyphosate applied right before sowing is allocated to the crop being sown. Glyphosate applied after harvest/on stubble is allocated to the crop previously harvested. Desiccation treatments are allocated to the treated crop. |
| Rule 3. Allocation to the intercrop period | Glyphosate applied after harvest/on stubble is allocated to the intercrop period. If any application of glyphosate for cover crop destruction (that may also serve for field preparation before the sowing of the next crop), the treatment is also allocated to the intercrop period. |
| Rule 4. Allocation to the cropping system | Glyphosate is assumed to benefit all crops in the rotation. It is therefore allocated to the entire crop rotation and not linked to a specific crop. |
| Indicator | Unit |
|---|---|
| General INDICATORS | |
| I1. Total annual sales of herbicides | t of herbicide a.i. |
| I2. Total annual sales of glyphosate | t of glyphosate a.i. |
| I3. Share of herbicide sales to the agricultural sector | t of herbicide a.i. sold to the agricultural sector/total t of herbicide a.i. |
| I4. Share of glyphosate versus all herbicides sold to the agricultural sector | t of glyphosate a.i./t of herbicide a.i. |
| I5. Average use of glyphosate by the agricultural sector per ha of UAA in conventional agriculture (AUG) | t of glyphosate a.i./ha of UAA in conventional agriculture |
| Indicators related to annual cropping systems | |
| I6. Percentage of the crop area on which glyphosate is used annually | acreage of the crop in which glyphosate is applied/total acreage of the crop |
| I7a. Total use of glyphosate in annual crops | total kg of glyphosate a.i./ha over the crop rotation or for a certain number of years (3–7) |
| I7b. Use of glyphosate related to each crop 1 | kg of glyphosate a.i./ha/growing season |
| Indicators related to perennial tree crops and grassland | |
| I8. Percentage of the crop area on which glyphosate is used annually | acreage of the crop in which glyphosate is applied/total acreage of the crop |
| I9. Average use of glyphosate in a given crop | average kg of a.i./ha per treatment |
| I10. Total use of glyphosate in a given crop | total kg of a.i./ha per year |
© 2020 by the authors. Licensee MDPI, Basel, Switzerland. This article is an open access article distributed under the terms and conditions of the Creative Commons Attribution (CC BY) license (http://creativecommons.org/licenses/by/4.0/).
Share and Cite
Antier, C.; Kudsk, P.; Reboud, X.; Ulber, L.; Baret, P.V.; Messéan, A. Glyphosate Use in the European Agricultural Sector and a Framework for Its Further Monitoring. Sustainability 2020, 12, 5682. https://doi.org/10.3390/su12145682
Antier C, Kudsk P, Reboud X, Ulber L, Baret PV, Messéan A. Glyphosate Use in the European Agricultural Sector and a Framework for Its Further Monitoring. Sustainability. 2020; 12(14):5682. https://doi.org/10.3390/su12145682
Chicago/Turabian StyleAntier, Clémentine, Per Kudsk, Xavier Reboud, Lena Ulber, Philippe V. Baret, and Antoine Messéan. 2020. "Glyphosate Use in the European Agricultural Sector and a Framework for Its Further Monitoring" Sustainability 12, no. 14: 5682. https://doi.org/10.3390/su12145682
APA StyleAntier, C., Kudsk, P., Reboud, X., Ulber, L., Baret, P. V., & Messéan, A. (2020). Glyphosate Use in the European Agricultural Sector and a Framework for Its Further Monitoring. Sustainability, 12(14), 5682. https://doi.org/10.3390/su12145682