Article

Floodplain Settlement Dynamics in the Maouri Dallol at Guéchémé, Niger: A Multidisciplinary Approach

by
Andrea Galligari
1,*,
Fabio Giulio Tonolo
2 and
Giovanni Massazza
1
1
DIST, Politecnico and University of Turin, Viale Mattioli 39, 10125 Turin, Italy
2
DAD, Politecnico of Turin, Viale Mattioli 39, 10125 Turin, Italy
*
Author to whom correspondence should be addressed.
Sustainability 2020, 12(14), 5632; https://doi.org/10.3390/su12145632
Submission received: 12 June 2020 / Revised: 6 July 2020 / Accepted: 9 July 2020 / Published: 13 July 2020
(This article belongs to the Special Issue Risk-Informed Sustainable Development in the Rural Tropics)

Abstract

:
In Sahelian Africa, rural centers have been hit by catastrophic floods for many years. In order to prevent the impact of flooding, the flood-prone areas and the settlement dynamics within them must be identified. The aim of this study is to ascertain the floodplain settlement dynamics in the Maouri valley (135 km2) in the municipality of Guéchémé, Niger. Through hydraulic modeling, the analysis identified the flood-prone areas according to three return periods. The dynamics of the settlements in these areas between 2009 and 2019 were identified through the photointerpretation of high-resolution satellite images and compared with those in the adjacent non-flood-prone areas. Spatial planning was applied to extract the main dynamics. The synergic application of these disciplines in a rural context represents a novelty in the research field. Since 2009, the results have shown a 52% increase of the built-up area and a 12% increase in the number of buildings, though the increase was higher in the flood-prone areas. The factors that transform floods into catastrophes were identified through perceptions gathered from the local communities. Three dynamics of the expansion and consolidation of buildings were observed. Specific flood risk prevention and preparation actions are proposed for each type of dynamic.

1. Introduction

In recent years, floods in Sahelian Africa have become more frequent and catastrophic [1,2,3]. Over the last decade, flood-related issues have begun in this area as a result of the unusual magnitude of climatic events [4,5,6]. Extreme rainfall and its effect on an increasingly altered land surface area are the main flood-driving factors usually reported in the literature [7,8]. Arboreal and shrub cover has been greatly reduced to satisfy the incessant need for arable land [9] and firewood for a continuously growing population. The change of land cover has exposed the soils to degradation processes [10] that increase the runoff [11,12] and lower the rainfall threshold, which, in turn, causes related damage.
The impact of hydrometeorological events is aggravated by insufficient rainwater management [13,14,15,16,17] and water-resistant homes. Anthropic pressure in rural areas [18] has led many people to settle within the flood-prone area (FPA) in the absence of regulation and monitoring by the authorities [19]. Flood damage further exacerbates poverty and risks nullifying investments in the primary sector. This sector in the Sahel is closely linked to the reduction of poverty, food insecurity, and inequalities [20].
In rural Sahel, prevention and preparation for flooding through local plans is struggling to take hold due to a lack of financial resources [21], human resources [22], and systematic and detailed knowledge on the exposed settlements [23]. The recourse to low resolution remote sensing and digital elevation models (DEM), photointerpretation with semi-automatic classification algorithms [24], or with urban growth simulation models [25] does not achieve the level of detail on the assets and exposed population that is needed on a local scale. The use of hydraulic numerical models is still occasional [26] and reveals different application fields and different precision levels [27,28,29]. FPA precision depends on the availability and quality of topographic and hydrological observations [30]. The application field ranges from flood assessment to early warning systems [31], hydraulic constructions [32], and eco-hydraulics [33]. As a result, the literature still offers little on floodplain settlement dynamics and the expansion of settlements is often not quantified [34,35]. This is the first gap that must be addressed in order to improve flood disaster prevention. The second gap concerns the durability of houses in the event of flooding. Currently, the focus is mainly on the precariousness of urban construction [36,37,38,39], but less on consolidation [40] in the rural context, which increases the capital exposed to flooding. Once again, here, it is essential to know the characteristics of the housing stock in order to identify the retrofitting measures that can make buildings more resistant to water [41].
The objective of this study is to ascertain the changes of settlements and housing stock in the FPA over the past decade by answering two questions: first, does demographic growth in a rural context increase the exposure of settlements to flooding? Second, does the improvement of building materials increase the flood resistance of homes? Knowledge of these dynamics could help local administrations to identify and localize flood prevention and preparation measures [42].
The synergic contribution of three different disciplines (remote sensing, hydraulic, and spatial planning) and their application in a rural context represents a novelty of the research. To simplify the interpretation, the acronyms adopted in this study are listed in Table 1.

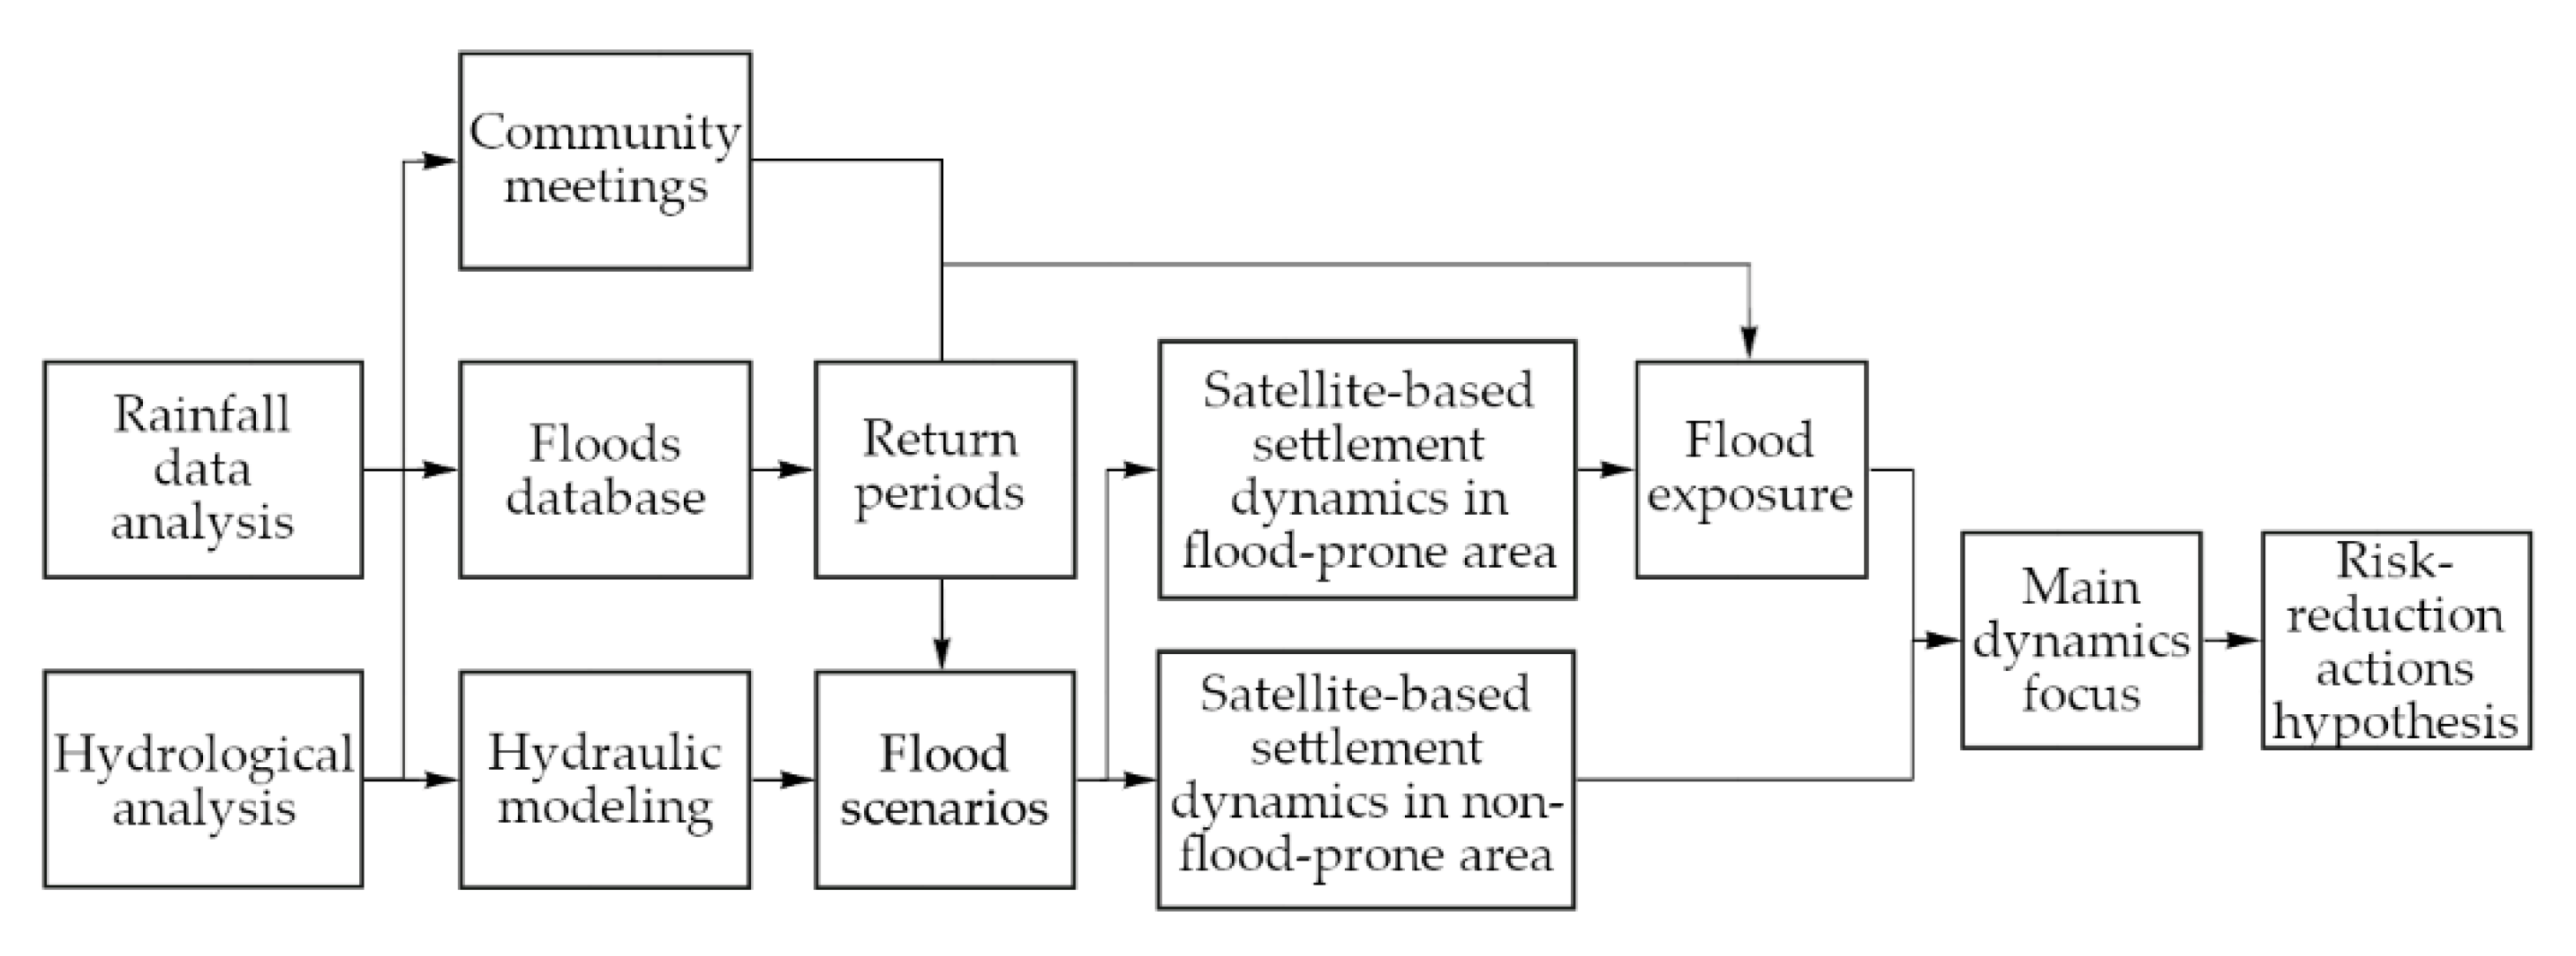
2. Materials and Methods
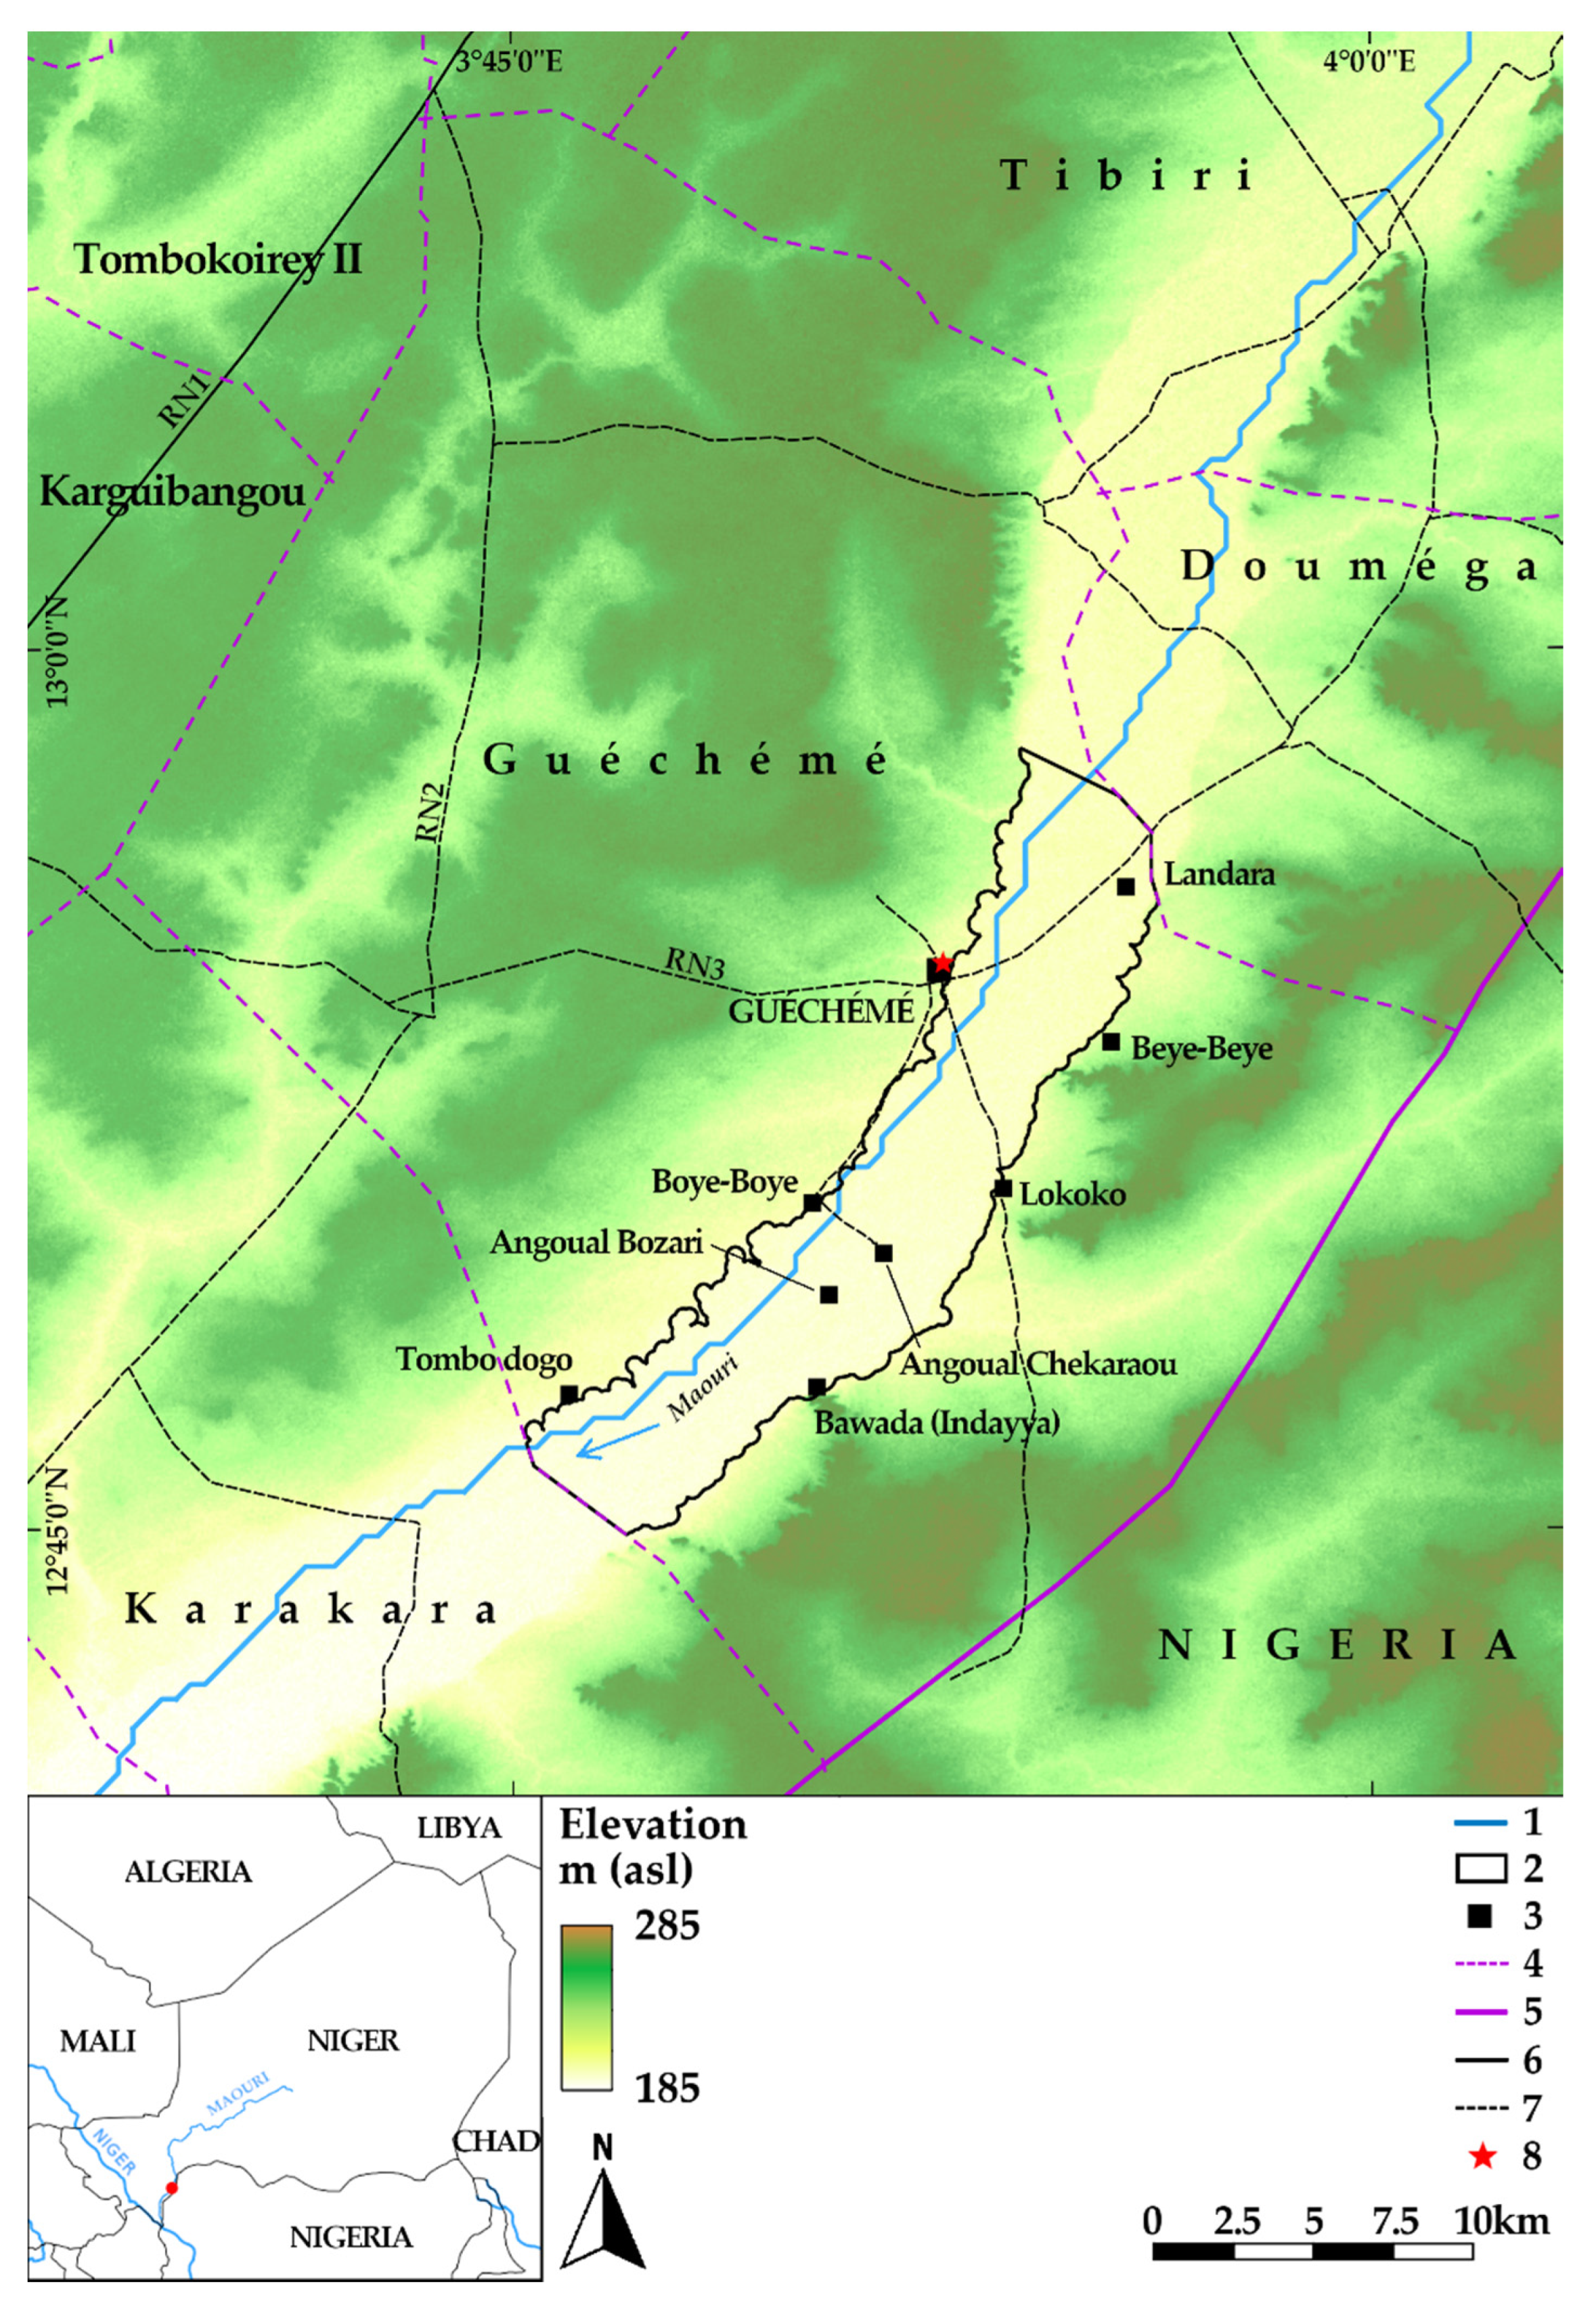
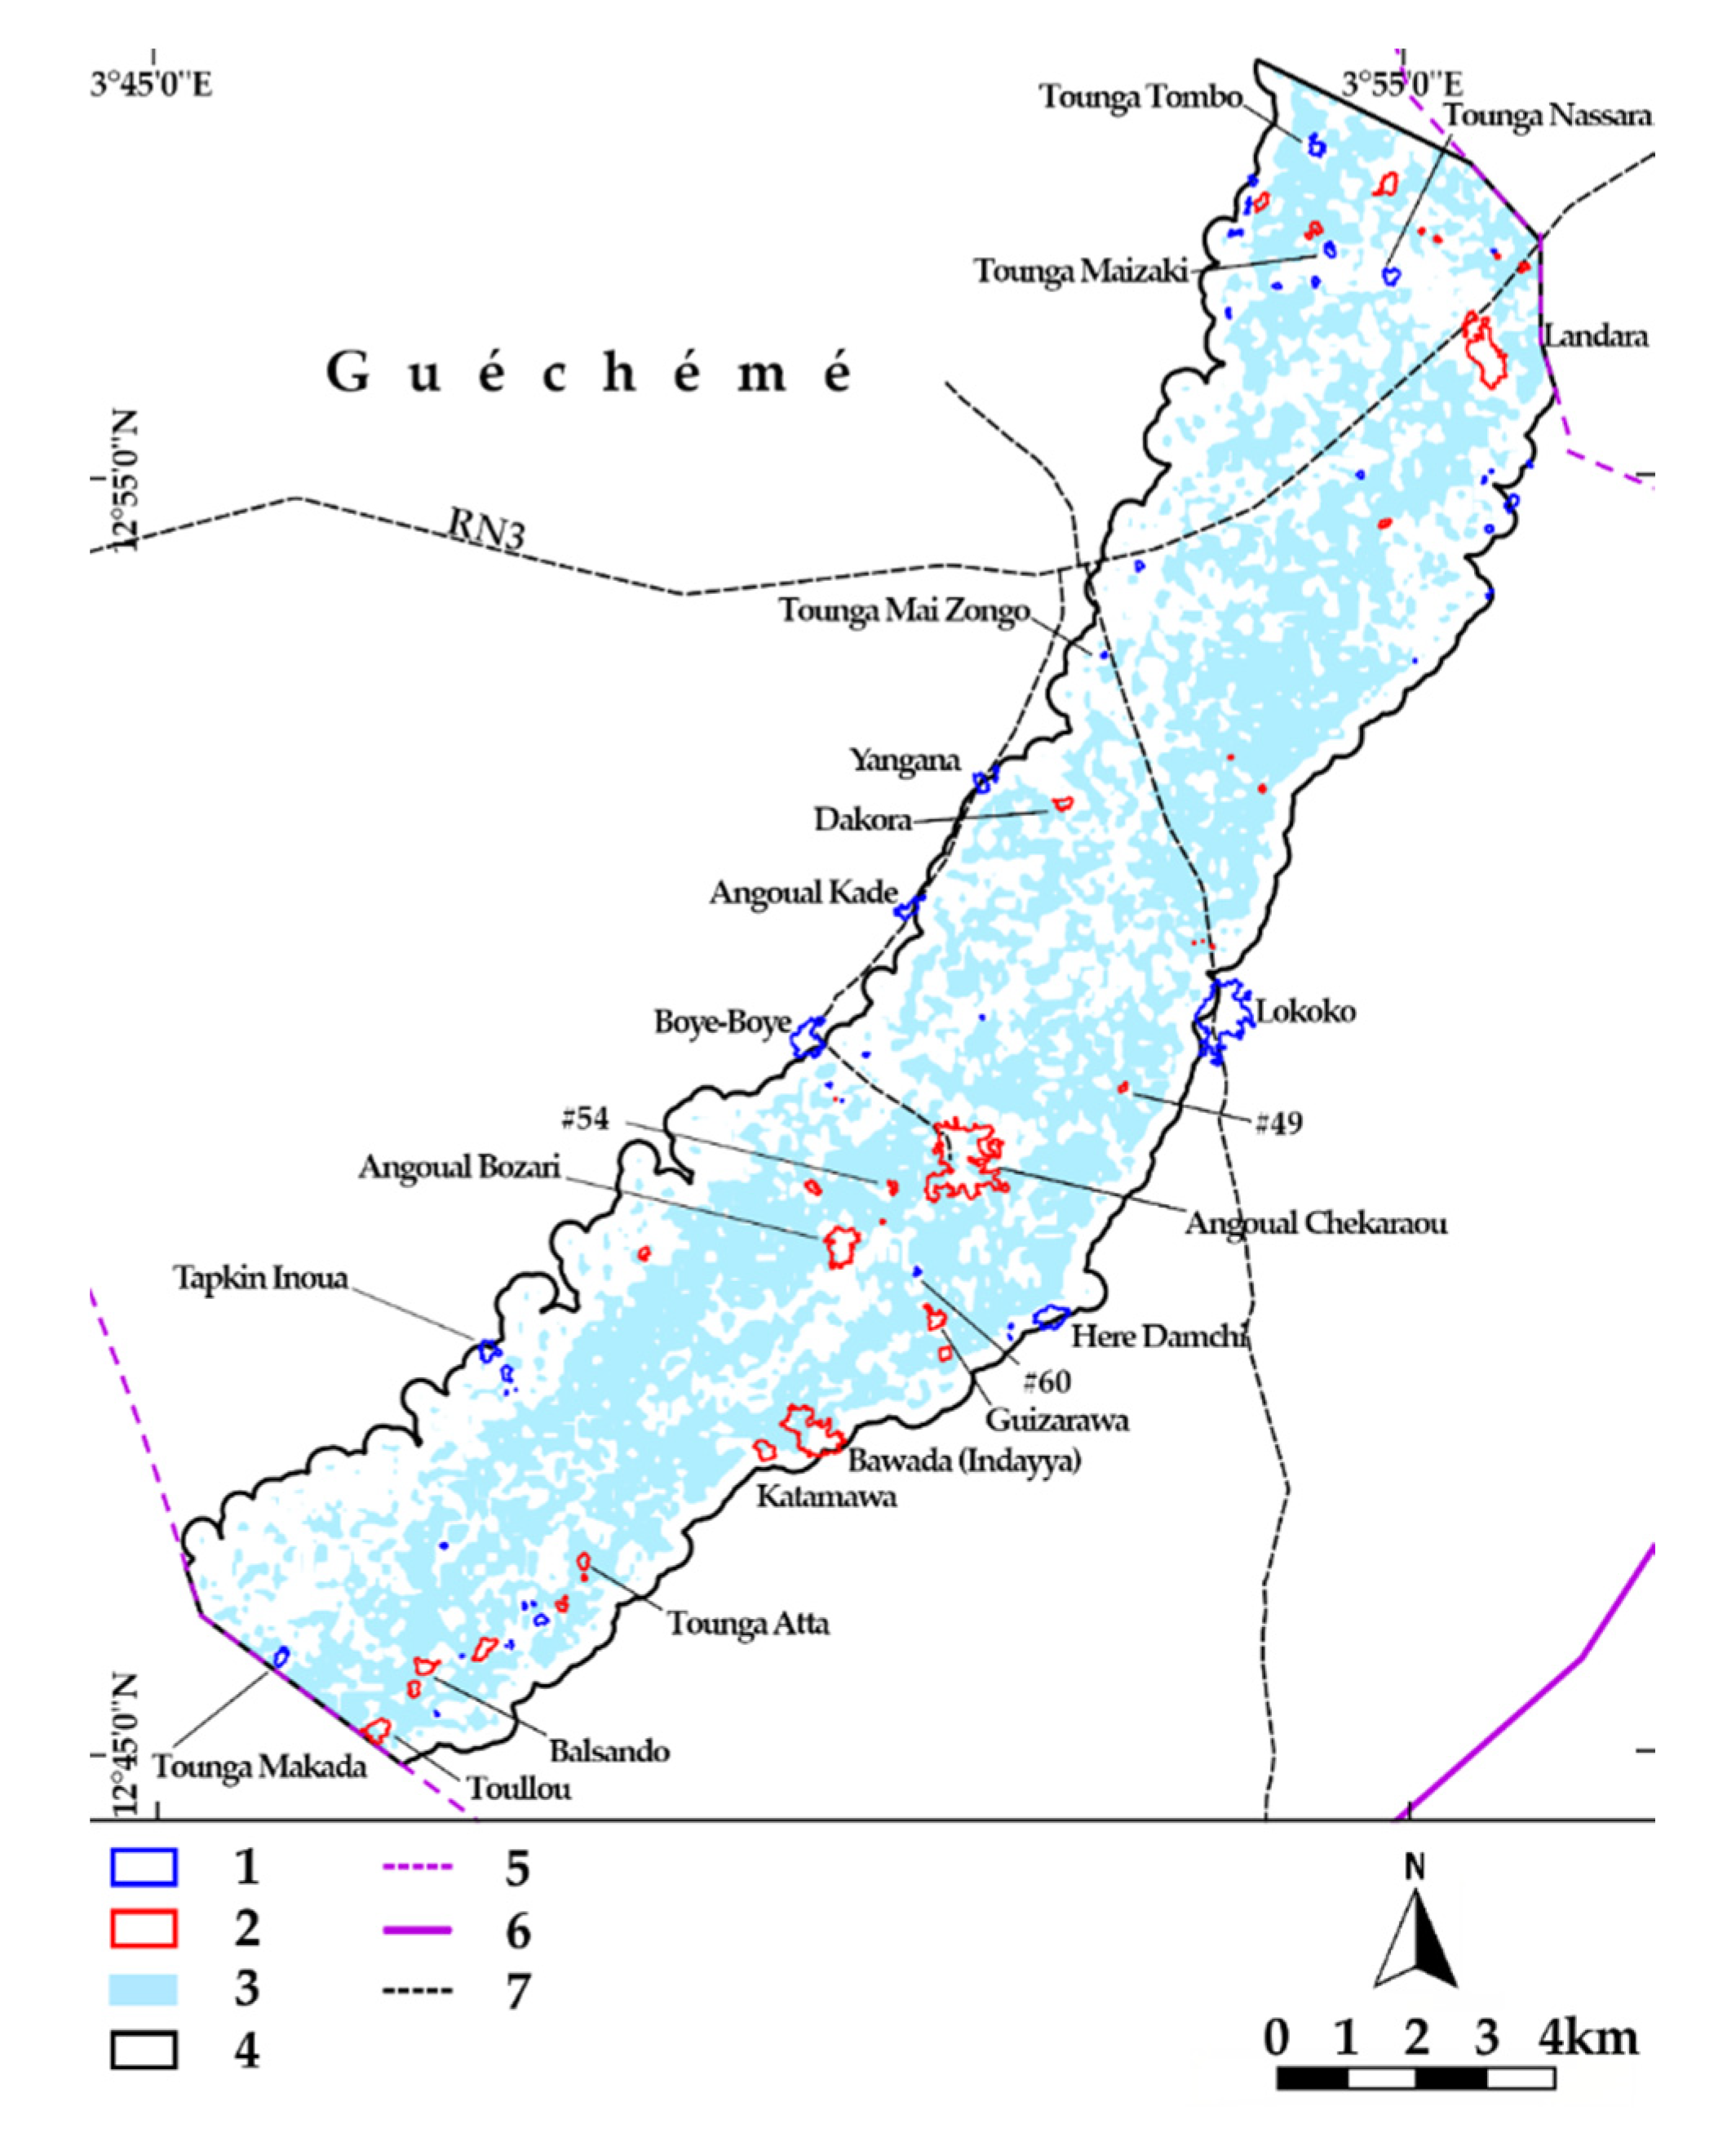
2.1. Study Area

For this study, a rural area exposed to floods in one of the countries with the highest rural population growth in the Sahel was considered: the municipality of Guéchémé (109,000 inhabitants in 2012) in Niger. Between 2001 and 2012, the municipality’s population grew by 23%. The municipal territory is in a watered region (annual average rainfall of 560 mm) of a semi-arid country [43,44]. The studied area (135 km2) is the Maouri Dallol (meaning "valley" in the Fula language), a floodplain that is densely cultivated thanks to the presence of water, but partially exposed to a flood hazard. The floodplain accommodates 87 settlements consisting of 23,000 inhabitants, with one of the country’s highest densities (167 inhabitants/km2) [45] (Figure 1).
Primarily, the study determined the past trend of rainfall and its impact and identified the FPA according to three return period scenarios. Subsequently, it analyzed the settlement dynamics between 2009 and 2019 by identifying the built-up areas and type of buildings based on high-resolution satellite images (Figure 2).

2.2. Rainfall Data Analysis

The analysis of the settlement dynamics was based upon the synergic contribution of different disciplines. The first phase used elements of climatology for the pluviometric characterization of the territory. A series of 38 years of daily rainfall (1981–2018) registered at two weather stations of the National Meteorology Directorate (DMN, according to the French acronym) was used to track the local rainfall profile (annual accumulation) and the intense rainfall within the 95th percentile (trend) [46]. That trend was compared with the database of flood damage recorded and made accessible by the Niger flood database (BDINA, according to the French acronym) [47]. In addition, in 2018–2019, two meetings were organized with the municipality and with the community of Guéchémé to ascertain the local perception of heavy rainfalls, their consequences, and the factors that transformed them into a catastrophic event.

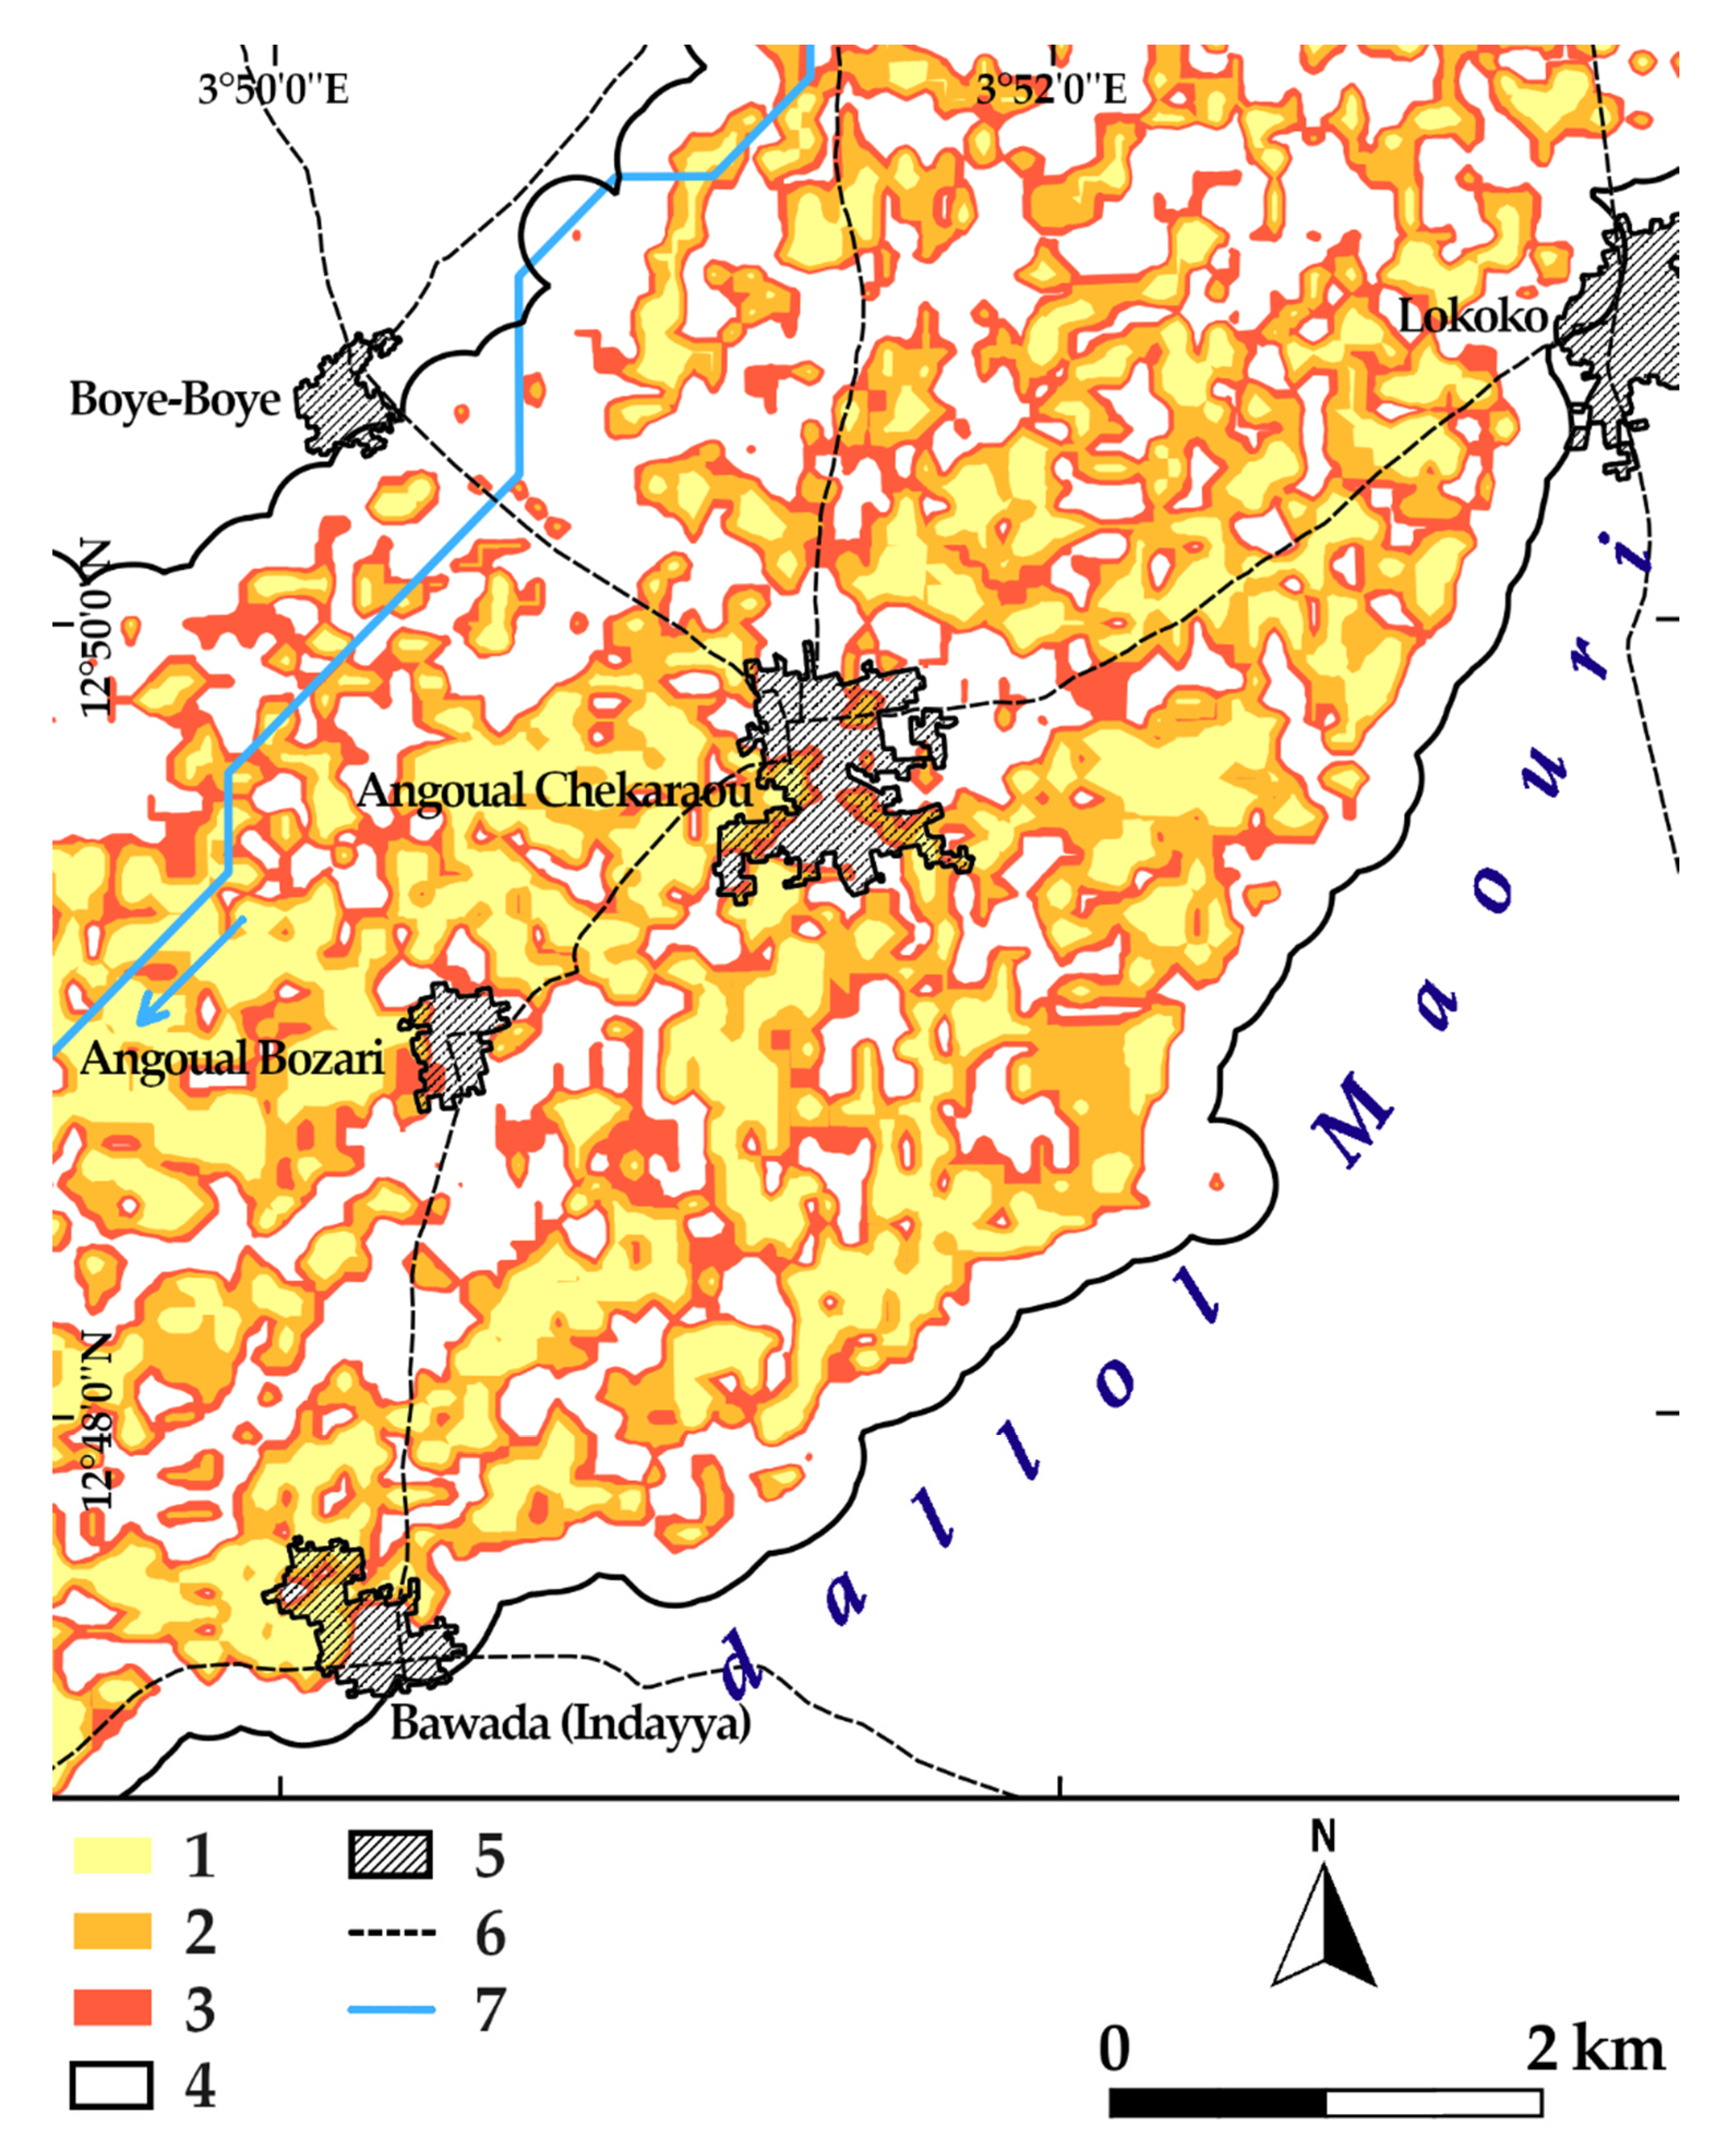
2.3. Hydrological Analysis and Hydraulic Modeling

The second phase applied hydraulic methods to identify the FPA. The upstream hydrographic basin of the study area was defined through the DEM, the hydrological data and maps based on shuttle elevation derivates at multiple scales (HydroSHEDS) hydrographic grid [48,49], and GIS software. The morphology was derived from a 90 m DEM, which was resampled and merged with a 10 m DEM for the North part of the study area [50]. The concentration time was computed through Giandotti’s formula according to the size and characteristics of the catchment area and the river channel [51,52,53]. Using the rainfall data, the maximum rainfall, meaning the maximum precipitation during the concentration time—i.e., the period that generated the maximum runoff in the outlet point of the considered basin—was calculated.
The statistical analysis of the annual maximum rainfall was conducted through the probability density functions (PDF) commonly applied to hydrology, such as log-normal, exponential, Gumbel, and generalized extreme value distributions [54,55]. Anderson–Daring and Pearson tests were used to identify the distributional adequacy of PDF and to ascertain the best fit with the dataset [56]. The statistical analysis facilitated the determination of the critical precipitation according to the annual probability of occurrence (P) and the computation of the relative return periods (RP), which were equal to the inverse of the annual probability (P):
R P = 1 / P
The RP values chosen for this case study were 2, 20, and 200 years, corresponding to events with high, medium, and low probability of occurrence.
These return periods were adopted to ensure the maximum variability and a clear distinction of the three scenarios, which were quite close due to the flat morphology of the large floodplain and the DEM inaccuracy [57].
Hydrographs and maximum discharges were computed through a hydrological model covering the upstream basin. The model was developed on the Hydrologic Engineering Center—hydrologic modeling system (HEC-HMS) software according to the curve number (CN) method, the meteorological data recorded in the Guéchémé gauge station, and the endorheic configuration of the catchment area [58,59,60]. The CN was defined according to the land cover identified from the Copernicus dataset [61,62,63]: the watershed was almost completely covered by herbaceous vegetation (54%), sparse vegetation (24%), cropland (13%), and shrubs (8%). No discharge data were available for calibration. A validation was conducted based on the literature values of the runoff coefficient for the Sahelian area [64].
The determination of the FPA was carried out through a monodimensional hydraulic numerical model realized along 50 km of the Maouri Dallol floodplain [65]. The model was created with the Hydrologic Engineering Center—river analysis system (HEC-RAS) software [66] and was opportunely extended upstream and downstream to avoid anomalies related to boundary conditions. The hydraulic model was based on the composed 90 m and 10 m DEM morphology, the typical roughness of the vegetation present in the rainy season, and the discharge resulting from the hydrological analysis [67]. No surface water level observations were available for calibration. A validation of the flooded areas was conducted with the in-situ observations taken during the survey in July, 2018 and the ground-water levels of the piezometers of the study area.

2.4. Satellite-Based Settlement Dynamics

The third phase consisted of identifying the dynamics of the built-up area and the type of buildings (durable, non-durable) in the FPA and in the surrounding areas in 2009 and 2019 through high resolution satellite image analysis. This phase was developed in three main steps.
First, the opportunity of extracting single buildings through semi-automatic elaborations of high-resolution satellite images was verified, testing different typologies of classification algorithms. Images were acquired between 6 and 14 October, 2009 [68] and between 1 and 6 September, 2019 [69], as detailed in Table 2.
The images were subsequently pre-processed radiometrically (pansharpening [70] and radiometric calibration [71]) and geometrically (mosaicking and orthorectification [72]). The classification tests with pixel-based algorithms [73] (spectral angle mapper (SAM)), object-oriented algorithms [74] (image segmentation), and spectral indices (normalized difference built-up index (NDBI)/normalized difference vegetation index (NDVI)) [75] highlighted the difficulty in distinguishing, in a semi-automatic way, the roofs from the roads due to the very similar material used (respectively, earth and laterite) with overlapping radiometric responses.
Consequently, the second step consisted of photointerpretation by an image analyst. The inhabited areas of the riverbed were determined, and the buildings were subsequently digitalized in 2009 and 2019 through computer aided photo interpretation (CAPI). The use of a GIS (geographic information system) environment made it possible to generate a database containing not only the building geometries, but also the ancillary information, such as the material used for the roofs (straw, mud, and corrugated iron sheets, which constitute as many stages of the consolidation of constructions). The delimitation of the built-up areas took into account contiguous building lots (identifiable with walls or hedges) and non-contiguous building lots less than 50 m away from the contiguous area. Twelve settlements with significant building expansion in the FPA, and as many in the non-flood-prone areas (NFPA), making a total of 24, were selected as case studies. The settlements toponyms were extracted from the national repertoire of inhabited locations.
The third step superimposed the built-up area with the FPA according to three return period scenarios, allowing for an automatic multi-temporal analysis of the changes occurring between 2009 and 2019 in terms of the share of built-up area compared to the total area of each settlement and the share of buildings with roofs made from corrugated iron sheets compared to the total buildings of each settlement.
The lack of precise data for the calibration of the model was the main limitation of this FPA characterization: it ensured a precision that was higher than GIS flood hazard mapping [76] but lower than state-of-the-art hydraulic models [77]. The low accuracy achieved with standard semi-automatic building extraction methods from satellite images was also a limitation, but was bypassed by means of manual digitization.

3. Results

In the past, the Maouri Dallol was crossed by a stream that originated in Northern Niger and flowed into the Niger River 910 km downstream. Today, its regime is intermittent and its endorheic behavior feeds a wetland with an aquifer close to the surface [78]. Heavy rains flood the valley both due to surface flow and water table rise. In Guéchémé, the Dallol crosses one of the most densely populated zones of Niger. Of the 87 settlements identified in 2019, one is large (Angoual Chekaraou), six are medium, 21 are small, and 60 consist of a few houses (Table 3).

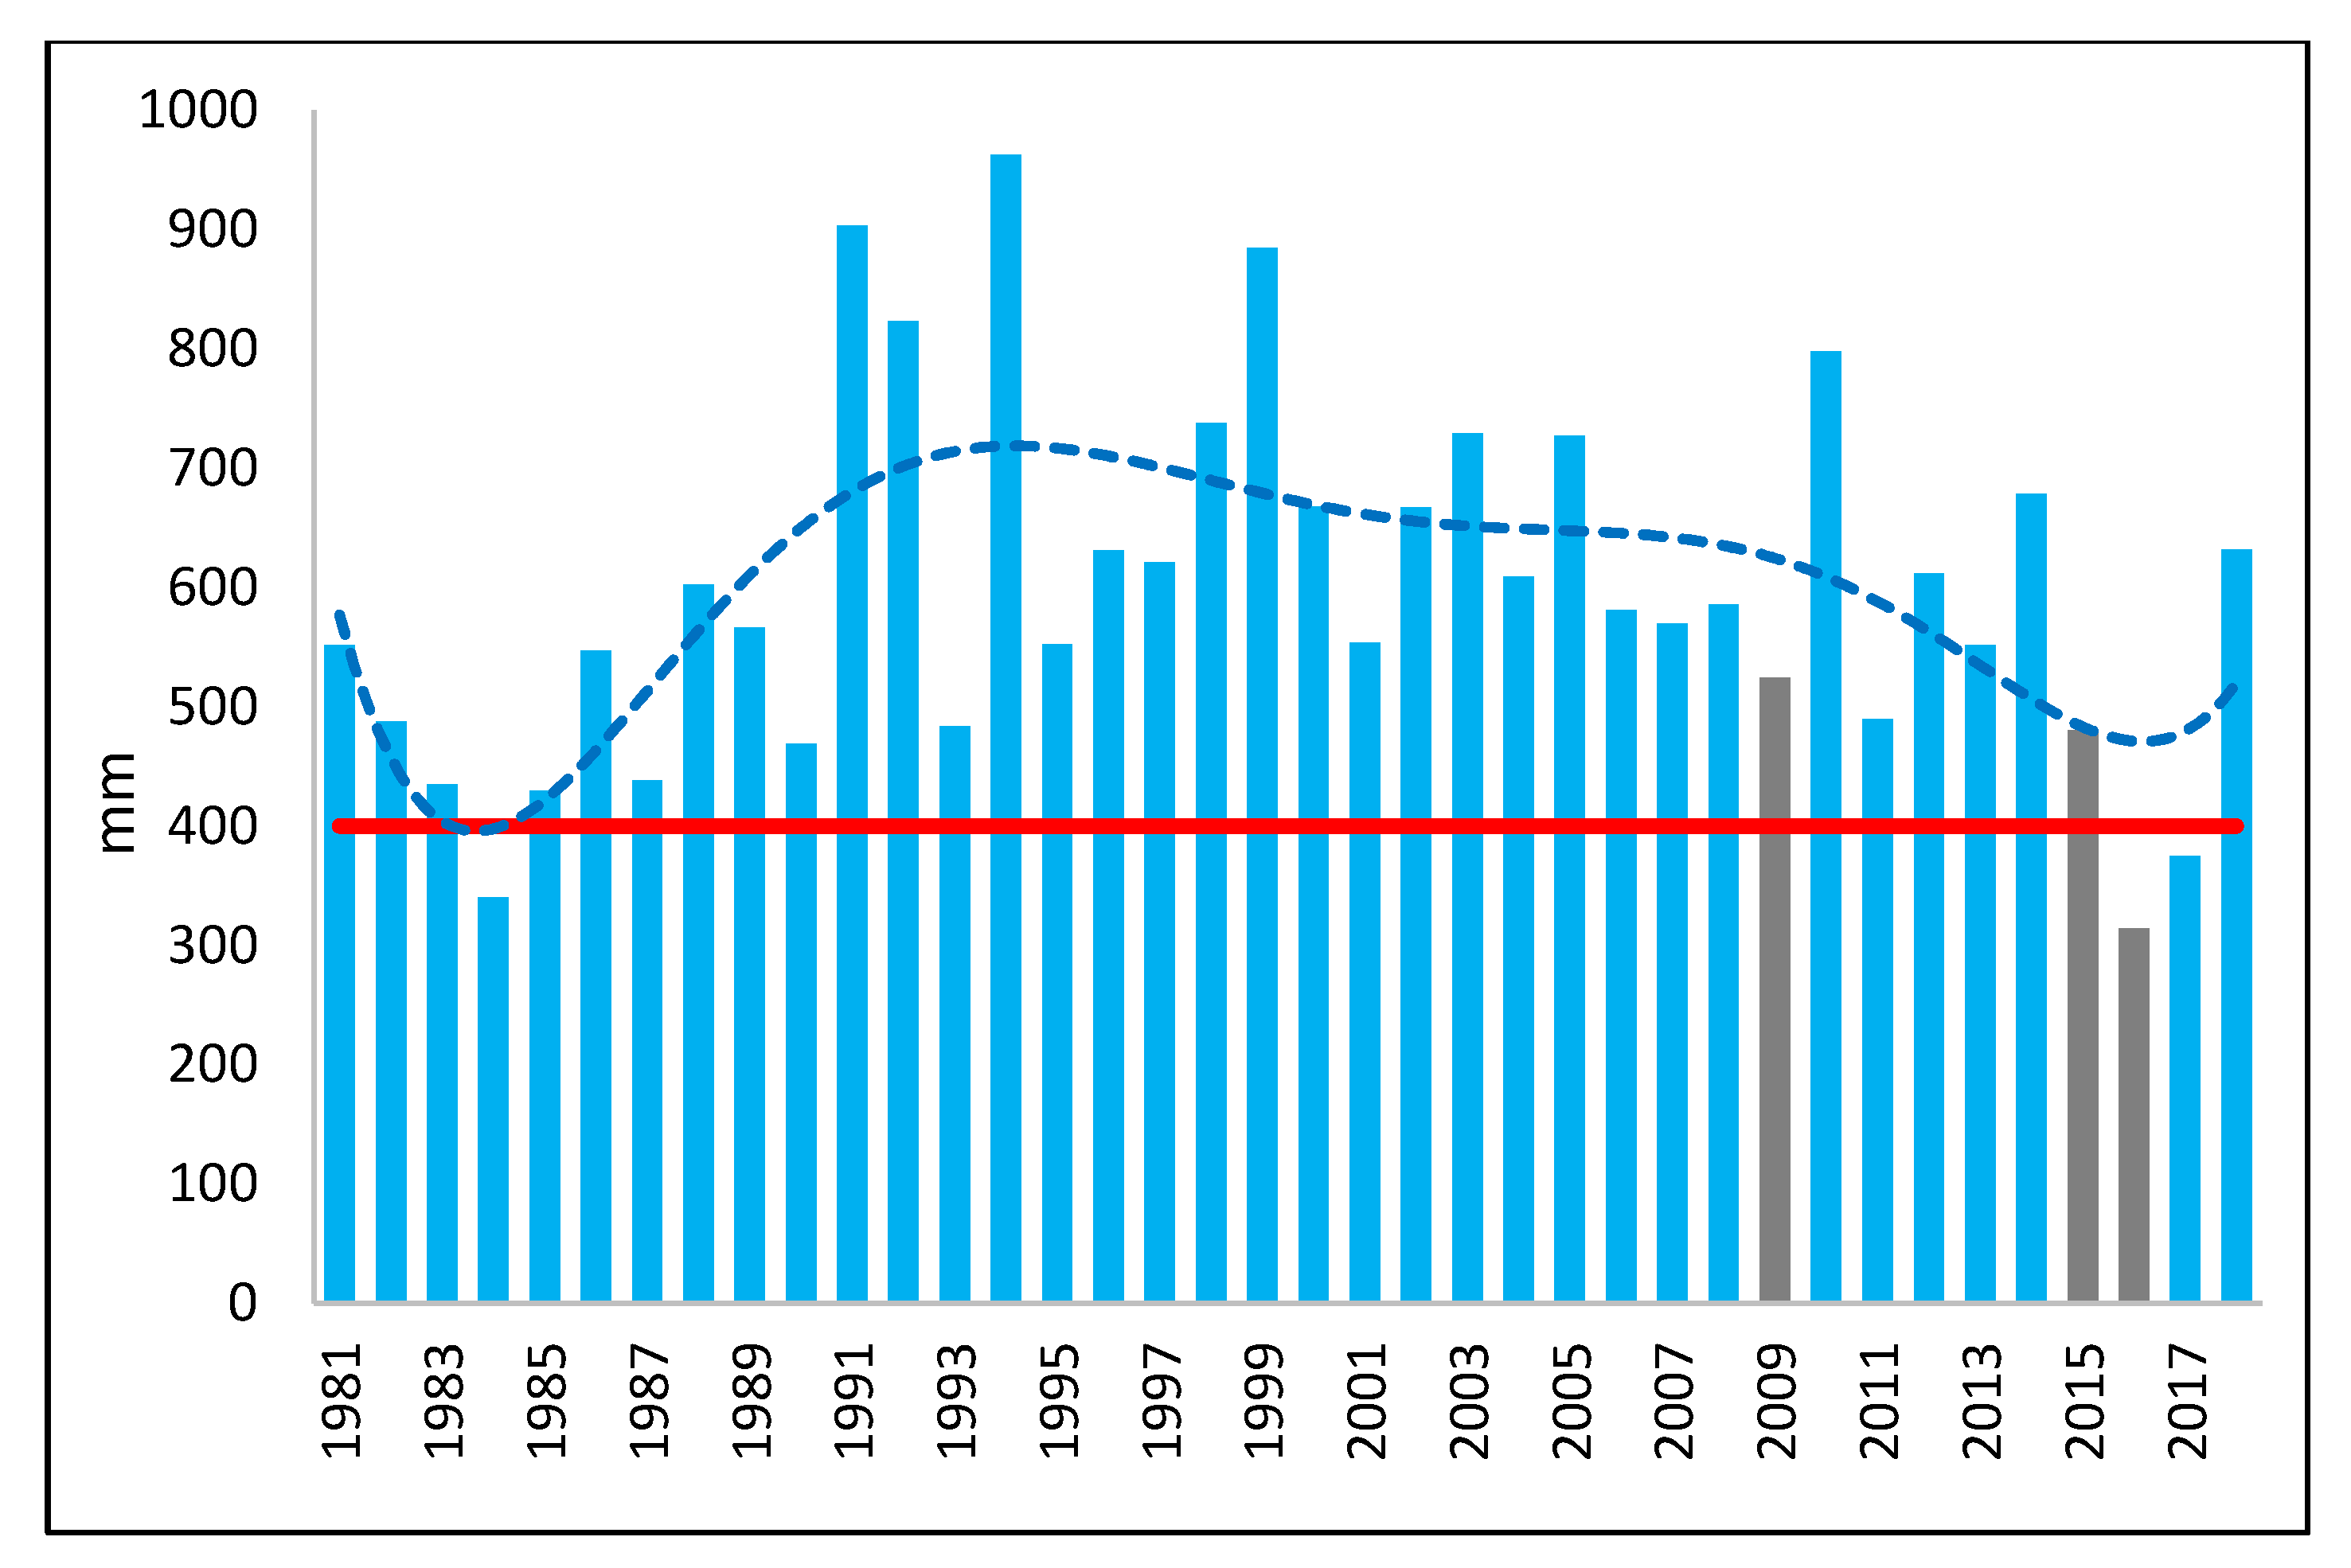
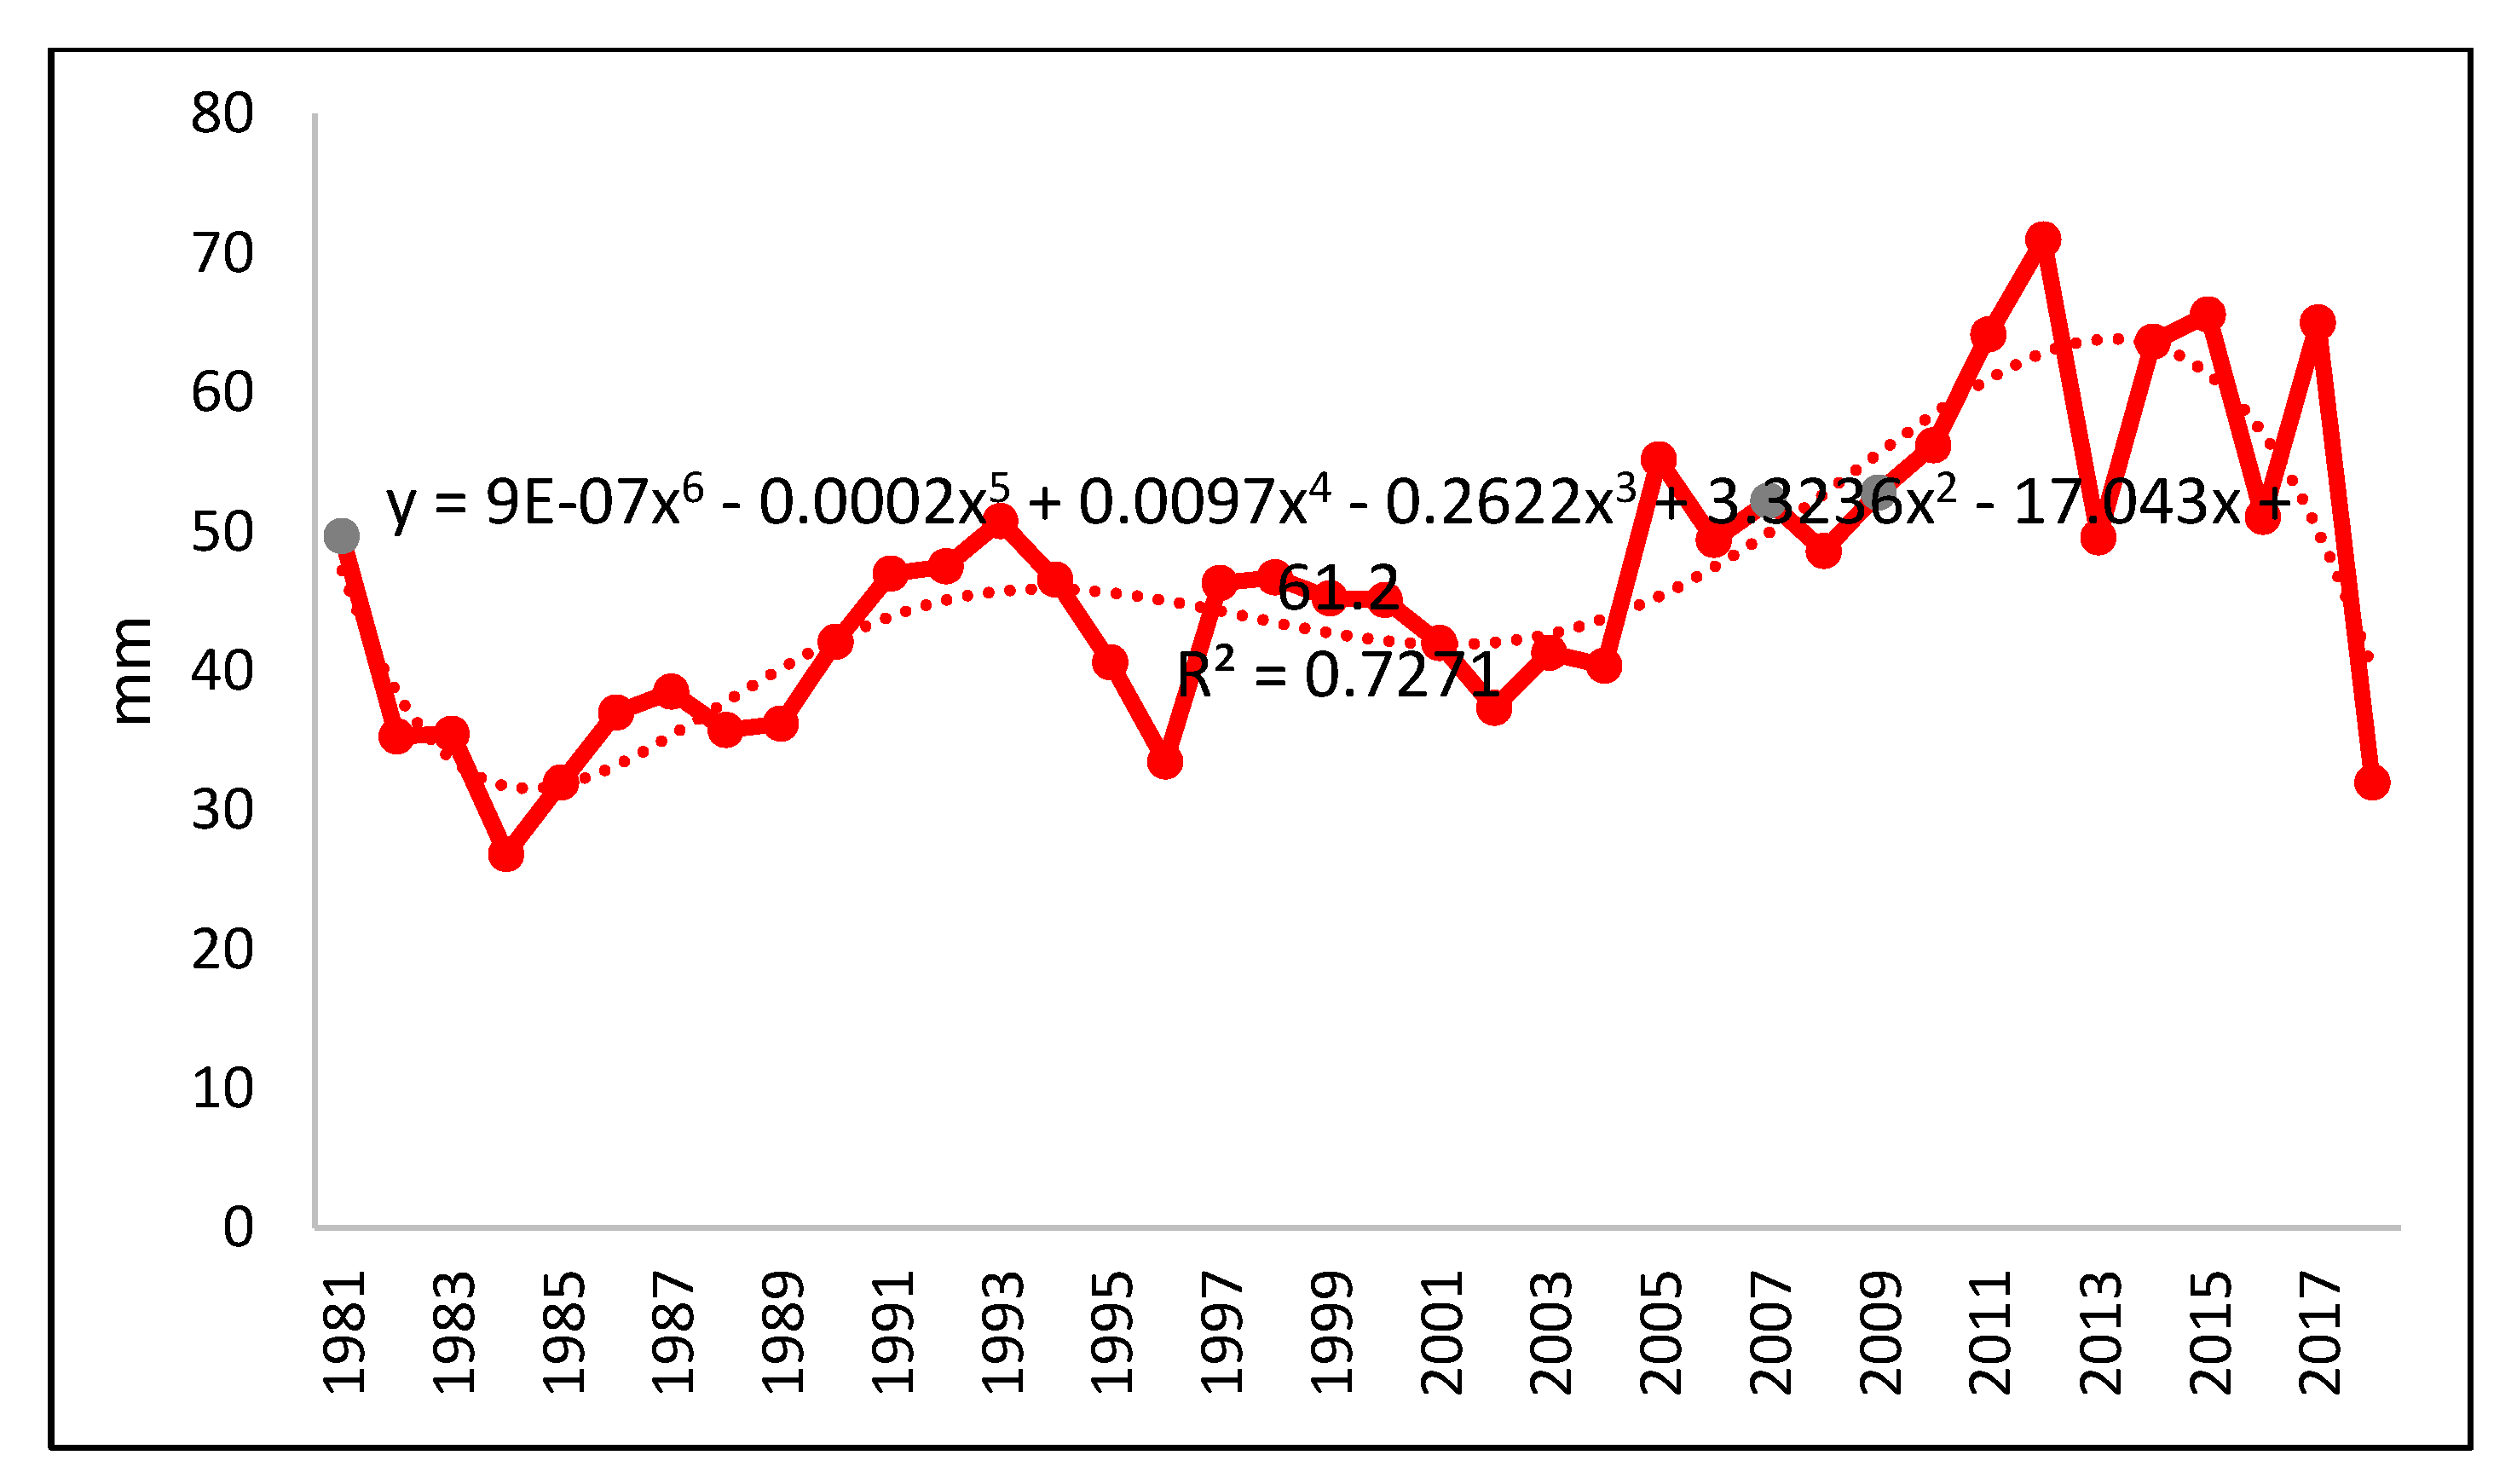
3.1. Climatic and Hydraulic Characterization

In the 1980s, Guéchémé had a dry period, followed by a wet decade and then an alternation of wet (with a declining trend) and dry years. The accumulated rainfall remained above 400 mm per year, a critical threshold for dry farming [79,80,81], except in the years 1984, 2016, and 2017 (Figure 3). One of the most significant changes in rainfall over the last forty years has been the increase in value (expressed in mm) of rainfall falling in the 95th percentile, or extreme rainfall. These precipitations increase from 40–50 mm/day (in the nineties) to today’s 60–70 mm/day (Figure 4).
The hydrologic analysis revealed the following results: (1) the concentration time of the Dallol Maouri watershed was 210 h (about 9 days), (2) the only PDF that passed the adequacy distribution tests was the log-normal one, and (3) the cumulated rainfall, based on the concentration time of 9 days for the computed return period (RP) ranged from 133 to 287 mm. The flood hydrographs, computed with the hydrological model, agreed with the hydrology of this endorheic area.
The FPA extended between 25 and 67 km2, depending on the flood scenario considered (Table 3). The FPA covered a considerable surface area due to the high transverse extent of the floodplain at Guéchémé (approximately 4 km), characterized by a considerable number of counter slopes. The NFPA surrounding the RP200 flood limit, considered as a reference to compare the settlement dynamics, extended over 68 km2 (Figure 5 and Figure 6).
The hydraulic model also enabled the determination of flow velocity and water depth, which could be valuable results for evaluating the effects on the assets concerned. The flow velocity was quite low due to the low longitudinal slope (0.04% = 40 cm/km) of the riverbed, with a maximum value of 0.85 m/s in the RP200 scenario. By contrast, the water depth was quite considerable, reaching a maximum value of 1.78 m in the RP200 scenario (Table 4).

3.2. Local Perception on Floods

The meetings with the local authorities and the community of Guéchémé identified heavy rainfall, the reduction of vegetation, and the degradation of the soil as drivers of the increased runoff. These, together with the water table rise, caused floods in the Maouri floodplain. These floods—particularly the memorable ones of 1994, 2012, 2015, and 2016—led to the collapse of many buildings. These events are substantially reflected in those listed in the BDINA database relating to the period 2007–2016. In 2012, 2015, and 2016, many collapsed buildings were reported, particularly in 2013 (Table 5). These events also caused extensive damages to cultures, but this aspect was not considered in this research.

3.3. Settlement Dynamics
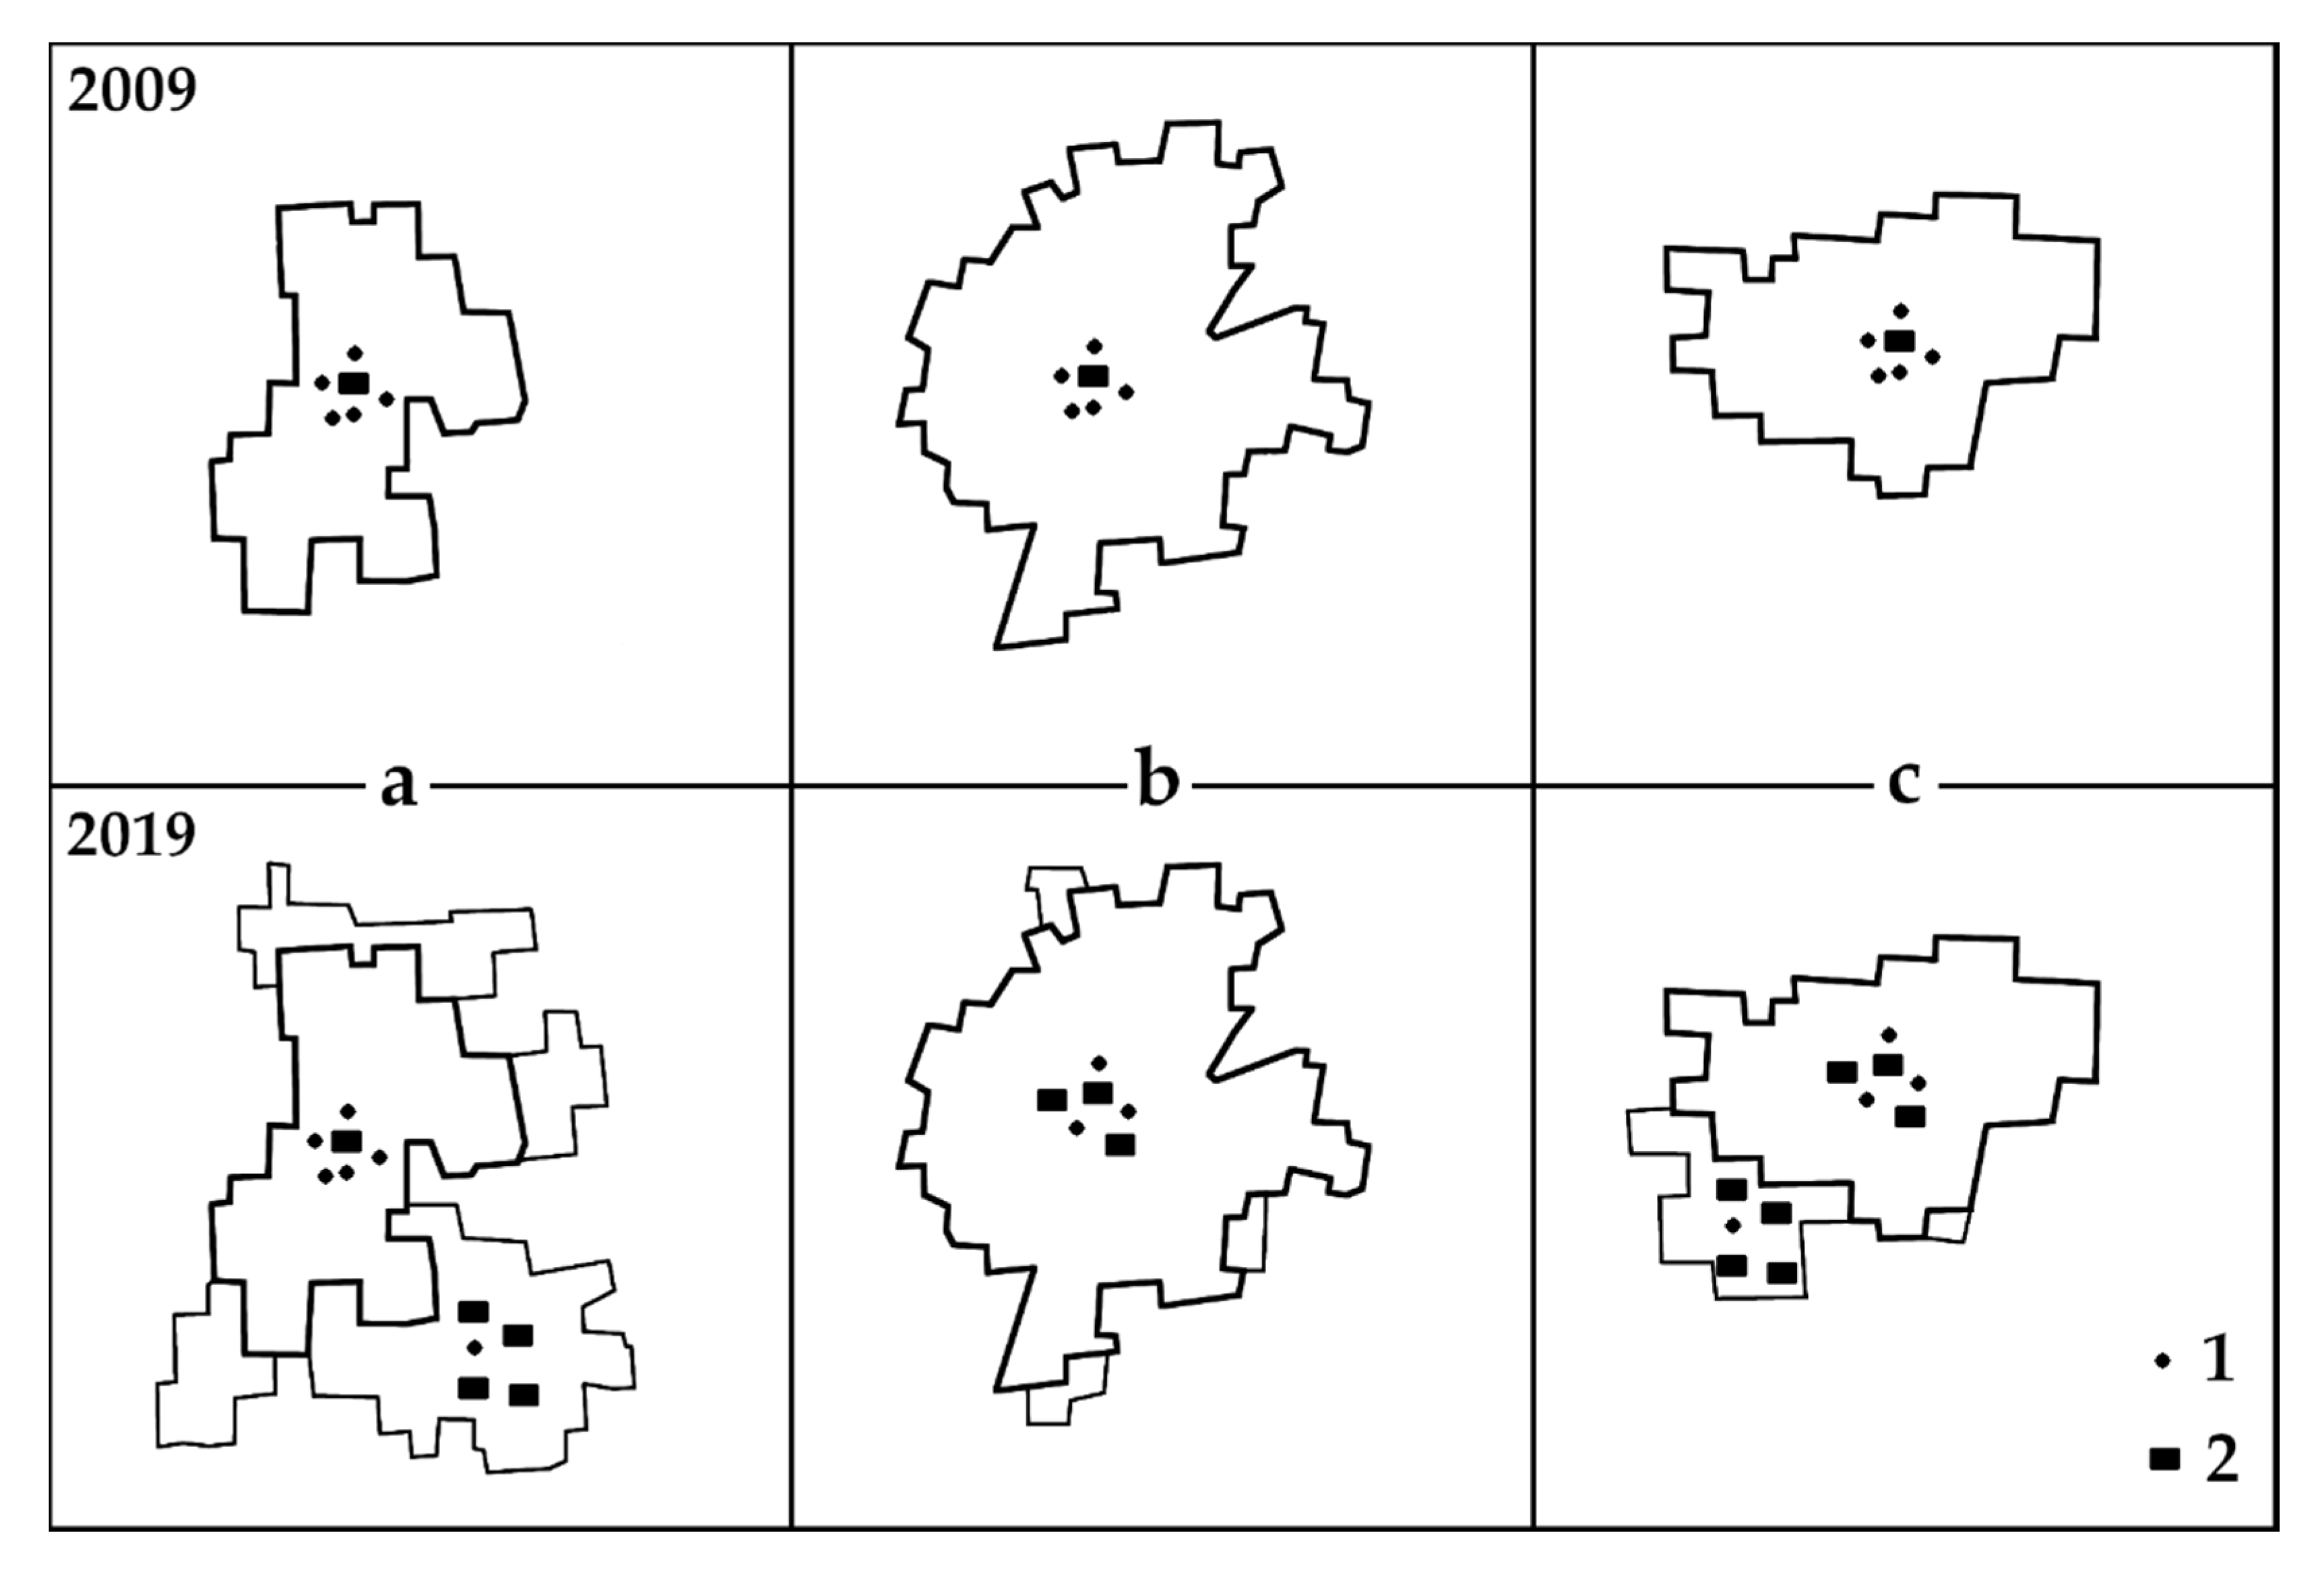
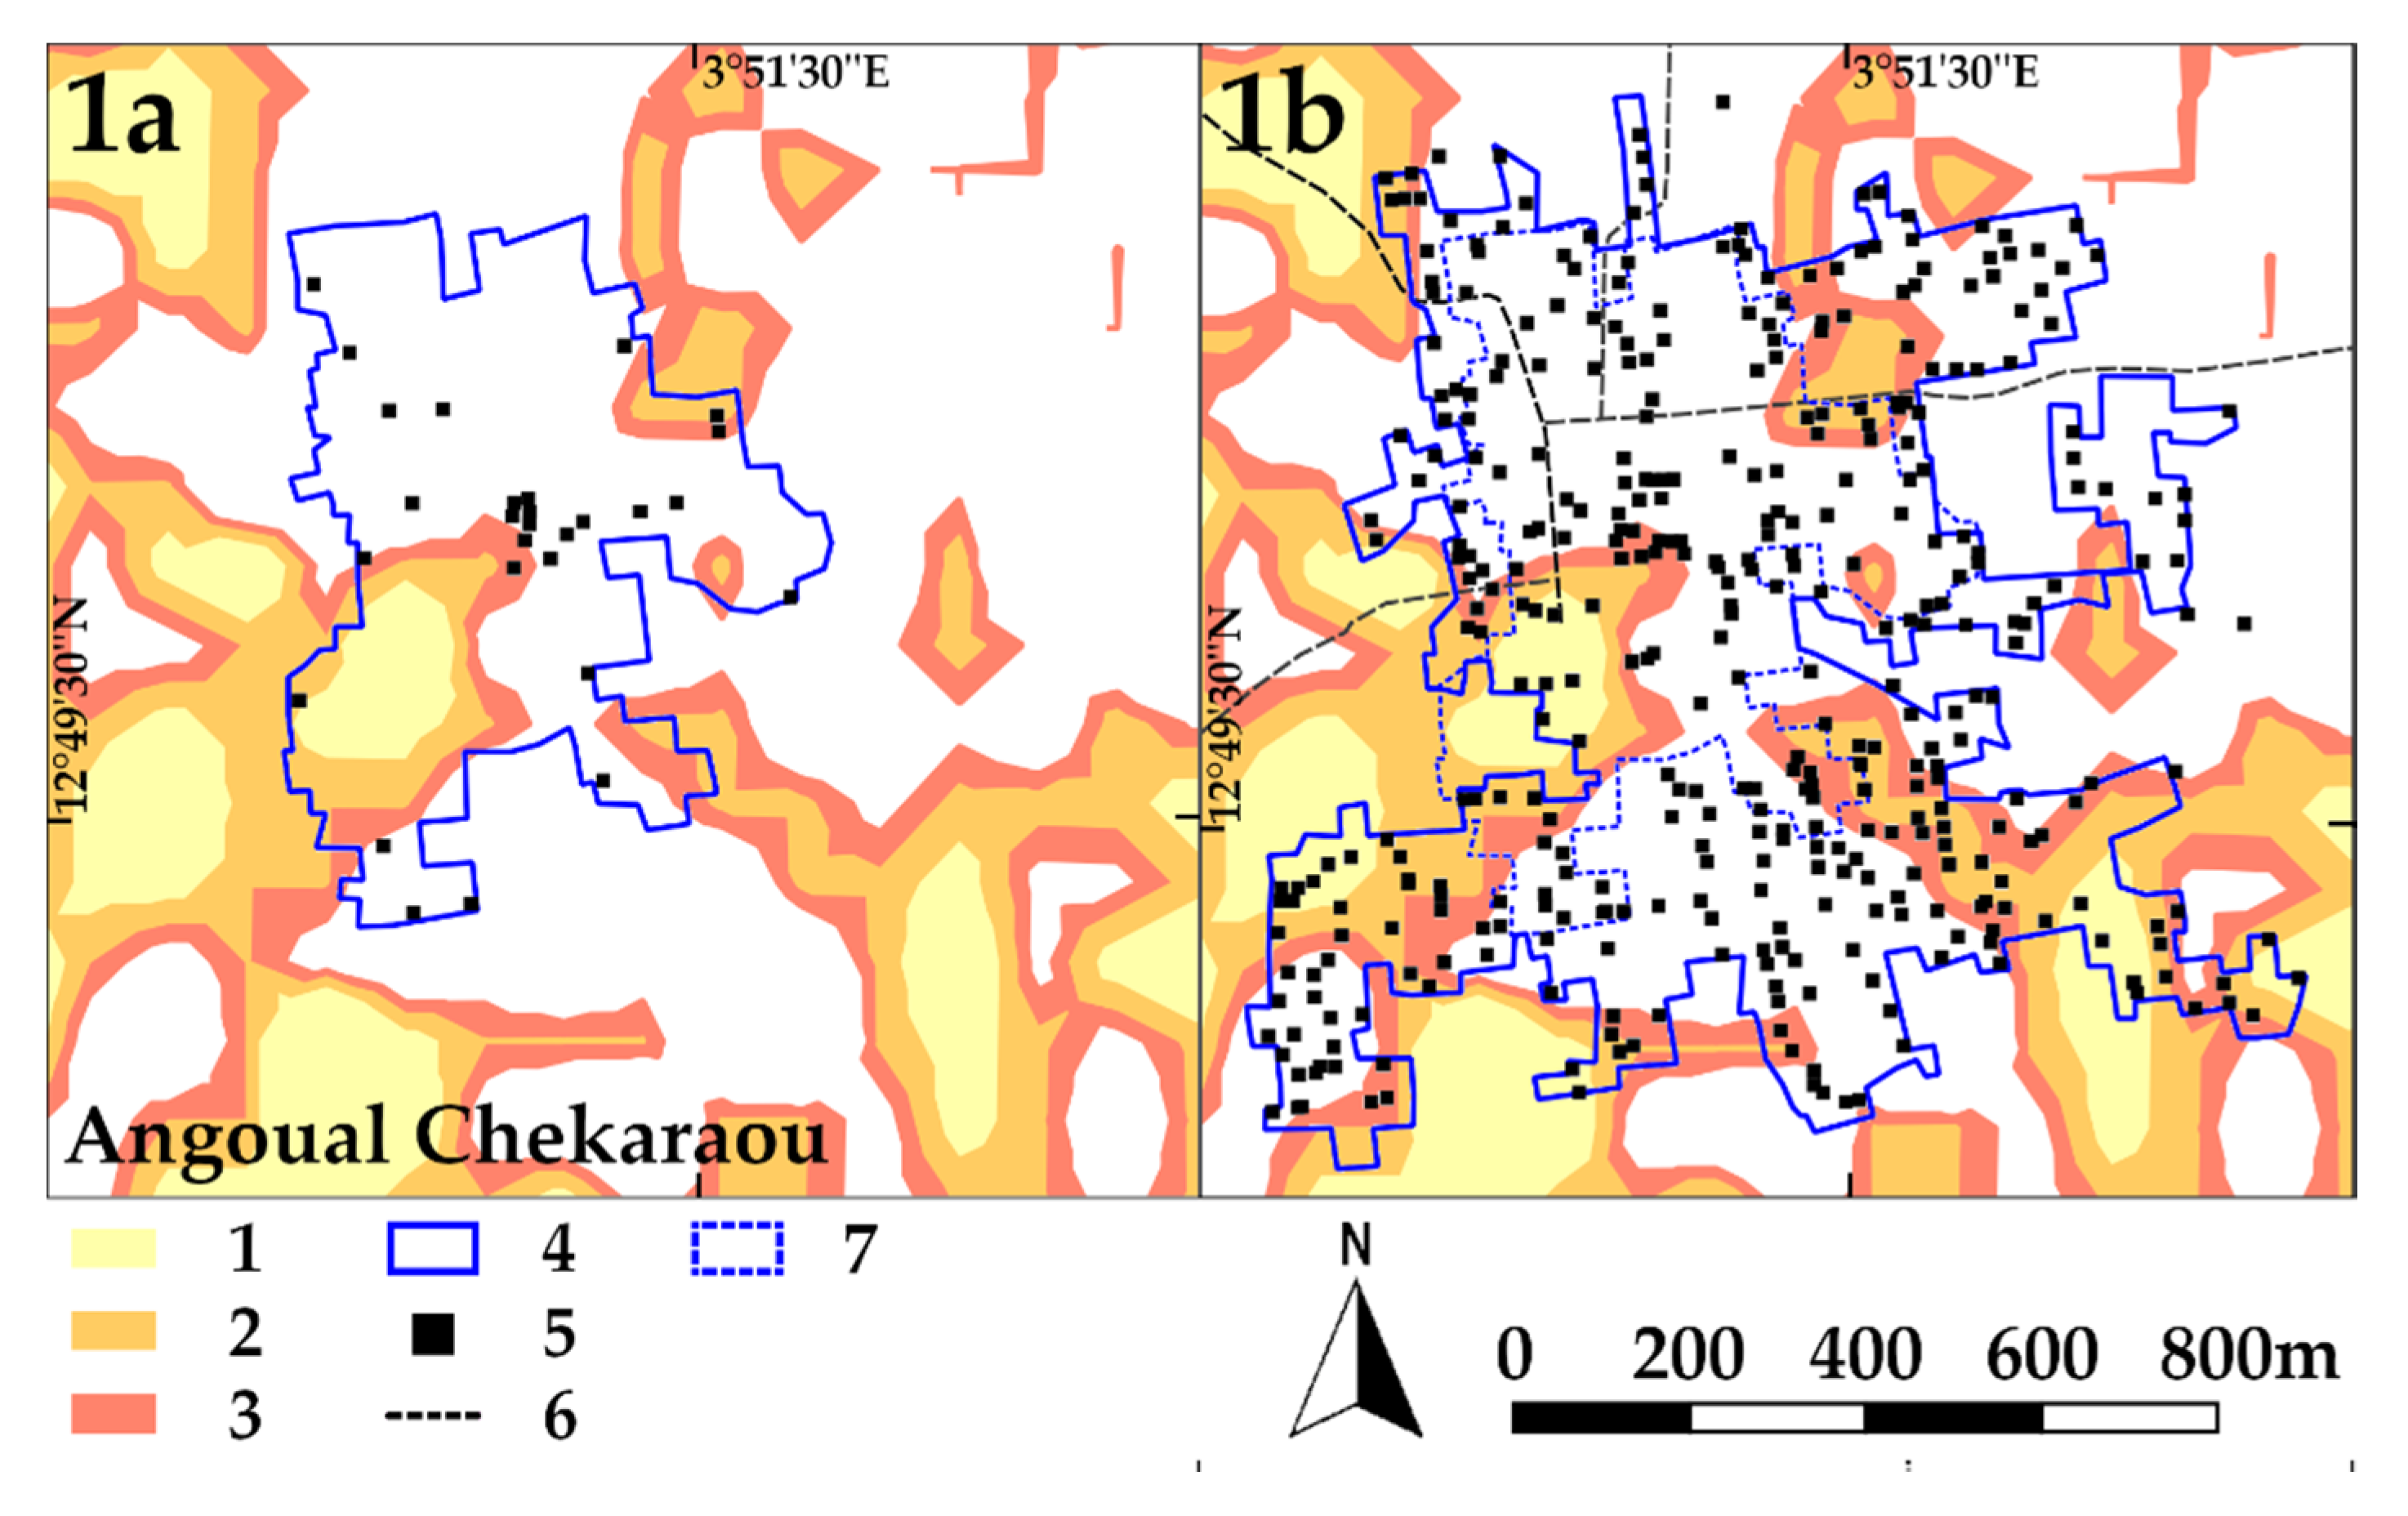
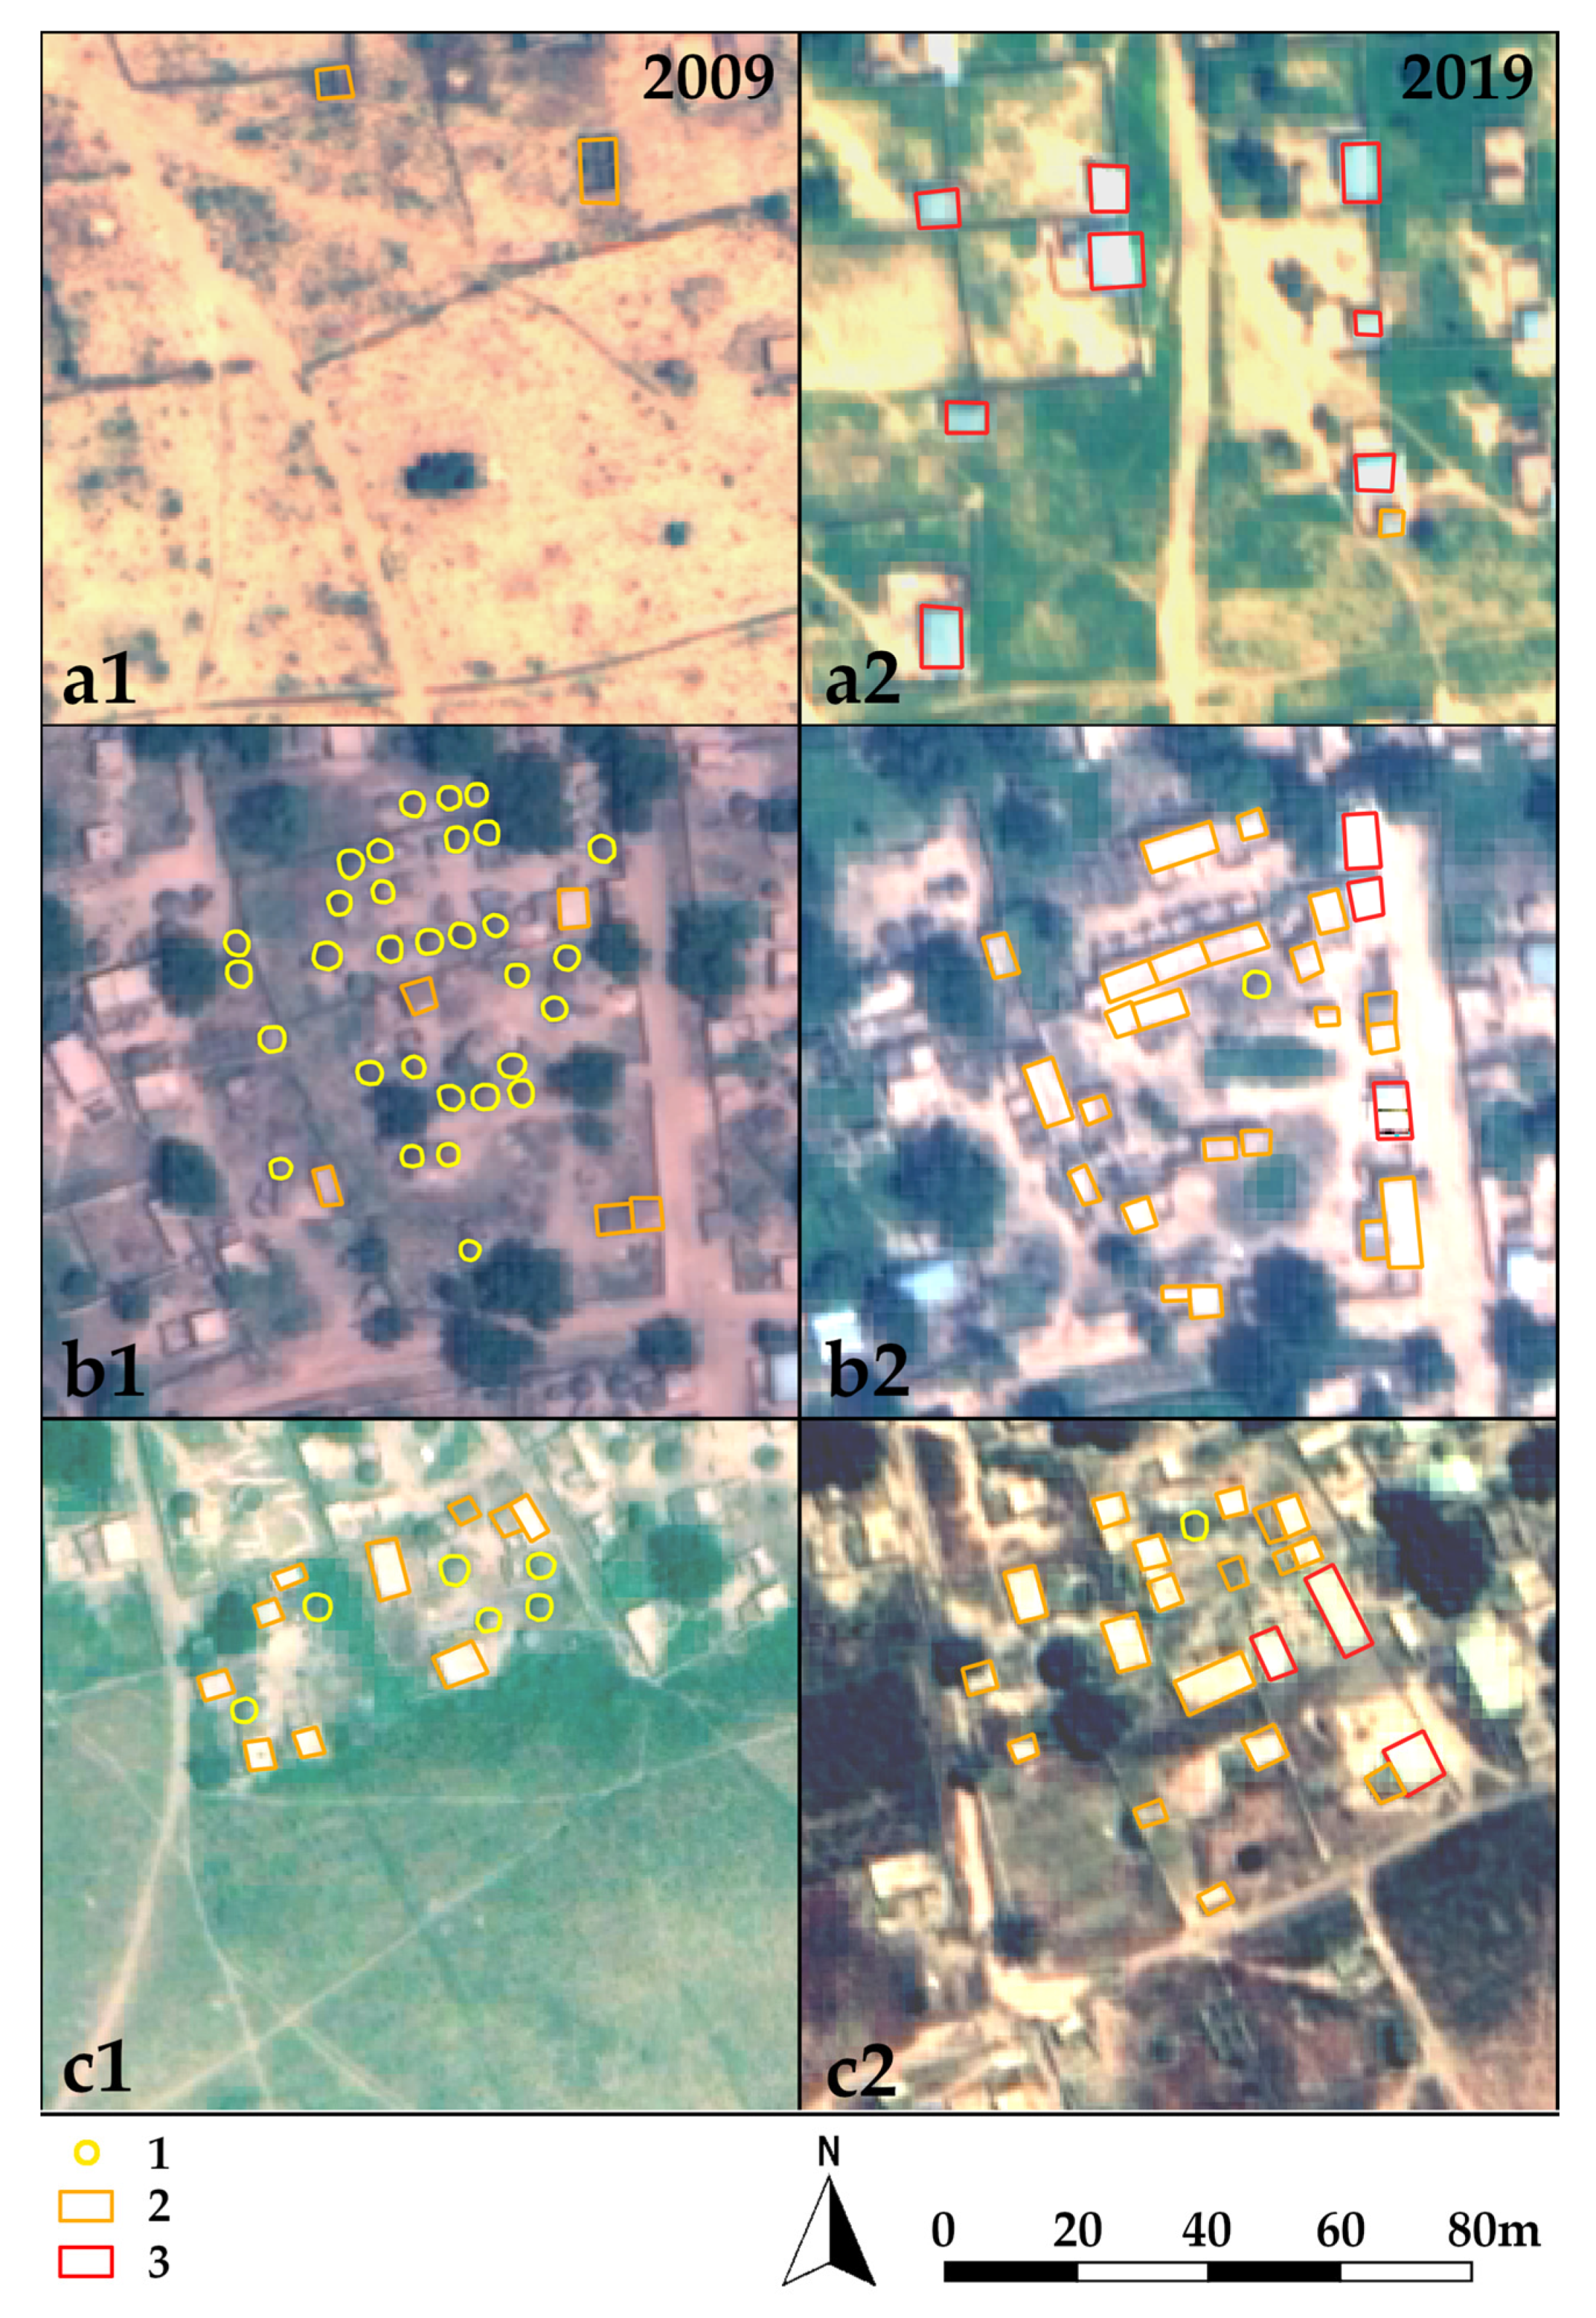
In ten years, the number of settlements in the study area has increased by 7%: 13% in the NFPA and stable in the FPA; in 2009, 45 settlements were in the NFPA and 36 partially or entirely in the RP200 FPA; ten years later, 51 settlements were in the NFPA and 36 settlements in the RP200 FPA (Table 6, Figure 7).
Of the 87 settlements present in 2019 in the study area, 24—split equally between the FPA and the NFPA—recorded an expansion in surface area greater than 25%. This sample, analyzed in-depth, revealed a 52% increase, particularly in the FPA (+71%) compared to the NFPA (+30%) of the built-up area. The number of buildings increased by 12% (0% in the NFPA and 21% in the FPA) (Table 7). The wide differences of increment between built-up area and buildings led to a decrease in building density (from 40.6 to 29.4 build/ha) as a result of a consolidation process through the installation of buildings with corrugated iron sheet roofs. Between 2009 and 2019, these buildings increased by 3% to 21%, without substantial differences between the FPA and the NFPA. The roofs made from corrugated iron sheets thus increased by 592% against a 10% increase in buildings. In some locations, corrugated iron sheets are now used in almost half of the buildings: an increase of 1400% in the decade considered (Table 8).
The exposure of buildings to flooding saw an increase of 29% (40% more than the total increase) in the area with a low probability of flooding RP200. At the same time, the exposure of buildings with corrugated iron sheet roofs increased by 695% in the same RP200 area, which was slightly more than the total increase (+609%). The consolidation of buildings was generally higher in the FPA than in the NFPA: the maximum consolidation occurred in the area with a high probability of flooding RP2 (+27%), followed by that with a low probability of flooding RP200 (+12%), and only lastly in the area with a medium probability of flooding RP20 (+9%) (Table 9).

3.4. Main Dynamics

In the Guéchémé Dallol, in the decade considered, three main settlement dynamics emerged (Table 10, Figure 8, Figure 9 and Figure 10):
  • Building expansion (a), expressed by a strong increase in the built-up area and/or the number of buildings. The expansion was low density and the buildings used corrugated iron sheets. Angoual Chekaraou was the most significant example, with an increase of 147% in surface area, 108% in buildings, and 1300% in corrugated iron sheet roofs. The expansion occurred above all in the FPA RP20.
  • Building consolidation (b), expressed by the replacement of precarious buildings with semi-permanent buildings (roofs made from corrugated iron sheets). This process reduced building density and sometimes the number of buildings. Lokoko testified to this process, with an increase of 400% in buildings with corrugated iron sheet roofs and a 23% reduction in building density.
  • Expansion and building consolidation (c), expressed by an increase in the built-up area (sometimes with already semi-permanent constructions) and a building replacement of the existing fabric. Toullou, for example, increased its surface area (+35%) and replaced straw roofs (−60%) with those made from corrugated iron sheets (+350%). By virtue of building consolidation, the percentage of buildings in the FPA was unchanged.
A summary of the settlements data is reported in Table 11 (further information is available in the Supplementary Material).

4. Discussion

In three-quarters of the countries South of the Sahara, the rural population today is still in the majority and strongly increasing [9,18,82]. In these countries, the primary sector remains strategic for development and for reducing poverty [20]. This suggests the refocusing of attention from the urban sector [15,26,36] to the rural sector. Sustainable rural development involves protecting settlements from increasingly frequent flooding. Ascertaining if and how far rural settlements are occupying the FPA [3,4,7] should be a preliminary step for identifying appropriate protection and prevention measures: an aspect still investigated little by peer-reviewed literature [83].
The objective of this study was to verify the recent changes occurring in the settlements and housing stock in one of these areas: the Maouri Dallol in the municipality of Guéchémé, Niger. The quantitative analysis of the settlement dynamics between 2009 and 2019 made it possible to achieve this aim thanks to the availability of multi-temporal satellite images. The municipality’s valley receives, on average, 595 mm of rainfall per year, slightly more than the regional average of the Dosso region [43,44]: a favorable condition for rain crops in a semi-arid zone, such as the Niger Sahel [79]. However, in the last twenty years, extreme rainfall (95th percentile) has increased by about 20 mm of intensity [6]. The effect of these rains on degraded soil increases the runoff and leads to the greater flooding of the Maouri Dallol. Over the last ten years in the Dallol, settlements have increased in number (+7%) and size.
The first question to be answered in this study was if, in a rural context in demographic growth, the exposure of settlements to flooding had increased: an aspect recognized by literature [2,42,64,84] but rarely quantified [34,35]. It has been ascertained that in the last decade, in the Guéchémé Maouri Dallol, the expansion of the 24 observed settlements occurred for 71% in the FPA and 30% in the NPFA. Therefore, the exposure strongly increased due to human activity.
The second question to be answered concerned the flood resistance of buildings constructed in the last decade in terms of building consolidation. In the Maouri Dallol between 2009 and 2019, there was a marked consolidation of buildings expressed by the transition from mud roofs to those made from corrugated iron sheets (from 3% to 21% in just 10 years), without distinction between the FPA and the NFPA. This process is decreasing the building density of all the analyzed settlements. The consolidation in the FPA sees an average of +720%, with peaks of up to +3500% in the area with a medium probability of flooding (RP20) in Angoual Chekaraou. This consolidation protects homes from the impact of heavy rainfall on the roof, but not from the runoff and the water table rise. Even though the low flood velocities observed do not represent a decisive factor in terms of the potential damage caused by floods, the considerable flood depths (up to nearly 2 m) pose a real threat to buildings: if water enters homes with mud walls, they are guaranteed to collapse. This demonstrates that the collapse of buildings occurs only because they are built from precarious materials and that concrete materials should be used for the full height of buildings to ensure flood protection.
Many similar studies on floodplain settlement dynamics agree on the process of settlement expansion in flood-prone areas, both in African contexts [85] and in other regions of the world [12], but a peculiar characteristic of the Maouri Dallol is a decreased building density of the settlements compared to other contexts [86]. The consolidation of buildings and its implications on flood exposure is still poorly explored in the Sahel. However, in a broader context, the water effects on buildings after a flood event is fairly recognized [39,41].
One of the interpretative hypotheses of the two observed phenomena is that in the context of a growing population in a rural area and the consequent increased need to put more and more land into cultivation, the new nuclei need to settle close to the fields (and water) during the agricultural season, despite the occurrence of flooding [8]. The consolidation of residences with corrugated iron sheet roofs is undoubtedly an improvement to which everyone aspires as soon as their economic conditions allow it. However, in the event of flooding, the invested capital is also at risk of being lost. The meetings with the local authorities and with the community of Guéchémé highlighted the clear local perception of rainfall changes and the degradation of the soil, but not the increase in the extent of the FPA due to the ever more frequent extreme events. These areas, which are today estimated to be low in flooding probability, may become likely to be flooded if the processes of erosion and soil degradation continue in the future. Precisely for this reason, knowing the FPA according to different rainfall intensities and the settlement dynamics in place within them becomes important for deciding upon the measures to be adopted in the municipal development plan, particularly if extreme events grow in intensity and the population exposed to them increases [23]. The seasonality and high variability of surface flows in the Maouri Dallol may be one of the factors that determines a lack of adaptive responses by the local population compared to watercourses with a more regular regime, as observed in the Sirba River watershed in Niger [65].
The urgency to act is also dictated by the speed (just a decade for the discussed case study) and extent to which the expansion and consolidation of inhabited areas in the FPA have occurred. The municipal development plan could include flood risk prevention (information on at-risk areas, resettlement of exposed inhabitants, or protection of inhabited areas). The three main dynamics among the settlements of the Guéchémé Dallol facilitate the identification of specific measures to reduce the flooding risk. Delocalization or retrofitting of the individual buildings with entry barriers and raised basements is recommended for settlements that spread in low density in the FPA, while the construction of embankments and dikes to protect against runoff water is more suitable for settlements that are still dense [87].
Among the results of this study, the role of satellite remote sensing, fundamental for multi-temporal analysis (in the absence of other reliable reference data: e.g., cadastral data), is highlighted, thanks to the now well-established availability of historical archives (starting from around the year 2000) of high-resolution satellite images. On the other hand, low thematic accuracy has been obtained in the application of semi-automatic standard classification algorithms for extracting building footprints from high-resolution satellite images. These accuracies are undoubtedly affected by the geographical context, characterized by the presence of numerous buildings with mud-covered roofs (or temporarily used for forage conservation) and unpaved roads, both having similar radiometric responses and, therefore, difficult to isolate. Conversely, more promising results are observed for corrugated iron sheet roofs, which can easily be isolated. These results led to an approach based on photointerpretation and manual digitization in a GIS environment. In order to increase the level of the automation of this phase of the methodology, the use of image segmentation techniques based on deep learning algorithms is considered extremely promising [88], also by exploiting the better spectral resolution of recent satellite sensors.
The main limit of the analysis is the accuracy of the perimeter of the FPA. This is affected by the lack of detailed information on both soil morphology and hydrology. In particular: (1) the low planimetric resolution and vertical accuracy of the DEM; (2) the lack of surface flow measurements; and (3) the lack of surface flow measurements makes the determination of the FPA inaccurate. For point (1), the use of high-resolution satellite stereoscopic pairs, which facilitate the extraction of DEM with planimetric resolutions and vertical accuracy in the order of a few meters, is considered promising. For points (2) and (3), it is hoped that this initial characterization of the FPA of the Maouri Dallol floodplain will increase the authorities’ awareness of the importance of investing time and resources both in field observations and in flood protection measures in this area.

5. Conclusions

In recent years, the rural Sahel has been struck by catastrophic floods, which have slowed down the already stunted development process. Until now, the literature has explained these catastrophes by studying climate changes and variations as well as alterations of land cover. Knowledge of floodplain settlement dynamics has not advanced in parallel, especially in rural contexts. This study focuses on a 135 km2 rural area in Niger, with a high population growth and flood risk, during the decade 2009–2019. The settlement dynamics were ascertained through the photointerpretation of multi-temporal high-resolution satellite images and superimposed on the flood boundaries according to three return period scenarios (2, 20, and 200 years).
A significant increase in the intensity of heavy rainfall in the 95th percentile over the last 20 years (+20 mm/day) and four catastrophic floods during the last decade was observed. However, the settlements increased by extension (+52%) and 70% of this expansion occurred in areas with a medium and high probability of flooding. The number of buildings also increased by 21% in the same areas. Many buildings (+592%) were consolidated by installing corrugated iron sheet roofs in place of traditional mud roofs, which could be a proxy indicator of improved economic prosperity. This consolidation process was more intense in areas with a high probability of flooding (up to +800%). However, this improvement is not sufficient to cope with rain-induced floods, as the runoff water can make the walls of the buildings, which are still built from mud, collapse. Therefore, the investment to improve the roof increases the exposed capital but reduces the exposure to damage caused by floods to a limited extent in a context where the hazard has increased.
The significance of these results should draw the attention of the local authorities, who need to identify and implement prevention and preparation measures in the local development plans. The better knowledge and awareness of flood-prone areas and of how settlements develop around them will help the authorities to protect people and assets from natural hazards and facilitate economic development.
Historical satellite images enabled the extraction of detailed building information at the beginning and end of the study period, but the traditional methods of semi-automatic extraction of individual buildings from high resolution satellite images did not produce adequate results in this geographical context. On the other hand, the hydraulic model developed in this study was able to delimit the floodplain settlement dynamics with sufficient accuracy for local planning with respect to the methods currently applied in the Sahel, such as the creation of a buffer around the rivers and the overlay of images of historical floods over low resolution satellite images on the ground. This type of analysis can be replicated in other rural contexts with high population density, allowing local administrations to identify and localize flood prevention and preparation actions.
Finally, the relevance of a multi-disciplinary research group, which allowed for the synergistic integration of spatial planning, hydraulics, and satellite remote sensing skills to extract value-added information in support of decision-making processes, should be underlined.

Supplementary Materials

The following are available online at https://www.mdpi.com/2071-1050/12/14/5632/s1, Table S1: Twentyfour settlement dynamics in the Maouri dallol at Guéchémé, Niger (2009–2019).

Author Contributions

Conceptualization, A.G.; methodology, A.G., G.M., and F.G.T.; software, G.M., F.G.T.; validation, A.G.; writing—original draft preparation, A.G.; writing—review and editing, A.G., G.M., and F.G.T.; All authors have read and agreed to the published version of the manuscript.

Funding

This research was funded by DIST-Politecnico and University of Turin, Italy within the ANADIA 2.0 project.

Acknowledgments

The authors would like to thank the Italian Agency for Development Cooperation for cofounding the ANADIA 2.0 project that allowed for the development of this study, Katiellou Gaptia Lawan (Directorate National for Meteorology of Niger-DMN), Aliou Tankari (Ministry of Agriculture and Livestock of Niger-MAE), and Maurizio Tiepolo (DIST-Politecnico and University of Turin) for sharing the results of meetings with the Guéchémé municipality with the authors, the Guéchémé community, and for providing new satellite imagery of the area, and Maurizio Tiepolo for his help during the preparation of this article.

Conflicts of Interest

The authors declare no conflict of interest. The funders had no role in the design of the study; in the collection, analyses, or interpretation of data; in the writing of the manuscript, or in the decision to publish the results.

References

  1. Amogu, O.; Descroix, L.; Yéro, K.S.; Le Breton, E.; Mamadou, I.; Ali, A.; Vischel, T.; Bader, J.C.; Moussa, I.B.; Gautier, E.; et al. Increasing River Flows in the Sahel? Water 2010, 2, 170–199. [Google Scholar] [CrossRef] [Green Version]
  2. Tschakert, P.; Sagoe, R.; Ofori-Darko, G.; Codjoe, S.N.A. Floods in the Sahel: An analysis of anomalies, memory, and anticipatory learning. Climatic Change 2010, 103, 471–502. [Google Scholar] [CrossRef]
  3. The Emergency Events Database, EM-DAT. Available online: http://www.emdat.be/emdat_db/ (accessed on 17 April 2020).
  4. Fiorillo, E.; Crisci, A.; Issa, H.; Maracchi, G.; Morabito, M.; Tarchiani, V. Recent Changes of Floods and Related Impacts in Niger Based on the ANADIA Niger Flood Database. Climate 2018, 6, 59. [Google Scholar] [CrossRef] [Green Version]
  5. Tamagnone, P.; Massazza, G.; Pezzoli, A.; Rosso, M. Hydrology of the Sirba River: Updating and Analysis of Discharge Time Series. Water 2019, 11, 156. [Google Scholar] [CrossRef] [Green Version]
  6. Taylor, C.; Belušić, D.; Guichard, F.; Parker, D.J.; Vischel, T.; Bock, O.; Harris, P.P.; Janicot, S.; Klein, C.; Panthou, G. Frequency of extreme Sahelian storms tripled since 1982 in satellite observations. Nature 2017, 544, 475–478. [Google Scholar] [CrossRef] [PubMed] [Green Version]
  7. Aich, V.; Liersch, S.; Vetter, T.; Andersson, J.C.M.; Müller, E.N.; Hattermann, F.F. Climate or Land Use?—Attribution of Changes in River Flooding in the Sahel Zone. Water 2015, 7, 2796–2820. [Google Scholar] [CrossRef]
  8. Wilcox, C. Evaluating Hydrological Changes in Semi-Arid West Africa: Detection of Past Trends in Extremes and Framework for Modeling the Future. Ph.D. Thesis, Docteur de la Communauté Université Grenoble Alpes, Grenoble, France, 1 July 2019. [Google Scholar]
  9. Onywere, S.M.; Getenga, Z.M.; Mwakalila, S.S.; Twesigye, C.K. Assessing the Challenge of Settlement in Budalangi and Yala Swamp Area in Western Kenya Using Landsat Satellite Imagery. Open Environ. Eng. J. 2011, 4, 97–104. [Google Scholar] [CrossRef] [Green Version]
  10. Descroix, L.; Guichard, F.; Manuela, G.; Lambert, L.; Panthou, G.; Mahe, G.; Gal, L.; Dardel, C.; Quantin, G.; Kergoat, L.; et al. Evolution of Surface Hydrology in the Sahelo-Sudanian Strip: An Updated Review. Water 2018, 10, 748. [Google Scholar] [CrossRef] [Green Version]
  11. Praskievicz, S.; Chang, H. A review of hydrological modelling of basin-scale climate change and urban development impacts. Prog. Phys. Geogr. Earth and Environ. 2009, 33, 650–671. [Google Scholar] [CrossRef]
  12. Früh-Müller, A.; Wegmann, M.; Koellner, T. Erratum to: Flood exposure and settlement expansion since pre-industrial times in 1850 until 2011 in north Bavaria, Germany. Reg. Environ. Chang. 2014, 15, 183–193. [Google Scholar] [CrossRef] [Green Version]
  13. Huong, H.T.L.; Pathirana, A. Urbanization and climate change impacts on future urban flooding in Can Tho City, Vietnam. Hydrol. Earth Syst. Sci. Discussions 2011, 8, 10781–10824. [Google Scholar] [CrossRef]
  14. Mbow, C.; Diop, A.; Diaw, A.T.; Niang, C.I. Urban sprawl development and flooding at Yeumbeul suburb (Dakar-Senegal). Afr. J. Environ. Sci. Technol. 2008, 2, 75–88. [Google Scholar]
  15. IPCC. Global Warming of 1.5 °C. An IPCC Special Report on the Impacts of Global Warming of 1.5 °C above Pre-Industrial Levels and Related Global Greenhouse Gas Emission Pathways, in the Context of Strengthening the Global Response to the Threat of Climate Change, Sustainable Development, and Efforts to Eradicate Poverty; Masson-Delmotte, V., Zhai, P., Pörtner, H.-O., Roberts, D., Skea, J., Shukla, P.R., Pirani, A., Moufouma-Okia, W., Péan, C., Pidcock, R., et al., Eds.; IPCC: Geneva, Switzerland, 2018. (in press) [Google Scholar]
  16. Adelekan, I.O. Vulnerability of poor urban coastal communities to flooding in Lagos, Nigeria. Environ. Urban. 2010, 22, 433–450. [Google Scholar] [CrossRef] [Green Version]
  17. Tamagnone, P.; Comino, E.; Rosso, M. Rainwater harvesting techniques as an adaptation strategy for flood mitigation. J. Hydrol. 2020, 586, 124880. [Google Scholar] [CrossRef]
  18. UNDESA-United Nations Department of Economic and Social Affairs. World Urbanization Prospects. The 2018 Revision; United Nations: New York, NY, USA, 2018; p. 128. [Google Scholar]
  19. Jidauna, G.G.; Dabi, D.D.; Dia, R.Z. The effect of climate change on agricultural activities in selected settlements in the Sudano-Sahelian Region of Nigeria. Archi. Appl. Sci. Res. 2011, 3, 154–165. [Google Scholar]
  20. Tiepolo, M.; Braccio, S. Mainstreaming disaster risk reduction into local development plans for rural tropical Africa: A systematic assessment. Sustainability 2020, 12, 2196. [Google Scholar] [CrossRef] [Green Version]
  21. Thompson, H.E.; Berrang-Ford, L.; Ford, J.D. Climate change and food security in Sub-Saharan Africa: A systematic literature review. Sustainability 2010, 2, 2719–2733. [Google Scholar] [CrossRef] [Green Version]
  22. Connolly-Boutin, L.; Smit, B. Climate change, food security, and livelihoods in sub-Saharan Africa. Reg. Environ. Chang. 2016, 16, 385–399. [Google Scholar] [CrossRef] [Green Version]
  23. Tiepolo, M.; Rosso, M.; Massazza, G.; Belcore, E.; Issa, S.; Braccio, S. Flood Assessment for Risk-Informed Planning along the Sirba River, Niger. Sustainability 2019, 11, 4003. [Google Scholar] [CrossRef] [Green Version]
  24. Taubenböck, H.; Wurm, M.; Netzband, M.; Zwenzner, H.; Roth, A.; Rahman, A.; Dech, S. Flood risks in urbanized areas—Multi-sensoral approaches using remotely sensed data for risk assessment. Nat. Hazards Earth Syst. Sci. 2011, 11, 431–444. [Google Scholar] [CrossRef]
  25. Kamusoko, C.; Gamba, J. Simulating Urban Growth Using a Random Forest-Cellular Automata (RF-CA) Model. ISPRS Int. J. Geo-Inf. 2015, 4, 447–470. [Google Scholar] [CrossRef]
  26. Sliuzas, R.; Flacke, J.; Jetten, V. Modelling urbanization and flooding in Kampala, Uganda. In Proceedings of the 14th N-AERUS/GISDECO Conference, Enschede, The Netherlands, 12–14 September 2013; pp. 1–16. [Google Scholar]
  27. Popa, M.C.; Peptenatu, D.; Drăghici, C.C.; Diaconu, D.C. Flood Hazard Mapping Using the Flood and Flash-Flood Potential Index in the Buzău River Catchment, Romania. Water 2019, 11, 2116. [Google Scholar] [CrossRef] [Green Version]
  28. Annis, A.; Nardi, F.; Petroselli, A.; Apollonio, C.; Arcangeletti, E.; Tauro, F.; Belli, C.; Bianconi, R.; Grimaldi, S. UAV-DEMs for Small-Scale Flood Hazard Mapping. Water 2020, 12, 1717. [Google Scholar] [CrossRef]
  29. Peruzzi, C.; Castaldi, M.; Francalanci, S.; Solari, L. Three dimensional hydraulic characterisation of the Arno River in Florence. J. Flood Risk Manag. 2019, 12, 1–13. [Google Scholar] [CrossRef] [Green Version]
  30. Mohammed, T.A.; Al-Hassoun, S.; Ghazali, A.H. Prediction of Flood Levels Along a Stretch of the Langat River with Insufficient Hydrological Data. Pertanika J. Sci. Technol. 2011, 19, 237–248. [Google Scholar]
  31. Tarchiani, V.; Massazza, G.; Rosso, M.; Tiepolo, M.; Pezzoli, A.; Housseini Ibrahim, M.; Katiellou, G.L.; Tamagnone, P.; De Filippis, T.; Rocchi, L.; et al. Community and Impact Based Early Warning System for Flood Risk Preparedness: The Experience of the Sirba River in Niger. Sustainability 2020, 12, 1802. [Google Scholar] [CrossRef] [Green Version]
  32. Comino, E.; Dominici, L.; Ambrogio, F.; Rosso, M. Mini-hydro power plant for the improvement of urban water-energy nexus toward sustainability—A case study. J. Clean. Prod. 2020, 249, 119416. [Google Scholar] [CrossRef]
  33. Tamagnone, P.; Comino, E.; Rosso, M. Landscape Metrics Integrated in Hydraulic Modeling for River Restoration Planning. Environ. Model. Assess. 2020, 25, 173–185. [Google Scholar] [CrossRef]
  34. Güneralp, B.; Güneralp, I.; Liu, Y. Changing global patterns of urban exposure to flood and drought hazards. Glob. Environ. Chang. 2015, 31, 217–225. [Google Scholar] [CrossRef]
  35. Röthlisberger, V.; Zischg, A.P.; Keiler, M. Spatiotemporal aspects of flood exposure in Switzerland. In Proceedings of the E3S Web of Conferences, Lyon, France, 17–21 October 2016; pp. 1–5. [Google Scholar]
  36. IPCC. Climate Change 2014: Synthesis Report. Contribution of Working Groups I, II and III to the Fifth Assessment Report of the Intergovernmental Panel on Climate Change; Pachauri, R.K., Meyer, L.A., Eds.; IPCC: Geneva, Switzerland, 2014; p. 151. [Google Scholar]
  37. Amoako, C.; Inkoom, D.K.B. The production of flood vulnerability in Accra, Ghana: Re-thinking flooding and informal urbanisation. Urban Stud. 2018, 55, 2903–2922. [Google Scholar] [CrossRef]
  38. Castro Correa, C.P.; Ibarra, I.; Lukas, M.; Véliz, J.O.; Sarmiento, J.P. Disaster Risk Construction in the Progressive Consolidation of Informal Settlements: Iquique and Puerto Montt (Chile) Case Studies. Int. J. Disaster Risk Reduct. 2015, 13, 109–127. [Google Scholar] [CrossRef]
  39. Balasbaneh, A.T.; Abidin, A.R.Z.; Ramli, M.Z.; Khaleghi, S.J.; Marsono, A.K. Vulnerability assessment of building material against river flood water: Case study in Malaysia. In IOP Conference Series: Earth and Environmental Science, Proceeding of the 2nd International Conference on Civil & Environmental Engineering, Langkawi, Malaysia, 20–21 November 2019; IOP Publishing Ltd.: Bristol, UK, 2019; pp. 1–8. [Google Scholar]
  40. Dangol, N.; Day, J. Flood adaptation by informal settlers in kathmandu and their fear of eviction. Int. J. Saf. Secur. Eng. 2017, 7, 147–156. [Google Scholar] [CrossRef] [Green Version]
  41. López, Ó.L.; Torres, I. Ventilation system for drying out buildings after a flood: Influence of the building material. Dry. Technol. 2017, 35, 867–876. [Google Scholar] [CrossRef]
  42. Eakin, H.; Lerner, A.M.; Murtinho, F. Adaptive capacity in evolving peri-urban spaces: Responses to flood risk in the Upper Lerma River Valley, Mexico. Glob. Environ. Chang. 2010, 20, 14–22. [Google Scholar] [CrossRef]
  43. Direction de la Météorologie Nationale du Niger (DMN). Guéchémé Pluviométrie 1981–2018. 2019. [Google Scholar]
  44. Climate Data, Dosso Climate. Available online: https://en.climate-data.org/africa/niger/dosso/dosso-26232/#temperature-graph (accessed on 8 December 2019).
  45. Institut National de la Statistique. Niger: Répertoire National des Localités (RENALOC), 1st ed.; Ministère des Finances: Niamey, Niger, 2014; p. 718.
  46. WMO Guidelines on the Definition and Monitoring of Extreme Weather and Climate Events (Final Draft). 2018. Available online: http://www.wmo.int/pages/prog/wcp/ccl/references.php (accessed on 5 May 2020).
  47. BDINA. Base de Données sur les Inondations Niger ANADIA. Available online: https://www.inondations-niger.org/content.php?page=32 (accessed on 5 May 2020).
  48. Lehner, B.; Verdin, K.; Jarvis, A. New global hydrography derived from spaceborne elevation data. Eos Trans. Am. Geophys. Union J. 2008, 89, 93–94. [Google Scholar] [CrossRef]
  49. USGS; WWF. Hydrological Data and Maps based on Shuttle Elevation Derivates at Multiple Scales (HydroSHEDS). Available online: https://hydrosheds.cr.usgs.gov/ (accessed on 22 March 2020).
  50. NASA; DRL; ASI. Shuttle Radar Topography Mission (SRTM). Available online: https://www2.jpl.nasa.gov/srtm/ (accessed on 22 March 2020).
  51. Woodward, D.E.; Hoeft, C.C.; Humpal, A.; Cerrelli, G. Chapter 15—Time of Concentration. In National Engineering Handbook Part 630 Hydrology; USDA Natural Resources Conservation Service, Ed.; NRCS: Fort Worth, TX, USA, 2010; pp. 1–29. [Google Scholar]
  52. Salimi, E.T.; Nohegar, A.; Malekian, A.; Hoseini, M.; Holisaz, A. Estimating time of concentration in large watersheds. Paddy Water Environ. 2017, 15, 123–132. [Google Scholar] [CrossRef]
  53. Ravazzani, G.; Boscarello, L.; Cislaghi, A.; Mancini, M. Review of Time-of-Concentration Equations and a New Proposal in Italy. J. Hydrol. Eng. 2019, 24, 04019039. [Google Scholar] [CrossRef]
  54. Shiau, J. Return period of bivariate distributed extreme hydrological events. Stoch. Environ. Res. Risk Assess. 2003, 17, 42–57. [Google Scholar] [CrossRef]
  55. Subyani, A.M. Hydrologic behavior and flood probability for selected arid basins in Makkah area, western Saudi Arabia. Arab. J. Geosci. 2011, 4, 817–824. [Google Scholar] [CrossRef]
  56. Thas, O.; Ottoy, J.P. Some generalizations of the Anderson–Darling statistic. Stat. Probab. Lett. 2003, 64, 255–261. [Google Scholar] [CrossRef]
  57. Ožanić, N.; Rubinić, J.; Karleuša, B.; Holjević, D. Problems of High Water Appearances in Urban Areas. In Proceedings of the IX International Symposium on Water Management and Hydraulic Engineering, Ottenstein, Austria, 4–7 September 2005; pp. 395–402. [Google Scholar]
  58. US Army Corps of Engineers—Hydrologic Engineering Center, HEC-HMS. Available online: https://www.hec.usace.army.mil/software/hec-hms/ (accessed on 18 June 2020).
  59. Boughton, W.C. A review of the USDA SCS curve number method. Soil Res. 1989, 27, 511–523. [Google Scholar] [CrossRef]
  60. Woodward, D.E.; Hawkins, R.H.; Jiang, R.; Hjelmfelt, A.T.; Van Mullem, J.A.; Quan, Q.D. Runoff Curve Number Method: Examination of the Initial Abstraction Ratio. In Proceedings of the World Water and Environmental Resources Congress 2003 and Related Symposia, Philadelphia, PA, USA, 23–26 June 2003; pp. 1–16. [Google Scholar]
  61. Copernicus Global Land Service: Africa Land Cover. Available online: https://africa.lcviewer.vito.be/2015 (accessed on 2 July 2020).
  62. Soulis, K.X.; Valiantzas, J.D. SCS-CN parameter determination using rainfall-runoff data in heterogeneous watersheds—The two-CN system approach. Hydrol. Earth Syst. Sci. 2012, 16, 1001–1015. [Google Scholar] [CrossRef] [Green Version]
  63. Ling, L.; Yusop, Z.; Yap, W.-S.; Tan, W.L.; Chow, M.F.; Ling, J.L. A Calibrated, Watershed-Specific SCS-CN Method: Application to Wangjiaqiao Watershed in the Three Gorges Area, China. Water 2020, 12, 60. [Google Scholar] [CrossRef] [Green Version]
  64. Mamadou, I.; Gautier, E.; Descroix, L.; Noma, I.; Moussa, I.B.; Maiga, O.F.; Genthon, P.; Amogu, O.; Malam Abdou, M.; Vandervaere, J. Exorheism growth as an explanation of increasing flooding in the Sahel. Catena 2015, 131, 130–139. [Google Scholar] [CrossRef]
  65. Massazza, G.; Tamagnone, P.; Wilcox, C.; Belcore, E.; Pezzoli, A.; Vischel, T.; Panthou, G.; Housseini Ibrahim, M.; Tiepolo, M.; Tarchiani, V.; et al. Flood Hazard Scenarios of the Sirba River (Niger): Evaluation of the Hazard Thresholds and Flooding Areas. Water 2019, 11, 1018. [Google Scholar] [CrossRef] [Green Version]
  66. US Army Corps of Engineers—Hydrologic Engineering Center, HEC-RAS. Available online: https://www.hec.usace.army.mil/software/hec-ras/ (accessed on 22 March 2020).
  67. Ardiçlioglu, M.; Kuriqi, A. Calibration of channel roughness in intermittent rivers using HEC-RAS model: Case of Sarimsakli creek, Turkey. SN Appl. Sci. 2019, 1, 1080. [Google Scholar] [CrossRef] [Green Version]
  68. GeoEye, GeoEye-1 Scene 010474140010, Corrected, Bundle, Longmont, Colorado, CO, USA: GeoEye, 6–14 October 2009. Available online: https://brocku.ca/library/wp-content/uploads/sites/51/MDG-How-to-Reference.pdf. (accessed on 10 July 2020).
  69. WorldView, WorldView-2 Scene 1030010097333C00, Corrected, Bundle, Munich, Germany: EUSI GmbH, 1–6 September 2019. Available online: https://brocku.ca/library/wp-content/uploads/sites/51/MDG-How-to-Reference.pdf. (accessed on 10 July 2020).
  70. ESRI. Pansharpening Function. Available online: https://pro.arcgis.com/en/pro-app/help/data/imagery/pansharpening-function.htm (accessed on 3 June 2020).
  71. SDSTATE. Radiometric Calibration. Available online: https://www.sdstate.edu/jerome-j-lohr-engineering/radiometric-calibration (accessed on 10 February 2020).
  72. ESRI. Dictionary of GIS Terminology; Karman, M., Amdahl, G., Eds.; ESRI Press: Redlands, CA, USA, 2000; p. 119. [Google Scholar]
  73. Yan, G.; Mas, J.-F.; Maathuis, B.H.P.; Xiangmin, Z.; Van Dijk, P.M. Comparison of pixel-based and object-oriented image classification approaches—A case study in a coal fire area, Wuda, Inner Mongolia, China. Int. J. Remote Sens. 2006, 27, 4039–4055. [Google Scholar] [CrossRef]
  74. Ying, T. Chapter 11—Applications. In Gpu-Based Parallel Implementation of Swarm Intelligence Algorithms, 1st ed.; Ying, T., Ed.; Morgan Kaufmann: Burlington, MA, USA, 2016; pp. 167–177. [Google Scholar]
  75. Harris Geospatial Solutions, Spectral Indices. Available online: https://www.harrisgeospatial.com/docs/SpectralIndices.html (accessed on 26 November 2019).
  76. Fernández, D.S.; Lutz, M.A. Urban flood hazard zoning in Tucumán Province, Argentina, using GIS and multicriteria decision analysis. Eng. Geol. 2010, 111, 90–98. [Google Scholar] [CrossRef]
  77. Casas, A.; Benito, G.; Thorndycraft, V.R.; Rico, M. The topographic data source of digital terrain models as a key element in the accuracy of hydraulic flood modelling. Earth Surf. Process. Landf. 2006, 31, 444–456. [Google Scholar] [CrossRef]
  78. Zouari, K.; Moulla, A.S.; Smati, A.; Adjomayi, P.A.; Boukari, M.; Thiam, A.; Kone, S.; Rabe, S.; Bobadji, I.; Maduabuchi, C.M.; et al. Integrated and Sustainable Management of Shared Aquifer Systems and Basins of the Sahel Region, Iullemeden Aquifer System; International Atomic Energy Agency (IAEA): Vienna, Austria, 2017; p. 114. [Google Scholar]
  79. FAO. Mission to the Sahel. Available online: http://www.fao.org/3/f7795e/f7795e05.htm (accessed on 24 June 2020).
  80. Tiepolo, M.; Tarchiani, V. Risque et Adaptation Climatique Dans la Région Tillabéri, Niger; L’Harmattan: Paris, France, 2016; p. 282. [Google Scholar]
  81. Tiepolo, M.; Bacci, M.; Braccio, S. Multihazard Risk Assessment for Planning with Climate in the Dosso Region, Niger. Climate 2018, 6, 67. [Google Scholar] [CrossRef] [Green Version]
  82. Tiepolo, M.; Braccio, S.; Tarchiani, V. Lo Sviluppo delle aree Rurali Remote: Petrolio, Uranio e Governance Locale in Niger; FrancoAngeli: Milan, Italy, 2009; p. 224. [Google Scholar]
  83. Okoro, B.C.; Ibe, O.P.; Ekeleme, A.C. Development of a Modified Rational Model for Flood Risk Assessment of Imo State, Nigeria Using Gis and Rs. Int. J. Eng. Sci. 2014, 3, 1–8. [Google Scholar]
  84. Jayne, T.S.; Chamberlin, J.; Headey, D.D. Land pressures, the evolution of farming systems, and development strategies in Africa: A synthesis. Food Policy 2014, 48, 1–17. [Google Scholar] [CrossRef] [Green Version]
  85. Tiepolo, M.; Braccio, S. 12. Flood Risk Preliminary Mapping in Niamey, Niger. In Planning to Cope with Tropical and Subtropical Climate Change, 1st ed.; Tiepolo, M., Ponte, E., Cristofori, E., Eds.; De Gruyter: Berlin, Germany, 2016; pp. 201–220. [Google Scholar]
  86. Mbanga, L.A. Human Settlement Dynamics in the Bamenda III Municipality, North West Region, Cameroon. J. Settl. Spat. Plan. 2018, 9, 47–58. [Google Scholar]
  87. Kuriqi, A.; Ardiçlioglu, M.; Muceku, Y. Investigation of seepage effect on river dike’s stability under steady state and transient conditions. Pollack Period. 2016, 11, 87–104. [Google Scholar] [CrossRef] [Green Version]
  88. Ghassemi, S.; Sandu, C.; Fiandrotti, A.; Giulio Tonolo, F.; Boccardo, P.; Francini, G.; Magli, E. Satellite Image Segmentation with Deep Residual Architectures for Time-Critical Applications. In Proceedings of the 2018 26th European Signal Processing Conference (EUSIPCO), Rome, Italy, 3–7 September 2018; pp. 2235–2239. [Google Scholar]
Figure 1. Territorial framework of the Maouri Dallol in the municipality of Guéchémé: Dallol river channel (1), study area (2), main settlements (3), municipal border (4), national border (5), national road no. 1 (6), unpaved tracks (7), and weather stations (8).
Sustainability 12 05632 g001
Figure 2. Methodology flowchart.
Sustainability 12 05632 g002
Figure 3. Annual accumulated rainfall (blue) (Guéchémé and Guéchémé Centre de Santé stations) between 1981 and 2018, critical rainfall threshold of 400 mm/year (red), incomplete data (grey).
Sustainability 12 05632 g003
Figure 4. Trend of precipitations in the 95th percentile (red) (Guéchémé and Guéchémé Centre de Santé stations) between 1981 and 2018 and incomplete data (grey).
Sustainability 12 05632 g004
Figure 5. Flood scenarios in the Guéchémé Dallol with probability of occurrence: high RP2 (1), medium RP20 (2), low RP200 (3), study area (4), main settlements (5), Maouri Dallol river channel (6), unpaved tracks (7), hydrographic basin limit (8), and creek flow direction (9).
Sustainability 12 05632 g005
Figure 6. Close-up view of the flood scenarios in the Guéchémé Dallol with probability of occurrence: high RP2 (1), medium RP20 (2), low RP200 (3), study area (4), main settlements (5), unpaved tracks (6), and Maouri Dallol river channel (7).
Sustainability 12 05632 g006
Figure 7. Settlement localization in the Maouri Dallol of Guéchémé: in non-flood-prone areas (1), in flood-prone areas (2), flood scenario RP200 (3), study area (4), municipal border (5), national border (6), unpaved tracks (7), and indication of analyzed settlements.
Sustainability 12 05632 g007
Figure 8. Schematization of (a) less dense building expansion with dense pre-existing built-up area; (b) building consolidation with reduction in density of the pre-existing fabric due to building replacement; (c) expansion and building consolidation with reduction of the pre-existing fabric due to building replacement and new less dense expansions; precarious building (1), semi-permanent building (2), list of representative settlements for each main dynamic.
Sustainability 12 05632 g008aSustainability 12 05632 g008b
Figure 9. Building expansion in the FPA in Angoual Chekaraou between 2009 (1a) and 2019 (1b): high (1), medium (2), and low (3) probability of flooding, built-up area (4), buildings with iron sheet roofs (5), unpaved tracks (6), and 2009 built-up area (7).
Sustainability 12 05632 g009
Figure 10. Details of the three main settlement dynamics of straw (1), mud (2), and corrugated iron sheet (3) roofs in Angoual Chekaraou (a1,a2), Lokoko (b1,b2), and Toullou (c1,c2) between 2009 and 2019.
Sustainability 12 05632 g010
Table 1. Glossary of acronyms used in the text.
AcronymsFull Names
FPAFlood-prone areas
NFPANon-flood-prone areas
DEMDigital elevation model
DMNDirection de la Météorologie Nationale du Niger
BDINABase de Données sur les Inondations Niger ANADIA
HydroSHEDSHydrological data and maps based on shuttle elevation derivates at multiple scales
PDFProbability density functions
RPReturn period
HEC-HMSHydrologic Engineering Center - hydrologic modeling system
HEC-RASHydrologic Engineering Center - river analysis system
CNCurve number
SAMSpectral angle mapper
NDBINormalized difference built-up index
NDVINormalized difference vegetation index
Table 2. Satellite imagery specifications.
Image DatasetYearAcquisition DateSensorSpectral ResolutionGeometric ResolutionFormat
120096–14 OctoberGeoEye-14 bands0.5 mBundle 1
220191–6 SeptemberWorldView-28 bands0.5 mBundle
1 Multispectral and panchromatic dataset.
Table 3. Settlements in the Maouri Dallol of Guéchémé by size in 2019.
Size ClassesSettlements
han.
≥501
10.00–49.996
2.00–9.9921
<259
All87
Table 4. Extension and characteristics of the flood-prone areas in the Maouri Dallol based upon the return periods (RP): velocity (V) and depth (D) referred to the urban area distribution.
RP YearsRainfall mmQMAX l/s·km2Flood-Prone AreaVMEAN m/sVMAX m/sDMEAN mDMAX m
km2%
21332.7325.212.50.140.430.631.34
202179.0248.123.90.260.730.841.67
20028718.0566.733.20.330.850.971.78
Table 5. Catastrophic flood comparison between community remembrance and the Niger flood (BDINA) database between 2012 and 2016.
YearCatastrophic Floods
Community RemembranceBDINA
2012XX
2013 X
2015XX
2016XX
Table 6. Evolution of the number of settlements in the study area between 2009 and 2019.
Settlements in200920192009–2019
no.no.%
Non-flood-prone area4551+13
Flood-prone area3636+0
All8187+7
Table 7. Building expansion of 24 settlements (12 in the flood-prone area (FPA) and 12 in the non-flood-prone area (NFPA)) in the Guéchémé Dallol between 2009 and 2019.
SettlementsIn the Non-Flood-Prone AreaIn the Flood-Prone Area
200920192009–2019200920192009–2019
Area (ha)76.1699.36+30%88.09150.58+71%
Buildings (n.)35663578+0%30963760+21%
Density (build./ha)46.836.0−23%35.124.8−29%
Table 8. Roof dynamics of 24 settlements (12 in FPA and 12 in NFPA) in the Guéchémé Dallol between 2009 and 2019.
Roof200920192009–2019
no.%no.%%
Straw23693688612−63
Mud406761486767+20
Corrugated iron sheet2263156421+592
Total66621007317100+10
Table 9. Flood exposure of buildings in the Guéchémé Dallol between 2009 and 2019, comparison between building expansion and building consolidation in the FPA.
Flood Exposure200920192009–2019Consolidation Factor 1
no.no.%-
BuildingsTotal30963740+21-
RP2474540+140.94
RP20755932+231.02
RP20010301327+291.07
% in the flood-prone area 233%35%--
Corr. iron sheetTotal115815+609-
RP21199+8001.27
RP2025194+6761.09
RP20037294+6951.12
% in the flood-prone area 232%36%--
1 RPx ∆2009–2019/Total ∆2009–2019; 2 RP200 scenario referenced data.
Table 10. Settlement dynamics of representative settlements for each main dynamic between 2009 and 2019.
Dynamicsa Expansionb Consolidationc Expansion + Consolidation
Significant SettlementsAngoual ChekaraouLokokoToullou
Data20092009–201920092009–201920092009–2019
Area (ha)28.6+147%38.9+22%5.7+35%
Buildings (no.)416+108%1599−6%285+9%
Corrugated iron sheets (no.)28+1318%68+410%8+350%
Straw (no.)75−91%771−85%125−60%
% in the flood-prone area18+7pp 1--54+0pp
1 Percentage points.
Table 11. Surface areas, buildings, and roofs in FPA RP200 and in the NFPA.
SettlementArea 2019Buildings 2019Iron Sheet Roofs 2019
TotalIn the Flood-Prone AreaTotalIn the Flood-Prone AreaTotalIn the Flood-Prone Area
ha%no.%no.%
Dakora2.6949150491050
Angoual Chekaraou70.71318662539731
Illela Tounga Alou 1------
Angoual Bozari16.9221517185821
Bawada (Indayya)32.954510473820540
Katamawa5.4138196413123
Guizarawa5.0728227191947
Toullou7.6959310543678
Balsando4.4420226214025
Tounga Atta2.51001451007100
#49 20.85100111004100
#541.35944591875
Lokoko47.51-1510-347-
Tounga Tombo3.22-129-65-
Tounga Nassara3.44-146-15-
Tounga Maizaki1.95-77-10-
Tounga Mai Zongo0.41-19-7-
Yangana3.44-158-27-
Angoual Kade4.86-212-47-
Boye-Boye15.19-547-107-
Tapkin Inoua5.25-273-30-
Tounga Makada3.01-111-13-
Here Damchi10.53-385-80-
#600.55-11-1-
1 Disappeared between 2009 and 2019. 2 Settlements marked with a ‘#’ are not reported in the National Repertoire of Localities (RENALOC).

