1. Introduction
Currently, studies in the social sciences are undergoing a vast transformation. The incorporation of sustainability as a fundamental aspect has caused a paradigm shift in contemporary social research. Long gone are the days when the only relevant consideration in the economic and social fields was the search for commercial and practical optimization, without the incorporation of aspects such as sustainable development. Recently, the sustainable nature of productive activity has been taken into consideration with increasing insistence—this approach privileges a vision more focused on social and environmental conditions than merely economic conditions and tries to establish a balance between human activity, productive activity, and the environment in which they develop.
In 2015, the United Nations (UN) approved the 2030 Agenda on Sustainable Development, creating a new path aimed at improving the lives of countries and societies. This agenda contains a set of global objectives, including, among others, eradicating poverty, protecting the planet, and ensuring the prosperity of humanity [
1,
2,
3,
4]. Each of these objectives has specific goals that are intended to be achieved over the next 10 years. This cluster of projects has been broken down into the so-called 17 Sustainable Development Goals (SDGs), with the broad purpose of creating a world with the improvements and amenities necessary not only for current generations but also for future generations [
5].
Tourism, as an economic activity that generates a high percentage of Gross Domestic Product (GDP) and employment in the world economy, is no stranger to this need. According to data from the European Parliament, in 2018 the tourism sector of the European Union (EU) contributed directly to 3.9% of GDP and generated 11.9 million jobs, which represented 5.1% of the total labor force employed. However, if the close links between the tourism sector and other economic sectors are taken into account, the contribution increases significantly, as its contribution was 10.3% of GDP and the employment of 27.3 million workers (11.7% of total employment) [
6].
Due to the relevance of the tourism sector in the economy of the EU member states, researchers must take into account in the dynamics of this sector—aspects such as the eradication of poverty and hunger; decent employment; sustainable and lasting economic growth; the growth of health and well-being; the improvement of quality education; the achievement of gender equality; environmental progress and the fight against climate change; promoting a sustainable ecosystem; reducing inequalities between and within states; achieving sustainable models of consumption and production; the maintenance of inclusive, safe, and sustainable cities with infrastructures that allow promoting industrialization; fostering innovation; and promoting peaceful societies with equitable access to justice [
7,
8]. In this sense, an attempt has been made to incorporate these objectives initially created to define the improvement commitments of the countries and their inhabitants with the tourism sector. Moreover, although tourism is included in the goals of objectives 8, 12, and 14 of the SDGs [
9], it is necessary to bear in mind that it could be included, to a greater or lesser extent, in all the SDGs, since they contain cross-cutting aspects that must be taken into account. Four years after the signing of the 2030 Agenda for Sustainable Development, some aspects that require greater attention are climate change, increasing inequality between and within countries, poverty, hunger, and disease. Measures are proposed to solve these problems, such as shifting towards clean energy; promoting sustainable agriculture; and increasing access to drinking water, sanitation, and hygiene [
5]. However, on a productive level the tourism sector is in a situation where the application of the SDGs can turn it into a powerful sector, promoting economic growth and gender equality and facilitating the creation of sustainable and inclusive employment.
Given these considerations, this study has as its main objective an exploratory analysis of tourism activity in the countries of the EU over the decade 2009–2018 and their adaptation to the Sustainable Development Goals from the perspective of employment. Specifically, an attempt will be made to examine the ability of tourism employment to adjust to the objectives of decent employment and economic growth (O8) and gender equality (O5) and to establish the future potential for adaptation within the time horizon set for the development of the SDGs. This will allow us to determine which countries of the EU have the greatest power to adapt their tourism activity to SDGs (8) and (5), benefiting from the economic effects and drag of this activity in all their economies in the scope of the sustainable development objectives object of this study. In this sense, the question posed will try to respond to the possible influence of economic growth, decent employment, gender equality, and the KOF globalization index (KOF Swiss Economic Institute) on the economic weight or the importance of tourism in the productive activity of the Member States of the EU-28. This will facilitate monitoring the impact of the analyzed SDGs on tourism activity in the countries of the European Union, especially those whose weight is important in their whole economy.
The interest of this study is fundamentally in the innovative nature that the adoption of the SDGs still represents for economic activity in general and tourist activity in particular, given that they only originated in the meeting held by world leaders on 25 September 2015. It is clear that the success of meeting these goals lies not only with governments but that the responsibility also falls on the private sector and civil society. Furthermore, the relevance of this paper also lies in the current absence of sufficiently detailed statistical records by the World Tourism Organization (UNWTO) on the analyzed SDGs.
This study is structured in the following way. In the second section, the methodology used is indicated, as well as the statistical sources considered. The third section presents the results obtained in the study carried out. In the fourth section, the existing discussions of the topic are formally examined, indicating the most relevant works to have addressed the question under investigation. The most important conclusions obtained in this study will be compiled in the last section.
2. Materials and Methods
As this study focuses primarily on an employment perspective, an attempt was made to relate some employment variables for which information is available through statistical sources that are relevant to the aspects that are to be studied. However, it should be noted that, even though the tourism sector has enormous relevance in the productive activity of many countries, there is a lack of relevant and sufficient statistical indicators for evaluating its impact on the regional economy [
10], mainly due to the horizontal nature of this sector.
The main drawback to evaluating the economic impact of tourism is, fundamentally, in the multisectoral nature of this sector, which implies that there are variables that are difficult to quantify, inevitably minimizing the value of tourism’s true contribution to economic development [
11]. Furthermore, it is important to highlight the lack of a sectoral statistical instrument on the supranational level that could provide a sufficiently disaggregated database to allow for further research on tourism [
12].
Economic growth has been studied in terms of growth in employment as well as through growth in the level of the per capita income of each of the member countries. Decent employment has been analyzed using a multi-criteria technique to examine a series of variables in the tourism sector. We consider factors such as whether employment is full-time or part-time, the length of employment in the same company (distinguishing between durations of less than two years and durations equal to or greater than two years), jobs by age group, jobs according to the level of training, and the permanence of the job (limited or unlimited duration). For the study of gender equality, employment in the tourist activity by sex will be analyzed. In order to be able to make comparisons with the set of productive activities of the EU-28 member countries, the same employment variables described above will be examined, but with reference to the whole of the economy of each of the countries studied.
The decent employment indicator, because it contains several variables, has been analyzed by grouping it using two indicators. The first of these is a weighted index number of the type:
where
xi is the proportion of each of the variables studied in the tourism sector concerning the total tourism employment in each of the aspects considered and
wi is the weight used, which comes from the aspect of employment studied in the tourism sector as a proportion of the total employment in the EU-28 economy. This indicator will reflect a higher value the higher the aspect to be measured, which in our case is decent employment. It will indicate that the Member State will have a greater presence of decent employment in the tourism sector.
Meanwhile, the second indicator reflects the level of specialization of employment in each of its aspects with respect to the same variable in the total economy of the EU-28:
where
xsi is the dimension of employment analyzed in the tourism sector,
xs is the total occupation examined in the tourism sector,
xi is the aspect of employment analyzed in the total sectors of the EU-28, and
x is the global occupation in the EU-28. In this case, a value greater than unity would mean that decent employment in the tourism sector in a Member State is greater than that presented in the total employment of that economy—that is, the employment of all sectors of that economy.
Sigma convergence (
σ) has been used to measure economic disparities [
13]. This indicator is a measure of dispersion, defined as the progress, over a given period of time, of the standard deviation of the logarithm of the variable to be analyzed—in this case, for example, the Gross Domestic Product per capita (GDPpc) for the 28 EU countries. Its expression is given by:
where “ln (GDPpcit)” is the logarithm of GDPpc at constant prices in the i-th country in year “t”, “ln (PIBpct)” is the logarithm of GDPpc at constant prices in the EU-28, equivalent to a weighted average of the GDPpc of the member states, and “28” is the number of countries in the EU-28.
Another indicator used in this document has been the KOF Globalization Index, a composite index that measures the globalization of countries along the economic, social, and political dimensions [
14,
15,
16,
17,
18]. This index was presented by Dreher and attempts to examine the effect of globalization on economic growth, employment, and gender equality. Numerous studies confirm that globalization positively affects and promotes economic growth, employment, and gender equality. The data from the KOF Globalization Index have been extracted from the Eidgenössische Technische Hochschule Zürich 2020 website [
19].
In addition, in order to establish the relationship between the weight or the importance of the tourism sector in the productive activity of the member countries of the EU-28 (measured from the employment of the tourism sector in total employment) and economic growth indicators and decent work (SDG 8) and gender equality (SDG 5), we will present an econometric regression of the panel data of fixed effects for the analyzed period. The expression of the proposed estimate is as follows:
where PAT is the weight or importance of the tourism sector of Member State i in period t, CTO is the economic growth, RTD is the stable employment indicator, IG is the gender equality indicator, KOF is the globalization index, D is a dummy variable with value 0 for the periods prior to the approval of the SDGs and 1 for the subsequent periods, and µ is the regression errors. This regression will reveal the influence of the analyzed SDGs on tourism activity in the EU countries.
The United Kingdom’s decision to leave the European Union (EU) (popularly known as “Brexit”), after a referendum held on 23 June 2016 with the support of 51.9% of voters, was implemented on 31 January 2020. This is why average values for the 28 members of the EU, including the UK, were included in the study. During the period under review, the UK was an active member of the EU. However, on the average values of the EU-27, the UK is excluded.
The member countries approved the 2030 Agenda of the UN in 2015. Since then, the social partners have been working to meet the proposed objectives, grouped into the 17 goals called SDGs. For this reason, it was decided to study the period 2009–2018 because it offered an opportunity to investigate the situation and evolution of the said objectives before the approval of the agenda and the dynamics experienced after its support and implementation. The latest data officially published by the European Commission are from 2018. We have worked with the average values of the two periods under consideration (2009–2014 and 2015–2018) to avoid focusing on any single year, thus smoothing out any specific deviation that might occur in an anomalous figure in any of the variables analyzed [
10]. The first period includes the period prior to the approval of the SDGs as well as the period of the economic and financial crisis, and the second consists of the period after the support of the objectives and the recovery of the economy. Therefore, the consideration of these two periods is fundamentally justified because the first of them 2009–2014 considers, in a stable way, the period prior to the approval of the SDGs by the UN, and the second one tries to focus attention on the period after the admission of the SDGs in a solid way, avoiding instabilities.
The statistical sources used mainly come from data provided by the official databases of Eurostat [
20], the European Commission, and the National Institute of Statistics (INE) (attached to the Ministry of Economic Affairs and Digital Transformation via the Secretary of State for the Economy and Business Support of the Government of Spain.) [
21].
3. Results
3.1. Level of Economic Development of the EU Countries
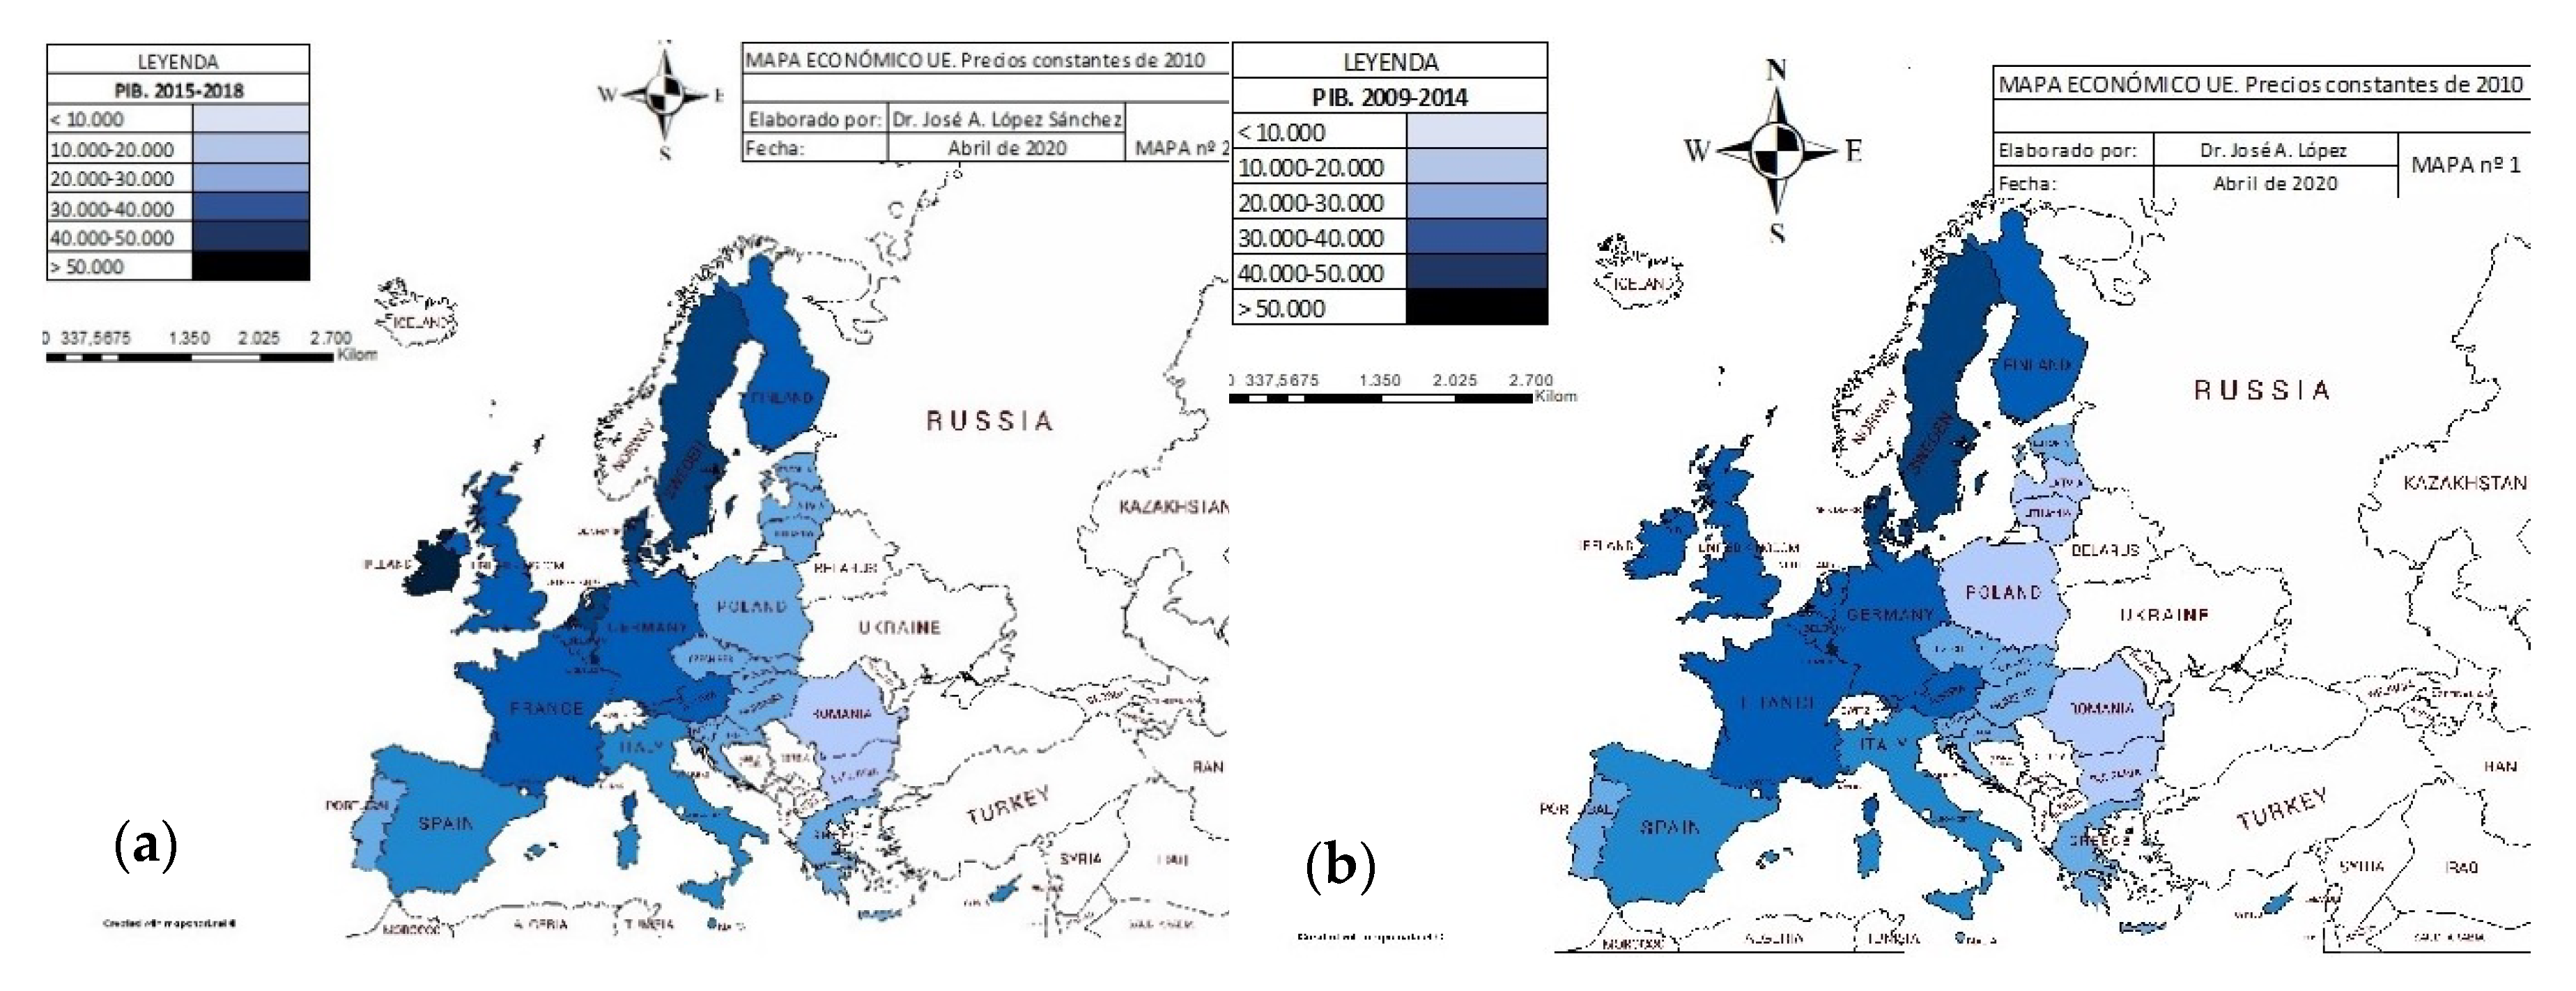
An analysis of the level of economic development in the countries of the EU may serve as a first approach to contextualizing the study that is being carried out. The level of economic growth has been measured, as is usually the case in scientific studies in the field of Economics, by the Gross Domestic Product per inhabitant or per capita (GDPpc). This indicator was measured at constant prices, discounting the influence of prices, based on the year 2010 and valued at purchasing power parity (PPP). In addition, these data were accompanied by the cumulative average annual growth rate for the periods 2009–2014 and 2015–2018, which are used in the second section of the study. The results are presented in
Table 1.
Table 1 shows several points of great interest. If attention is focused on the level of GDPpc in the two periods considered, it can be observed that strong economic growth occurs between the two periods, going from €25,673 in 2009–2014 (the period of economic crisis) to €27,470 in 2015–2018 (the period of economic recovery), an increase of about €1800. Furthermore, inequalities increased over the two periods considered.
Indeed, the standard deviation, as an indicator of disparities, went from €15,463.66 to €16,538.82 between the two periods analyzed, indicating that in the growth period, the imbalances between the countries of the EU-28 have increased.
A second idea that can be deduced from the table is that Brexit will mean a loss in GDPpc for all the countries of the EU. In fact, it can be observed that the average of the GDPpc of the EU-27 is lower in the two periods considered than in the one represented by the EU-28 average.
Considering the ranking of the EU-28 countries (see
Figure 1), a strong process of crystallization in the positions of each of the countries of the EU is observed. In this sense, there were minimal changes over the periods analyzed. The 10 countries with the lowest level of development have maintained their positions over the two periods analyzed, with slight changes in position between them. Of the 10 countries with the highest levels of development, nine remained among the countries with the highest levels of economic growth, with the exception of France, which moved to position 11 in the period 2015–2018, and the UK, which joined the group of countries with the highest level of development in the last period analyzed. If we compare the distribution of the positions occupied by the EU-28 countries in the two periods considered, based on the correlation coefficient it reached a value of 0.98638462, which shows the solidification and hardening of the positions of the countries of the EU.
In general, the eastern EU-28 countries, which were the last to join, continued to maintain the least favorable positions with respect to their level of economic development.
Considering the cumulative annual average growth data for the GDPpc of the EU-28 countries, several considerations should be highlighted. Both in the first period considered, namely 2009–2014, and in the second period, 2015–2018, the countries that generally show the highest accumulated average annual growth levels are the newly incorporated countries—that is, the countries of Eastern Europe. However, economic growth doubled between the period of economic decline (2009–2014) and the recovery period (2015–2018), going from 0.73% to 1.47%.
In addition, during the period 2009–2014 (economic crisis), the 10 countries with the highest levels of economic development and the 10 with the lowest levels were those with the lowest and highest average growth rates, respectively, showing that the highest growth rates were in the 10 countries with the lowest level of economic development. Likewise, during the recovery period (2015–2018) the 10 countries with the lowest levels of per capita income showed the highest cumulative average annual growth rates, and the 10 countries with the highest levels of GDPpc showed the lowest levels of average growth.
It is interesting to relate the level of economic development of the EU member countries with the KOF globalization index (
Table 2). From its observation, it appears that the countries of northern Europe have the highest value in the global index, and that, as previously noted, they also have a higher level of economic development and a higher level of economic growth and employment. However, Eastern Europe countries, recently incorporated as members of the EU, generally have a lower rate of globalization, linked to lower levels of economic development and employment.
On the other hand, the globalization index has a greater correlation with the social globalization index and with the political globalization index, showing coefficients greater than 0.6. However, the correlation level of the KOF globalization index with the economic globalization index only reaches a value close to 0.40.
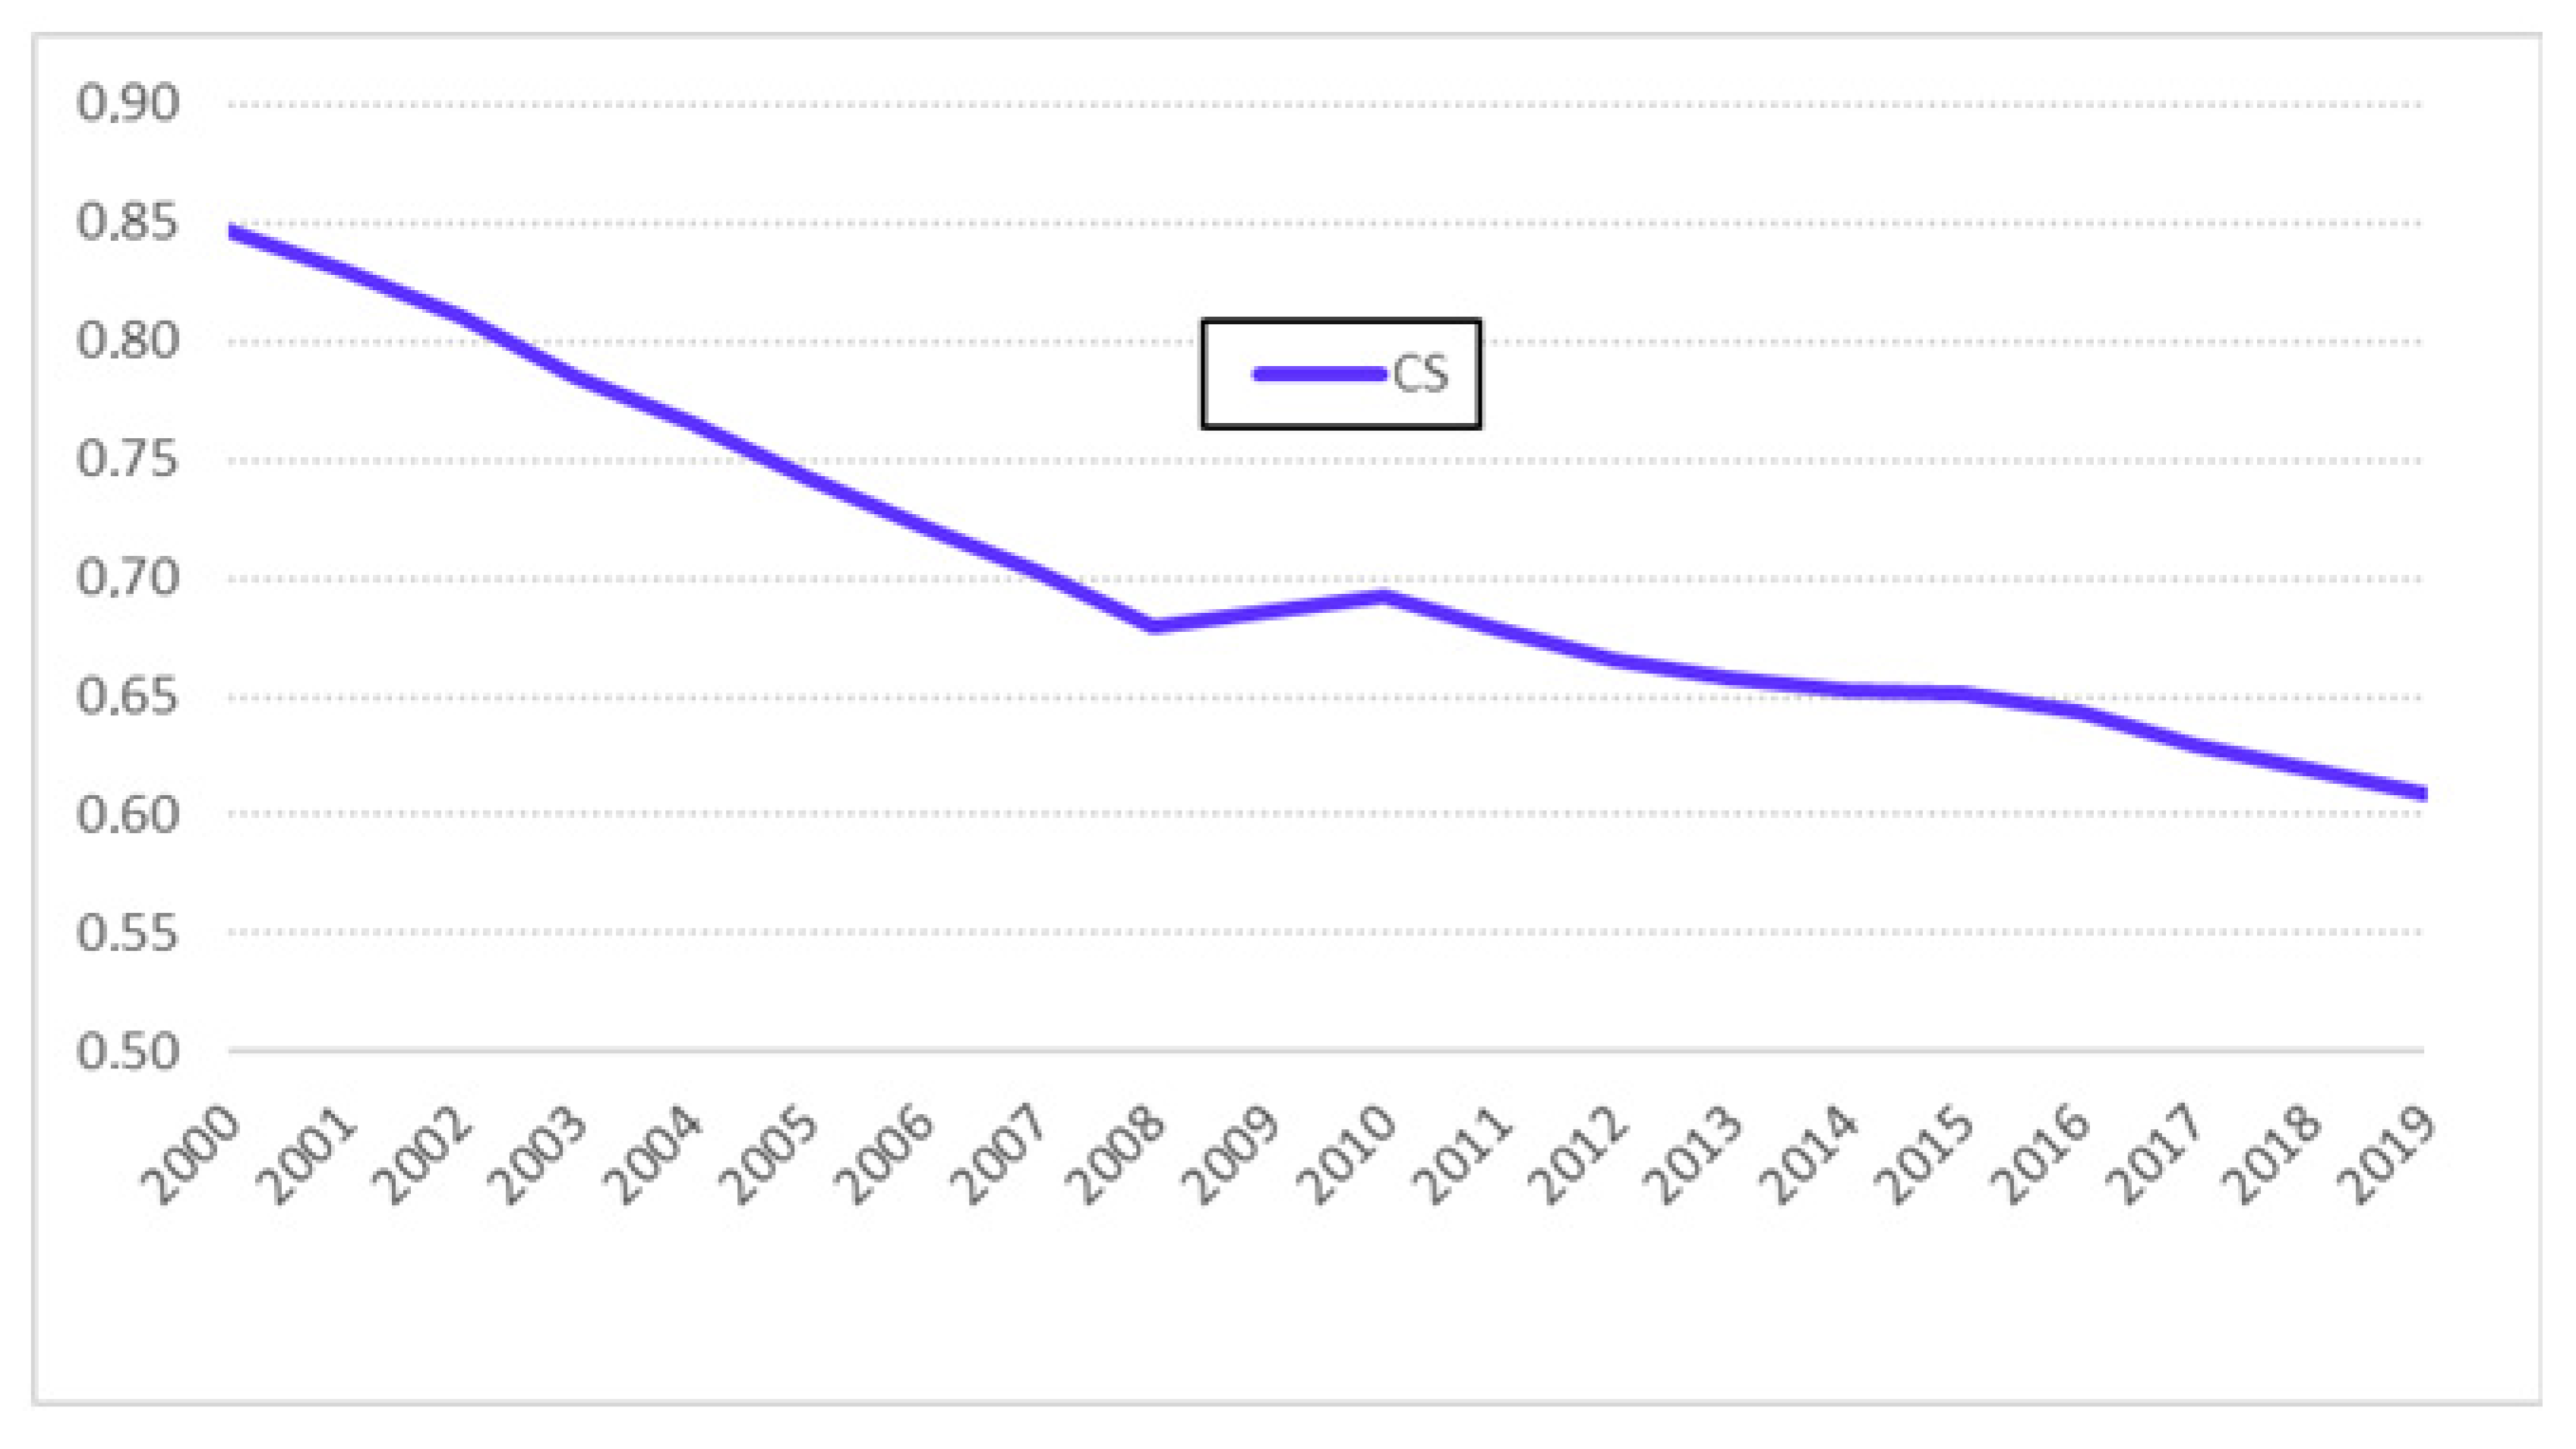
To contrast these points, the evolution of the sigma convergence index of GDPpc of the EU-28 countries is presented in
Figure 2. It can be seen how, in the period analyzed (2000–2019), there is a convergent process in the level of economic development of the EU-28 countries, indicating that economic disparities have been decreasing over the last few years, achieving greater equality in the income level of the EU member countries.
3.2. Economic Growth and Decent Employment in EU Tourism Activity
According to the 2019 Sustainable Development Goals Report, this goal (O8) aims to promote sustained, inclusive, and sustainable economic growth; full and productive employment; and decent employment for all of society. In this sense, it highlights the idea that sustained and inclusive economic growth is intended to promote progress, generate decent jobs, and improve the living standards of the planet’s inhabitants. To this end, an economic and social policy plan is being developed to achieve the goals of economic growth in the least developed countries; increase employment opportunities (mainly in the case of women and youth); reduce inequalities between territories, age groups, and sexes; decrease informal employment; and promote safe and protected work environments for all employees [
5].
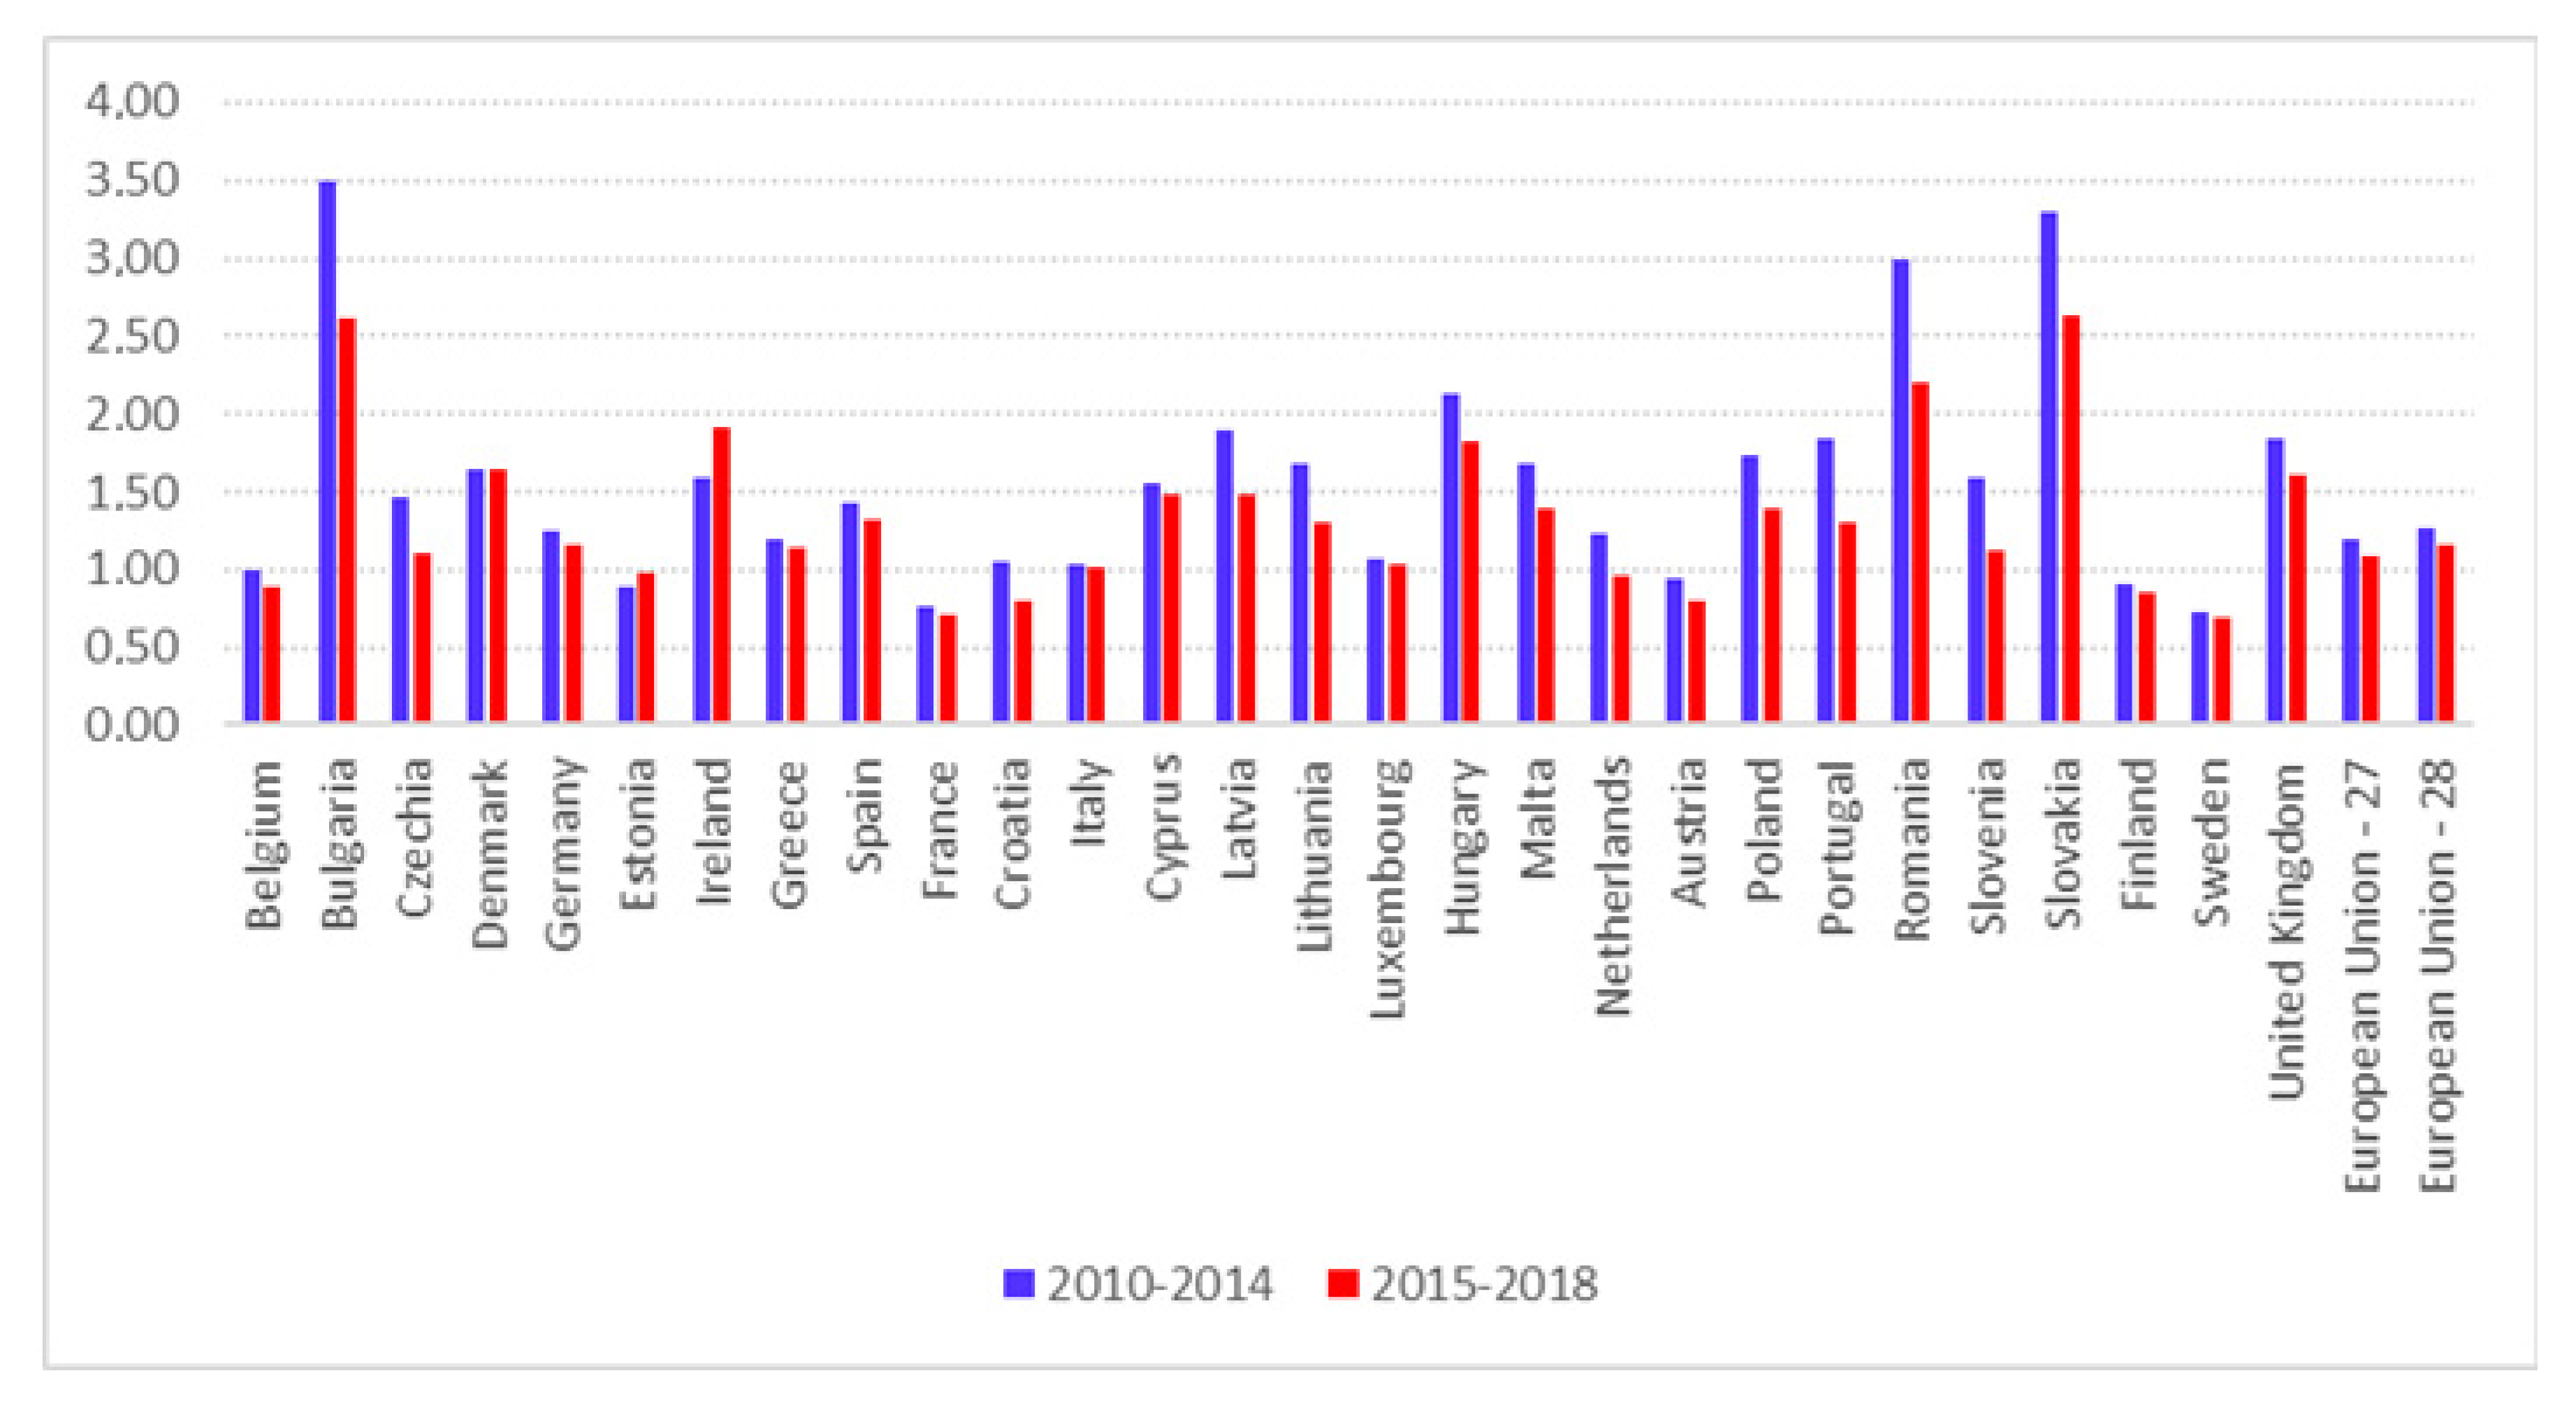
Considering the employment growth data for both the tourism sector and the total economic sectors in the study periods considered, the following facts were observed. As shown in
Table 3, during the period 2009–2014, the EU-28 did not experience any growth in full employment for all economic sectors due to the economic crisis experienced between 2008 and 2013. The tourism sector experienced a growth of 0.87 points, which indicates, in a certain way, that the tourism sector was not as badly affected by the economic crisis as the economy as a whole. During the 2015–2018 period, the total employment grew 1.30 points, while the tourism sector grew by 2.36%, indicating the greater intensity of this sector in phases of economic growth, which affect the entire European economy positively and indirectly. In other words, the tourism sector was less affected in the face of an economic crisis, experiencing higher growth in the recovery period.
However, there were strong inequalities in the economic growth experienced by the EU-28 countries. If we evaluate the disparities statistically, it can be observed that in the tourist sector, the standard deviation was 1.778489 points in the period 2009–2014 and 1.934508 points in the period 2015–2018, which indicates that the disparity increased during the period of economic recovery. However, the same did not occur with respect to total employment growth; in the 2009–2014 period, the standard deviation had a value of 1.330621 points, and in the 2015–2018 period it was 0.862957, indicating that the disparities were lower in this last period.
The data also confirm in
Table 4 that the countries that grew most in the tourism sector in the period 2009–2014, such as Croatia, Belgium, and Estonia, were repeated in 2015–2018. Furthermore, the countries that grew least in the first period studied, such as Finland, Slovenia, and the Czech Republic, were repeated in the second period. However, the countries with the highest rate of growth in employment in the first period analyzed—the UK, Luxembourg, Lithuania, Hungary, and Denmark—came to occupy the last growth positions. Of the countries that grew least during the period of economic crisis and recovery, Portugal, Cyprus, and Spain were among the first countries in the growth rate of employment.
Some states have taken the decent employment indicator into account as an employment variable. This measures factors such as seniority in employment (the proportion of jobs lasting more than two years in the labor force); jobs by age groups, giving relevance to youth employment, which is why jobs held by individuals between 15 to 44 years of age have been considered; the educational level of employees, considering that the segment of employment requiring studies higher than secondary level is assumed to have a higher level of remuneration than that which does not require any type of academic training; permanence in employment, indicated by a job that does not have a limited duration; and the proportion of the workforce in full-time employment. All facets of employment have been considered because they are supposed to provide the most stability and best pay. They have been grouped based on two previously established decent employment indicators.
These indicators show that there has been a striking similarity in this variable over the two periods; in other words, the changes experienced have not been very significant. Furthermore, both indicators show a degree of correlation of over 90%, clearly indicating that the order established between the countries is very similar in both cases.
From the result of the indicators considered, as shown in
Figure 3 it appears that in the periods under review, the countries in Eastern Europe—that is, those most recently incorporated into the EU—occupied the first positions, because they have more durable jobs, which tend to be full-time and are mainly aimed at young people with a certain level of academic training. Among these countries are Slovakia, Romania, the Czech Republic, Hungary, Lithuania, Bulgaria, Croatia, Estonia, and Latvia, which repeat in the two periods analyzed as countries that occupy the first positions in the established ranking. However, among the 10 countries that hold the lowest positions are the most consolidated and oldest countries in the EU with the highest level of economic development. These countries include the Netherlands, Portugal, Sweden, Spain, Denmark, Italy, Germany, Austria, Cyprus, and Belgium, which also repeat positions with slight changes in the two time intervals considered. An explanation of this phenomenon can be deduced from the number of jobs per arrival of visiting tourists, which is presented in the following graph.
From the previous graph, it is clear that the newly incorporated countries in the EU—that is, the countries of Eastern Europe—in general generate more employment for each visiting tourist, with the percentage of employment by tourist visitor greater than the EU-28 average. Thus, taking into account the type of jobs considered in creating the decent employment indicator, among which are full-time employment of long duration aimed at the youngest and most academically educated of the population, it can be seen that these are the countries with this type of employment. This could be indicative of the fact that the countries recently incorporated into the EU have a labor-intensive tourism sector, so they need more stable jobs to meet the needs of their tourism activity.
However, the consideration of decent employment requires incorporating some variable that assesses the remuneration of workers in the tourist sector in the countries of the EU. In order to avoid the vast differences that exist between the average salaries received for employment in the tourism sector in different European countries, they have been weighted by GDP per capita in order to contextualize the salary received in terms of the level of economic development of the population. Furthermore, the values considered were measured in constant values. Taking account of the fact that data were not available for the entire period being studied, the periods considered were, in this case, 2012–2014 and 2015–2018. In addition, the graph shows the EU countries in descending order in the period 2015–2018. The results of all these considerations are presented in
Figure 4.
The member countries of the EU that occupy the positions with the lowest GDP-weighted wage indicator are, in general, the countries most recently incorporated into the EU—that is, those countries of Eastern Europe. Among them, with some exceptions such as Ireland and Luxembourg, are Lithuania, Slovakia, Latvia, the Czech Republic, Hungary, Romania, Poland, Slovenia, Malta, Bulgaria, and Estonia.
All of the above suggests that Eastern European countries are those that, from the perspective of employment, have the most significant advantages in the tourism sector. They show more stable jobs with greater seniority, more full-time and longer-term jobs, and a workforce composed mostly of young people with more academic training. Its tourism sector is very labor-intensive, but economically it is quite disadvantaged in the EU context, with wages exhibiting lower values within the economic context of each of their countries. However, these lower salary costs can become an opportunity for tourism activity, as it makes it more competitive within the EU-28. However, it is necessary to recognize how this phenomenon becomes a clear limitation with respect to the fulfillment of SDG (8), at least in terms of decent work.
3.3. Tourism Activity and Gender Equality in Employment in the EU
There are many aspects addressed by the objective (O5) of gender equality in the 2030 Agenda. In this sense, it is clear that this broad objective is to achieve gender equality and empower all women by reforming the laws and norms that allow the achievement of this purpose with adequate support and resources, as well as a responsibility to the commitments made for the rights of women. Furthermore, it is about removing obstacles regarding their sexual and reproductive health and rights, including legal restrictions and the lack of autonomy in decision-making [
5]. Of course, none of this would be possible if women did not have the same employment opportunities as men. For this reason, this section will attempt to study the employment situation of women in the labor market of the tourism sector.
Looking at employment by gender, according to the data in
Table 5, it can be seen that in terms of general employment in the sector as a whole, women have not reached 50% of total work, with employment percentages of 45.61% in the period 2009–2014 and 45.95% in the period 2015–2018. Therefore, when referring to full employment it can be seen that in the EU-28 there is a higher proportion of male employment. However, if attention is focused on the tourism sector, this phenomenon undergoes a metamorphosis. Indeed, it can be seen that this sector generates more female employment, so that in the 2009–2014 period it represented 55.78%, and in the 2015–2018 period the percentage had hardly changed, with the percentage of women’s jobs being 55.16%. Furthermore, the disparities in this regard between the countries of the EU are manifestly significant.
To focus on the tourism sector, it can be observed that the countries with the highest employment of women in the entire period analyzed (2009–2014 and 2015–2018, as the changes were not very significant over the total period of time studied) were Lithuania, Estonia, Finland, Poland, Latvia, Austria, Bulgaria, Slovenia, and Slovakia, most of which were among the last to be incorporated into the EU. However, among the EU-28 countries with the lowest percentages of women’s participation in employment, and which had not undergone any notable changes in the period analyzed of 2009–2018, were Malta, Luxembourg, Greece, Belgium, France, Cyprus, Italy, the Netherlands, and Denmark, of which the majority were countries that have been among the members of the EU for several decades and are also among the countries with the highest levels of economic development.
The absence of data on the salary differences between men and women in the tourism sector prevents introducing this element in the analysis that is to be carried out. However, such information is available, globally, for the total productive activity of the sector, although it does not cover the entire period analyzed. The gender wage gap is a synthetic indicator that measures the combined impact of three elements: (a) an average income per unit of time (the hour); (b) a monthly average of the number of hours paid (before any adjustment for part-time employment); and (c) the average income of all women of working age, whether employed or not, compared to men [
20].
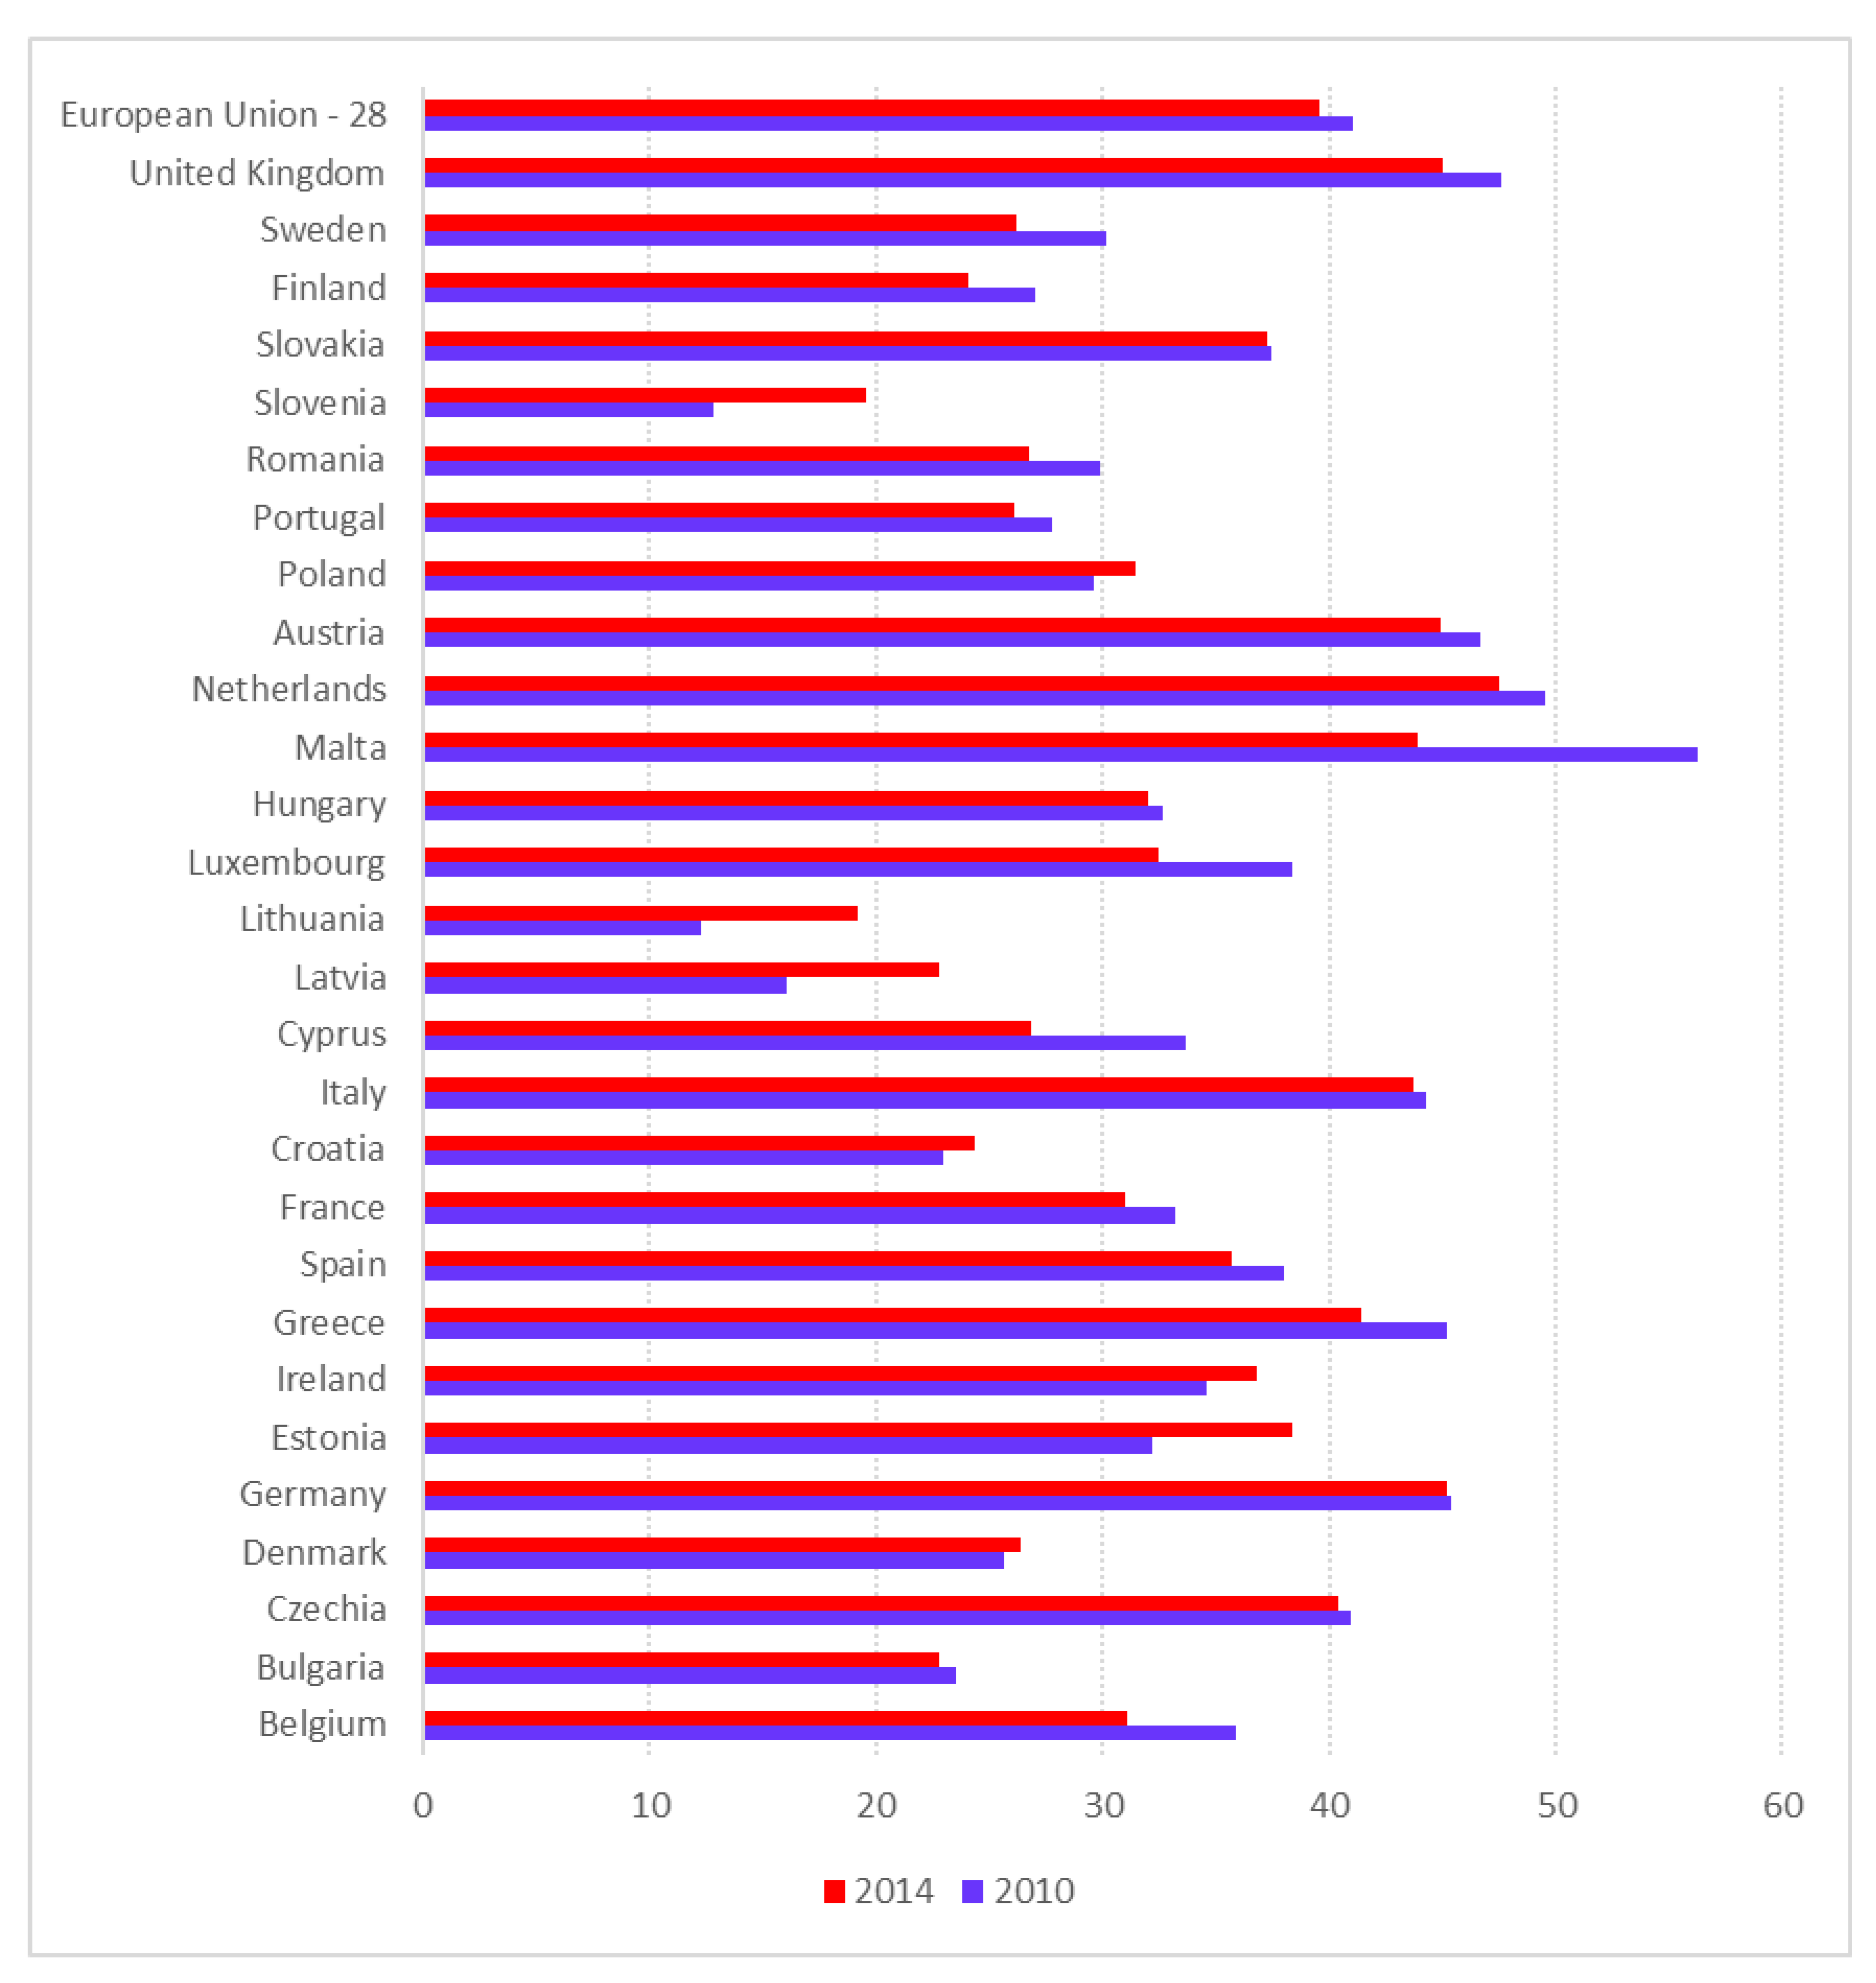
If attention is focused in the first place on the evolution of the wage gap between women and men between 2010 and 2014 (the years for which, within the period studied, there are data in Eurostat), it can be seen in
Figure 5 that the gap is reduced in the EU-28 by 1.5 points, although it is necessary to show that this reduction was not similar in all the member countries of the EU. In fact, there are countries where salary differences increased significantly between 2010 and 2014, such as Lithuania, Slovenia, Latvia, and Estonia. However, there have also been intense reductions, especially in the cases of Malta, Cyprus, Luxembourg, Belgium, and Sweden.
The value of the wage gap is very different between the countries of the EU. We used the average in the 2010 and 2014 financial years as an indicator. It can be seen in this Figure that the countries with the greatest gender salary differences are Malta, the Netherlands, the UK, Austria, Germany, Italy, Greece, the Czech Republic, Slovakia, and Spain. However, among the countries with the lowest gender pay gap are Lithuania, Slovenia, Latvia, Bulgaria, Croatia, Finland, Denmark, Portugal, Sweden, and Romania. Therefore, in this case many of the countries newly incorporated into the EU show not only a more significant contribution of women to employment in the tourism sector but also have lower wage gaps among the group of EU member countries.
Table 6 presents the correlation matrix between the variables analyzed throughout this work. There can be seen to be a relevant correlation between the level of economic development of the EU-28 countries and the KOF globalization index, especially in its economic aspect and especially in the social aspect. Furthermore, as previously explained, it presents a negative correlation both with the indicator of growth in employment and stable work and with the indicator of gender equality, since we had already found that these indicators are higher in the countries of Eastern Europe—,that is to say, in the recently incorporated member countries of the EU-28. They present the highest growth in employment and the most stable jobs and the highest participation of women in the tourism sector. In addition, it is also verified that the KOF globalization indices, in their different facets (economic, social and political) that are closely related to the level of economic development, present negative values, indicating that the countries with the lowest level of income per capita are those with higher levels of stable employment and a greater weight of female employment in the tourism industry, but they also have less remuneration at the intersectoral level (within each member state) and the intrasectoral level (within the group of countries belonging to the EU-28). In this sense, the weight of tourism activity in the EU-28 countries is negatively correlated with almost all the variables, excepting the gender equality indicator and the social globalization index.
Table 7 presents the results of the estimates that relate the importance of tourism activity in the EU-28 member countries to economic growth, the decent work indicator, the gender equality indicator, and the KOF globalization index. In order to avoid the high degree of multicollinearity presented by the decent work indicator and the KOF globalization index, two econometric estimates have been presented. We have obtained the results of the proposed estimates of fixed effects from panel data incorporating a dummy variable, representative of the impact that the period of approval of the SDGs has on tourism activity. The regressions have been corrected for heteroskedasticity using the White procedure. In general, the coefficients presented are strongly significant and the models are explanatory.
The regressions confirm the strong positive influence of the indicator of gender equality, economic growth, and the KOF globalization index on the weight of tourism activity in the EU-28 countries. This has not been the case with the decent employment indicator, mainly due to the kind of contracts that these jobs present in the tourism sector, which are mainly part-time with less seniority and levels of training. In addition, it is observed that the incorporation of the dummy variable, representative of the period of approval of the SDGs, is negative and significant, which could indicate that the approval of the SDGs in 2015 has not yet favored its possible positive impact on the importance of tourism activity. However, it is expected that the implementation of the SDGs in the tourism sector in the future can generate decent and higher quality jobs.
3.4. Analysis of Groupings of EU Countries by Position Ranking
To gain an overview of the situation of the EU-28 countries with respect to the SDGs (8) and (5) (although since 1 February 2020, the EU-27 is discussed, following Brexit), the positions of countries that make up the first and last 10 positions in the ranking of each of the employment variables studied are presented below, allowing us to analyze the similarities and differences between the member countries of the EU (
Table 8). To this end, because the agenda is scheduled to take place until 2030, the data will be taken from the starting period of the agenda—that is, from the period 2015–2018—taking into account that, in the two periods analyzed, the changes in position between the countries have not been very significant. This will allow us to understand the starting situation after the promulgation of the SDGs and their incorporation by the World Tourism Organization (UNWTO) into the tourism sector.
In the groups of countries that showed analogous behavior with respect to each of the variables considered, it can be observed, in general terms, that most of the countries with the highest levels of GDPpc are among those with the lowest growth in employment in the tourism sector, showing a lower indicator of stable and decent jobs and a lower indicator of gender employment (bearing in mind that only gender hiring is considered).
However, in general it can be observed that the countries with the lowest GDPpc have higher growth in tourist employment, more stable and decent employment, and a higher number of women hired in the sector analyzed due to the phenomena that were previously discussed. These countries perform well on these indicators relative to the rest of the EU-28 because their lower level of economic development (GDPpc) is accompanied by a higher employment rate related to tourism, meaning that their tourism sector is a highly labor-intensive productive activity. However, the member countries of the EU with the highest levels of development (measured by GDPpc) have a less labor-intensive tourism sector, which is why they use temporary, part-time, and seniority-based contracts more frequently. Employment is much lower, and disparities in hiring by gender are lower than in countries with lower levels of economic development. On the other hand, when comparing the level of economic development with the weight of the tourism sector measured from the participation of tourism sector employment in the total employment of each country, it is observed that countries with higher levels of GDPpc place less value on the tourism sector in their productive system, which suggests the importance of the tourism sector in the newly incorporated countries and in those of the southern EU-28 (Italy, Portugal, Greece, and Spain).
Additionally, taking into account the remuneration of the countries in the tourism sector, it is found that the countries of Eastern Europe have lower GDP-weighted wages, thus losing an advantage in the decent nature of work, but that they can turn this into an opportunity that would make their tourism sector more competitive in all the EU-28 member countries. Concerning the wage gap, it was verified that the countries with the smallest differences are, in general, the countries most recently incorporated into the EU, so this gives them privileged gains in the SDG (5) on gender equality.
4. Discussion
There is no doubt about the capacity of the tourism sector as an engine of economic growth, as manifested in foreign exchange earnings; contributions to private and public income; job creation; incentives for the creation of technologies; and the formation of human capital, business opportunities, and the drag effect on other productive sectors, as numerous scientific works have shown [
10,
21,
22,
23,
24,
25,
26,
27]. It is a sector of global importance and presents rapid growth and a source of job creation, contributing significantly to the generation of GDP. The expansion of tourism in 1990 was unmatched, generating 1 out of every 11 jobs in the world and representing around 9% of the world GDP [
28]. However, the negative consequences or externalities of the overexploitation of this activity are no less real, presenting disadvantages related to environmental, economic, and socio-cultural aspects [
29,
30]. There are attempts to address these stated drawbacks in the implementation of so-called sustainable tourism, consequently minimizing the negative consequences [
31,
32,
33] and trying to reflect the finite limits of the ecological, economic, and social sustainability of this productive activity [
34,
35,
36,
37]. Sustainable development and environmental protection, from a global perspective, have been treated with a special interest in the case of the Central and Eastern EU [
38].
In this way, economic objectives are described as key elements of well-being, while environmental sustainability is considered an instrument to maintain tourism demand. In this sense, the competitive aspirations of the countries are often opposed to the cooperative action necessary to reduce the environmental damage generated by international tourism. It has been stated in some scientific research that tourism is addicted to growth, being incompatible with the objectives of sustainability [
39]. This sector has been studied based on its economic competitiveness from a perspective that privileges the search for economic profitability [
40,
41,
42,
43], although this aspect of competitiveness has also been studied within the framework of a sustainable tourist activity [
44,
45,
46]. Despite the open debate in the 1980s, tourism authorities continue to promote the development of tourism activity, despite existing ecological and social limits, on a planet with limited resources [
47]. In fact, the EU promotes a tourism policy that tries to stimulate the competitiveness of countries in this sector, facilitate more motivated and lasting employment due to the drag effect that this sector has on other productive activities, encourage innovations and the use of technology, strengthen the development of sustainable tourism, and promote the Europe brand in a coordinated way among the member countries of the EU [
48,
49].
Recently, convergence has been found in the concepts of sustainable development and the social economy. These refer fundamentally to social entrepreneurship or social cooperatives [
50,
51], which are initiatives capable of responding to the emergence of new needs and changes in society in a sustainable way. They try to show how social enterprises aim to create sustainable development, building inter-organizational and intersectoral collaboration networks that enable progress in local development. A certain degree of hope is maintained in public–private collaboration as a future tourism strategy for obtaining sustainable growth [
52] and even closing the existing gap between sustainability and intelligence still existing in the field of research and the management of tourist destinations by taking advantage of the opportunities offered by information and communication technologies, which would favor more efficient and sustainable management [
53].
Since the approval of the Sustainable Development Goals (SDGs) in September 2015, a plethora of works have emerged that try to link these goals with tourism activity [
54,
55]. In this sense, as previously explained tourism generates economic prosperity, equity, and social cohesion, but it also induces pollution, degradation, and consumerism, which makes it necessary to apply sustainability measures to this productive activity [
56]. Taking advantage of the impact on tourism activity of the International Year of Sustainable Tourism for Development in 2017, an attempt was made to analyze the tourism potential from four dimensions that highlight sustainability, such as (a) territorial inequalities and conditions of poverty; (b) the level of tourism development; (c) the commitment of public institutions to tourist activity; and (d) the access of the population to the benefits generated by tourism. The results obtained from this analysis called into question whether tourist activity is the cause of the development of a destination or, on the contrary, if it contributes to underdevelopment [
57]. However, the above has not been an obstacle to questioning the ideas of sustained and inclusive growth within SDG 8—that is, in the objective of decent work and growth adopted by the United Nations World Tourism Organization (UNWTO) in the 2030 Sustainable Tourism Agenda [
58]. In this sense, it maintains that the SDGs for inclusive growth are in contradiction with the principles of growth, competitiveness, and obtaining profitability that drive the expansion and development of tourism activity. It has even been claimed that tourism activity maintains job insecurity, even considering the lack of job security when referring to capitalist economies, widening social divisions and economic inequalities [
59]. Lately, the highlighting of the role of dignity in employment has contributed to the theoretical debate on sustainable tourism, generating discussion of this facet in the workplace and causing it to be valued [
60]. The roles people and employment play in the concept of sustainability are being discussed, and that they are sometimes overlooked in discussions of tourism has been called into question. The connections between the tourism workforce and the policies that can be adopted to achieve more stable employment through a sustainable human resource management model as a means to contextualize work in the tourism market should be recognized [
61]. In short, it is necessary to transform current tourism activity into a new, socially responsible, productive activity [
62]. In this line, so-called solidarity tourism has recently emerged. This is defined as economic activity in which the tourist activity is carried out fundamentally for the benefit of the directly affected populations, especially in developing countries. This type of tourism must fulfill two premises: (a) the minimization of the impact on the environment, trying to conserve local heritage, cultures, traditions, and the environment; (b) the strengthening of local societies. However, it is necessary to indicate that this type of tourism generally has a series of characteristics: (a) it is more expensive than traditional tourism; (b) the reasons for carrying it out are, above all, to help and learn from the local community; (c) it contributes wealth and generates employment in its geographical areas; (d) the EU has been developing a policy to support the territories that carry out this type of tourism; (e) despite the importance of this type of tourism, it is not exempt from the degradation of the environment, the transformation of social structures, or the deterioration of the local culture [
63,
64].
A recent study has critically analyzed how SDG 5—that is, the goal dedicated to gender equality—is related to tourism activity and how tourism and gender equality are interconnected with SDG 8 (sustainable economic growth and decent employment) [
65]. In light of the existing global inequality, it is necessary to know how to make tourism activity more inclusive. For this, it would be essential to use tourism as a tool for social integration in Europe, and for the private sector to assume more responsibility in this regard [
66]. This creates a key challenge to achieve social change through inclusive tourism, given the existing limitations both within the tourism sector and in the political economy in general. Along these same lines, in recent years efforts have been made to evaluate the opportunity to build a more responsible tourism sector committed to global development goals. For this, issues surrounding the concept of inclusive and sustainable economic growth need to be addressed, and efforts must be made to address key factors such as social inclusion, gender equality, unemployment and poverty reduction, the efficient use of limited resources, environmental protection and climate change, cultural values, diversity and heritage, mutual understanding, and peace and security [
67]. Ethical principles linked to gender equality, equity, and justice—dimensions that are still scarcely addressed in the scientific literature—are necessary to tackle climate change and the scarcity of resources with certain guarantees. To this end, the creation of a frame of reference that allows sustainable tourism to be placed within a paradigm that includes these aspects is proposed [
68].
It is necessary to recognize that there are still inequalities in employment in the tourism sector in general. These disparities are clearly shown in salary levels, in professional categories and access to managerial positions, and even in the division of labor into full-time and part-time positions [
69,
70]. The tourism sector, in particular, has a higher proportion of female employment, but there is a need for female employment that is not marked by the sexual division of labor, by precariousness, by few possibilities for professional promotion, and by a wage gap and job insecurity [
71,
72,
73]. Working in collaboration with supranational and national institutions in order to strengthen gender equality in the tourism sector and contrast the existing problems between tourism and gender equality in different socio-cultural contexts [
74,
75,
76,
77,
78] is recommended to resolve this issue.
5. Conclusions
In general, the scale of values in the social sciences is undergoing great mutations. The member countries of the EU, given its great global potential, should not be oblivious to these modifications. The growth of economic sectors must adapt to the dynamics experienced in the operation of productive activities which aim to improve economic, institutional, and environmental sustainability. The present study has as its main objective an exploratory analysis of the progress in tourist activity in the countries of the EU over the decade 2009–2018 and its adaptation to the Sustainable Development Goals from the perspective of employment. In particular, the capacity of adjusting the employment of the tourist activity to the objectives of decent work and economic growth (O8) and to that of gender equality (O5) is analyzed, with the purpose of establishing the opportunity for adaptation within the proposed time horizon for the development of the SDGs.
From the application of the methodology referenced, it is concluded that tourism is a prolific and productive activity within the productive fabric of the EU, not only for GDP and the employment it generates but for the indirect effect it has on the whole of the economy. However, the exploitation of these tourist resources gives rise to negative externalities, putting pressure on the environment. The solution comes from the modification of productive activity to make it more sustainable. Along these lines, in 2015 the UN established the Sustainable Development Goals (SDGs), whose purpose was, in general, to eradicate poverty, reduce inequalities, and limit the negative impact of productive activity on the environment. UNWTO adopted these SDGs for application in the tourism industry with the intention of establishing a productive sector, generating wealth and employment, that is also adapted to new social, economic, and environmental needs.
This study has delved into the impact that the incorporation of SDG (8), economic growth and decent employment, and SDG (5), gender equality, have had on the tourism industry in the EU-28 countries. A trend towards convergence is observed in the level of economic development of the EU member countries, measured using the sigma convergence indicator, indicating a decrease in economic disparities between the different member states. However, the dispersion in GDPpc is still very wide among the states.
Regarding the SDG (8), it has been observed how employment has experienced significant growth since 2015 in the tourism sector, this being more stable in the countries that were newly incorporated into the EU due to the greater intensity of use of the labor force in tourism in those countries. However, the remuneration received in these countries weighted by GDPpc is lower, so decent employment is not a quality that these countries can present compared to the oldest countries in the EU.
Gender equality, SDG (5), remains an issue that presents serious inequalities. Although women play a predominant role in participation in employment in the tourism sector, in general terms it is the countries in Eastern Europe that show the greatest contribution of women in jobs in the tourism sector. However, the pay gap between women and men is still relevant. Although this gap is lower in the countries that were newly incorporated into the EU, they also have lower overall levels of remuneration among the member countries of the EU-28.
This study confirms that the disparities in the tourist industry continue to be very intense between the member countries of the EU, concerning the objectives of economic growth and decent employment, the objective of gender equality, and the weight of the tourism sector. It is evident how, from the perspective of employment, the EU member countries present enormous differences. The newly incorporated countries show higher growth in employment, have better employment indicators, and the participation of women is higher than that of men. However, remuneration levels are clearly lower than in the most deeply rooted countries, and the wage gap is significantly larger than in the countries of the EU with the highest level of development. Logically, these circumstances greatly hinder the objective of social cohesion intended at the European level. Therefore, it is required that public authorities take measures and carry out strategies that reduce these existing differences in the analyzed SDGs.
The results of the determined regressions show that economic growth, the gender equality index, and the KOF globalization index have had a positive impact on the weight of tourism activity in the EU-28 countries, especially in the case of Eastern European countries, of recent incorporation, and those of the South of the EU-28. Deepening the implementation of the SDGs in the tourism sector is expected to facilitate the creation of decent and quality employments in the future.
It is evident that the member countries of the Eastern EU—that is, those that have recently joined the EU-28—have higher levels of work growth and more stable jobs as well as the greater participation of women in tourism, despite being the ones with the lowest level of development and the lowest values in the KOF globalization index economically, socially, and politically. In this sense, we suggest an active intervention of the European institutions to allow the tourism sector in these countries to be expanded and improved, which would favor a process of convergence and social cohesion between the countries of the EU-28, consequently reducing economic disparities.
Therefore, there is still a lot of work to be done and effort to be made in this regard. It is necessary to strengthen the awareness of the fabric of the tourism business and of supranational, national, regional, and local public administrations which favor the achievement of more stable and decent employment, as well as the achievement of true gender equality, not only in the generation of employment but also in more equitable remuneration between men and women in this sector, consequently reducing the current wage gap.
Although an attempt has been made to evaluate all the possible characteristics of employment to address the stated objective, it is necessary to recognize that among the limitations presented by this study are the following: (a) the lack of quantitative data on the representative variables necessary to be able to conduct the study; (b) the difficulty of accessing statistical sources prepared by institutions that measure the indicators used as objects in the present analysis; (c) the obstacles that researchers have encountered in obtaining data over the entire period studied; (d) the official statistical sources consulted sometimes do not offer certain data for all member countries of the EU; (e) the absence of homogeneous statistical sources on the European level, except those presented by Eurostat and the European Central Bank. The selection of the sample was due to the existence of homogeneous data for all the member countries of the EU, which allowed the exploratory analysis of the situation and of the evolution of the countries before and after the approval of the SDGs and their adaptation to tourism by the UNWTO.
Finally, this work opens up possibilities for future lines of research based on the exploratory analysis of the evolution and situation of SDGs 5 and 8, as well as the application of this model in new studies that may: (a) intensify the search for new quantitative indicators that would allow a contrast in the exploratory analysis to be carried out; (b) extend the study carried out to other territorial entities, such as the regions of the EU; (c) apply the exploratory model of the study carried out to other territories not belonging to the EU; (d) expand the search for official databases that would allow this study to be extended in order to analyze the evolution of the territories on the sustainable development objectives examined.

 ,
, 


