1. Introduction
In the era of upraising technology, changes are required as a basis for organization to improve performance and growth. Many industries have been faced many transformations in the last decade. Dramatically changing the way organizations are conducting business with their customers as well as how products and services are being developed, manufactured, and delivered [
1]. Currently, new phenomena such as servitization and industry 4.0 had shaped businesses’ approach. Theses had an impact on the organizational business model and digital transformation strategies. Servitization is a strategy change process where in manufacturing companies embrace service operation and/or develop more and better services, with the aim to satisfy customer’s needs and wants, achieve competitive advantages and enhance organization performance. Apart from this, servitization provides unique value to customers by integrating manufacturing and service operation activities [
2].
On the other hand, the industry 4.0 revolution was entirely based on the new technologies, mainly in computer and information technologies. With the introduction and the use of Internet of things, cloud services, big data, artificial intelligence, various algorithms result in integrated systems providing excellent customer service for the organization activities. Furthermore, a customer can manage their information in the integrated system. Besides, big data has becoming fuel and source of decision making. The organization’s performance varies significantly depended on whether big data complies with the decision-making procedure. Due to this, big data management can be used to moderated variables that moderate performance variables in system activities.
In the Korean public sector, big data management was being used to rationalize decision making in uncertain condition systematically. Many public sectors have well-developed quality based on big data management. However, they often tend to be product oriented rather than service oriented. Public sector organization must look beyond product orientation and pay attention to big data management. Big data management had become an important factor for public institution, even though there is uncertain on the big data availability for public uses [
3,
4,
5,
6].
In uncertain condition, total quality management and customer satisfaction are not only key factor of success but also competitive competencies for the organization’s survival. The performance excellence based on quality and customer satisfaction is absolutely essential for organizations to succeed in highly competitive business world. Customer satisfactions played a major role successfully in the public sector. Complement, complaint, and feedback were taken into consideration in which resulted in public sector success. Valuing the customer or citizen feedback and applying changes and improvements was a major success in the public sector [
7]. By managing customer-related big data, one can discover not only the potential needs of customers but also customer wishes.
In this study, we focus on the public sector that applies total quality management, which has been mainly used only in the manufacturing industry. The reason for the existence of the public sector is to receive respect and love from customers or stakeholders. For the public sector to grow interest and be respected by customers, all members of organization should focus on providing inspirational services with consensus among the CEOs.
Our research comprises three objectives. First, a research model and related hypotheses are offered based on a strong theoretical finding of total quality management and customer satisfaction. Second, the purpose of this study was to verify the moderating effect of big data management between leadership, which is the source of total quality management, and total quality management activities. Finally, the purpose is to present and empirically analyze research models and research hypotheses related to customer satisfaction improvement through total quality management and big data analysis. In order to strengthen quality competitiveness, we will empirically analyze moderated effect of big data analysis through empirical analysis for public sector employees who actually use big data management and big data analysis.
2. Theoretical Background
2.1. Total Quality Management
After 50 years since Total Quality Management (TQM) began to be popularized in the management literature, organizations still struggle to implement and sustain various programs of continuous improvement despite the central importance of TQM to maintaining business competitiveness [
8]. The TQM have evolved from reactionary influences against the mechanistic model of management, such as a series of steps inspection, quality control, quality assurance to the organismic model, which is a new way of thinking about the management of organization and stakeholders of organization. TQM remains a critical issue, not only in manufacturing, but also in healthcare, service, not-for profit organization, and indeed, in every organization [
8,
9].
The Fourth Industrial Revolution is coming, and TQM is changing almost all aspects of human life, including the culture of quality and total quality management in industry. Total quality management is a critical issue in the stages of plan–design–production–marketing–sales, and data-oriented multiway interactions for creating new value and quality [
9]. Industry 4.0, referred to as the fourth industrial revolution, is becoming part of business life and it fundamentally influences the quality of business processes and products. In particular, intelligent technologies that are indispensable in this industrial revolution play a dominant role [
10].
Numerous not-for-profits organizations are adopting quality principles because of their impact on the public and society [
8]. Quality management ideology had been proven to have a good business practice in both private and public sector. Total Quality Management is a management philosophy with a vision aiming at building a corporate culture characterized by increased customer satisfaction through continuous improvement in which all employees actively participate [
11]. It is said that the success or failure of comprehensive total quality management depends on leadership, human respect, continuous improvement and management by the fact [
12,
13].
Leaders establish direction of the organization and vision. Top management leadership is the origin of total quality activities [
11,
12]. It is impossible to improve operation management (process management, service design) without top management leadership [
8,
12,
14,
15,
16]. It is said that 85% of quality responsibilities are from the top management. Leadership is the chief executive’s constant effort to provide exceptional quality. A lack of top management commitment and passion for the implementation of TQM has emerged as a possible reason for the failure of TQM system in an organization. Furthermore, quality leadership is characterized by striving for employee satisfaction and customer satisfaction for quality innovation and actively listening to the opinions of employees in the decision-making process. Employee satisfaction and customer satisfaction are closely related to human respect [
13,
14]. Moreover, continuous improvement can be achieved by constantly trying to scratch the itchy areas of the internal and external customers. The following
Figure 1 is the key component of total quality leadership [
14].
In summary, the main features of TQM and tools comprise three main elements, which are customer satisfaction, employee involvement, and continuous improvement. Total quality management leadership enable organization to achieve positive effect within the workplace. Leadership supports quality activities, business operation and business success.
2.2. Big Data Management
Data are the very lifeblood of science, technology, and engineering, and in more recent years have begun to play an increasingly central role in economics, finance, politics, and business [
17]. In the fourth industrial revolution era, four distinctive approaches are introduced for implementing the multiway flow in real-world applications. The four approaches, which utilize big data, Artificial Intelligence (AI), Internet of Things (IoT), and more, are composite dimension, team creativity, total inspection, and new valuation [
9]. Of these four, big data is at the center of current status and decision making. Big data is an ocean of data and information and we swim every day. It is the vast zeta bytes of flowing data from mobile devise, laptops, machine sensors and computers. Organization can analyze, store and manage data by using immense of big data tools for gain valuable insights which is previously unimaginable [
4,
18]. Currently, there is increasing interest in deep learning, which is a technology for realizing big data-related artificial intelligence (AI) in business. Currently, there is increasing interest in deep learning, which is a technology for realizing big-data-related artificial intelligence (AI) in a business. In addition, it is strong to make analysis results using powerful deep learning libraries as a source of decision making and value creation [
7,
17].
Big data analysis is the fuel and source of decision making [
6] and it has become important to manage complex customer needs systematically. The aim of big data management is to capture meaningful information in order to exceed customer expectations. Big data tools and the environment has proven beneficial in extracting hidden information and creating innovation, this implemented in industry 4.0. Big data analysis for digital transformations creates
disruptions triggering
strategic response like value creation from organizations [
4]. Today, machine learning and artificial intelligence based on big data are actively used in the private sector as well as in the public sector to secure customer knowledge and target marketing [
5]. Securing, analyzing, and visualizing customer-related big data has become a source of organizational competitiveness [
6]. In the process of analyzing big data, organizations can understand customer needs, share best practices, and keep informed of continuous improvement and innovation.
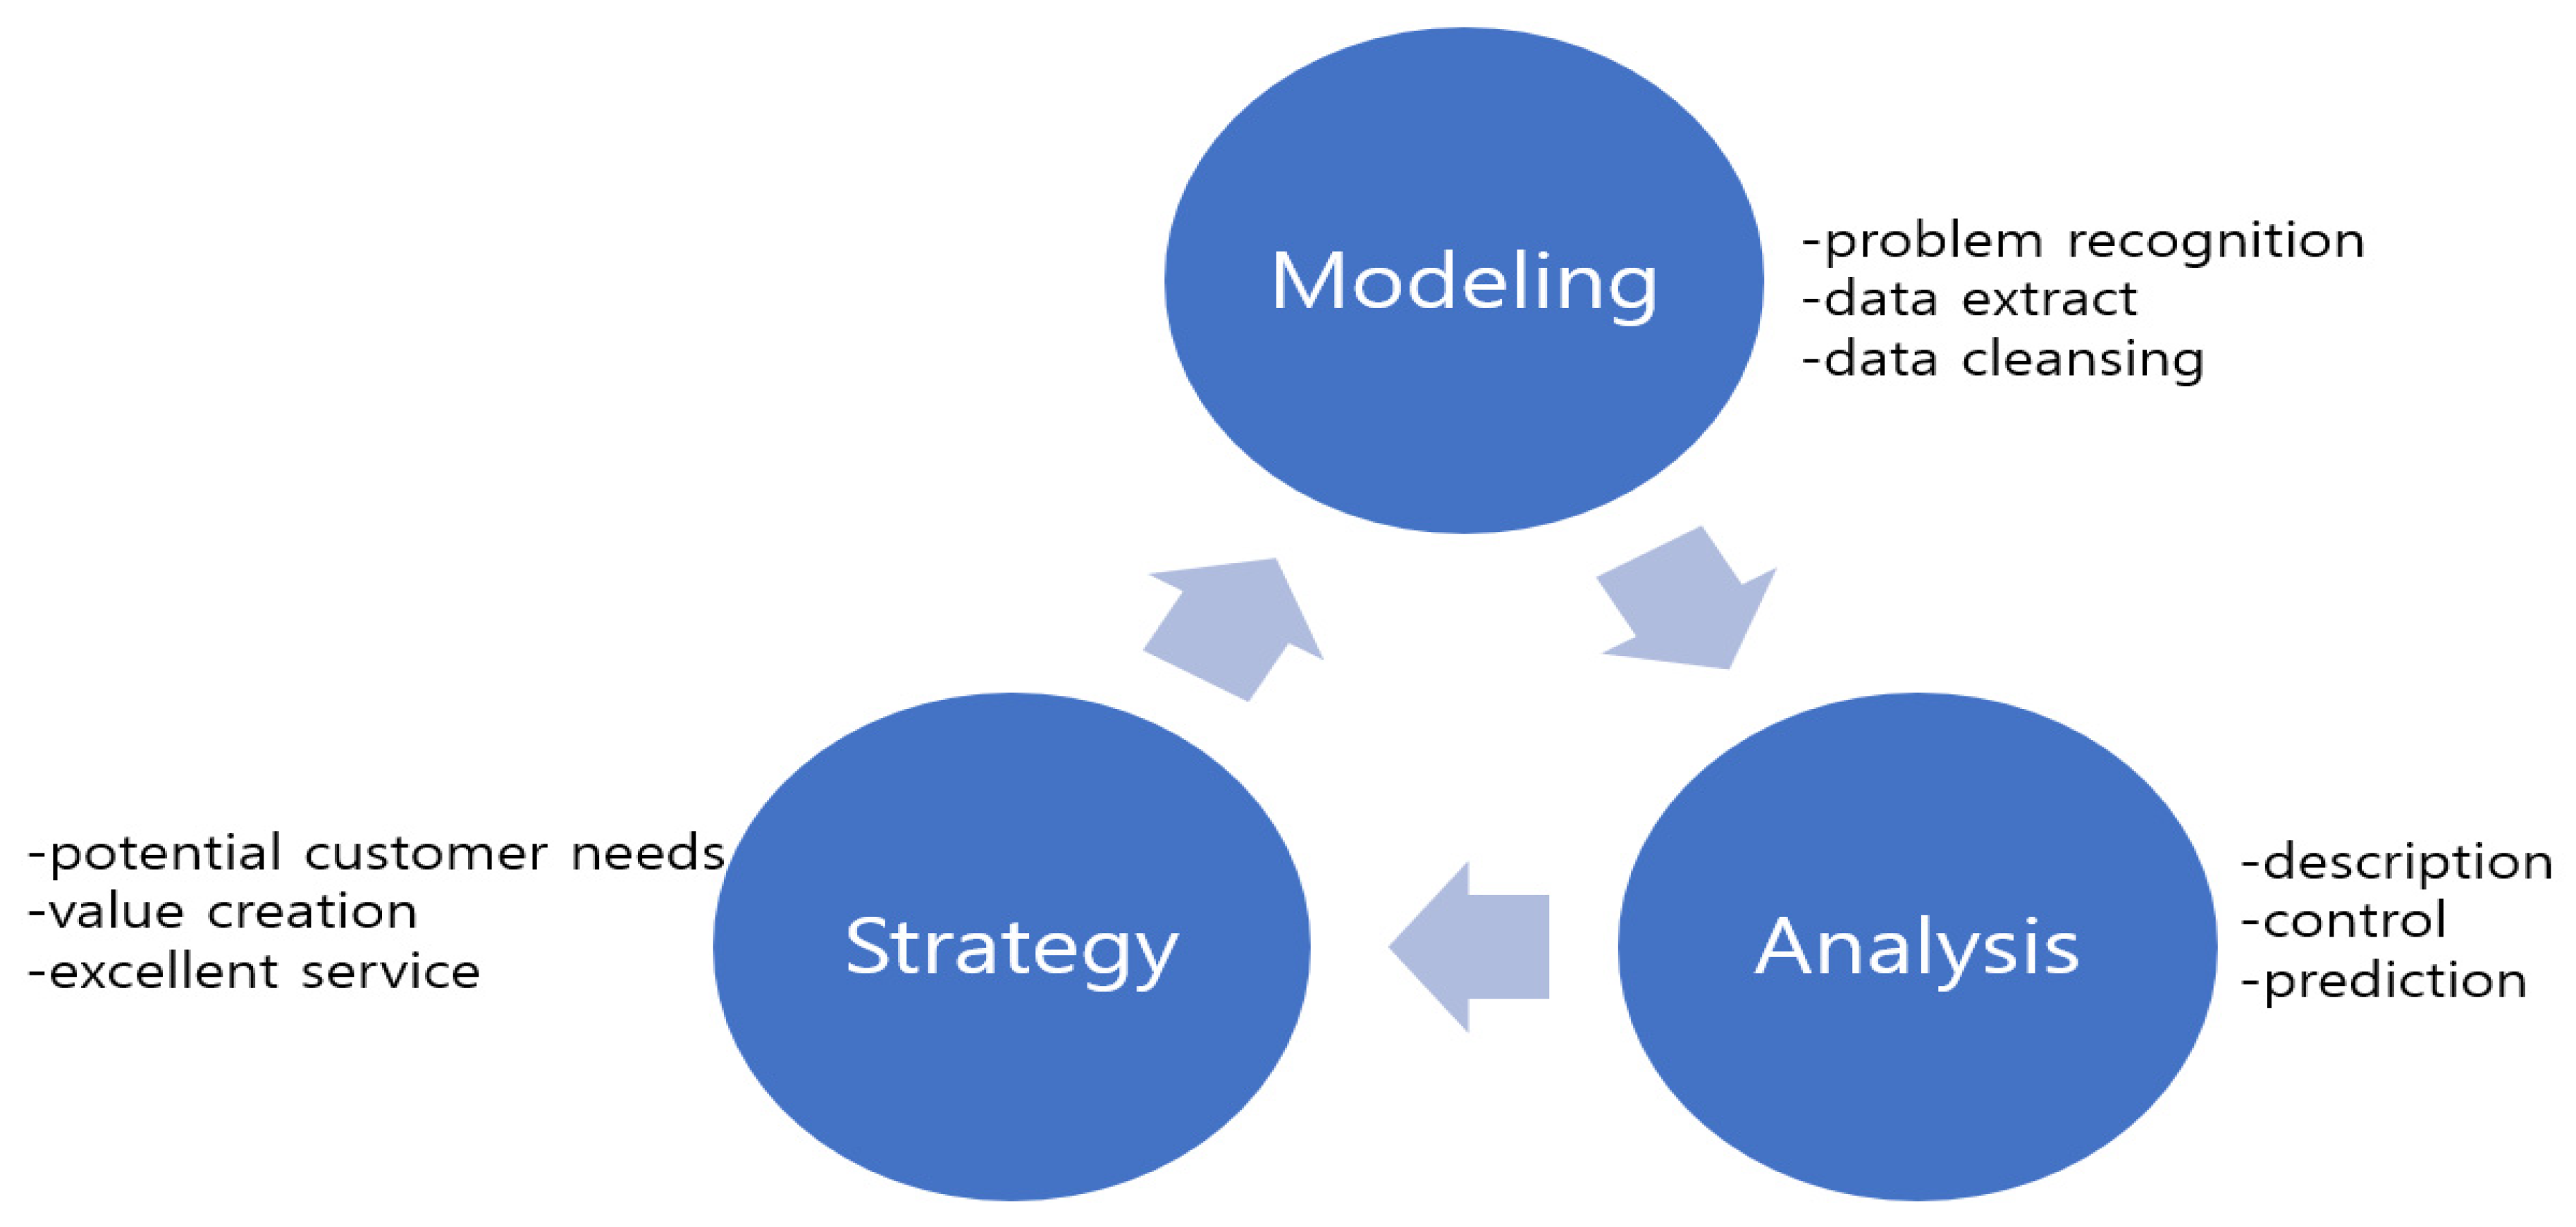
The so-called ‘MAS (Modeling Analysis Strategy)’ is important for systematic big data management in the public sector [
7].
Figure 2 depicts the big data management using the ‘MAS’ approach [
14].
The modeling phase is the process of establishing a model, managing customer-related data and purifying data. The function of this model begins by managing the model and a data source by data management skills. The model is an abstraction of the reality. The model contains problem for customer in hope that public sector would resolve the issues to attain the customer’s needs. By analyzing various models and applying them to current issues, we can determine the model that solve customer problems. Even in the process of accumulating and purifying data, customers’ potential needs can be roughly found. Data management in the public sector includes both qualitative and quantitative data. In the big data analysis process, data collection and refining account for more than 80% of the total work and it is important.
Next, the procedure to resolve the customer’s needs on big data is the analyzing phase, where one determines a suitable model and data. The purpose of the analysis is broad, which include description, control and prediction. The description mainly uses visualization to identify the pattern of data. Basic statistical analysis can be used in this process. Control refers to the process of controlling variables in the model with a low impact on performance variables. In this process, regression analysis, classification analysis and machine learning are mainly used. Prediction is the process of exploring a model with a good fit of the model and verifying the cross-validity of the hold-out sample. In the analysis process, it is important to find the optimal model that describes voice of the customer. Machine learning and artificial intelligence are mainly used in the prediction process. Repeatedly performing this analysis can find a suitable model and significant variables related to the customer. The highlight of the analysis process is the visualization of the results. Visualization is a powerful force that allows you to immediately recognize the characteristic parts of the analysis results [
7].
The next step is to establish a strategy. The strategy is a differentiated plan to provide unique value to customers. Strategies start with potential customer needs and wants. In fact, a public sector in Korea found the potential needs of customers through big data analysis. As a result of text mining of complaints from customers uploaded on the bulletin board of the city hall in Korea, customers were strongly demanding parking space problems, unfriendly public officials, illegal parking control and improved service quality. The mayor that received the results of this big data analysis prepared a response strategy and immediately prepared and implemented a strategy to immediately improve the inconveniences of citizens [
18]. In the public sector, it is possible to determine the quality improvement priority and decision direction through text mining or deep learning on the website’s suggestions or customer complaints [
7].
In summary, big data analysis in the public sector includes modeling, analysis and the strategy-making processes. Systematic strategies based on data can be established through big data analysis and with this system strategies, service operation and total quality management activities vary depending on whether active big data is managed.
2.3. Customer Satisfaction as TQM
In product production and service provision, customer-oriented quality priority should be established. TQM (Total Quality Management) had shaped the structure of organization procedures mainly in-service sectors. TQM creates a business structure that leading towards customers through value creation. A positive and well-established value creation will lead to achieving organizational goals and motto. From a causal point of view, total quality management activities have a significant effect on customer satisfaction, a performance factor. The aim of customer satisfaction efforts is to improve marketing, build a more customer-focused culture, enhance customer loyalty and identify opportunities for innovation [
8].
Satisfaction is the consumer’s overall response. Customer satisfaction cannot be overstated. It drives customer loyalty [
12]. Customer satisfaction can be said to be the difference between the customer’s expectation and post-experience. Due to the characteristics of the private sector and the public sector, customer satisfaction differs. The private sector focuses on providing private values, while the public sector focuses on providing public values. In the private sector, exchange for customer satisfaction takes place in the form of goods and services. On the other hand, successful service performance in the public sector leads to love and respect. Achieving customer satisfaction in the private sector can result in repurchase and favorable word-of-mouth and, in the public sector, civil happiness and social contribution [
19,
20,
21]. The following
Table 1 summarizes the characteristics of customer satisfaction in the private and public sectors.
Due to the nature of the public sector, it is absolutely necessary to discover the potential needs of citizens in advance and increase citizen satisfaction. As these processes continue to be systematically developed, citizens develop a love and respect for public service providers. By having total quality management within the organization, it could improve the overall customer satisfaction and also add customer values, which resulted in a better performance.
In summary, customer satisfaction shows a positive correlation between quality service that leads to customer loyalty. Customers with high customer satisfaction will continue to deal with institutions and will develop love and respect for them. Satisfied customers help creating new customers by increasing the frequency of repurchases and word of mouth for services.
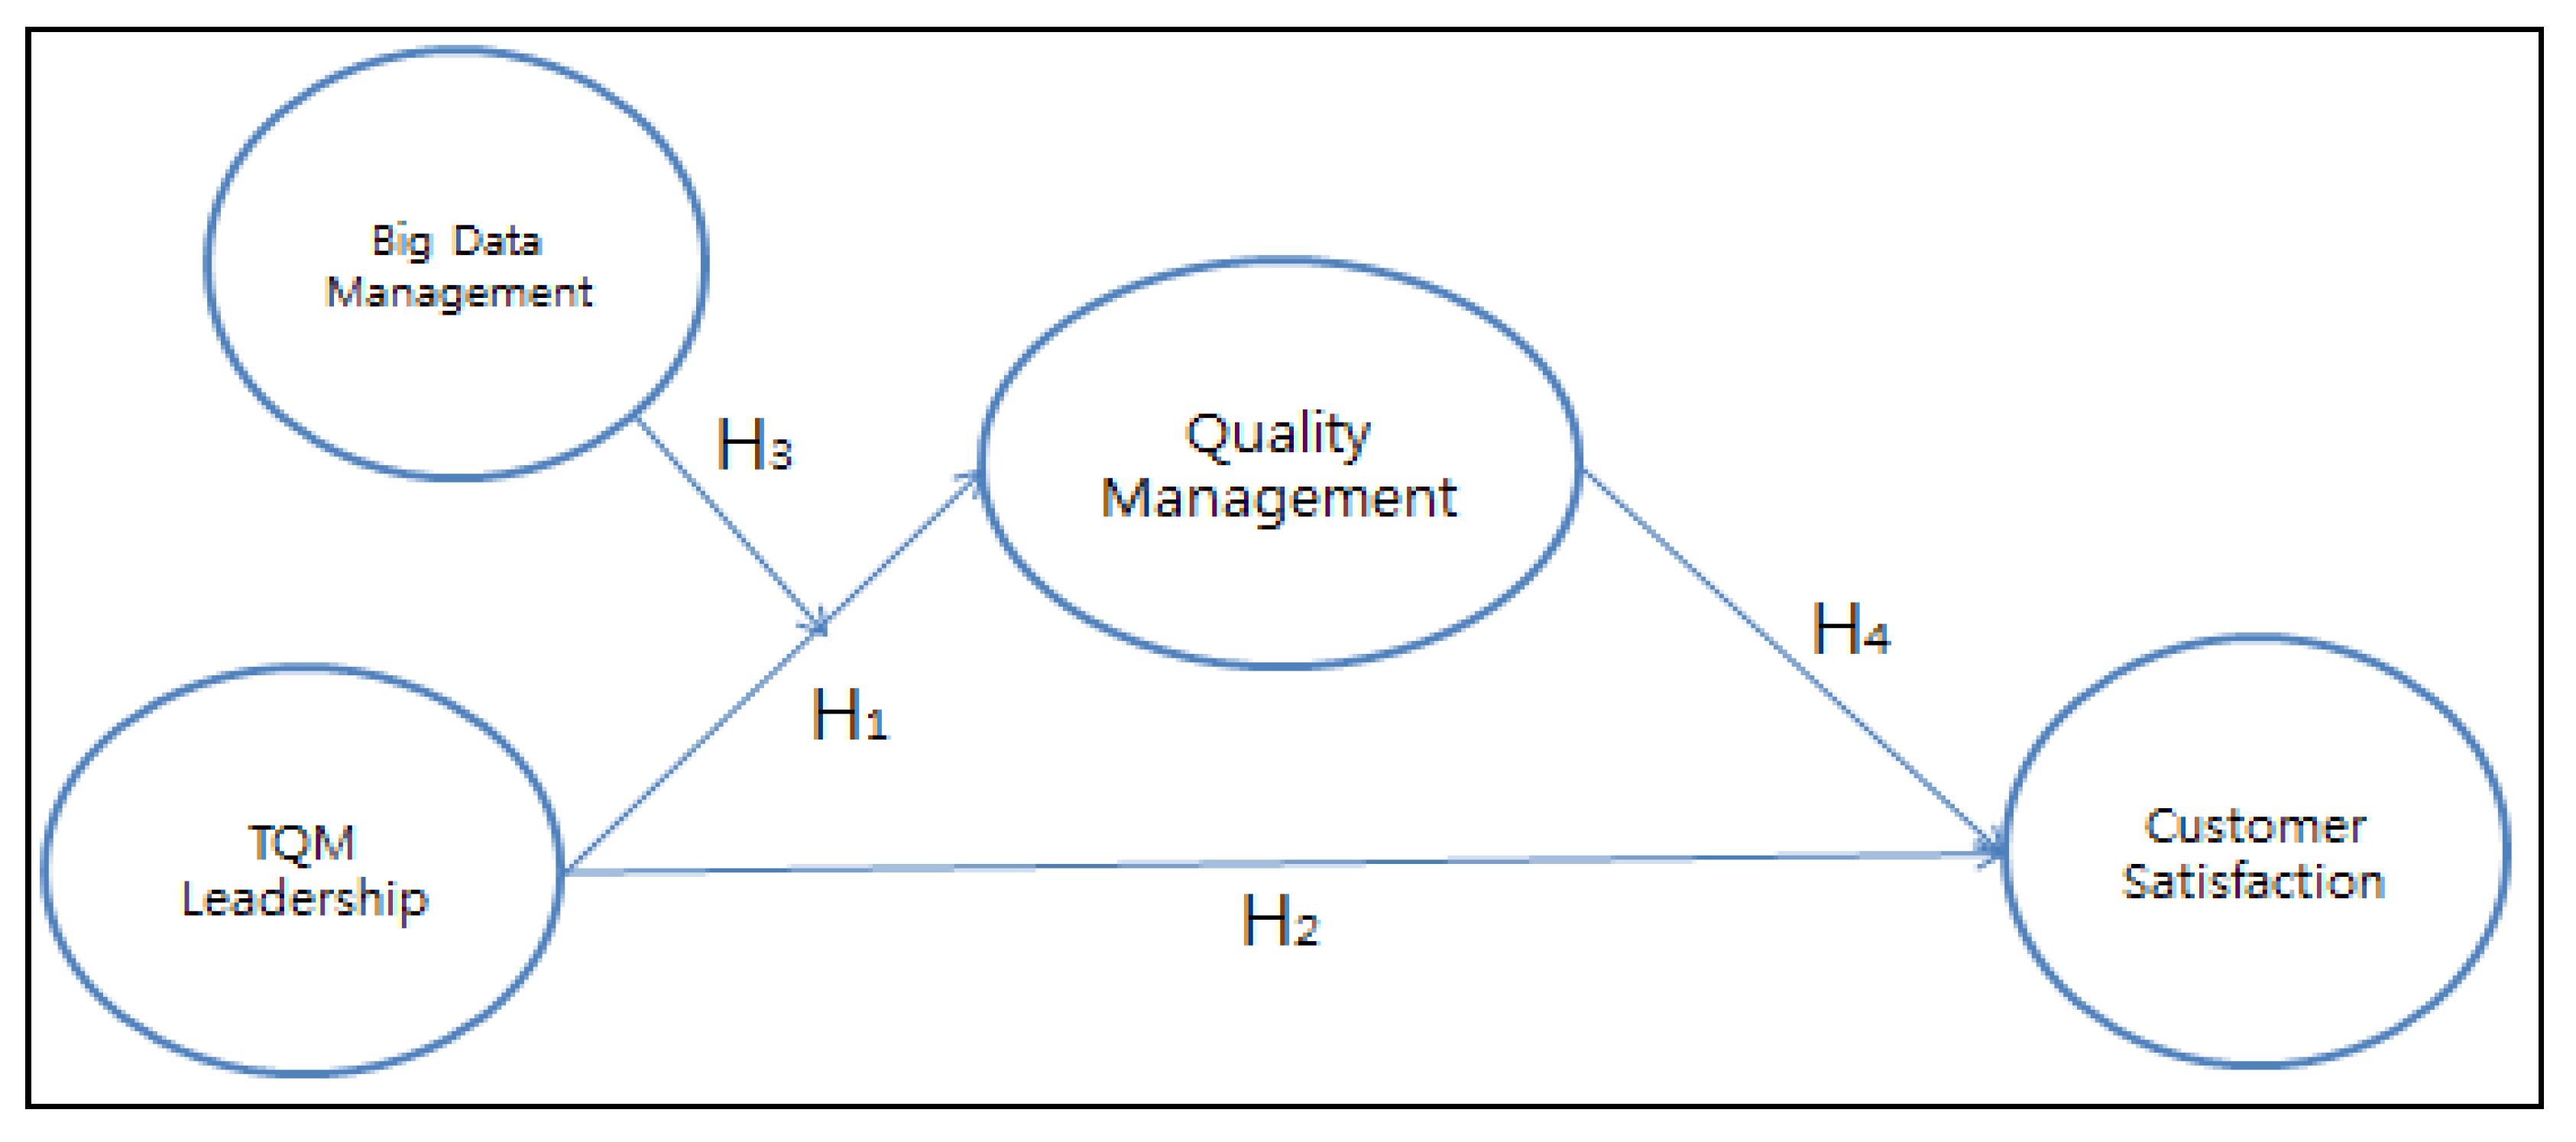
3. Research Model and Research Hypotheses
The research model summarizes the direction of the study. The research model is a summary of the current phenomenon. This study focuses on leadership as the source of total quality management as an independent factor and examining the effect of quality leadership on the total quality management and customer satisfaction [
13]. We conduct testing the moderating effect of the big data management factor, which is the second independent factor between quality leadership and total quality management activities. This is because the content of the total quality management activities varies depending on whether or not the customer’s needs are continuously reflected in operational activities through big data management.
Figure 3 shows the research model pursued by in this study.
Total quality leadership is a crucial factor in the total quality management, service design and innovation [
13]. Depending on the attitude of the organization’s leader toward total quality management, the impact on organizational members and customers can vary greatly. The quality leader of the service organization establishes, whether purposely and unintentionally, climate or culture that prescribes the norm of behavior or set of values to guide total quality management in the organization [
12]. Organizational performance changes when leaders demonstrate dedication and attitude to achieve exceptional quality. The reason why the evaluation score of leadership is high in the private and public sectors is that the quality leadership quality determines the success or failure of total quality management activities [
8,
12,
13,
14,
15,
16]. The following research hypothesis can be set as the influence on the total quality management activities and customer satisfaction is determined to differ depending on the influence of the leader.
H1. Total quality management leadership has impact on the quality management.
H2. Total quality management leadership has significant impact on the customer satisfaction.
Among the principles of quality emphasized by Deming, quality Guru’s, management by fact can be said to be related to big data management today [
13]. Big data is considered to be the fuel and source of decision making [
7,
8]. Big data management is an imperative strategy for organizations that aim to improve their services and efficiency [
4,
7]. The potential needs of customers are hidden in the source of big data. Big data analysis management is not as easy as we think, because it requires data extraction and modeling, analysis method and strategy establishment ability. However, in the process of refining and analyzing customer-related big data, we can find the hidden pearl called customer information. The degree of big data use is the source of operational activities and quality management [
4]. Depending on which organization quickly identifies the value of big data analysis and management and applies it to quality management activities, operational activities and management performance will be different. Differences in management activities occur depending on how systematically you manage and analyze big data [
4]. Big data management affects quality management and service design. Quality data on customer and defective services informed to workers. In research methodology, the second independent variable that affects the dependent variable is called the moderated variable [
8,
12]. In this study, big data management can be the moderation variable. Therefore, the research hypothesis on the regulation effect of big data management between total quality management leadership and quality management activities can be established as follows.
H3. Big data management will have a significant moderation effect between total quality management leadership and quality management.
Reliable and responsive quality can impress customers beyond customer satisfaction as customer always seek for quality services. Customer satisfaction is an overall judgement between expectation and perception [
8,
12,
22]. Customers are satisfied with products and services of exceptional quality beyond expectations. Therefore, the research hypothesis related to excellent quality and customer satisfaction can be set as follows. Satisfied customers have a high degree of repurchase of products and services and, of course, a favorable reputation for the organization. The research hypothesis related to excellent quality and customer satisfaction can be set as follows.
H4. Excellent quality beyond customer expectations will have a significant impact on customer satisfaction.
4. Research Methodology
4.1. Survey and Measurement
In this study, a questionnaire survey was conducted to test the model and hypothesis. The questionnaire was developed based on theory prior to this survey. Moreover, during the questionnaire development process, three advisers from this field were advised. A questionnaire was developed by reflecting on various total quality management-related data and service-related references. All survey scales used the Likert 5-point scale. A score of 1 indicates strongly disagree, a score of 3 indicates moderation, and a score of 5 indicates strongly agree. First, the operational definition of the total quality leadership means that the organization’s leaders are dedicated and passionate for quality excellence. The quality leadership variables were three items (employee orientation thought, customer orientation thought and participation in decision making). The operational definition of quality management refers to a systematic and scientific approach for all members of the organization to pursue excellent quality. Three variables were used to measure the factors of quality management (the pursuit of superior quality, strategic planning, process management). Big data management refers to the organization’s efforts to make systematic and scientific decisions. To measure big data management factors, three highly reliable variables were set (decision-making-based big data, analytical thinking, management by data). Lastly, the factor of customer satisfaction refers to the overall favorable attitudes and evaluations that customers have toward the public sector organization. For the measurement of customer satisfaction factors, three variables were set as reflection variables (overall satisfaction, public sector favorability, respect for the public sector). Prior to this survey, a preliminary survey was conducted with 20 people. During this process, difficult questions to answer were adjusted.
4.2. Gathering Sample
For this survey, the population was set as the public sector in Korea. In this research, we measure and quantify total quality leadership, quality management and big data management on customer satisfaction. The survey period was 30 days from 1 August to 30 August 2019. Respondents were responsible for conducting big-data-based quality management or for quality management strategic planning departments. The 265 copies of the survey were collected. The 250 copies were used in this analysis, except for 15 copies of questionnaires that responded unfaithfully. The survey respondents were conducted for sixteen medical institutions and four city hall workers in Korea. It can be said that 40% of respondents are expected to properly recognize the organizational culture and characteristics of the organization because the number of working years is more than 5 years.
4.3. Summary of Expert Interview
In order to confirm the overall framework of this study model and the feasibility of the study, four people working in four public institutions in Korea were interviewed in early July 2020. They are heads of departments that perform strategic planning and quality management based on big data analysis and have over 15 years of work experience. Their common opinion gave the opinion that this research model is valid in the context of big-data-based decision making. They also emphasized that strong leadership is required to apply quality management systems and big data analysis to decision-making processes in public institutions. Therefore, they said that it is reasonable to insert big data analysis factors as a moderation factor between quality management leadership and quality management like the research model. In particular, insisting that the 4th industrial revolution is in progress, it has been argued that the quality of customer-related data can be continuously managed and managed in the public sector, and customer satisfaction will be increased accordingly. They predicted that, in the future, AI and machine learning based on big data will be actively utilized to provide excellent service quality and service processes in the public sector, which will increase customer convenience.
6. Conclusions and Implications
If the total quality management in the past focused on manufacturing quality or production operation quality, after the 4th industrial revolution, it is expanding not only to the entire value chain but also to stakeholders. Using big data to improve the quality performance and customer satisfaction of existing works in the public sector has proven a challenge because it requires a considerable amount of data and new methodologies in practices. However, changes are happening in Korea, and systems-based approaches in the public sector can tap into the potential of big data.
The future of operation is data-driven and AI-enabled. Artificial intelligence based on data will impact profit organizations and not-for profit organizations. All organizations need to learn from others along the value-chain to understand how to effectively translate data, AI and analytic tools into TQM practices and customer benefits and find the right wants and needs to move organization innovations forward.
In recent years, there have been growing efforts across both the public and private sectors to explore new digital technologies and to exploit their capabilities to generate new value for users [
4]. Accordingly, efforts to improve quality levels and data analysis are management activities that should be continued as long as the organization exists. Moreover, in order to provide high-quality products and good service quality in an uncertain environment, thorough total quality management is absolutely necessary in advance. As we can see, total quality management is an activity in which all members of the organization participate in activities to create customer value.
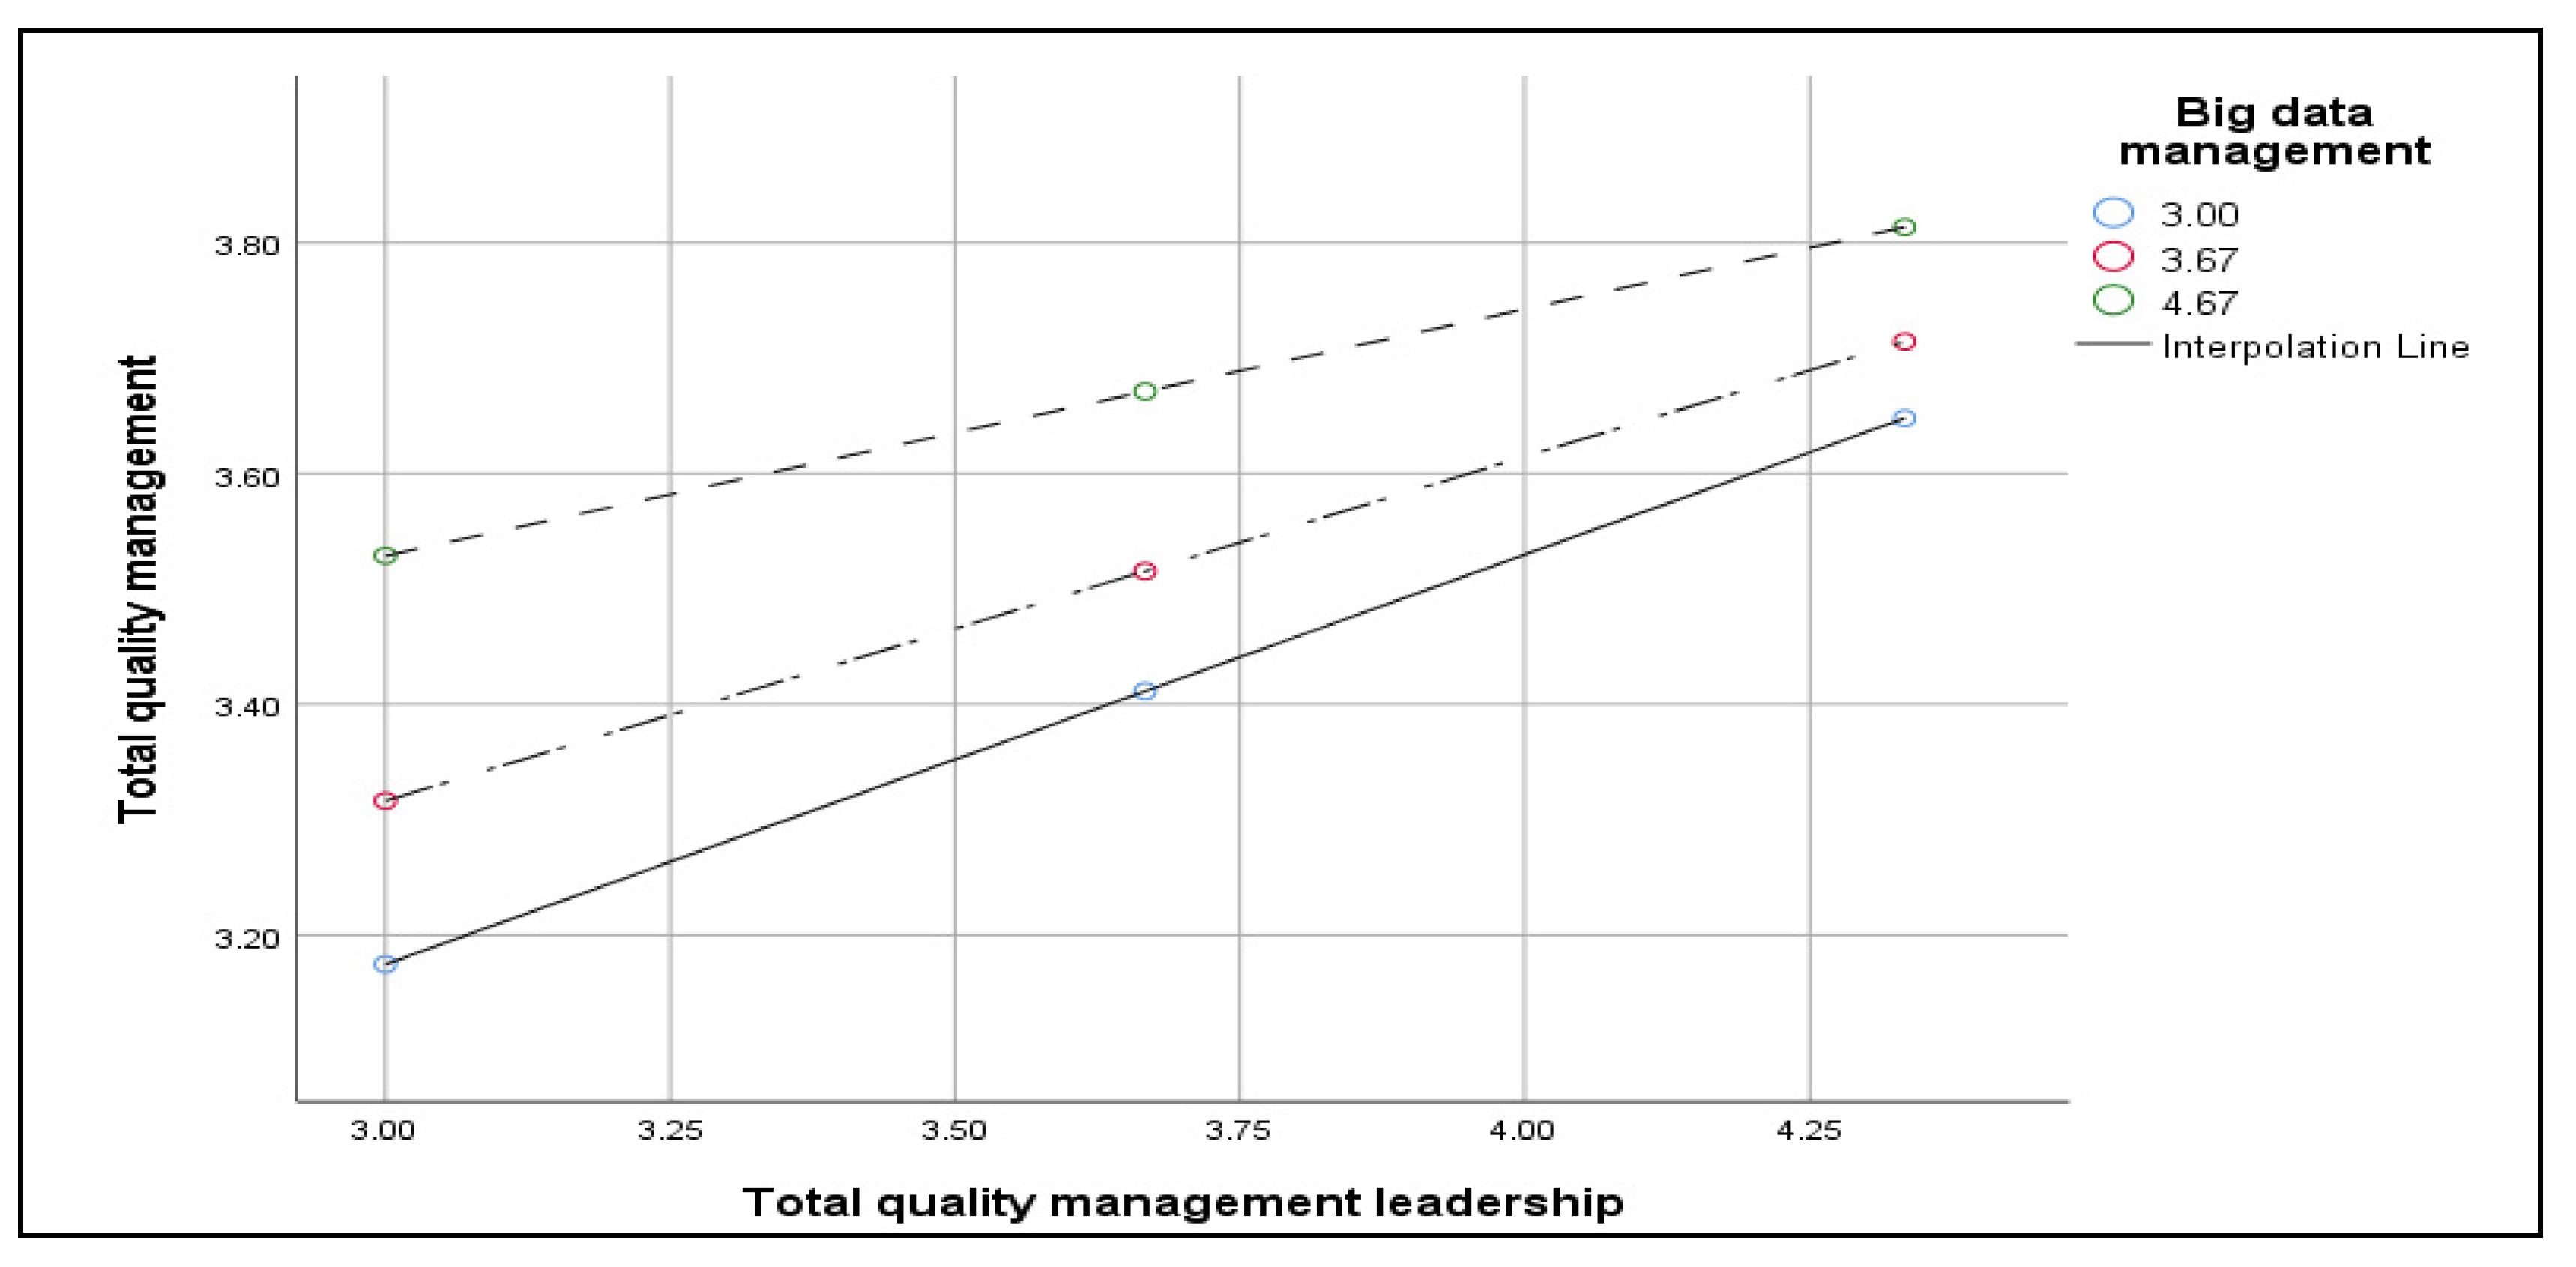
In this study, a research model was established and tested on the relationship between total quality management leadership, quality management and customer satisfaction. The sample survey was conducted on people working in the public sector in Korea. In addition, the significance of the moderating effect between big data management in total quality management leadership and quality management activity factors was examined at the α = 0.1 level.
As a result of the analysis, it was found that quality leadership has a significant impact on quality management activities at the α = 0.05 level. Subsequently, the quality management activity was tested as a significant factor in customer satisfaction. In addition, big data management was tested to play a part as a significant control variable in the total quality leadership and quality management activities. On the other hand, it was hypothesized that total quality management leadership had no significant effect on customer satisfaction. It can be inferred that this is the result of the fact that the leader of the organization does not directly face customers and does not provide services. Through these results, the following management implications can be suggested.
First, the leadership for establishing an excellent quality culture cannot be overstated. Leaders should continue to emphasize total quality management activities in their organizations. As shown in the analysis results, it can be seen that the total quality management activities vary depending on whether big data is managed. The role of top management is important for organizations to actively utilize big data. In particular, the importance of training practitioners should be recognized. Top management should support data-driven decision making. Even if insights derived from big data analysis do not match the opinions of management, they should be empowered. The success or failure of management using big data is determined by the vision and leadership of the top management.
Second, we have to work hard to establish a quality orientation culture. This is because total quality management is the source of customer satisfaction. It is important to understand what your organization’s customers want. Now, there are too many opportunities to observe customer behavior. By analyzing the actual big data and observing customers, organizations can find that the excellence for quality improvement and behaviors are different. In the public sector of the Republic of Korea, the level of public demand is increasing day by day. In order to satisfy the needs of the enlightened people and to provide excellent quality service, it is necessary to continuously establish a quality management culture.
Third, if big data is used properly, insight can be found in the data. In fact, gathering big data without using the framework of concepts to organize or understand, or using it as data for data can lead to wrong conclusions and unintended conclusions. Organizations can develop new strategies beyond predicting quality levels through big data analysis. In this study, as a result of hypothesizing the moderating effect of big data analysis factors in the relationship between total quality management leadership and quality management, it was found that big data analysis has a moderating effect (α = 0.1 level). That is, it can be estimated that total quality management is activated as systematic big data management and analysis are properly performed. It can be said that collecting and managing big data for quality improvement and customer satisfaction is not a one-time event, but an operation that must be sustained as an organizational culture. In the public sector of Korea, the website bulletin board suggestions and exchanges with customers have been analyzed by big data to discover the quality improvement and have received favorable reviews by reflecting this in management. Institutions with an active culture in which the internet culture develops and expresses customer-related issues immediately must continuously monitor customer responses. As the accumulation and utilization of big data in the public sector of Korea increases, it will be possible to create smart machine learning and artificial intelligence and create innovative new services.
As a limitation of this study, the questionnaire was targeted to workers in the public sector, so the satisfaction level of customer satisfaction was measured indirectly. Since the results of this study are not the results of all public institutions surveyed in Korea, but the results of analysis based on the convenience judgment extraction. It may be difficult to generalize. Moreover, because it relies on the questionnaire response method and not big data analysis, there is a limitation that it has not been able to investigate the big data analysis methods in the public sector in detail. The acquisition of personal information without permission can be a violation of personal information protection and requires special attention to personal information protection. In the future, it will be necessary to improve this point and introduce a method of directly measuring satisfaction with external customers. In a future study, we will actively acquire big data in the public sector and apply the machine learning analysis and AI method related to the quality level determination and customer satisfaction prediction model of external customers.


