Article

Attracting European Funds in the Romanian Economy and Leverage Points for Securing their Sustainable Management: A Critical Auditing Analysis

by
Valentin-Marian Antohi
1,*,
Monica Laura Zlati
2,
Romeo Victor Ionescu
3,
Mihaela Neculita
4,
Raluca Rusu
4 and
Aurelian Constantin
5,6,7
1
Department of Business Administration, Dunarea de Jos University, 800001 Galati, Romania
2
Department of Accounting, Audit and Finance, Stefan cel Mare University, 720229 Suceava, Romania
3
Department of Administrative Sciences and Regional Studies, Dunarea de Jos University, 800201 Galati, Romania
4
Department of Economics, Dunarea de Jos University, 800001 Galati, Romania
5
Institute of National Economy, Romanian Academy, 050711 Bucharest, Romania
6
Department of Accounting and Finance, Valahia University, 130004 Targoviste, Romania
7
Finance and Business Administration Department, Danubius Univesity, 800654 Galati, Romania
*
Author to whom correspondence should be addressed.
Sustainability 2020, 12(13), 5458; https://doi.org/10.3390/su12135458
Submission received: 2 June 2020 / Revised: 30 June 2020 / Accepted: 1 July 2020 / Published: 7 July 2020

Abstract

:
Against the backdrop of Romania’s successive negative performance in attracting European funds (coming last in the EU top), as indicated by audit reports for projects that have been funded so far, this paper proposes a new approach in relation to analysis and performance improvement in securing EU funds, while identifying viable solutions for the betterment of the current situation. Furthermore, the authors develop a new audit performance analysis model (NOP), described as a dynamic and flexible model, based on reducing the fraud and error risk in the structural fund management of European-funded projects. The analysis methods encompass literature reviews, observational studies, database management, statistical analysis, and the synthesis of the whole findings. The main conclusion of the analysis is the critical necessity of integrity improvement in the context of managing the non-reimbursable funds through audit activities based on ISA805, the international standard on auditing European-funded projects.

1. Introduction

In the context of the current regulations regarding the development of operational programs during the period 2014–2020, which are described in the applicants’ guide, it has been decided that the financial auditing of projects is to be an optional activity. These provisions have led to the termination of the Collaboration Protocol regarding the organization and development of financial auditing for European funds and other non-reimbursable funds, previously conducted between the Ministry of Regional Development, Public Administration, and European Funds and the Romanian Chamber of Financial Auditors.
Although in theory financial auditing is mentioned as an eligible expense under indirect expenditure, it is subject to inherent budgetary constraints due to the fact that this category is capped at a percentage of the direct expenditure. As a result, it might be impossible to be contracted at a specific reasonable level. Therefore, in practice this activity is often omitted by beneficiaries.
The implications of this unilateral decision of the authorities are multiple and significant, with a particular direct impact on the efficient financial management of the projects and, consequently, on the general absorption of funds, favoring potential errors, irregularities, and fraud. Thus, the beneficiaries of the financed projects will no longer be able to correct any implementation errors occurring during the project, being subject to an ex-post verification carried out by the Audit Authority of the Romanian Court of Accounts.
The European Funds represent real EU support for the structured development of national economies according to the performance goals of the European fora. For the Member States, the funding instruments are the project calls (PC) on financing axes (FA) and operational programs (OP). It is recognized that in Europe, the accessibility of funds is conditioned as a process by the administrative bureaucratic apparatus. As a result, the countries oriented towards the implementation of the administrative apparatus flexibility manage to achieve superior performance compared to countries whose flexibility is limited on the basis of political decision makers. The case of Romania is one of the special cases of non-performance at the European level.
Statistically speaking, the budget allocations for strategic investment objective development were significant in Romania during 2014–2020, yet they failed to exceed a proportion of 10% in actually using the allocated funds for the investment objective’s completion. The same situation applies to the state budget allocations, which demonstrates that the causality of non-performance is related to the limitations of the administrative system rather than to the project manager’s limitations.
In the authors’ opinion, their approach is a requisite in evaluating the process of the absorption of the European funds in terms of sustainable management since, in Romania particularly, it faces major difficulties related to fraud and errors, which were found by the European authorities and supervisors in the implementation processes of the European projects. Far from claiming to cover the full range of European funds in Romania, the authors suggest a model based on auditing practices meant to streamline the absorption process, reduce risks, and enhance the sustainable management of funds offered to EU member states for their strategic economic development. In that sense, the authors analyzed two paths of strategic financing in Romania (the OP-Environment for the period 2007–2013 and the OP-Large Structure for the period 2014–2020).
The present study aims to propose a new approach in relation to analysis and performance improvement in securing EU funds, while identifying viable solutions for the betterment of the current situation. Furthermore, the authors develop a new audit performance analysis model (NOP), described as a dynamic and flexible model, based on reducing the fraud and error risk in the structural fund management of European-financed projects. In order to ensure the finality of this study, we tracked the allocations made via the OP-Environment during 2007–2013 and the OP-Large Structure during 2014–2020. The first program, run under the EU aegis in Romania through the Ministry of European Funds, involved more than 4.4 billion EUR during 2007–2013, to which were added 0.8 billion EUR as contributions from the national budget. Subsequently, the EU earmarked 9.2 billion EUR as investment funds related to high infrastructure, which were supplemented with national budget allocations amounting to 1.6 billion EUR.
During 2007–2013, at the OP-Environment level 790 projects with a total value amounting to 6.47 billion EUR were submitted, of which the EU non-reimbursable contribution would be 4.15 billion EUR. The project approval rate was 78%, (611 projects from a total of 790 submitted projects), for a total approved funding of 6.09 billion EUR (63% of the requested amount), where the non-reimbursable EU contribution was 3.87 billion EUR (on the principle of the proportionality of the amounts).
The funds related to the approved projects were audited and evaluated by competent bodies (the managing authorities of both OP-High Infrastructure and OP-Environment). As a result, payments at the value of 3.55 billion EUR were approved (58% of the total value).
Using the flat rate of expenditures, it can be noticed that the non-performance in the execution of projects was 42% on the OP-Environment axis. Further, 88% of this non-performance was related to the inefficient management of the project, while 12% was in connection to ineligibility due to errors and fraud that occurred in managing the allocated funds. Those non-eligibilities have been recovered by the management authority from the project’s manager and represented 0.75 billion EUR, a significant amount that affected the maintenance of projects after the implementation period (their sustainability).
In the case of OP-Large Infrastructure, the allocations covered 10.8 billion EUR (of which 9.2 billion EUR was the EU’s contribution) during 2014–2020. From 421 submitted projects, 244 projects with a total value of 9.8 billion EUR (91%) were approved, of which 7.78 billion EUR was the EU’s contribution. As a result of strengthening the security measures in spending funds, the level of ineligibility has fallen from 37% to below 0.05%, with a recovery rate of 3.65 million EUR from the beneficiaries’ funds.
The data used in this research were requested by the authors from the European Funds Ministry of Romania, the General Directorate of Large European Infrastructure Programs. The data was communicated as per the information available on 31.03.2019.

2. Literature Review

There is a wide array of approaches for accessing European Funds for Member States based on relevant competitiveness areas in terms of allocating funds for regional growth.
Such themes include increasing convergence; improving the effects after the implementation period with implications for increasing regional welfare; increasing the productivity and positive effects of regional development by promoting structural funding objectives; increasing the net GDP/capita in relation to unemployment decrease; the acceleration of the process of convergence through structural allocations, including through the reform introduced by the EU regulatory mechanisms on the methodology for allocating structural funds since 2003 [1] (pp. 1302–1326).
A synthesis of these approaches is presented in the paper “Structural Funds and European Regional Growth. Comparison of Effects among Different Programming Periods” [1] (pp. 1302–1326). Table 1 describes the European structural funds’ key role across the EU space.
Researching the specialist literature, we came across constant concerns for increasing security in the allocation of structural funds in order to increase the absorption capacity of the beneficiaries, which implicitly would increase the chances of implementing the cohesion policy. On the other hand, the signals drawn by the academic environment proved to be implemented in a variable measure in a relationship directly proportional to the administrative competence of the management authorities from different EU countries, revealing a real imbalance between the institutional and management capacities of European funds and the dispersion of good management practices in attracting European funds. In addition, studies demonstrated that in case the national institutional apparatus assigned to the European structural funds’ management is bureaucratic, the chance for a deficient management is higher, and hence the sustainable economic growth is negatively affected.
With reference to the appropriate audit techniques in the process of accessing European funds, the specialist literature presents several opinions through studies published in recent years. Gepp et. al, 2018 [17] (pp.102–115), analyzed the use of audit techniques in financial practice by financial stress modelling, fraud modelling, and stock market predictions through an extensive literature review process, conducting a meta-analysis of accounting and auditing approaches in an attempt to understand the main relevant audit techniques to reduce fraud.
Boros and Csaba, 2019 [18] (pp. 2–23), studied the relationship between corporate sustainability and compliance with integrity factors. The analysis was carried out at the level of the Hungarian Audit Authority and aimed to identify a model of integrity and adequacy for increasing the absorption of European funds and the judicious use of the resources. The proposed matrix model identifies some vulnerability factors and focuses on the concept of corporate sustainability, a necessary tool for future business association.
The sustainable economic development is considered the best solution in terms of implementing the opportunities for environmental financing, including the attracting of the European funds by the EU member states [19].
The role of audit in the fight against corruption is analyzed by Jeppesen, 2018 [20] (pp. 1–26), and Farooq, 2018 [21] (pp. 1–22), who both call attention to systemic corruption, which is the first to impede the development of a national economy. Auditors are identified as frontline anti-corruption activists, with auditing being one of the eight pillars of integrity. Jeppesen’s analysis details the severity of corruption in financial information, which conceals and “gilds” financial information, significantly hindering the role of the auditor, while Farooq’s analysis focuses on understanding the factors contributing to the corruption’s lowering, especially in less developed countries, where the mechanism of corruption is more thriving. Therefore, the auditors’ role is of paramount importance in reducing corrupt practices within businesses, which determines the improvement of their financial performance.
Another study conducted by Kassem and Higson, 2016 [22], (pp. 1–10) at the level of the American Accounting Association reveals that the phenomenon of corruption is extremely toxic and threatens global corporations with major social implications. The analysis was performed by synthesizing the literature in the study, showing that regular audits performed by external auditors can control corruption phenomena. The audit standards should establish that auditors are responsible for identifying corruption risks, in correspondence with a set of good professional practices.
Bostan, I., and Grosu, V., 2010 [23], address the issue of the global economic crisis from the perspective of the labor market and its regional disparities, and they realize that the optimal solution for resolving the situation is sustainable development.
Other authors [24] debate the issue of developing a unitary European system of financial standards to be found at the level of all Member States for all economic branches, including agriculture, the importance of which is brought to the fore at least in Romania.
Hay and Cordery, 2018 [25], (pp. 1–15) analyze the added value of auditing in the public sector by auditing their financial statements, using the technique of a meta-analysis of the literature, emphasizing the unanimous recognition of the value of financial audit processes in the public system. A similar approach is found in the study conducted by Osma et. al, 2014 [26], (pp. 1–36) which analyzes the role of statutory audit in the public system, the need for change and resettlement on performance criteria, and the fight against public audit fraud in Europe.
Another aspect regarding the role of the audit is presented by Edori D. and Edori I., 2018 [27], (pp. 190–196) who aim to reduce the phenomena of fraud through control and audit procedures in companies. The study was based on a questionnaire addressed to auditors, accountants, and CEOs on a sample of 300 people. In relation to the phenomena of fraud and error, the study shows that a classic audit is preferred to a prospective audit (forensic audit), even if the latter is more efficient in reducing fraud and errors.
Herman, 2019 [28], (pp. 1–26) examines the role of the Big-4 audit firms as intermediary regulators in the international harmonization of international financial reporting standards. The author points out that, through the experience gained, the Big-4 hold a significant position as intermediaries in the regulatory process of Big-4 auditors and are able to connect the economic chain through experience and notoriety; they also summarize the processes of the regularization of accounting standards for public and private systems.
From the European Funds’ point of view, Howarth and Spendzharova, 2019 [29], (pp. 1–18) analyze, as an alternative to the International Monetary Fund, the role of the European Stability Mechanism (ESM) in the post-crisis governance of the Eurozone through accounting procedures and auditing. Jeler, 2018, [30] identified the role of European funding as a way to ensure development funds and their control as a way to guarantee the legality and regularity of declared expenditures to ensure the development of funded activities. The author discusses the need to use appropriate control measures for the application of audit filters in order to detect and stop errors or possible fraud in the management of funding from European funds.
Anton, S.G., and Bostan, I, 2017 [31], investigate the national variation in firms’ activity according to their access to finance, exemplifying with data on EU member states. The analysis covers both periods of difficult access to finance and periods of excessive liquidity. The authors find a positive relationship between access to finance and entrepreneurial activities.
The NOP model was built as a result of studying the literature (31 papers), and it was created in order to cover the necessity of a new approach in the domain. The NOP model proposed in this paper brings a new approach compared to the relevant literature analyzed in the above table.

3. Research Methodology

The authors have reviewed the evolution of the concepts/theories related to the research topic (Table 1), emphasizing their particularities and their impact on the research. Moreover, the authors have synthesized the literature and identified variables from previous studies according to the list below, including but not limited to:
-
regional GDP sustainable growth;
-
the average growth of the structural allocations;
-
regional disparities;
-
welfare growth;
-
sustainable GDP growth;
-
post-crisis economic recovery;
-
regional administrative capacity;
-
compliance with the access to European funds;
-
structural fund allocations;
-
correcting allocation policies;
-
national accounts system’s control mechanisms;
-
absorption vulnerabilities;
-
unbalanced national budgets;
-
growing public debt.
Compared to the above, the authors propose a new model for improving auditing practices (NOP). Even though this model is based on the concept of the fraud triangle defined in the 1950s by Cressey and updated by Oroszki, 2019 [15], also by Machado and Gartner, 2018 [14], it supports a new approach. This concept divides fraud through into three main components: opportunity, need, and motivation. Previously analyzed models were taken into account both in conceptualization and testing, being critically analyzed as an impact on decisions on sustainable development in terms of assessing economic status through the audit techniques and practices of the investment projects financed by the non-refundable funds, including through their purpose in reducing the phenomena of fraud and error.
We consider this as a static approach, in the sense that it does not prospectively analyze the system entropy through the modification of any component within the system. As a result, the paper defines a NOP model based on the reality of the financial executions of the non-reimbursable projects in Romania (OP-Environment 2007–2013 and OP-Large Infrastructure 2014–2020) using the following theorem:
Let N be the financial need existing at the eligible entities level in relation to the specific development opportunities existing in the region at a given moment.
N = i = 1 n ( B N ) i ,   where   B N = ( E f N E x N ) ,
where N—the financial need of the analyzed economic entity (national/regional); BN—the exponential function of the net desirable benefit for a certain financial need N multiplied by i factor; i factor—the alternatives for obtaining the benefit, i ϵ [1, n], where n represents the number of individual needs which form the desirable benefit; EfN—the gross feasible effects as a result of satisfying the financial need N; ExN—the necessary costs for realizing the abortive gross effects EfN.
Let O be the given opportunity by the relationship:
O = j = 1 m o j ,
where O—the given opportunity (it represents the cumulative number of vulnerabilities that generates opportunity for fraud and error); oj—any regulation issued by the managing authorities or the legislative forums influencing the approval of a project with non-reimbursable financing; j ϵ [1, m], where m represents the total number of vulnerabilities allowed by the system.
Let P be the permissive:
P = k = 1 l A k L ,
where P—permissively (the total vulnerability that generates permissibility for producing fraud and error); Ak—possible audit practices in the context of implementing audit legislation, k ϵ [1, l];
l—total number of audit practices; L—the cumulative legislative constraints that generate context for permissibility, with L being the regulatory variable, possibly adapted to maximize the effects of audit practices A.
We can say that the financial needs (N) face the following mathematical relations:
( ) α > 0   such that:
N = α N 0   + N * ,
where α—the frequency coefficient of the residual variable N0; N0 defines the financial need assimilated to the phenomena of fraud and error after the application of legislative regularity measures; N—the financial need (see the above definition); N*—the financial need assimilated to fraud and reduced error through regulatory regularity practices.
We can define N* = lim i N i , where i is the number of financial needs after the security measures’ implementation. Then, Equation (4) becomes:
N = α N 0 + l i m i N i .
The efficiency condition is covered only when:
lim i N i 0 ,   N > α N 0 .
We can say that the given opportunities for fraud and error (O) face the following mathematical relations:
( ) β > 0 such that
O = β O 0 + O * ,
where β—the coefficient of frequency for the residual variable O0; O0 defines the opportunity for fraud and error; O—the cumulative vulnerability that generates the opportunity for fraud and error (see the above definition); O*—the reduction in the opportunity in the assimilation of fraud and the reduced error through legislative regularity practices.
We can define O* = lim j o j , where j represents the total number of opportunities after the security measures’ implementation. Then, Equation (7) becomes:
O = β O 0 + lim j o j .
The efficiency condition is covered only when:
lim j o j 0 ,   O > β O 0 .
We can say that the permissively (the total vulnerability that generates permissibility for producing fraud and error) (P) faces to following mathematical relations:
( ) γ > 0   such   that  
P = γ P 0 + P * ,
where γ the residual variable frequency coefficient P0; P0 defines the permissibility of fraud and error, after the application of legislative regularity measures; P—the vulnerabilities that generate permissibility for producing frauds and errors; P*—the reduction in the permissiveness assimilated to fraud and error through legislative regularity practices.
We can define P* = lim k P k , where k represents the total number of vulnerabilities after the security measures’ implementation. Then, Equation (10) becomes:
P = γ P 0 + lim k P k .
The efficiency condition is covered only when:
lim k P k 0 ,   P > γ P 0 .
Based on the above explanation results, the NOP model which defines the risk of fraud and error through all the identified elements that characterize it (the need for funding, opportunity, and permissibility):
N O P = α N 0 + β O 0 + γ P 0 + N * + O * + P * .
Based on the mathematical equations 6, 9, and 12, we define:
N O P = l i m i N i + l i m j o j + l i m k P k ,
where NOP′—the risk of fraud and error through all the identified elements that characterize it (the need for funding, opportunity, and permissibility), reduced after the application of legislative regularity measures.
If   l i m i N i l i m j o j l i m k N k min   than   N O P min ,
( ) ,   A > 1 ,   such   that   N O P = ( α N 0 + β O 0 + γ P 0 ) ( 1 A ) + ε ,
where A—the total number of audit practices. NOP″—the residual risk of fraud and error through all the identified elements that characterize it (the need for funding, opportunity, and permissiveness) reduced after the application of security measures through audit.
The condition N O P → min is true if A → max.
As a result:
N O P = N O P + ( α N 0 + β O 0 + γ P 0 ) ( 1 A ) + ε ,   where   N O P 0 .
According to the above mathematical relations:
  • the sum of legal regularity measures (R) is defined by the relationship R = NOP − N O P ;
  • the sum of audit security measures (A) is defined by the relationship A = NOP N O P ;
  • the new fraud triangle becomes N O P = N * + O * + P * + R + A + ε (see Figure 1).
The model proposed in this paper is validated on the basis of the following hypotheses:
Hypothesis 1 (H1).
finding fraud after implementing a funding program generates regularity effects on future programs, tightening credit conditions based on factual findings from project audits (see Table 1, Biondi Y., 2014 [6]);
Hypothesis 2 (H2).
within the funding period, the found irregularities regarding the financing projects are more if the audit practices are more permissive;
Hypothesis 3 (H3).
the congruence relationship between necessity, opportunity, and permissibility reaches the critical point at the end of the implementation period if, and only if, the absorption threshold of the funds does not exceed 50%;
Hypothesis 4 (H4).
the training of the project beneficiaries in the best management practices of non-reimbursable funds is a condition with a direct incidence on reducing the fraud and error level in accessing European funds.
The authors propose a complex method of validation (because a formal validation would not have been sufficient to achieve the proposed purpose of the research: a new approach related to analysis and performance improvement in attracting EU funds and that identifies viable solutions for the recovery of the current situation). The correlations between the working hypotheses and the statistical results obtained by the mathematical testing of the model indicate the following connections:
Hypothesis 1 (H1): This hypothesis can be demonstrated by reduction to the absurd, as follows:
If the fraud presence would not significantly influence the future funding processes, then the allocated amounts would be significantly equal for similar types of projects funded regardless of the results of the audit procedures. In fact, according to what is shown in the Introduction, on financing programs corresponding to the same strategic direction OP-Environment during 2007–2013 and the OP-Large Structure during 2014–2020, it was found that, due to fraud and errors, the total number of projects submitted for financing approval was reduced from 790 projects to 421 projects initially submitted, and the final number of projects financed was reduced from 611 to 244. It also increased the recovery rate of fraud found in the audit by 3.65 million EUR, thus reducing the actual non-reimbursable financing from 4.15 billion EUR to 4.03 billion EUR compared to a gross allocated contribution of 7.78 billion EUR. It results that, through the process of reduction to the absurd, the negation of the hypothesis was rejected, which proves H1 in accordance with the presented aspects.
H1 is related to: prospected analyses of the fund distribution by financing programs, Sample Mean Difference, and log probability calculation.
Hypothesis 2 (H2): According to Table 10, there is a correlation index of 0.996 for the permissiveness of fraud and errors in terms of strengthening regulatory capacity, similar to a level of 99.6% for 2-tailed sigma values of 0.132, which indicates that compared to the financial need a rigid character in relation to the recognition of fraud and error phenomena, the vulnerabilities generated by permissiveness are flexible in relation to the opportunity (Table 11 NOP matrix) and of the same sign. The correlation values of the opportunity in relation to the detection of fraud and error indicate the highest volatility and a Sigma 2-tailed indicator of 0.335, compared to the indicator of financial needs at the amount of 0.065. On the other hand, Table 12 (N′O′P′ matrix) reveals the presence of intensified regulatory and audit activities to reduce fraud and error, a correlation between adjusted need and higher adjusted permissiveness (reduced permissiveness), and a much lower value than in the first case of the correlation between opportunity and permissiveness, which demonstrates the working hypothesis—namely, within the funding period, the found irregularities regarding the financing projects are greater if the audit practices are more permissive. Conversely, this demonstration rejects the negation of the working hypothesis and allows the validation of the hypothesis.
H2 is related to: sample t test, sig. (2-tailed) for the relations with the budgeted values in relation to the financial performances obtained on each industry.
Hypothesis 3 (H3): By reduction to the absurd, if the absorption level would not influence the process of implementing the strategic directions financed from European funds, then the relation necessity-opportunity and permissibility would maintain the correlative characteristics it demonstrated during the financing. Instead of this, we found the exacerbation in the peak area of the allocations of fraud and error phenomena with maximum opportunity and reduced permissiveness through the regulation/audit process. Thus, the maximum allocations demonstrate maximum volatility on the permissive level of the character of fraud and error, which are supervised by more numerous procedures than in the case of allocations on less financed axes. Conversely, the minimum allocations (the minimum values of the allocations distributed within the OP-Environment project for example) attract a reduction in the desirability threshold (81.48% compared to 88.16% in the previous maximum analyzed case) and an inversely proportional increase in permissiveness (65.71% versus 63.41% in the previous case analyzed). The inverse of the hypothesis is rejected. Consequently, the validation of the working hypothesis results.
H3 is related to: Posterior Distribution Characterization for Related-Sample Mean Difference.
Hypothesis 4 (H4): Figures 5–7 demonstrate the later distributions of the log function. The likelihood approaching the lower limit of the distribution interval as the managerial planning function turns into execution. Thus, by reducing to the absurd, the flattening of managerial competencies should not influence changes in the dynamics of financial planning in the case of financing projects. In fact, the exact opposite was found, which demonstrates the rejection of the null hypothesis and the validation of H4 as it was formulated—namely, the training of the project beneficiaries in the best management practices of non-reimbursable funds is a condition with a direct incidence on reducing the fraud and error level in accessing European funds. We calculate the log probabilities for the submitted projects.
H4 is related to calculating log probabilities for the submitted projects.
The authors present working hypotheses whose formal validation can be discussed empirically based on the literature or the financial results obtained from the development of the funding programs. However, the elements introduced in the hypotheses can only be validly demonstrated following the complex analysis (performed by econometric modelling) regarding the allocations, performances, and irregularities found following the development of a financing cycle on a certain priority axis.
In order to define the adjustment variables of the legislative regulatory and security by audit, we define the following best practices (see Table 2).
Another aspect in implementing the proposed model is to establish the criteria for a viable security audit (see Table 3).
We asked for information regarding all the funding programs applied by the EU in Romania under the Romanian Ministry of European Funds. The answer and the support of this Ministry allowed us to perform this research. The authors studied the structural funds allocation through OP-Environment and OP-Large Infrastructure during 2007–2019 (12 years), analyzing the fund allocations on the seven PO-Environment axes for 790 projects and the eight axes of the PO-Large Infrastructure for 421 projects. The data was centralized on the funding axes.
For all the analyzed contracts, the values of the submitted and approved contracts were centralized, considering the approved budget on each axis. The data were analyzed in the dynamics, and we obtained, by centralizing the unitary distribution, averages of the budgeted values on the axis in relation to the number of submitted projects on each axis, the unit value of the submitted projects, and the unit value of the approved projects on each axis as well. The data obtained for each OP were compared by relative averages of evolution, obtaining the trend of the dynamics of the planned and realized financing values for the EU funds in relation to the national contribution.
Subsequently, the authors centralized, from the information provided by the Directorate-General for European Programs within the Ministry of European Funds of Romania, the value of the irregularities found on the axes of the two OPs. The values were transposed across unitary environments, and the percentage of uncertainty relative to the budgeted amount and the value of EU funding was calculated. Centralization led to the creation of a modelling database, which was then statistically tested through the IBM-SPSS 25 software.
After verifying the validation of data entered in SPSS, we modelled the sampling data using the Bayesian criterion as a statistical method for comparing the probability interferences of data pairs based on distribution parameters.
The first alternative of the statistical tests was that of gross unadjusted amounts, centralized by observational study. The statistical values tested with the T-Statistic test were quantified for the standard deviation and the mean error distribution, the comparison being made on the three types of allocations: budget, submitted projects, and approved projects between the axes. The Bayes factor had values between 1.2 and 1.36, the minimum Bayes factor resulting from the comparison observed for the submitted projects. This means that, at the approved value level, the error margin after applying the statistical tests calculated by the sig. (2-tailed) indicates the presence of nonconformities and demonstrates the H2 hypothesis, which was defined above. The Bayesian factor for unadjusted data is zero compared to the alternative hypothesis. The model is valid and well-defined.
The statistical tests resulting from this new model’s application (NOP) are presented in Table 4, Table 5, Table 6 and Table 7.
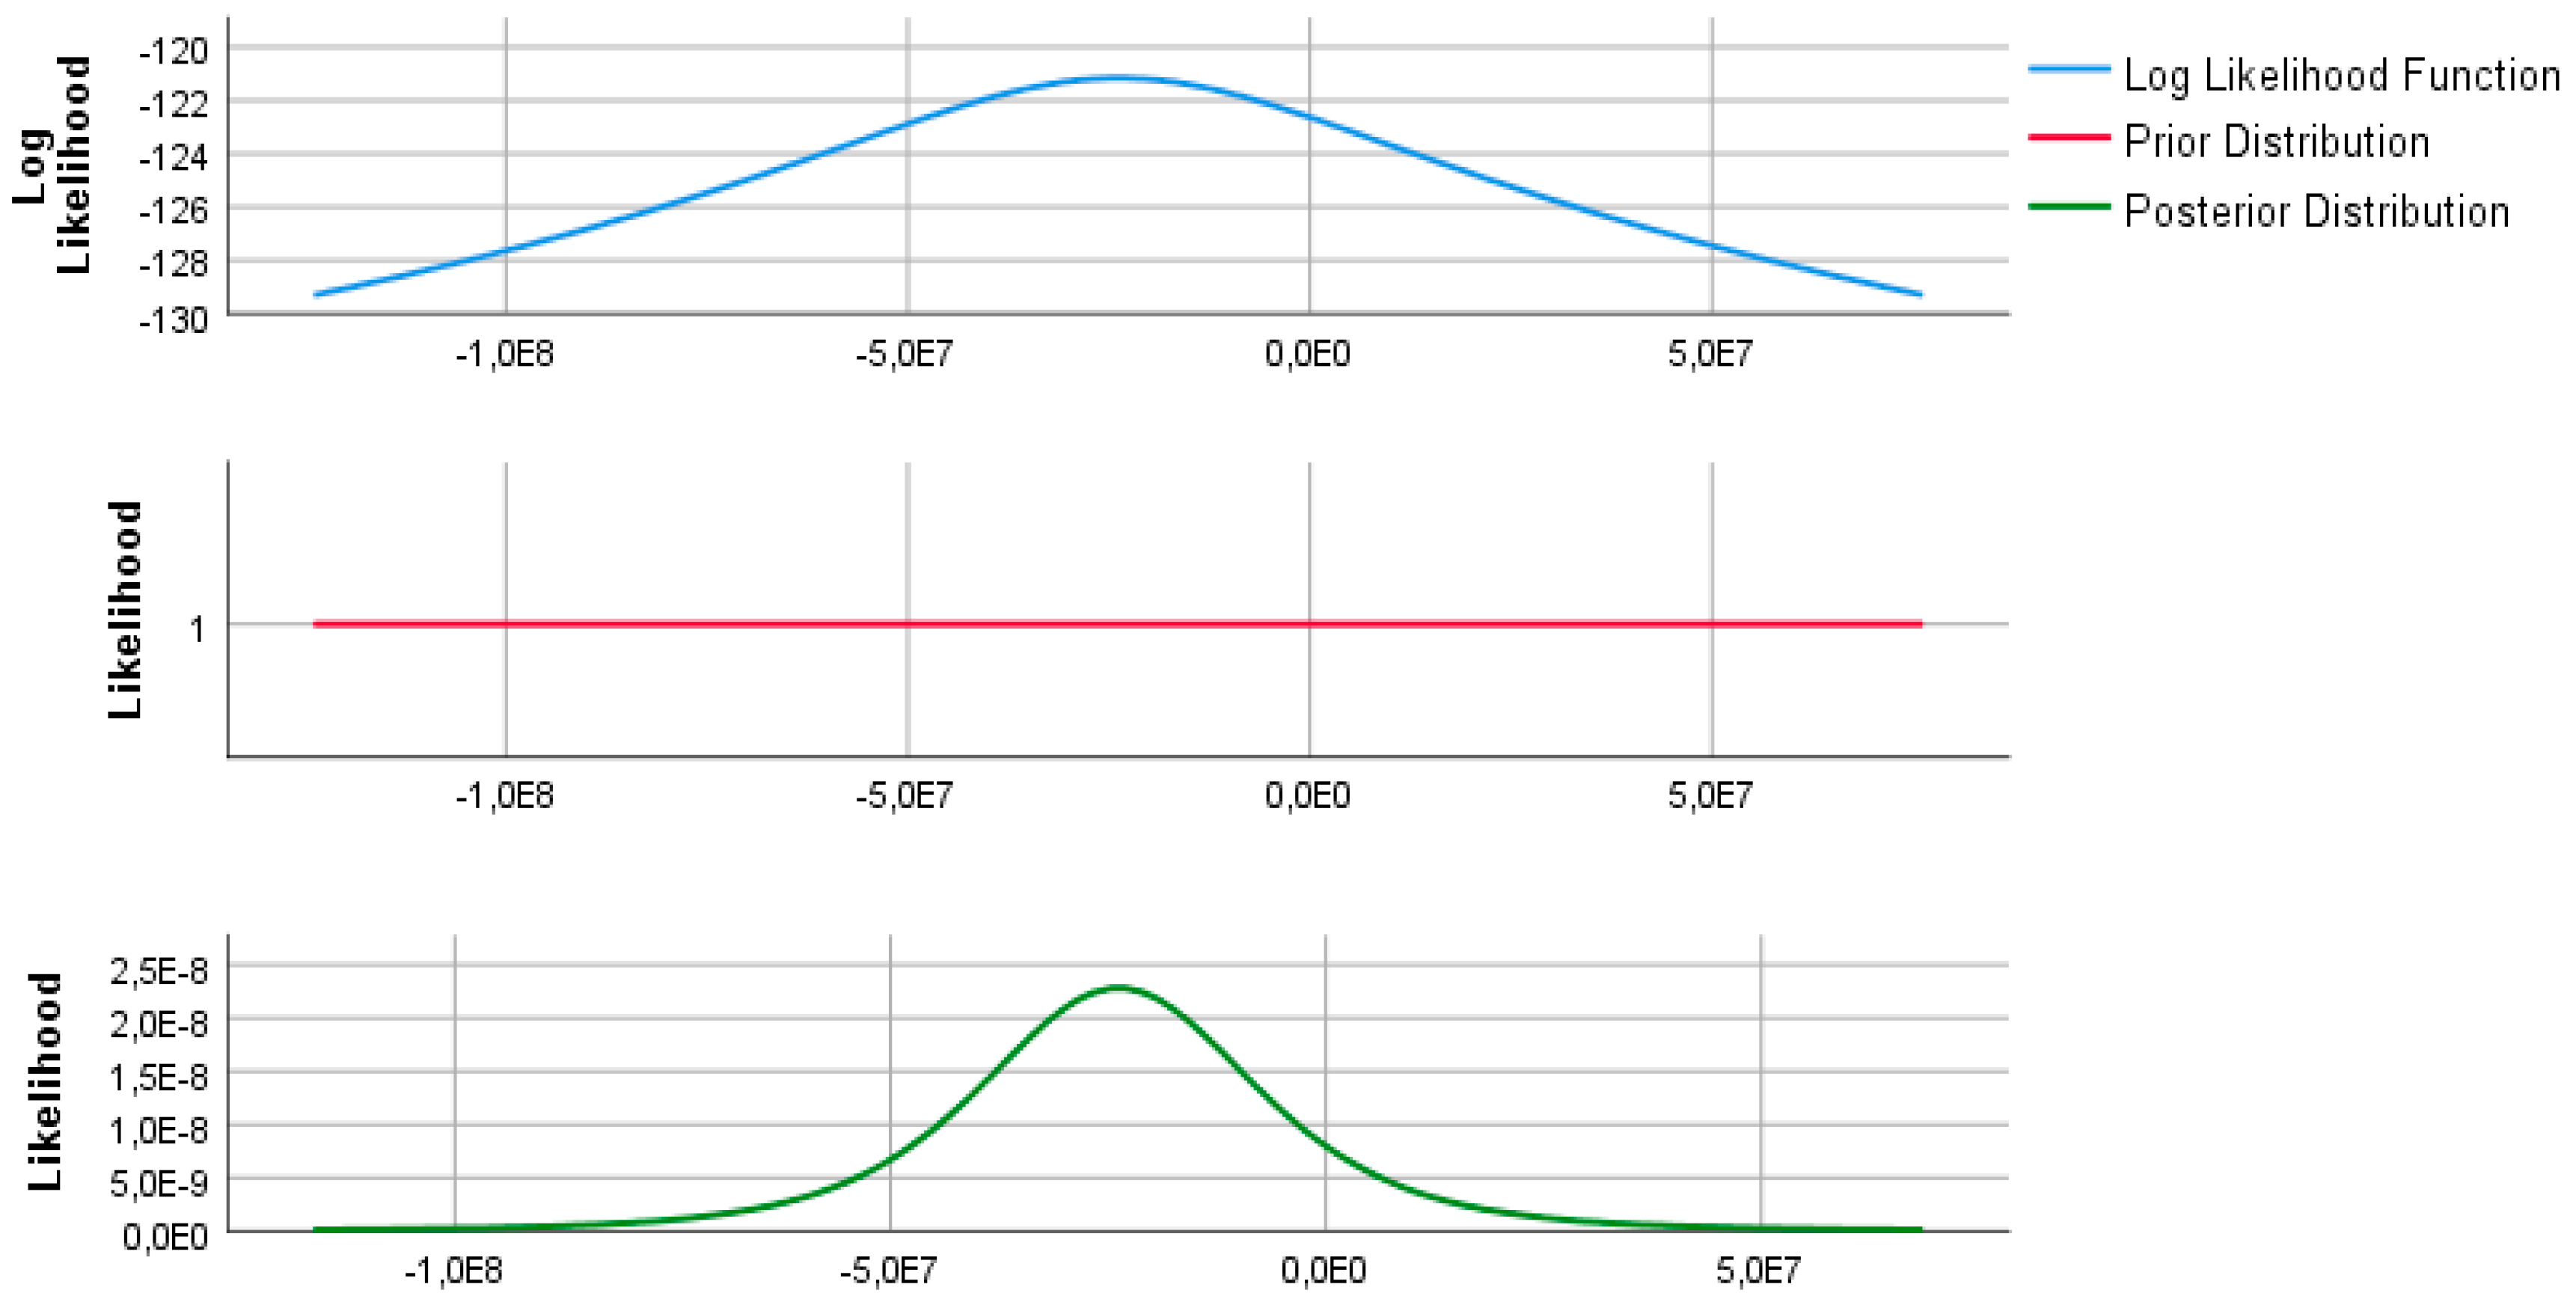
The statistical analysis on pairs at the budget level shows that the distribution according to the Log probability reaches the inflection point in the immediate vicinity of the middle of the interval. This means that a unitary distribution policy was applied at the level of the budgeting funds. The statistical analysis shows that, excepting the AP4 axis in the OP-Environment, the EU non-reimbursable financing contribution to the OP was thought to be at 85% of the total budgeted amount. The data are shown in Figure 2.
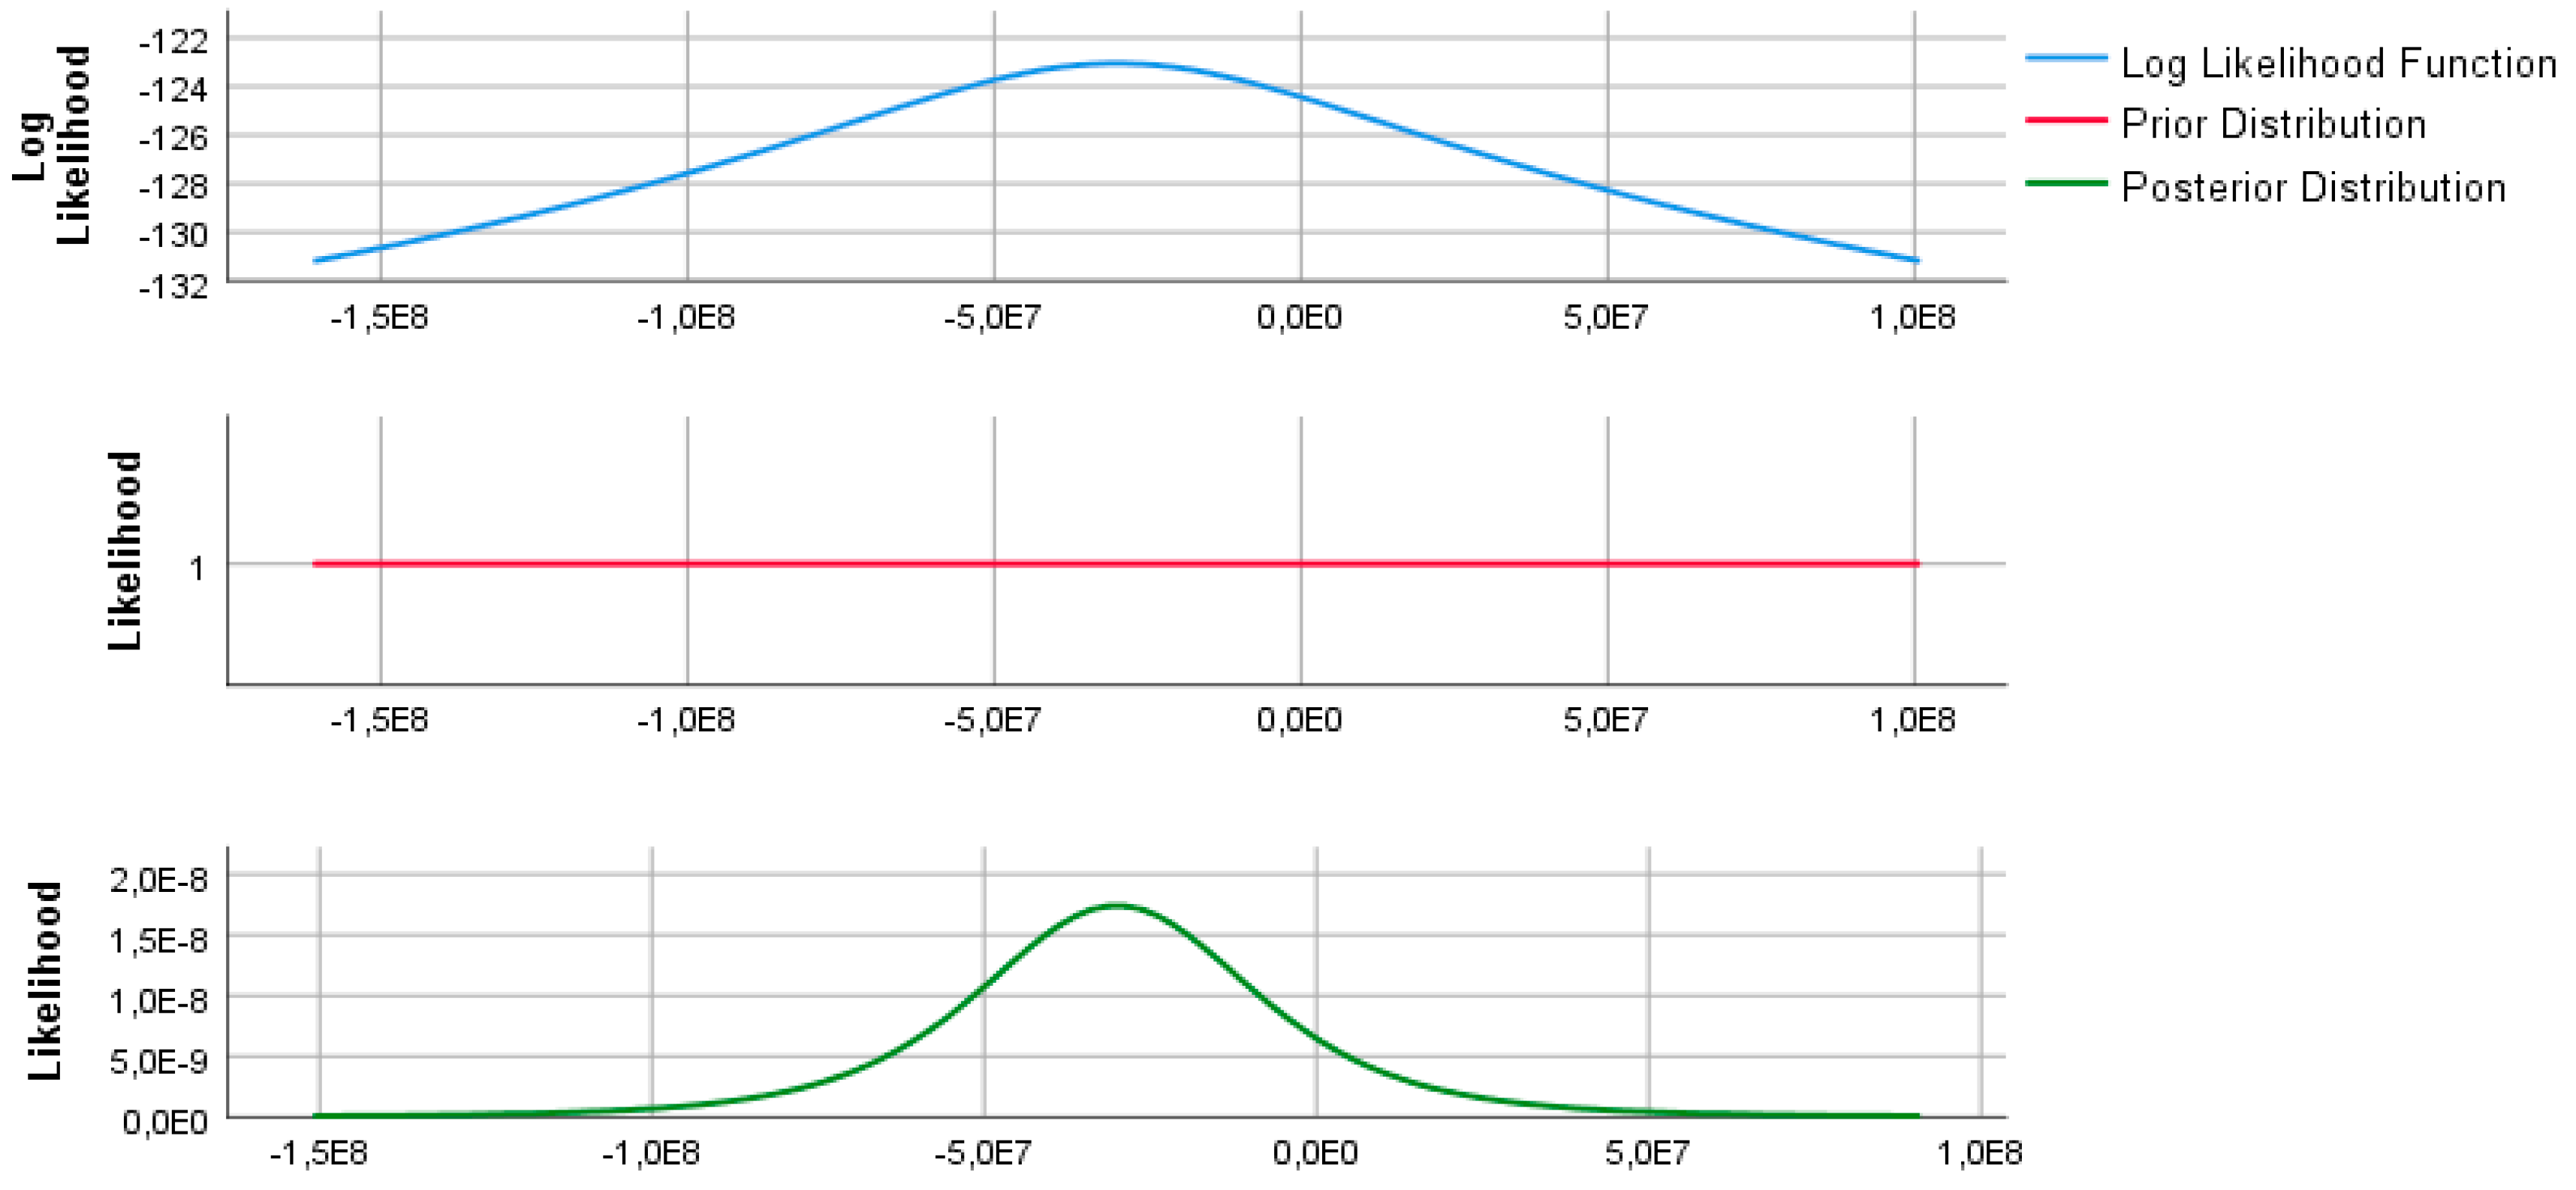
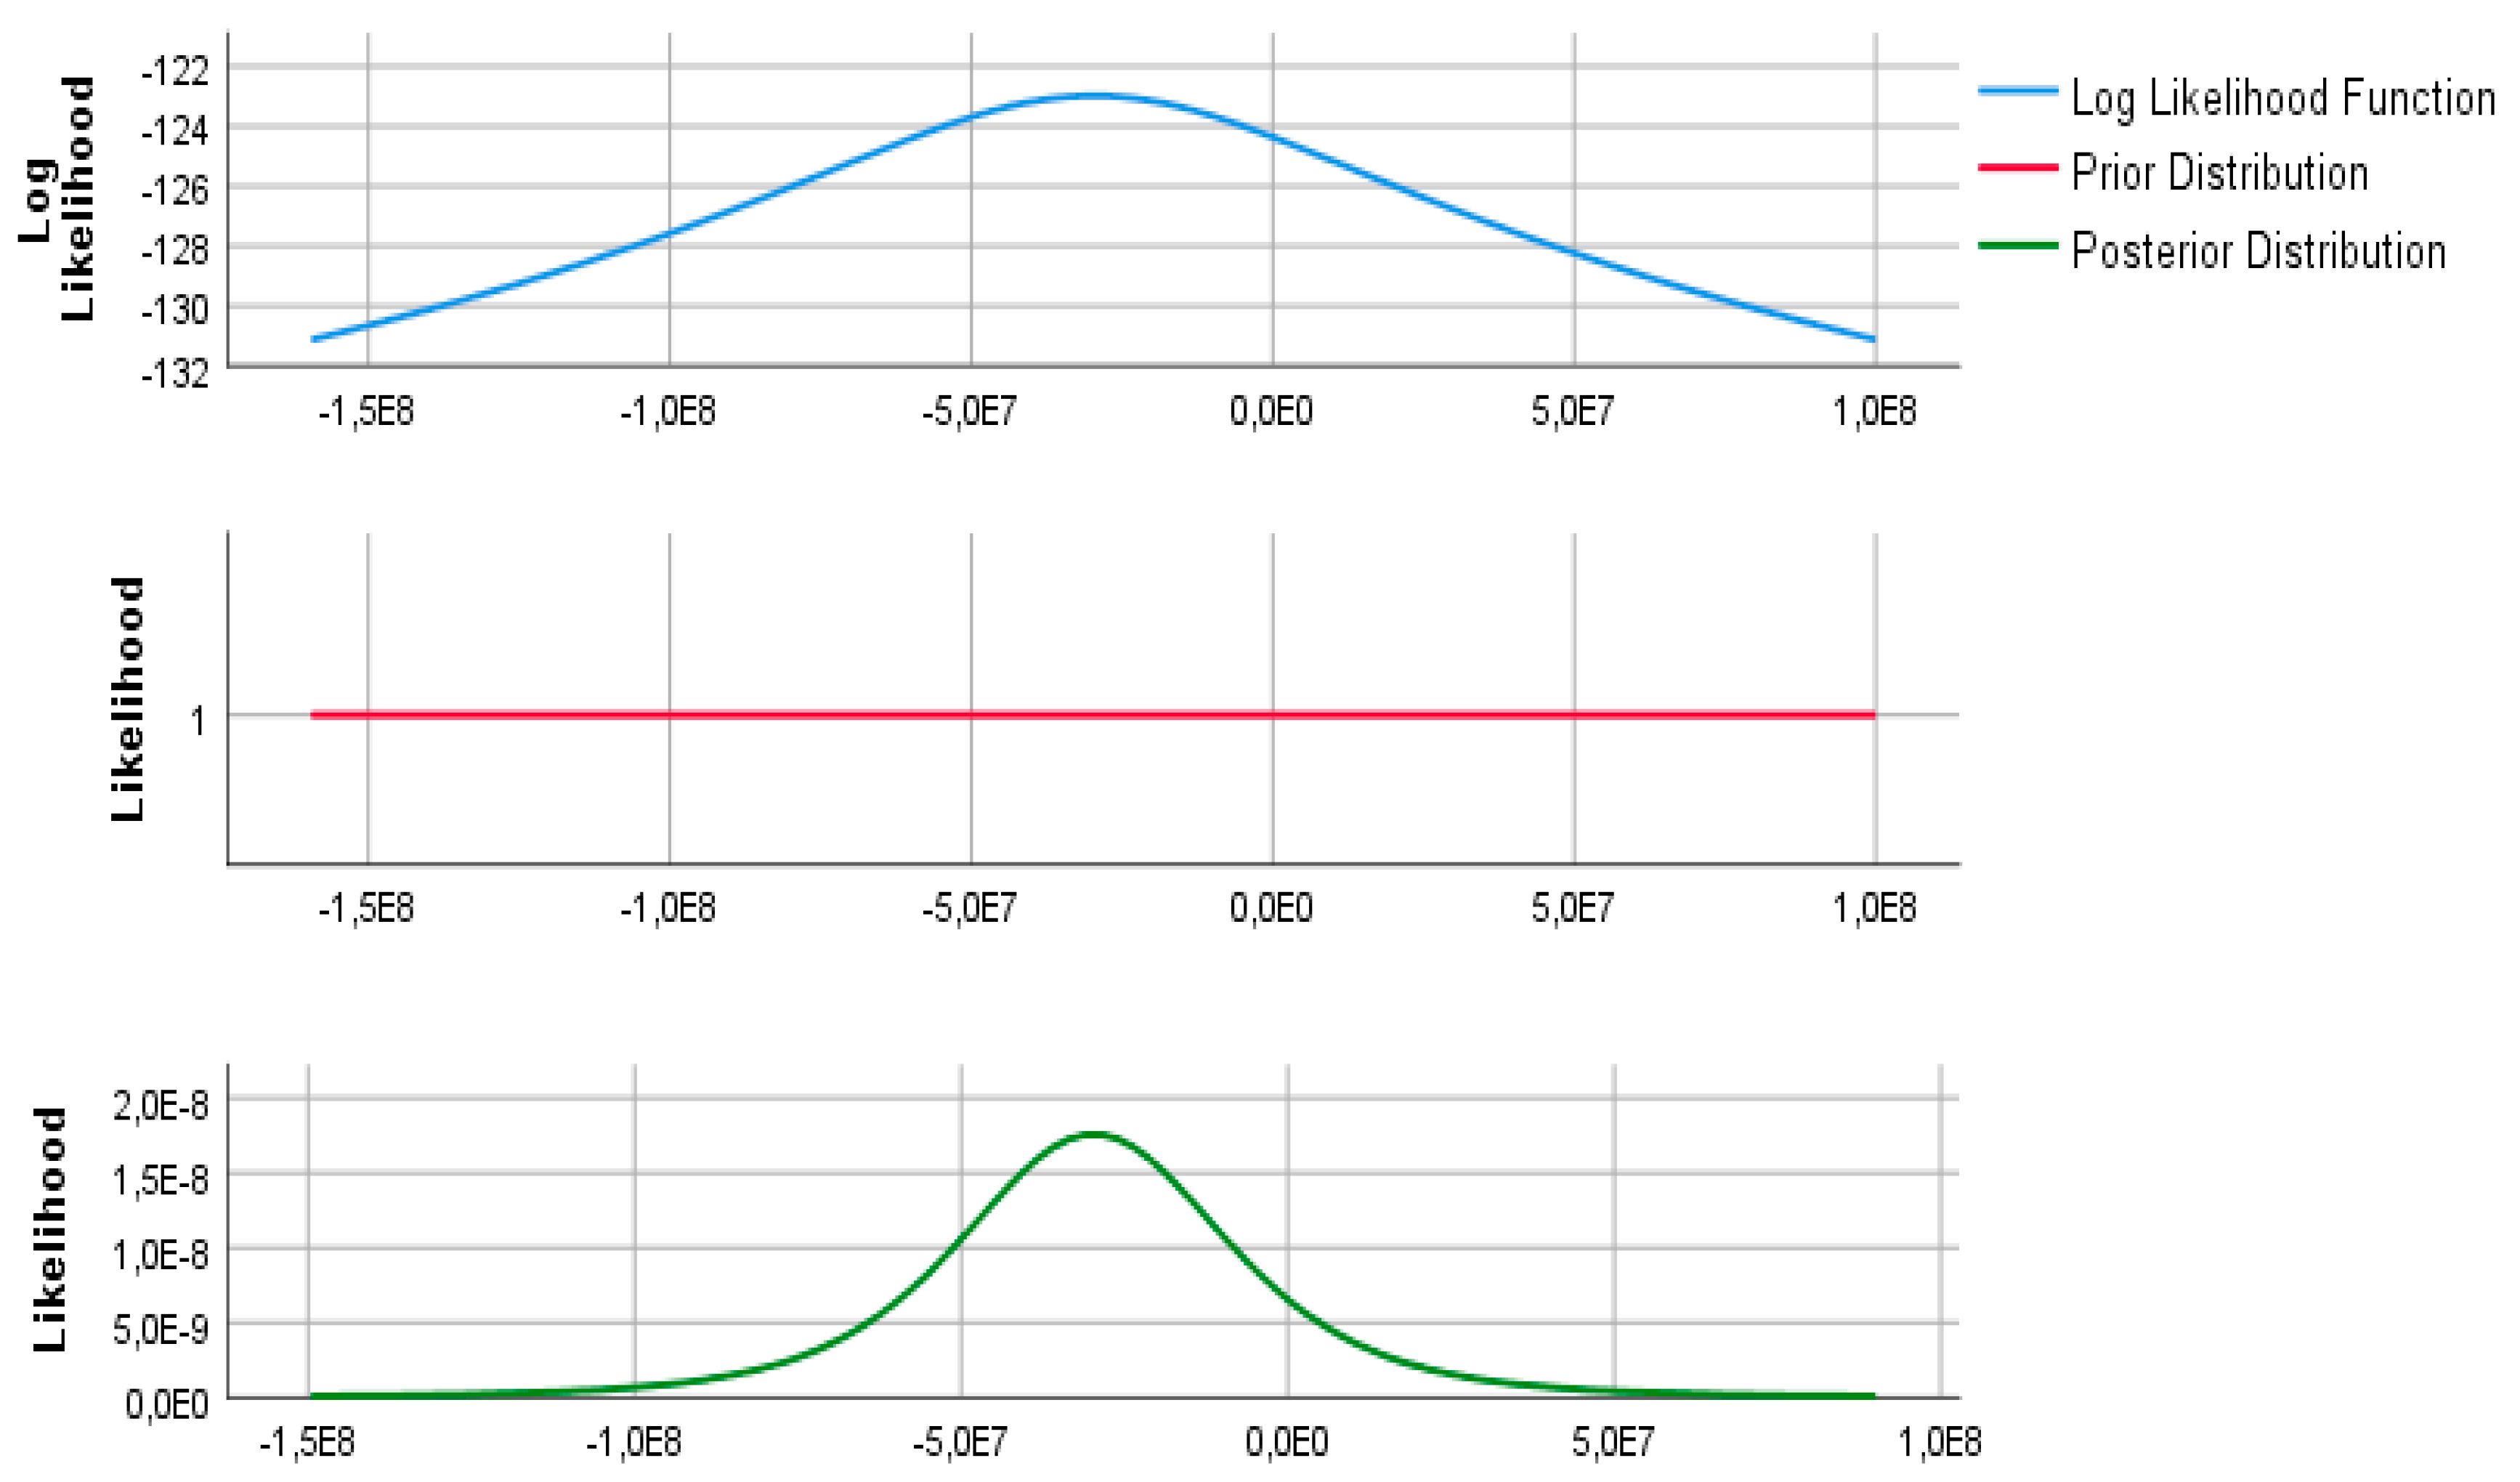
The data pair analysis at the submission project level shows that the distribution according to the Log probability reaches an inflection point further than the midpoint of the interval for budgeting due to the observed irregularities and the reduced absorption capacity of the funds compared to the budget planned level. Practically, the level of the submitted projects achieves, in terms of EU non-reimbursable contribution, an average of 64% for the OP-Environment and an average of 78% in the case of OP-Large Infrastructure. The authors of this paper anticipate that this difference between the two OPs is also based on an increase in the beneficiaries’ managerial competitiveness, which was accumulated following the experience of the OP-Environment program (see Figure 3).
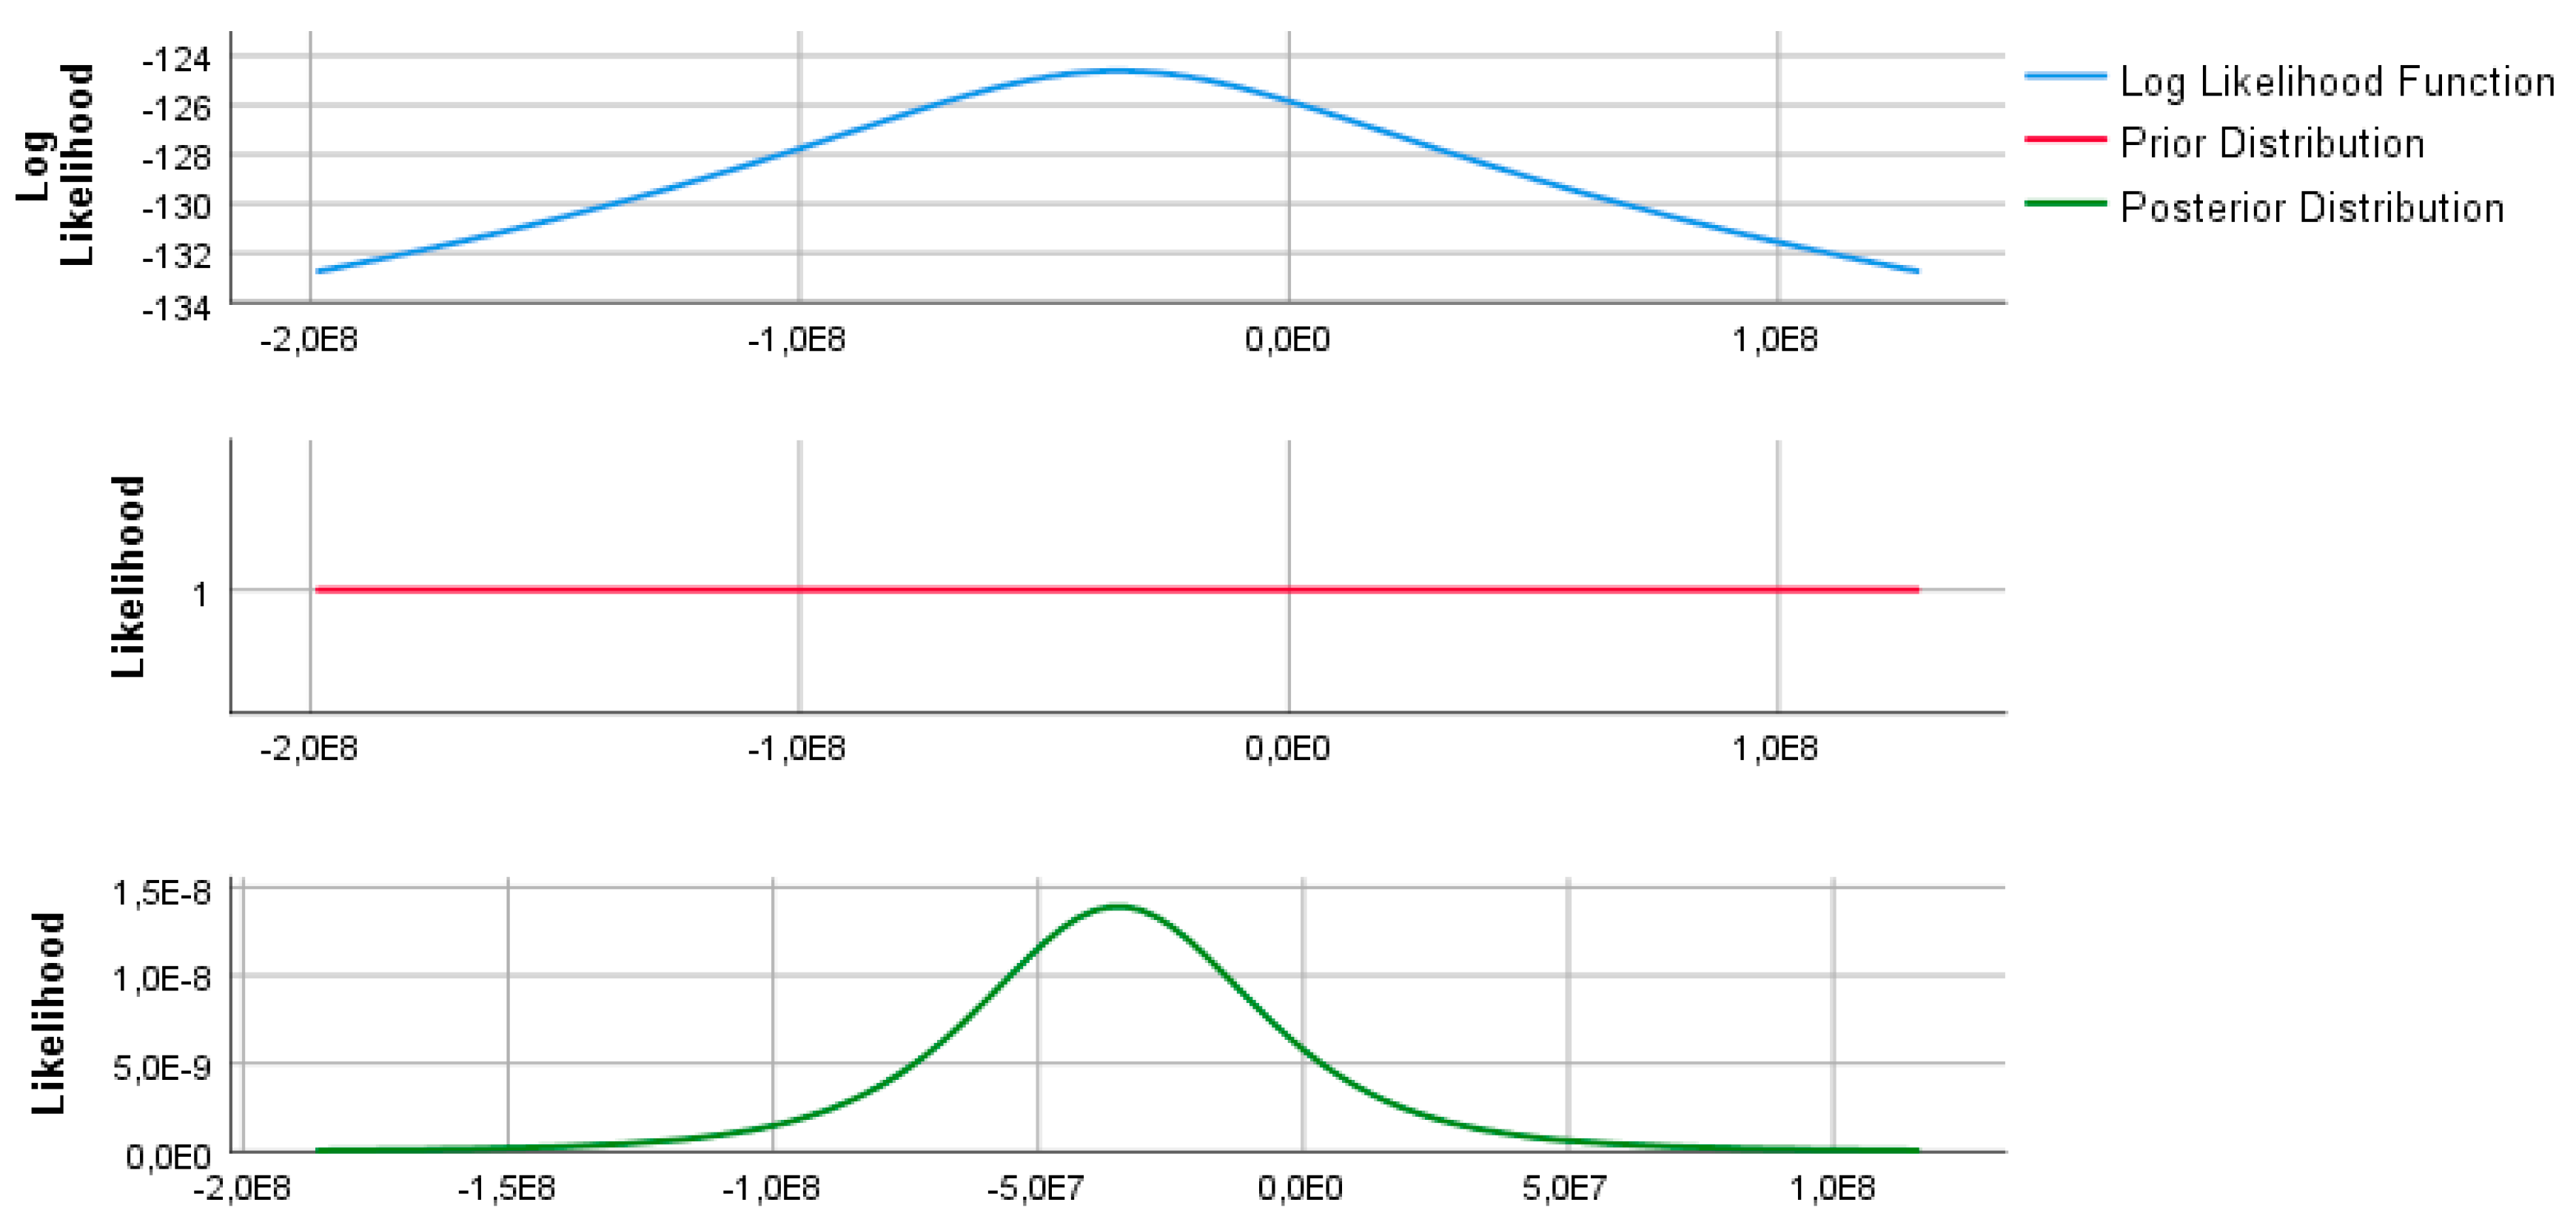
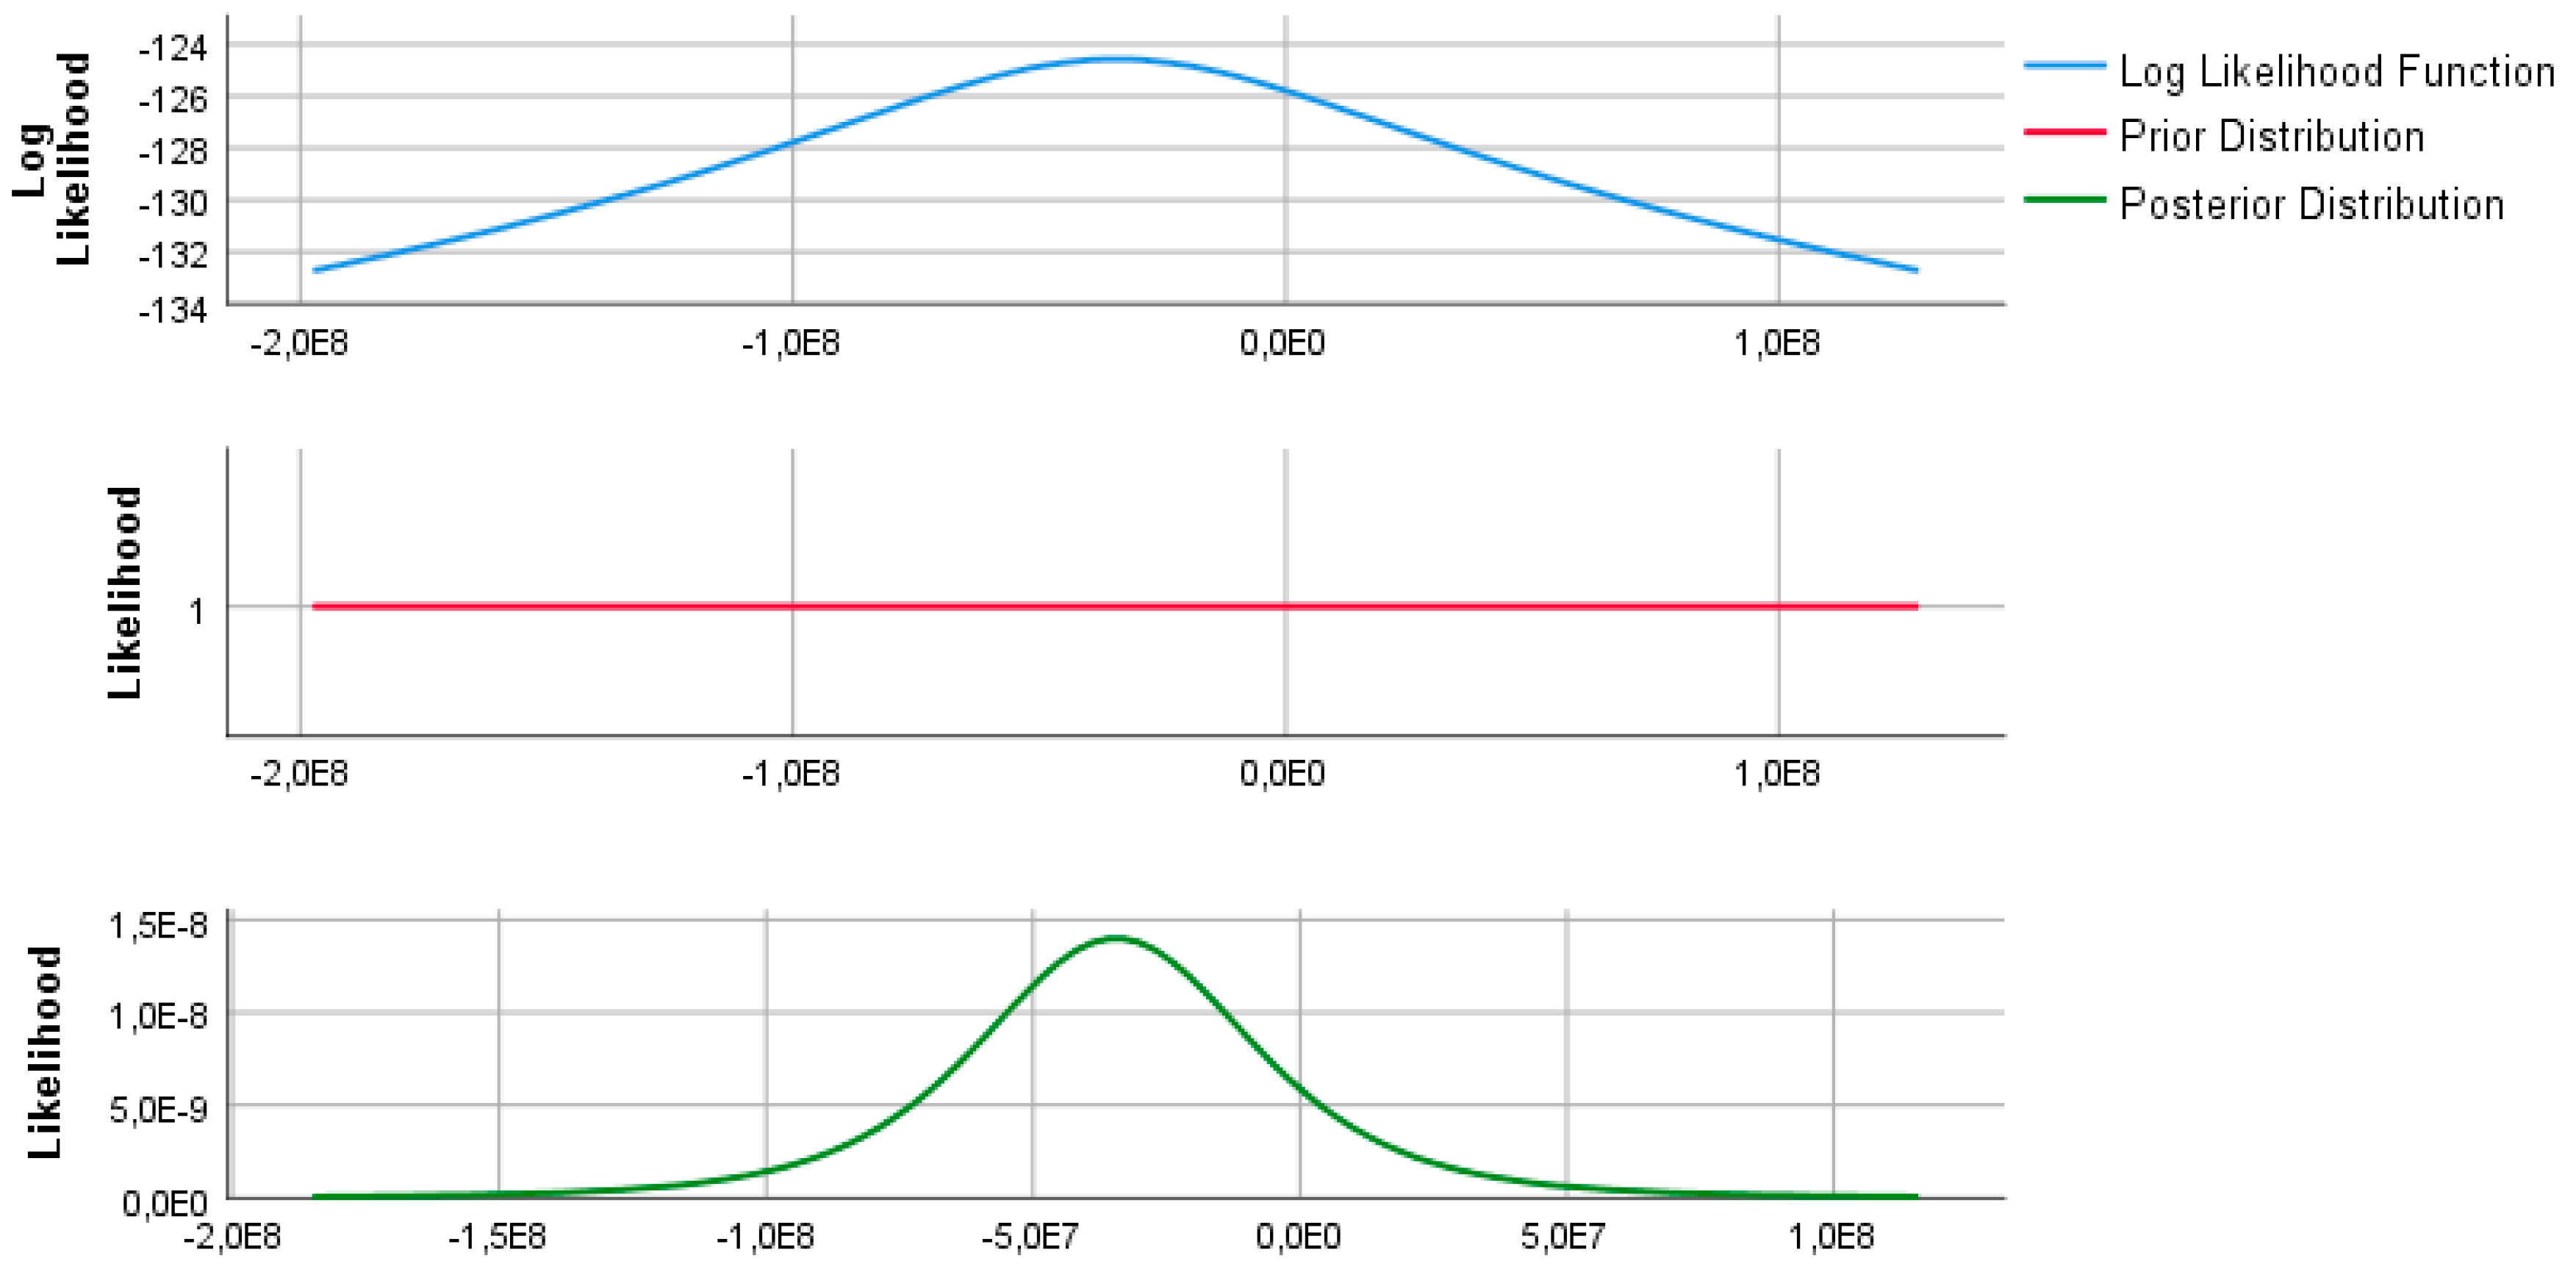
The data pairs analysis at approved project level shows that the Log probability is the furthest from the center of the interval compared to previous cases. As a result, at the level of approval, the distribution policy was deeply affected by the irregularities found in the audits carried out during the audit missions. The percentage is decreasing comparing to the value of the submitted projects by 5.13% on average, reaching a 59% approval threshold. The biggest difference is recorded on Axis 5 of the OP-Environment, in which case the project approval reduced the financed amounts by 11.65%. In the case of OP-Large Infrastructure, the situation is better, the approval percentage being close to the submitted percentage. The biggest irregularity is registered on Axis 6, with a negative difference of 9.32% (see Figure 4).
The second alternative of the model NOP involved the adjustment of the databases to the values found to be non-compliant following the audit missions (199 cases for the OP-Environment, with a total ineligible value of 268 million EUR, and 24 cases for the OP-Large Infrastructure, with an estimated amount of irregularities of 3.65 million EUR). The amount of irregularities was broken down into two types of contributions—the EU and the national one—according to the contribution rates calculated at the time of approval of the projects. The ineligible amount of the national contribution was added directly to the funds provided by the beneficiaries’ own contribution. The difference was reduced by the EU contribution affecting the approved percentage, which reduced the EU contribution as a share of the total amount actually paid on the project.
In the OP-Environment, where the irregularities were significant, the value of the adjustments represented 5% of the approved value of the projects with non-reimbursable financing.
The data were tested using the same method as for unadjusted amounts, resulting in a distortion of the allocated values in Table 8 and Table 9.
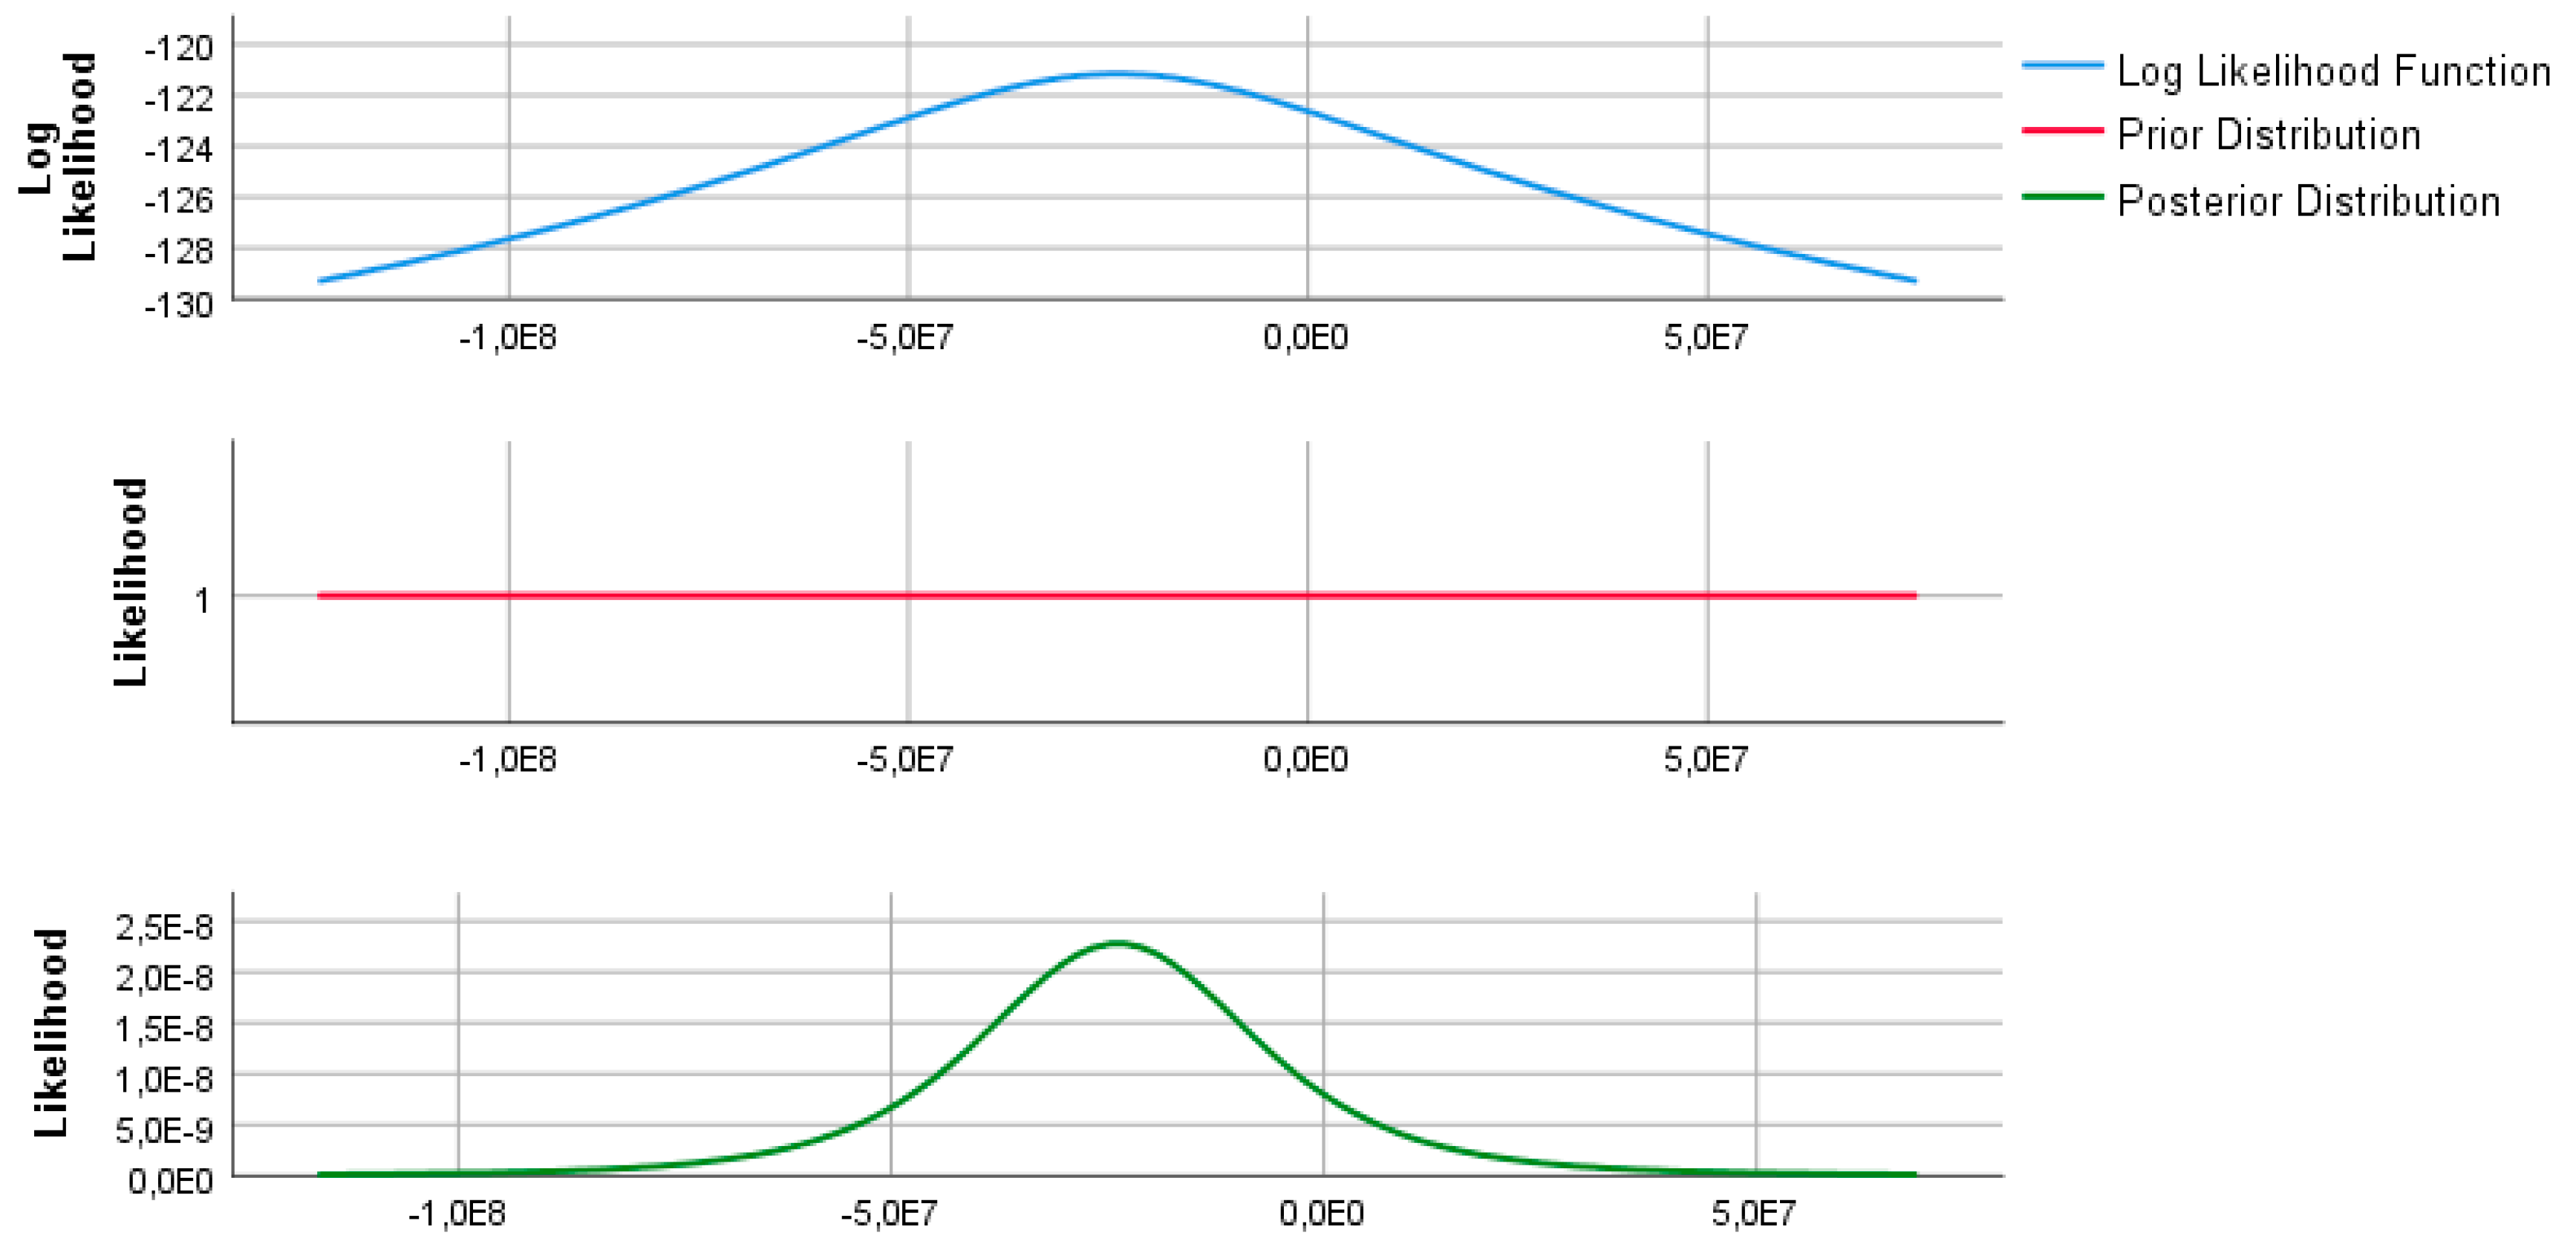
The analysis of data based on the log probability reveals a similar trend behavior for all three situations, given the small weight of the adjustment in relation to the total sums—respectively, 5% irregularities found out of the total value budgeted on OP-Environment and 0.03 % irregularities found out of the total amount budgeted on OP-Large infrastructure.
Although as significant as the sum, the value of the non-conformities fails to disturb the general trend of the financing evolution, confirming that the proposed model in this paper (NOP) is viable from the statistical results point of view, confirming all the work hypotheses (see Figure 5, Figure 6 and Figure 7).
The author verified the generality and feasibility of mathematical model construction and the following statistical test are realized by SPSS Statistics (25 version). For OP-Environment, T-TEST PAIRS = N O P with N′O′P′ (paired)/Criteria=CI (0.9500) (Table 10).
Where
  • T-TEST PAIRS—statistical procedure of analyzing for testing the NOP model (testing on paired samples)
  • Criteria = the means of segregation for the tested sample.
  • CI—incidence coefficient (95.0%).
  • NOP—the risk of fraud and error through all identified elements that characterize it (the need for funding, opportunity and permissibility).
  • NOP′—the risk of fraud and error through all the identified elements that characterize it (the need for funding, opportunity, and permissibility) reduced after the application of legislative regularity measures.
  • N & N′—the financial need (expressed in terms of bid for OP-Environment) assimilated to fraud and error before and after regulatory practices.
  • Bid—financing request.
  • O & O′—the cumulative vulnerability that generates the opportunity for fraud and error versus the residual opportunity in the assimilation of fraud and the reduced error through legislative regularity practices;
  • P & P′—the vulnerabilities that generate permissibility for producing frauds and errors versus the residual permissiveness assimilated to fraud and error through legislative regularity practices.
Statistics for each analysis are based on the cases with no missing (or out-of-range data) for any variable in the analysis.
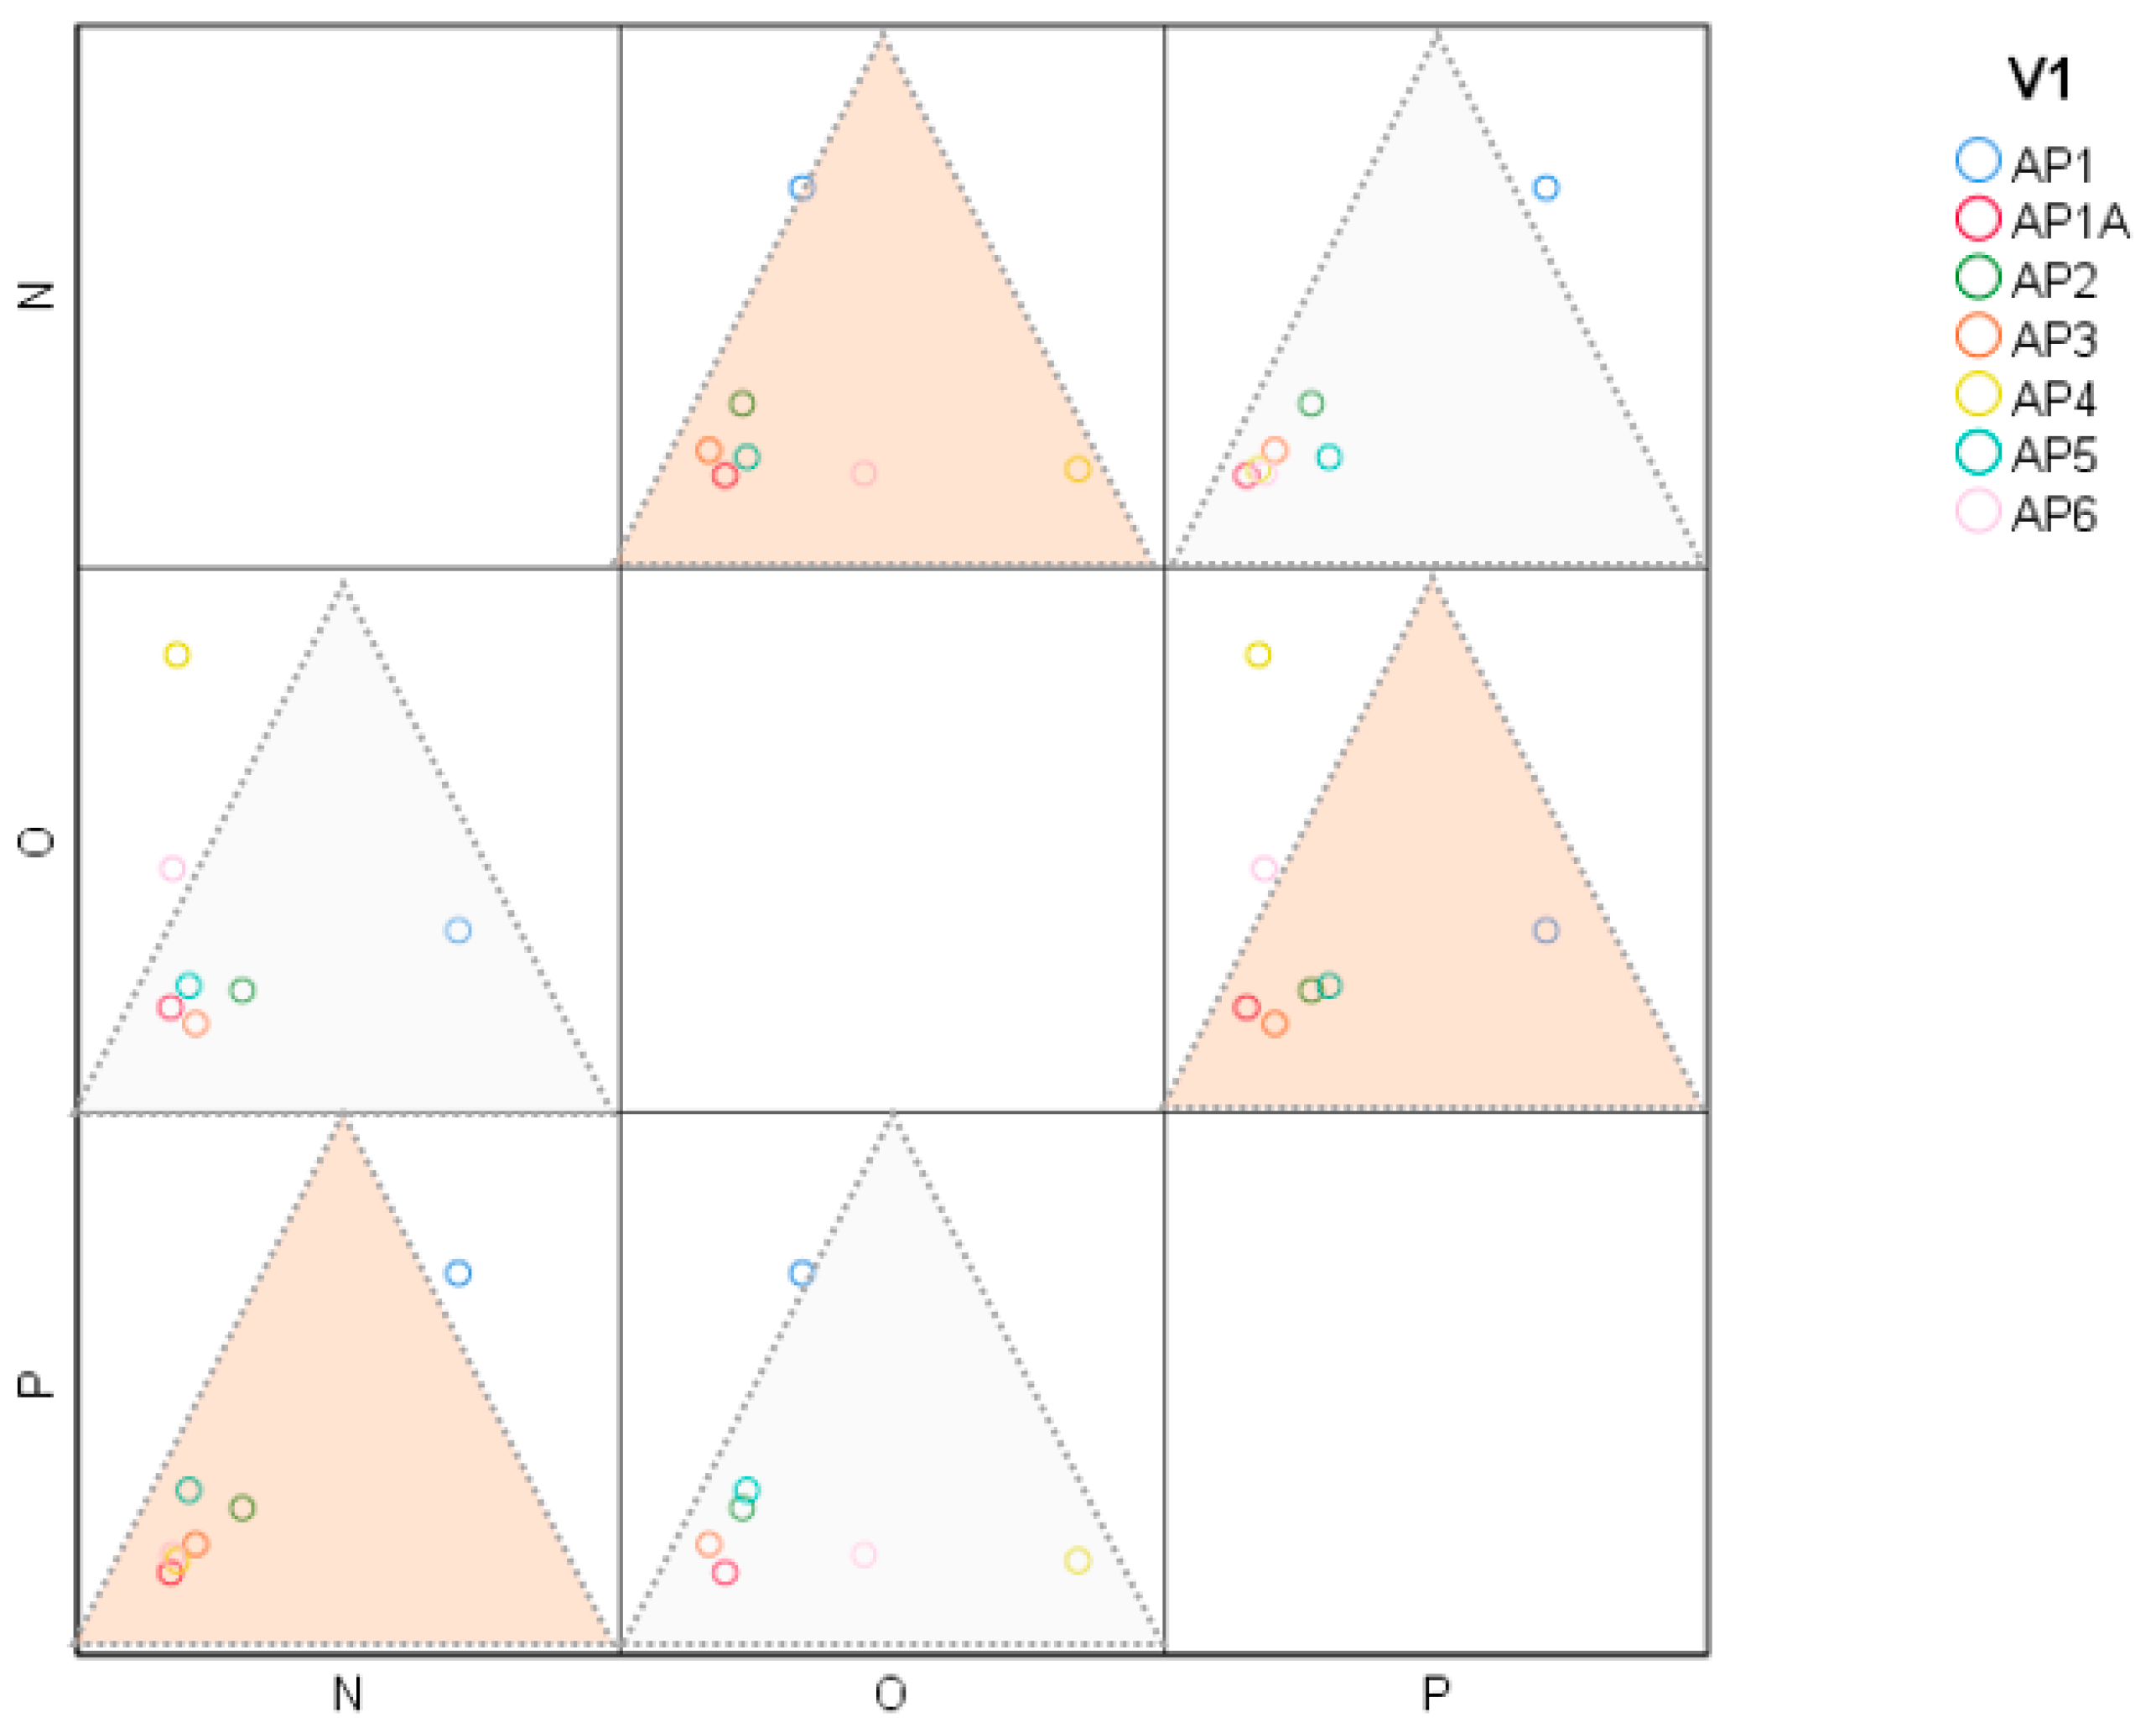
High statistical significance, more than 94%, was observed by paired samples correlations (Table 10). Scale statistics for the NOP model demonstrate the model variables correlations for the 95% confidence interval as the following (Table 11, Figure 8):
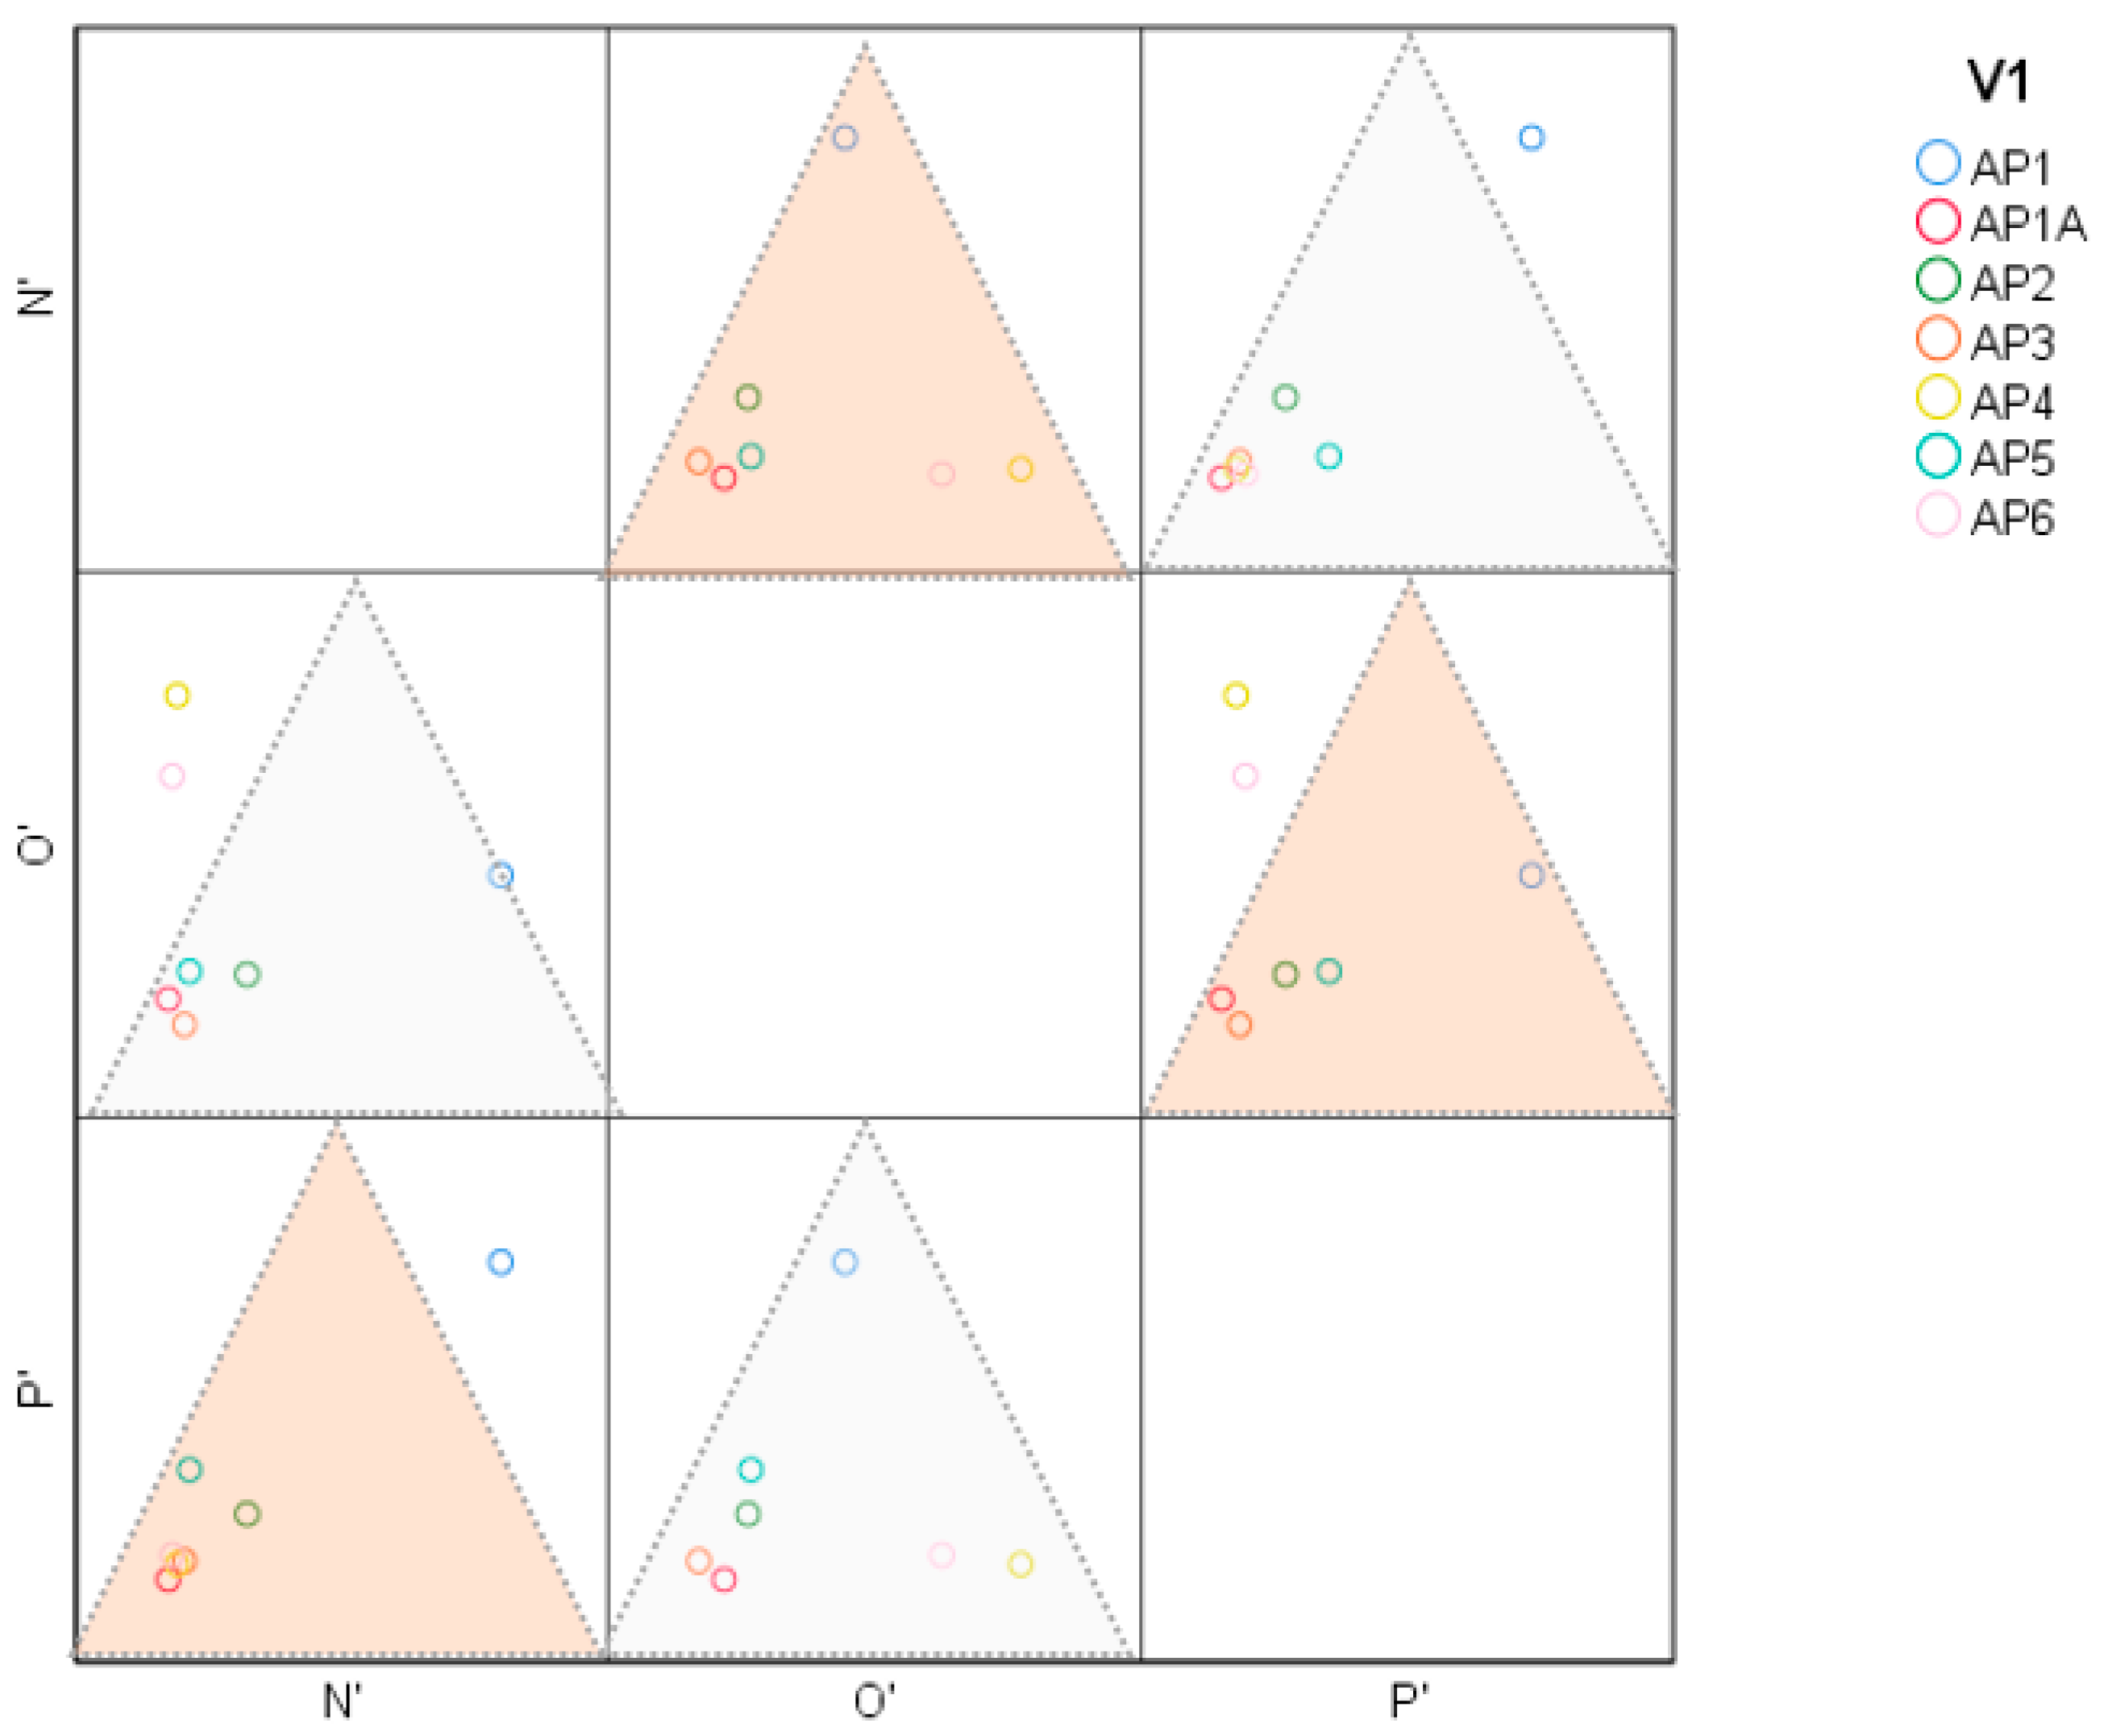
Scale statistics for the N’O’P’ model demonstrate the model variable correlations for the 95% confidence interval as the following (Table 12, Figure 9):
The authors verified the generality and feasibility of the mathematical model construction, and observed the higher correlation of N’O’P’ against NOP after applying a reduction in the opportunity for the assimilation of fraud and the reduced error through legislative regularity practices.

4. Results and Discussions

The Operational Programs Large Infrastructure and Environment have a direct impact on sustainability at the primary level of the concept identified at the 1992 World Environment Conference in Rio de Janeiro (a concept that involves striking a balance between economic growth and environmental protection and finding alternative resources). The term synonymous with sustainable development is usually preferred when referring to the overall economic development of a country or a region. In other words, directing investments to strategic areas (environment and infrastructure) allows priority to be given to the sustainable development of the economy as a whole. In practice and according to the research presented, infrastructure investment projects present a major risk for fraud and error due to the production process; the significant value of the investments; and, specifically for Romania, the long duration of investment, during which the mentioned phenomena dilute the investment effort and affect the expected results of the funding programs. The authors had at their disposal the data regarding all the developed programs in Romania through European structural funds. As a result, we can specify that there are priority axes of financing that have a much lower impact on sustainability, such as the Regional Operational Program, the Administrative Capacity Operational Program, the National Rural Development Program, and the Operational Program for Fisheries and Maritime Affairs.
The study aim consists of a new approach related to analysis and performance improvement in attracting EU funds and identifies viable solutions for the recovery of the current situation. The performance in attracting structural funds it seen as a desideratum for all the programs, because the purpose of these programs is sustainable development, an objective included in the 2030 Agenda as well.
The present paper analyzed the values of the projects financed through two consecutive OPs carried out in accordance with the EU Cohesion Policy in Romania during 2007–2019. It was found that there was a project approval rate of 77% in the case of OP-Environment and a rate of 58% of the submitted projects under OP-Large Infrastructure, at least during the period 2007–2013. The PO-Medium Axis values are presented in Table 13.
According to the data in Table 13, more than 6.5 billion EUR of structural funds were managed, with the amount of paid European contribution being 3.9 billion EUR on programs for which irregularities of 268 million EUR were detected during the monitoring period. In particular, the analysis targets: the acquisition segment (breach of current legislation), the non-implementation of the project during the post-monitoring period in correlation with the non-fulfilment of the assumed objectives of the project (for this aspect, action for the recovery of all paid amounts to the beneficiary is triggered in court), the violation of the principles of equal treatment and transparency, applying discriminatory criteria, irregularities found from the project audit, etc.
Under the OP-Large Infrastructure, have been submitted 421 projects (Table 14), amounting to more than 13.6 billion EUR, which represents a doubling of the financing request compared to the previous OP-Environment program. In the case of OP-Environment, the approved value was equal to the value of the submitted projects, the approval rate being 94%. In the case of OP-Large Infrastructure, the approval rate is 72% from the value of the projects and 58% from the number of approved projects. There is an increase in the project approval rigor, but there is a limitation for the PO-IM case—a limitation resulting from the absence of the grace period under the EU program that is defined by the 2020 horizon.
Under the OP-Large Infrastructure, for the submitted projects were reported irregularities of 3.65 million EUR, irregularities that were subject to the same 2020 limitations.
The main irregularities are related to the poor implementation of the project, the significant reduction in the object of the contract, the violation of the legislation on public acquisitions, non-conformities in the tender evaluation procedure, the defective application of the selection criteria, and the finding of illegal and discriminatory attributions.
We appreciate that these aspects of the observed irregularities could be significantly reduced by applying the NOP model and the adjustment variables on two levels: the legislative regulator and the security in auditing European funds (Table 2 and Table 3).
Regarding audit security, the context of the technical, legislative, and willing constraints of the competent authorities within the Ministry of European Funds, which limits, delays, and dilutes the effect of audit measures by two consecutive shortcoming options, is very important. The first decision aimed at implementing the ISRS 4400 (International Standard on Related Services 4400) measures in auditing EU-funded projects, which resulted in a security reduction effect of at least 50%. The second decision targeted, starting with OP-Large Infrastructure 2014–2020, the exclusion of the eligible project expenditure with an audit from the eligible expenditure category, but maintaining the audit requirement. This decision has generated go-to-bottom behaviors in relation to the acquisitions of audit services paid from the beneficiaries’ own funds, which has diluted auditing security. Financially transposed, these two extremely damaging measures have increased the risk area of error with at least the difference between the amounts of irregularity declared in the two successive OPs. Thus, the undetectable area increases by more than 260 million EUR estimated on the basis of gross figures, plus the limitations on the OP- Large Infrastructure completion horizon and the doubling of the value of the submitted projects, which probably adds another 100 million EUR to the risk of failure in detecting errors.
The NOP model, in the context of the referral of the literature and the inertia of the authorities in the assimilation of the signals presented by the researchers, is a necessary tool in demonstrating the good intentions of at least the competent authorities in the management structural funds for the next financing horizon (2021–2027).
We consider the NOP model as an innovative tool that, through implementation, can increase performance in attracting EU funds, helping to achieve the EU’s convergence objectives and strengthening financial security in funding for non-reimbursable projects by shrinking the fraud triangle with at least the areas of legal regularity and security by audit measures.

5. Conclusions

The research carried out in our study brings added value to relevant knowledge, primarily by the objective assessment of the state of knowledge in terms of developing a performance audit as a secure factor and multiplying the effects proposed for convergence programs within the EU.
The research of the achievements regarding the projects with non-reimbursable financing shows that they are not honored by the contracts. According to the final statement of expenditure sent by Romania to the European Commission, the effective absorption rate was only 79.23%. If we compare the effective absorption rate with the expenses reported through reimbursement requests, we notice that the difference is 11.05% less.
The low absorption rate of European funds is related to the systemic inability of the institutions responsible for managing these funds to have efficient mechanisms and appropriate management systems. Here comes the role of the financial audit which has to be put into practice, both at the level of the audit authority for the Romanian Court of Accounts and at the level of the beneficiaries. The role of the financial audit is to eliminate the possibility (permissibility) from the “fraud triangle” through the appropriate audit mechanism. The beneficiary will no longer have the opportunity to commit fraud, even if the financial need exists.
The authors developed, implemented, and validated the new NOP model for reducing financial insecurity by identifying and quantifying the parameters for adjusting the legislative and financial security framework applicable to the projects funded by structural funds’ implementation.
Four working hypotheses (H1–H4) have been established, statistically tested, and validated along with the model in the chapter on methodology. Statistical validation was achieved by consolidating a database covering 12 years and more than 1000 projects funded from structural funds.
Taking into account the obtained results, the model is recommended to be useful to competent authorities in the sustainability of the structural funds management, within an average period, by reducing fraud and error phenomena.
Our research represents a new approach to a better understanding of the EU funds sustainability absorption, which is able to decrease fraud and error phenomena which affect the absorption rates in Romania and abroad. In this context, the role of audit is significant. The authors propose a theoretical model for evaluating the sustainable management of European funds after the implementation of audit procedures with an effect on reducing the phenomena of fraud and error. The theoretical model was practically tested by case analysis on projects carried out on two financing axes, highlighting the validity of the model through statistical tests run through the IBM-SPSS 25 software. In addition, the model is obviously useful for regional/local decision makers in order to mitigate the described-above phenomena. From a theoretical point of view, NOP is a useful exercise in universities, especially for entrepreneurs focused on developing their business in a sustainable way by using EU funds. From the research point of view, NOP is interesting because it brings a new approach to the field and offers possibilities for the further extension of the analysis by increasing the number of variables taken into account.
The limitations of the study are related to the limited nature of the used data (collected for only two programs, OP-Environment and OP-Large infrastructure) and the introduced variables during the conceptualization of the model. These can be further extended to adapt the model to the current crisis situation.
Supporting our point of view, we will continue the research in order to apply our NOP model to other operational programs, but only under a sustainable approach. To start with, we will focus on the European Regional Development Fund (ERDF).

Author Contributions

Conceptualization, V.-M.A., R.V.I., and M.L.Z.; methodology, M.L.Z., R.V.I. and V.-M.A.; software, M.N. and R.R.; validation, M.L.Z., V.-M.A. and M.N. formal analysis, M.N.; investigation, R.R. and A.C.; resources, R.R. and A.C.; data curation, M.L.Z. and A.C.; writing—original draft preparation, M.L.Z. and R.V.I.; writing—review and editing, M.N.; visualization, V.-M.A.; supervision, R.V.I.; project administration, R.R. and A.C. All authors have read and agreed to the published version of the manuscript.

Funding

This work was supported by the project “Excellence, performance and competitiveness in the Research, Development and Innovation activities at “Dunarea de Jos” University of Galati”, acronym "EXPERT", financed by the Romanian Ministry of Research and Innovation in the framework of Programme 1—Development of the national research and development system; Sub-programme 1.2—Institutional Performance, projects for financing excellence in research, development, and innovation, contract no. 14PFE/17.10.2018.

Conflicts of Interest

The authors declare no conflict of interest.

References

  1. Pellegrini, G.; Terribile, F.; Tarola, O.; Muccigrosso, T.; Busillo, F. Measuring the effects of European Regional Policy on economic growth: A regression discontinuity approach. Pap. Reg. Sci. 2013, 92, 217–233. [Google Scholar] [CrossRef]
  2. Crescenzi, R.; Rodríguez-Pose, A. Infrastructure and regional growth in the European Union. Pap. Reg. Sci. 2012, 91, 487–513. [Google Scholar] [CrossRef]
  3. Kyriacou, A.P.; Roca-Sagalés, O. The Impact of EU Structural Funds on Regional Disparities within Member States. Environ. Plan. C Gov. Policy 2012, 30, 267–281. [Google Scholar] [CrossRef] [Green Version]
  4. Bachtler, J.; Mendez, C.; Oraže, H. From Conditionality to Europeanization in Central and Eastern Europe: Administrative Performance and Capacity in Cohesion Policy. Eur. Plan. Stud. 2014, 22, 735–757. [Google Scholar] [CrossRef]
  5. Pinho, C.; Varum, C.; Antunes, M. Structural Funds and European Regional Growth: Comparison of Effects among Different Programming Periods. Eur. Plan. Stud. 2015, 23, 1302–1326. [Google Scholar] [CrossRef] [Green Version]
  6. Biondi, Y. Harmonising European Public Sector Accounting Standards (EPSAS): Issues and Perspectives for Europe’s Economy and Society. Account. Econ. Law 2014, 4, 165–178. [Google Scholar] [CrossRef]
  7. Tosun, J. Absorption of Regional Funds: A Comparative Analysis. JCMS J. Common Mark. Stud. 2014, 52, 371–387. [Google Scholar] [CrossRef]
  8. McCann, P.; Ortega-Argilés, R. Smart specialisation in European regions: Issues of strategy, institutions and implementation. Eur. J. Innov. Manag. 2014, 17, 409–427. [Google Scholar] [CrossRef]
  9. Haughton, T. Money, Margins and the Motors of Politics: The EU and the Development of Party Politics in Central and Eastern Europe. JCMS J. Common Mark. Stud. 2014, 52, 71–87. [Google Scholar] [CrossRef]
  10. Zaman, G.; Georgescu, G. The Absorption of EU Structural and Cohesion Funds in Romania: International Comparisons and Macroeconomic Impact; MPRA Paper: Munich, Germany, 2014; 57450; Available online: https://mpra.ub.uni-muenchen.de/id/eprint/57450 (accessed on 15 March 2020).
  11. Batusaru, C.; Otetea, A.; Ungureanu, M.A. 7 Years of European Funding in Romania—Between Success and Failure. EURINT Proc. 2015, 2, 21–35. Available online: http://cse.uaic.ro/eurint/proceedings/index_htm_files/EURINT2015.pdf (accessed on 15 March 2020).
  12. Palea, V. Whither accounting research? A European view. Crit. Perspect. Account. 2017, 42, 59–73. [Google Scholar] [CrossRef]
  13. Barnett, W.A.; Gaekwad, N.B. The Demand for Money for EMU: A Flexible Functional Form Approach. Open Econ. Rev. 2018, 29, 353–371. [Google Scholar] [CrossRef] [Green Version]
  14. Machado, M.R.R.; Gartner, I.R. The Cressey hypothesis (1953) and an investigation into the occurrence of corporate fraud: An empirical analysis conducted in Brazilian banking institutions. Rev. Contab. Finanças 2018, 29, 60–81. Available online: http://www.scielo.br/scielo.php?script=sci_arttext&pid=S1519-70772018000100060&nrm=iso (accessed on 12 April 2020). [CrossRef] [Green Version]
  15. Oroszki, J. Fraud risk for the EU budget—What the ECA recommends, Fraud and corruption, ethics and integrity. 2019, 2, pp. 26–31. Available online: www.eca.EURpa.eu/Lists/ECADocuments/JOURNAL1902/JOURNAL19_02.pdf (accessed on 17 April 2020).
  16. Chersan, I.C. Audit quality and several of its determinants. Financ. Audit 2019, 93–105. [Google Scholar] [CrossRef]
  17. Gepp, A.; Linnenluecke, M.K.; O’Neill, T.J.; Smith, T. Big data techniques in auditing research and practice: Current trends and future opportunities. J. Account. Lit. 2018, 40, 102–115. [Google Scholar] [CrossRef] [Green Version]
  18. Boros, A.; Fogarassy, C. Relationship between Corporate Sustainability and Compliance with State-Owned Enterprises in Central-Europe: A Case Study from Hungary. Sustainability 2019, 11, 5653. [Google Scholar] [CrossRef] [Green Version]
  19. Bostan, I.; Burciu, A.; Condrea, P. Trends of the communitarian cohesion policies and advertising for eco-investments. Environ. Eng. Manag. J. 2010, 9, 847–851. [Google Scholar]
  20. Jeppesen, K. The role of auditing in the fight against corruption. Br. Account. Rev. 2019, 51, 100798. [Google Scholar] [CrossRef]
  21. Farooq, O.; Shehata, N.F. Does external auditing combat corruption? Evidence from private firms. Manag. Audit. J. 2018, 33, 267–287. [Google Scholar] [CrossRef]
  22. Kassem, R.; Higson, A.W. External Auditors and Corporate Corruption: Implications for External Audit Regulators. Curr. Issues Audit. 2016, 10, 1–10. [Google Scholar] [CrossRef] [Green Version]
  23. Bostan, I.; Grosu, V. The social effects of the current economic crisis on the European Union labor market. Rev. De Cercet. Si Interv. Soc. 2010, 31, 7–21. [Google Scholar]
  24. Mates, D.; Grosu, V.; Hlaciuc, E.; Bostan, I.; Bunget, O.; Domil, A.; Moraru, M.; Artene, A. Biological assets and the agricultural products in the context of the implementation of the IAS 41: A case study of the Romanian agro-food system. Arch. Biol. Sci. 2015, 67, 705–714. [Google Scholar] [CrossRef]
  25. Hay, D.; Cordery, C. The value of public sector audit: Literature and history. J. Account. Lit. 2018, 40, 1–15. [Google Scholar] [CrossRef] [Green Version]
  26. Osma, B.G.; Gisbert, A.; Cristobal, E.H. Public Oversight Systems for Statutory Auditors in the European Union. Eur. J. Law Econ. Forthcom. 2014, 44, 517–552. [Google Scholar] [CrossRef]
  27. Edori, D.S.; Edori Simeon, I.S. Auditing and Fraud Control in Corporate Organisations. Res. J. Financ. Account. 2018, 9, 190–196. [Google Scholar]
  28. Herman, L. Neither takers nor makers: The Big-4 auditing firms as regulatory intermediaries. Account. Hist. 2019, 1032373219875219. [Google Scholar] [CrossRef]
  29. Howarth, D.; Spendzharova, A. Accountability in Post-Crisis Eurozone Governance: The Tricky Case of the European Stability Mechanism. JCMS J. Common Mark. Stud. 2019, 57, 894–911. [Google Scholar] [CrossRef]
  30. Jeler, I. Particularities of The Controlled Exercise on Projects Financed From European Funds. Int. J. Acad. Res. Account. Financ. Manag. Sci. 2018, 8, 51–56. [Google Scholar] [CrossRef]
  31. Anton, S.G.; Bostan, I. The Role of Access to Finance in Explaining Cross-National Variation in Entrepreneurial Activity: A Panel Data Approach. Sustainability 2017, 9, 1947. [Google Scholar] [CrossRef] [Green Version]
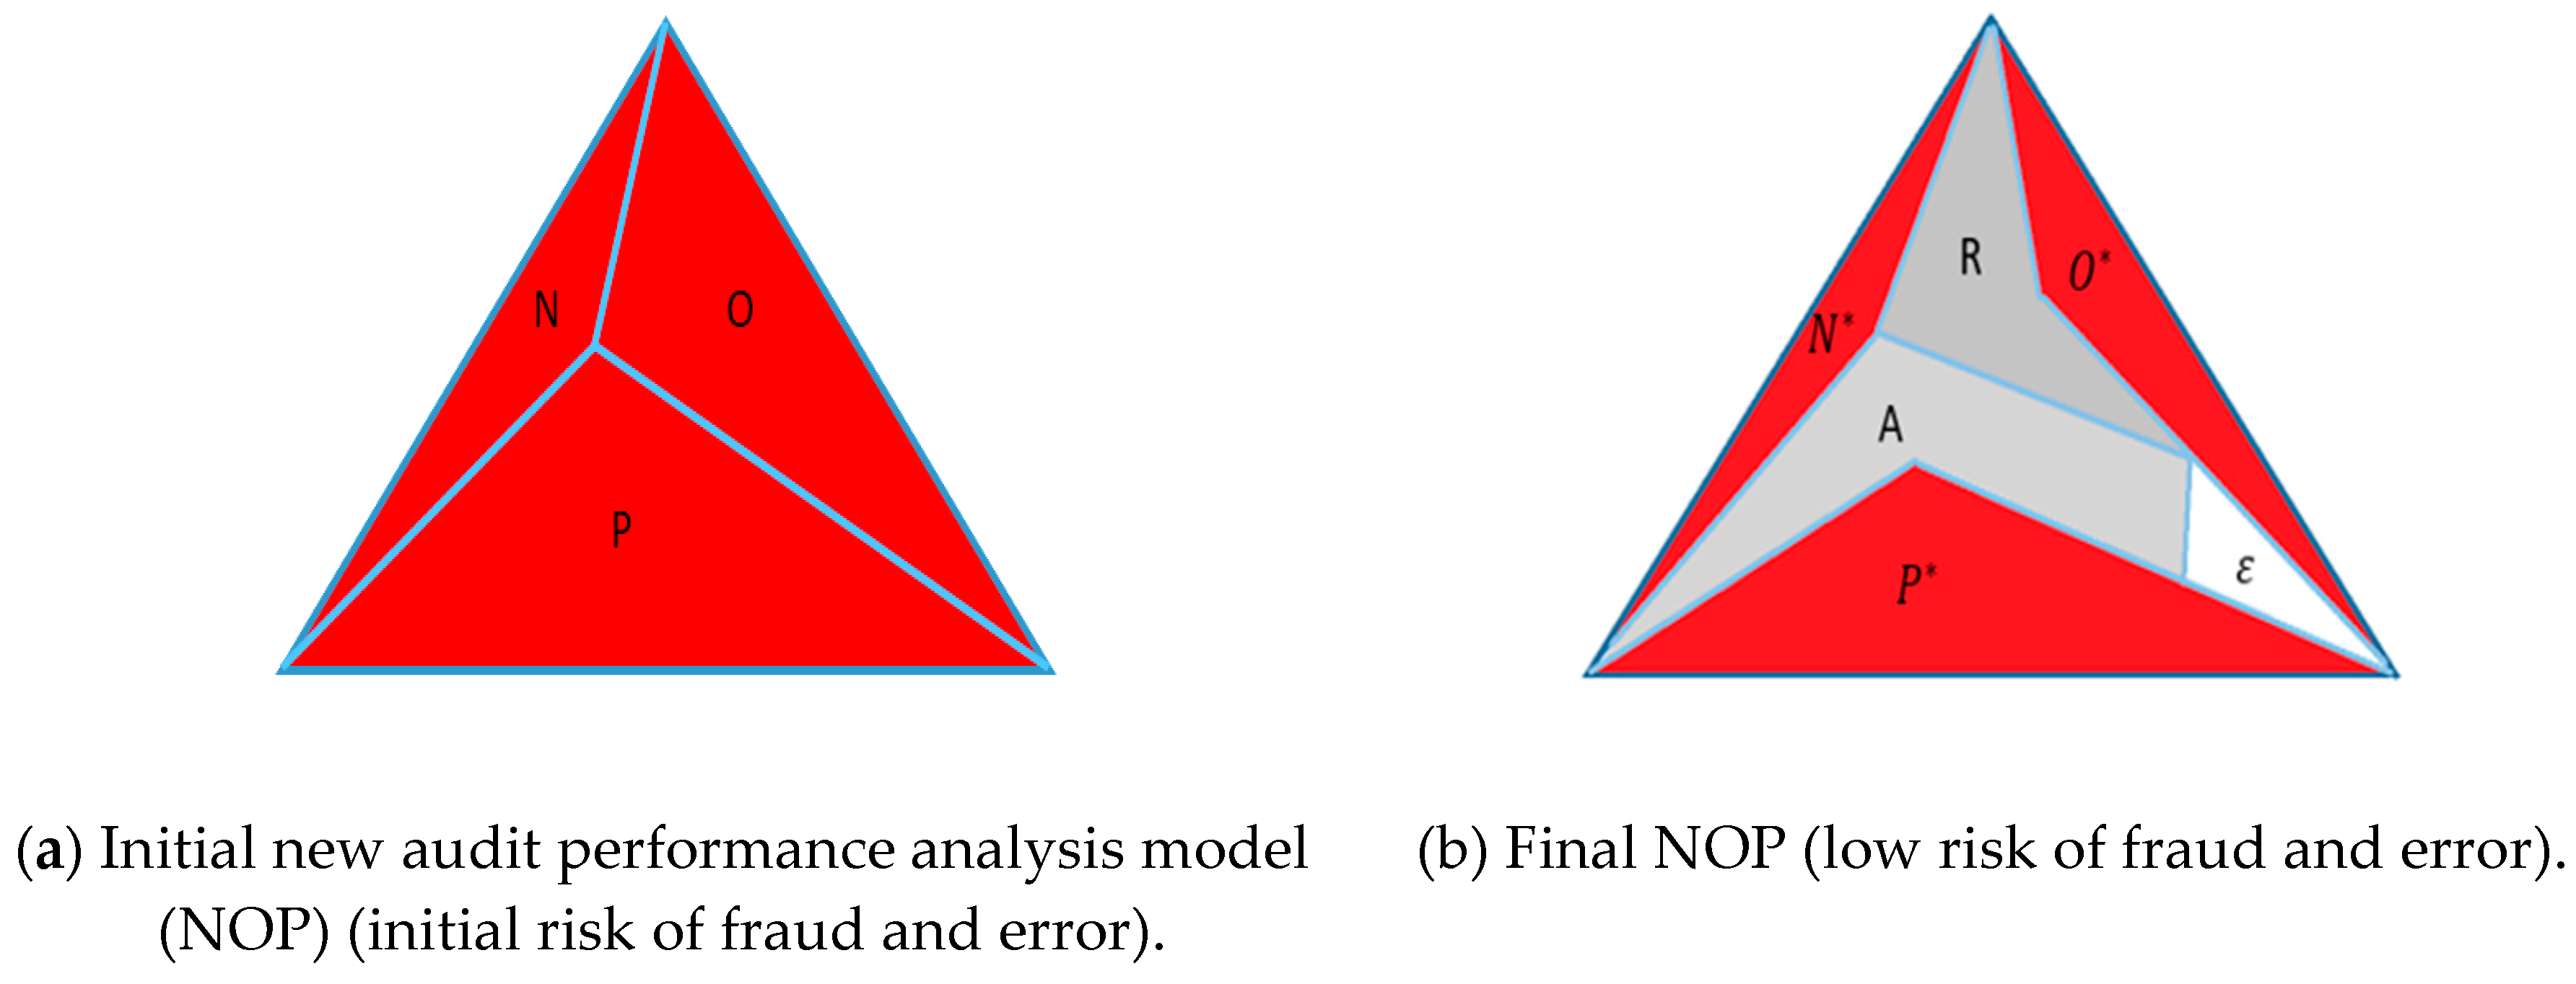
Figure 1. The modified fraud triangle (according to the NOP model). Source: author’s contribution.
Sustainability 12 05458 g001
Figure 2. Calculating log probabilities for the budgeted values on the two operational programs (OPs).
Sustainability 12 05458 g002
Figure 3. Calculating Log probabilities for the submitted projects on the two OPs.
Sustainability 12 05458 g003
Figure 4. Calculating Log probabilities for the approved projects on the two OPs.
Sustainability 12 05458 g004
Figure 5. PO calculating Log probabilities for the adjusted budgets amounts on the two OPs.
Sustainability 12 05458 g005
Figure 6. Calculating Log probabilities for the adjusted submitted projects on the two OPs.
Sustainability 12 05458 g006
Figure 7. Calculating Log probabilities for the adjusted approved projects on the two OPs.
Sustainability 12 05458 g007
Figure 8. Scatterplot (matrix) = NOP by priority axes under. OP-Environment (V1)
Sustainability 12 05458 g008
Figure 9. Scatterplot (matrix) = N’O’P’ by priority axes under. OP-Environment (V1).
Sustainability 12 05458 g009
Table 1. European structural funds’ impact analysis and auditing.
AuthorYearApproachImpact
Pellegrini G., Terribile F., Tarola O., Muchigrosso T. & Busillo F.2011During the 2007–2013 financial perspective, the budget allocations to regional policies are analyzed in order to identify the structural impact of the European funds used in economic growth;
EU significant regional disparities have shown the need for strengthening regional policies under the motto of growth, which was the subject of the convergence programs during 2007–2013 [1] (pp. 217–233).
The impact of regional policies is assessed at 0.6–0.9% of the regional GDP sustainable growth on development policy levels through structural funds. This percentage reached up to 7–10%, depending on the regions and the financing policies, at the end of the analyzed period.
The estimated average growth of the structural allocations impact was forecasted at 69% over a 50-year horizon, provided that convergence efforts were maintained.
The regional disparities are projected to decline over time in the context of economic policy efforts with micro- and macroeconomic impacts.
We built our NOP model in order to cover the lack of a mathematical approach in regional financial policies disparities in theory and practice.
Crescenzi R. & Rodriques-Pose A.2012Analysis of the regional capacity attributable to a sustainable transport infrastructure able to generate economic growth.
The analysis of the infrastructure investments’ effect on the regional welfare growth and the indirect relationship regarding the investment costs in the EU (for example, the TEN-T project has absorbed 76 billion EUR from the ERDF during 2007–2013) [2] (pp. 487–513).
The strengthening of regional transport capacity and the establishment of transnational corridors represent a net resource for welfare growth, materialized in steady and sustainable GDP growth in all Member States, post-crisis economic recovery, and the opening of European barriers to trade globally during 2014–2020.
The NOP model is able to quantify the sustainable economic growth in the most appropriate manner.
Kyriacou A.P. & Roca-Sagales O.2012The analysis of the impact of European funds allocation under regional disparities;
the structural funds reduce long-term regional disparities through technology transfer and sustainable economic growth [3] (pp. 267–281).
The analysis was focused on Cyprus and Malta and demonstrated that the regional disparities reduction by allocating structural funds at the national level was possible through robust programs according to a common European agenda.
The NOP model can be applied for Cyprus and Malta, as well.
Bachtler J., Mendez C. & Oraze H.2013Analyzing the role of administrative capacity in managing European cohesion policies [4] (pp. 735–757).The impact of the regional administrative capacity is manifested by accelerating the growth functions in relation to compliance with the access to European funds during the post-implementation period of the investments, as well.
The NOP model offers a new approach in analyzing EU structural funds.
Pinho C., Varum C. & Antunes M. 2015The analysis of the structural funds allocation’s efficiency on cohesion groups with impact on the residual regional economic welfare growth.
[5] (pp. 1302–1326).
Reviewing the effects of structural fund allocations aiming at correcting allocation policies by promoting fund beneficiaries’ education and innovation orientation as keys to generating regional policy success for Horizon 2020 growth programs.
Biondi Y.2014Assessing the fundamental role of the accounting system and EPSAS harmonized standards with public governance as a measure of generating public funding systems in the context of the economic crisis [6].Analysis of the economic crisis situations in the Member States (France, Finland, and the UK) in the light of the necessary transformations of the European economies through the public administration and national accounts system’s control mechanisms.
Under Structural Funds, the research can be translated by highlighting the absorption vulnerabilities during crisis, respectively the vulnerabilities generated by unbalanced national budgets and growing public debt.
The NOP model can be applied to France and Finland. The UK is not a member of the EU at this time.
Tosun J.2014Assessing the determinants of the European funds’ absorption rate, considering the hypotheses of fiscal decentralization with a direct negative impact on the structural funds’ absorption [7] (pp. 371–387).The analysis of financing programs and their finality in the European Funds’ absorption (focusing on ERDF);
the analysis of the variation in the absorption degree in different countries, related to performance based on government re-capacity models in the context of the existence/absence of fiscal decentralization.
McCann Ph.2014Presenting the smart concept applicable to regional governance as a regional performance generator in the context of European architecture.
There is a need for a global post-crisis financial recovery, and the concepts of efficiency and effectiveness can be applied to regional development policies in order to ensure the premise of achieving performance [8] (pp. 409–427).
In the field of structural funds, the training of specialists with smart competencies would revive the bureaucratic framework and motivate beneficiaries to increase performance during the conceptualization of the investment and its declaration to the managing authorities.
The implementation of the NOP model can support decision makers to adopt better financial management.
Haughton T.2014 The analysis of the financial allocations through the direct infusion of capital with effect in the recapture of the regional economies in the central and the east European area [9] (pp. 71–87). Demonstrating that the lack of managerial capacity of government representatives on issues of incompetence reduces the level of regional development, directly affecting the proposed policies for which the EU has allocated funds.
The policy makers have a direct role in the bureaucratization of the financial allocation process and are present in the implementation mechanism in all Eastern European countries.
The NOP model uses the law practices in limiting the error and fraud during the EU funds’ allocation.
Zaman Gh. & Georgescu G.2014A descriptive analysis of the financial execution of the European funds allocation programs during 2007–2013, focusing on the case of Romania, for which the absorption rate was 27% (a historical minimum in relation to the other Member States according to the authors’ research) [10] (pp. 0–18).Analysis of the negative trends of the European Funds’ development and assimilation, which can constitute the structure of a skeleton of regional vulnerabilities recorded in the favorable international context, a framework that can be adjusted in terms of expressing an appropriate political will.
Batusaru C., Otetea A. & Ungureanu M.A.2015The analysis of the European funds absorption failure in Romania during 2007-2013 and the development of good practice models for the prevention of failure in terms of allocations during 2014-2020 [11] (pp. 21–35).In the context of the sustained concerns for assessing the systemic vulnerabilities of the national economy in accessing structural funds generating economic growth, there is the inconsistency of the regional policies adopted at the national level in Romania, which in our opinion is the biggest alarm signal involving emergency re-capacitation by absorbing the competent workforce of the public administration.
Palea V.2016The pragmatic analysis of the accounting aspects generating surplus value on all economic scales congruent to sustainable development;
introducing a parallel analysis between the European and American accounts system brings to light the fragility of the financial reporting used as descriptors of financial stability for each entity in the system [12] (pp. 59–73).
Shutting down the public system between performance and non-performance involves all the actors in the system in creating a responsible financial decision-making framework, concentrating on a joint effort to develop free markets, the corporate governance of multinational entities, and regulatory mechanisms for stock and values exchanges.
Economic sustainability becomes the complex result of cumulative factors. It becomes a desirable target on which financial allocations are concentrated, including through the Structural Funds at EU level.
Barnet W.A. & Gaekwad N.B.2017The analysis of the elasticity of unit allocations in current prices within the EMU11 with the segregation of monetary aggregates on the Governing Council’s objectives;
highlighting the representative role of the consumer function on local and flexible mechanisms in indirect relation to the utility function [13] (pp. 353–371).
The use of benchmark rates to assess the net effects of investments without the causal influence of other external factors should be maximized under the yield-adjusted return curve.
In the context of medium transparency, high sustainable growth economies are able to obtain a higher monetary asset reimbursement than those in which the sustainable factor is diluted.
In terms of Structural Funds, this theory is reflected in the fact that the absorption rates are higher when sustainable economic growth is higher.
Machado M.R.R. & Gartner I.R.2018Aspects of the fraud phenomenon through the classic Cressey’s hypothesis on the fraud triangle launched in 1953 [14] (pp. 60–81).Confirming Cressey’s hypothesis, which generates the dissipation of confidence in macroeconomic financial stability in the conditions of the presence of the three dimensions of the triangle (pressure, opportunity, and rationalization).
Oroszki J.2019Fraud risk analysis of the European budget through specific measures to reduce the phenomenon of fraud in the three identified specific stages (detection, deterrence, and prevention);
highlighting the structural aspects of fraud management and addressing fraud areas through focused audit actions and highlighting OLAF’s role. [15] (pp. 26–31).
Creating antifraud pattern by a causal analysis of fraud motivation and establishing a training program for professionals specializing in detecting the psychological profiles of individuals and entities prone to fraud.
Chersan I.C.2019The analysis of the need for financing in relation to the public financing capacity through the perspective of the fiscal regulator;
taxation can redress the national economic growth through budgetary mechanisms. Romania is given as an example of bad management.
[16] (pp. 93–105).
Highlighting the complex role of fiscal reform in modernizing and improving compliance with European policies and generating fair practices for all the beneficiaries of the tax system.
Source: author’s contribution.
Table 2. Good practices by legislative regulatory.
VariableLast approved measure
Procedural rules’ clarificationMinistry of European Funds’ Order no. 393/2018
Standardization of application forms for obtaining fundingMinistry of European Funds’ Order no. 2010/2016
Predictability of financing actions - Staging activities with the calendarMinistry of European Funds’ Memorandum on January 2016
Establishing measures to prevent, conclude and sanction irregularities in obtaining and using non-reimbursable fundsEmergency Ordinance published in Official Paper no. 480/2014 for amending Emergency Ordinance no. 66/2011
Establishing a reliable institutional frameworkMinistry of European Funds’ Order no. 726/2018
Source: author’s contributions.
Table 3. The security dashboard for auditing European Funds.
ISRS 4400 measures applicable to auditing European Funds during 2007–2013 and 2014–2020Viable measures applicable through the implementation of ISA 805 standard
The mission of performing the agreed financial information procedures is not an ISA auditPerforming an audit mission and applying all ISA 100-700 standards
Independence is not a mandatory requirementIndependence is a mandatory requirement
Testing the internal control system and assessing the risks of fraud are optionalTesting the internal control system and assessing the risks of fraud are mandatory
The different mission letterThe different mission letter
Restrictions in using the reportRestrictions in using the report
Significance threshold: 100%Significance threshold: Sampling
Lower coverageGreater coverage
Reporting: Report on factual findingsReporting: Independent auditor’s report
No insurance is providedHigh, but not absolute, insurance is provided
Source: authors’ contribution.
Table 4. Bayes factor for related-sample t test.
NMean DifferenceStd. DeviationStd. Error Mean
OP - Infrastructure /EU Budget - OP - Large Infrastructure /EU Budget7−23,828,422.2535,522,379.8913,426,197.59
OP - Infrastructure projects sent to EU - OP - Large Infrastructure projects sent to EU7−30,029,103.1946,492,111.3017,572,366.34
OP - Infrastructure approved projects by EU - OP - Large Infrastructure approved projects by EU7−34,964,710.4258,162,977.2921,983,539.06
Table 5. Bayes factor for related-sample t test.
Bayes FactortdfSig.(2-tailed)
OP - Infrastructure /EU Budget - OP - Large Infrastructure /EU Budget1.124−1.77560.126
OP - Infrastructure projects sent to EU - OP - Large Infrastructure projects sent to EU1.207−1.70960.138
OP - Infrastructure approved projects by EU - OP - Large Infrastructure approved projects by EU1.367−1.59060.163
Table 6. Posterior distribution characterization for related-sample mean difference.
NPosterior
ModeMeanVariance
OP - Infrastructure /EU Budget - OP - Large Infrastructure /EU Budget7−23,828,422.25−23,828,422.25540,788,345,846,614.06
OP - Infrastructure projects sent to EU - OP - Large Infrastructure projects sent to EU7−30,029,103.19−30,029,103.19926,364,177,085,827.60
OP - Infrastructure approved projects by EU - OP - Large Infrastructure approved projects by EU7−34,964,710.42−34,964,710.421,449,827,968,934,514.20
Table 7. Posterior distribution characterization for related-sample mean difference.
95% Credible Interval
Lower BoundUpper Bound
OP - Infrastructure /EU Budget - OP - Large Infrastructure /EU Budget−69,483,360.0321,826,515.53
OP - Infrastructure projects sent to EU - OP - Large Infrastructure projects sent to EU−89,782,826.2029,724,619.80
OP - Infrastructure approved projects by EU - OP - Large Infrastructure approved projects by EU−109,718,347.9139,788,927.06
Table 8. Posterior distribution characterization for related-sample mean difference.
NPosterior
ModeMeanVariance
OP - Infrastructure /EU Budget - OP - Large Infrastructure /EU Budget7−23,828,422.25−23,828,422.25540,788,345,846,614.06
OP - Infrastructure projects sent to EU - OP - Large Infrastructure projects sent to EU7−29,727,616.53−29,727,616.53909,325,604,671,907.40
OP - Infrastructure approved projects by EU - OP - Large Infrastructure approved projects by EU7−34,490,738.92−34,490,738.921,433,638,850,549,458.00
Table 9. Posterior distribution characterization for related-sample mean difference.
95% Credible Interval
Lower BoundUpper Bound
OP - Infrastructure /EU Budget - OP - Large Infrastructure /EU Budget−69,483,360.03621,826,515.53
OP - Infrastructure projects sent to EU - OP - Large Infrastructure projects sent to EU−88,929,265.4929,474,032.42
OP - Infrastructure approved projects by EU - OP - Large Infrastructure approved projects by EU−108,825,846.4739,844,368.62
Table 10. Paired samples correlations.
CorrelationSig.tdfSig. (2-tailed)
Pair 1N & N′0.9990.0002.25960.065
Pair 2O & O′0.9450.0011.04760.335
Pair 3P & P′0.9960.0001.74260.132
Table 11. Inter-item correlation NOP matrix.
NOP
N 1.000 −0.109 0.974
O −0.109 1.000 −0.128
P 0.974 −0.128 1.000
Table 12. Inter-item correlation N’O’P’ matrix.
N′O′P′
N′1.0000.0240.956
O′0.0241.0000.002
P′0.9560.0021.000
Table 13. The chart of financial allocations through OP-Environment.
Priority Axes underOP-EnvironmentCurrencyThe Budget Approved Amount on PAs under OP-EnvironmentThe Expenditure Amount Affected by the Irregularity
TotalEU Contribution
PA1EUR3,149,423,956.002,776,532,160.00157,878,544.00
PA1AEUR122,728,555.00100,000,000.00412,963.00
PA2EUR878,476,962.00734,223,079.0034,423,214.00
PA3EUR388,640,131.00229,268,644.0015,240,809.00
PA4EUR191,098,548.00171,988,693.006,705,010.00
PA5EUR315,839,375.00270,017,139.0043,766,635.00
PA6EUR144,933,804.00130,440,423.009,798,840.00
TotalEUR5,191,141,331.004,412,470,138.00268,226,014.00
Priority axes under OP-EnvironmentNumber of submitted projectsCurrencyValue of submitted projects
TotalEU contribution
PA1105.00EUR3,720,142,606.002,358,923,836.00
PA1A24.00EUR82,184,948.0054,003,465.00
PA242.00EUR1,121,961,658.00689,031,257.00
PA37.00EUR382,900,084.00153,118,539.00
PA4395.00EUR514,678,996.00379,137,649.00
PA547.00EUR512,475,684.00402,437,846.00
PA6170.00EUR140,375,682.00113,201,422.00
Total790.00EUR6,474,719,658.004,149,854,014.00
Priority axes under OP-EnvironmentNumber of approved projectsCurrencyValue of approved projects
TotalEU contribution
PA1105.00EUR3,720,142,606.002,358,923,836.00
PA1A24.00EUR82,184,948.0054,003,465.00
PA240.00EUR1,070,507,591.37649,122,650.46
PA37.00EUR382,900,084.00153,118,539.00
PA4223.00EUR233,912,223.40175,236,415.97
PA542.00EUR459,623,284.16365,443,339.45
PA6170.00EUR140,375,682.00113,201,422.00
Total611.00EUR6,089,646,418.933,869,049,667.88
Table 14. The chart of financial allocations through OP-Large Infrastructure.
Priority axes underOP-LargeInfrastructureCurrencyThe Budget Approved Amount on PAs under OP-Large InfrastructureThe Expenditure Amount Affected by the Irregularity
TotalEU contribution
PA1EUR4,005,006,258.003,404,255,320.001,685,959.11
PA2EUR1,885,570,536.001,602,734,955.00380,629.44
PA3EUR3,402,875,042.002,892,443,785.001,154,792.48
PA4EUR382,978,724.00325,531,915.0046,738.28
PA5EUR563,204,005.00478,723,404.00333,187.00
PA6EUR232,152,691.00197,329,787.007,526.80
PA7EUR293,504,381.00249,478,723.0025,353.63
PA8EUR80,031,289.3268,026,595.9218,056.72
TotalEUR10,845,322,926.329,218,524,484.923,652,243.47
Priority axes underOP-LargeInfrastructureNumber of submitted projectsCurrencyValue of submitted projects
TotalEU contribution
PA135.00EUR5,951,062,335.424,589,430,095.00
PA279.00EUR3,301,104,880.002,515,934,227.00
PA398.00EUR2,925,904,175.002,467,040,076.00
PA4141.00EUR341,837,310.00283,705,806.00
PA58.00EUR835,218,265.00622,850,365.00
PA652.00EUR125,184,775.0491,659,059.00
PA76.00EUR97,130,383.4281,653,055.00
PA82.00EUR96,228,514.5458,021,878.00
Total421.00EUR13,673,670,638.4210,710,294,561.00
Priority axes underOP-LargeInfrastructureNumber of approved projectsCurrencyValue of approved projects
TotalEU contribution
PA122.00EUR4,789,310,047.953,592,343,818.64
PA240.00EUR1,069,462,226.98811,023,128.51
PA395.00EUR2,894,782,106.532,460,564,791.00
PA459.00EUR117,161,426.6799,587,213.00
PA58.00EUR835,218,265.00709,935,525.00
PA615.00EUR25,098,833.6516,037,668.81
PA74.00EUR63,555,337.1054,022,036.54
PA81.00EUR45,263,785.5038,474,217.67
Total244.00EUR9,839,852,029.387,781,988,399.17