1. Introduction
With the increased global food demand, phosphorus (P) is receiving more attention in agriculture because it is an essential element for plant growth, but its natural bioavailability is limited [
1]. The main reason for the limited bioavailability of soil P is its high immobilization (sorption and precipitation) rate and its slow release into the soil solution [
2]. Although P concentration might be high in soils, most of this P is in an unavailable form to the plants [
3]. In agricultural areas, it is obvious that the supply of the bioavailable phosphorus must be ensured from external sources. Before the invention of inorganic fertilizers, the soluble phosphorus stock in agricultural areas mainly depended on the degree of the release of P from its natural sources (parent rock, organic matter) and the application of organic residuals (manure, organic municipal waste, etc.) as fertilizers. The Green Revolution of Agriculture in the middle of the 20th century resulted in many technological innovations, including the use of inorganic fertilizers, which radically changed agricultural production worldwide [
4] and doubled the crop yields in developed countries [
5]. Some soil-forming factors and soil characteristics—such as vegetation, parent material, climate, the depth of penetration of infiltrating rainwater and heat transfer through the soil—play a critical role in chemical weathering and the natural release of P [
6]. However, in agricultural areas the level of the bioavailable P depends rather on the input by fertilization, the output by harvesting and the losses of fixation and erosion—i.e., phosphorus balance. In a recent study it was demonstrated that in the European Union, soil phosphorus concentration in agricultural areas correlates with the biomass productivity [
7].
The degree of the use of fertilizers and the intensification of crop production in the past and the present is highly affected by the economic and sometimes political factors of a country; therefore, present phosphorus level of soils is still largely influenced by historical practices and policies.
In Hungary after World War II, a Soviet-style political system was introduced, which shaped the agricultural sector along with socialist ideologies. The former private farms were collectivized into large cooperatives. The state provided an extremely high level of support including the cover of the cost of fertilizers (superphosphate produced from Kola Peninsula’s phosphate rocks was applied during this period). The phosphorus input exceeded the real needs of agricultural production, especially in the 1970s and 1980s, causing accumulation of soil P [
8]. However, at this time, limited information was available about the existing phosphorus stocks and the threatening phosphorus shortage in the world, and the environmental risk of uncontrolled fertilizer use also was not clear. The excess use of fertilizers may result in serious environmental problems. For example, the increased phosphorus fertilization on the watershed of Lake Balaton (the largest freshwater lake in Central Europe) strongly contributed to the eutrophication process of the lake from the 1960s to 1990s [
9].
The socialist rule in Hungary ended in 1989, and the democratic regime and market economy were revived, causing a fundamental restructuration in agriculture as well. A privatization process began, through which a new land distribution was carried out, and resulted in a new agricultural system that was based on smallholdings. The mostly too small, scattered holdings and the lack of technical tools and technological knowledge soon led to low productivity in agriculture [
10]. As the state no longer provided similar support as it did earlier, farmers did not fertilize the soil properly immediately from the year following the regime change. The negative impact of low fertilization on the yields emerged shortly after because the soils had high P concentrations from over-fertilization before 1989 [
8]. However, based on the annual reports of the Organisation for Economic Co-operation and Development (OECD) [
11], phosphorus balance became negative immediately after the year of 1989 in Hungary [
12]. Thus, after the over-fertilization period, a period of under-fertilization started from the year of 1989, which resulted in the dropping of nutrient levels in the agricultural soils of Hungary. This process continues to the present, threatening the function of food and biomass production of the soils, and affects the country’s economic competitiveness.
Two major environmental problems can be defined related to soil phosphorus—degradation of water with accelerated eutrophication caused by too much phosphorus and decrease in soil fertility caused by too little available phosphorus [
13]. Both problems occurred in Hungary in the past and occur in the present because of improper fertilization. Many studies already indicate the possible negative effect of phosphorus under-fertilization [
8,
14] in recent times; therefore, it is well justified to make an overview of phosphorus fertilization and phosphorus levels in Hungarian soils to support suitable nutrient management in Hungary.
This study aims to (i) document the effect of fertilization on P concentrations in agricultural soil and identify the role of soil properties in changing soil soluble P with altered fertilization practices, (ii) map the pattern of soluble phosphorus content and its change in agricultural soils and (iii) quantify the total amount of soluble phosphorus level change in agricultural areas in the last few decades.
2. Materials and Methods
2.1. Study Area
Hungary is a medium-sized member state of the European Union, and its total land area is 93,030 km2. Nearly 75% of the Hungarian landscape consists of flat plains. The country has a temperate seasonal climate characterized by generally warm summers with low overall humidity levels but frequent rain showers and cold snowy winters. Average yearly rainfall is approximately 600 mm, and the average annual temperature is 9.7 °C. Around 50% of the country’s area is covered by arable land. The most important crops are wheat, maize, sunflower, barley, potato, sugar beet and rape.
2.2. Data Sources
Two soil analytical datasets were used in the study to evaluate the measured phosphorus levels in agricultural soils of Hungary. Datasets represent two well-defined periods—before and after the fall of the communist system—that had very different fertilizer use practices in Hungary, i.e., over-fertilization prior to 1989 and under-fertilization thereafter.
Dataset 1, the National Pedological and Crop Production Database (NPCPD), contains soil and yield data for 80,000 agricultural fields across the country collected between 1985 and 1989 [
15] by the National Food Chain Safety Office of Hungary. This dataset represents the period of over-fertilization before 1989. The first fields were sampled in 1985, and the campaign lasted until 1989, when it was stopped due to political changes. We refer to these data as the “NPCPD” dataset. We applied a combination of quality control and quality assurance (QC/QA) process to eliminate unreliable data from the dataset, i.e., dismissing obvious typos and contradictory entries. It is worth mentioning that data gathering was performed in a harmonized manner, and soil samples were analyzed in certified state laboratories with the same method.
Dataset 2, the Land Use/Land Cover Area Frame Survey (LUCAS), topsoil dataset, contains laboratory test samples collected from 317 points on cropland area of Hungary in 2009 [
16]. This dataset represents the period of under-fertilization after the fall of the communist regime.
In the NPCPD, soluble P content was measured based on the ammonium lactate (AL-P) method, while in the LUCAS it was measured based on the Olsen method. In AL-P method, 0.1 M NH
4-lactate + 0.4 M HOAc is used for the extraction [
17], while the Olsen test is based on extraction with 0.5 M NaHCO
3 [
18]. The correction function of Sárdi et al. [
19] was applied to convert the AL-P to Olsen-P:
where y is the Olsen-P level in mg/kg and x is the AL-P mg/kg.
Apart from soluble P concentrations, both databases contain information about the most important soil physical and chemical properties as well. To evaluate the effect of the soil physical and chemical properties on soluble phosphorus level and its change, pH, CaCO
3, clay silt and sand content were used in the analysis. In this analysis we used an additional soil database because the NPCPD does not contain detailed soil particle size distribution data (proportion of clay, sand and silt). The nationwide soil property map series for agricultural areas in Hungary [
20] had also been previously created based mainly on the NPCPD. In this map series clay, silt and sand contents were estimated from liquid limit, CaCO
3 content, soil organic matter content and soil taxonomy. The nationwide soil property maps were also used in the mapping process: CaCO
3 and pH maps were involved as auxiliary variables in kriging.
Fertilizer usage amount between 1970 and 2009 at NUTS3 level was used in the analysis. The dataset was collected from the annual reports of the Hungarian Central Statistical Office [
21]. Annual average (kg/ha) and cumulative input values for the years 1970–1989 and 1990–2009, i.e., periods before and after the political changes in 1989, were calculated for the whole cropland area of the country. The effect of fertilization on soil phosphorus concentrations was analyzed using these datasets (
Table S1).
Fertilizer price data were taken from current market price lists [
22] to express the phosphorus changes between 1989 and 2009 in monetary terms.
2.3. Data Analysis
We evaluated the effect of phosphorus fertilization on soil soluble phosphorus content based on the two soil dataset and the fertilizer input data representing the two well-defined periods of fertilizer usage. Pearson’s correlation coefficient was calculated to quantify the strengths of the relationship between the reported inputs and the measured phosphorus contents in the two periods. Data from 19 counties (NUTS3 level) of Hungary were compared in this analysis.
We also aimed to analyze which parameters influenced the soluble soil phosphorus content beside the level of fertilization. In this analysis we used the point data of the two soil datasets, including data on phosphorus and other soil parameters. To evaluate the effect of soil chemical and physical parameters on soluble phosphorus level, Pearson’s correlation coefficients were calculated.
2.4. Soil Mapping
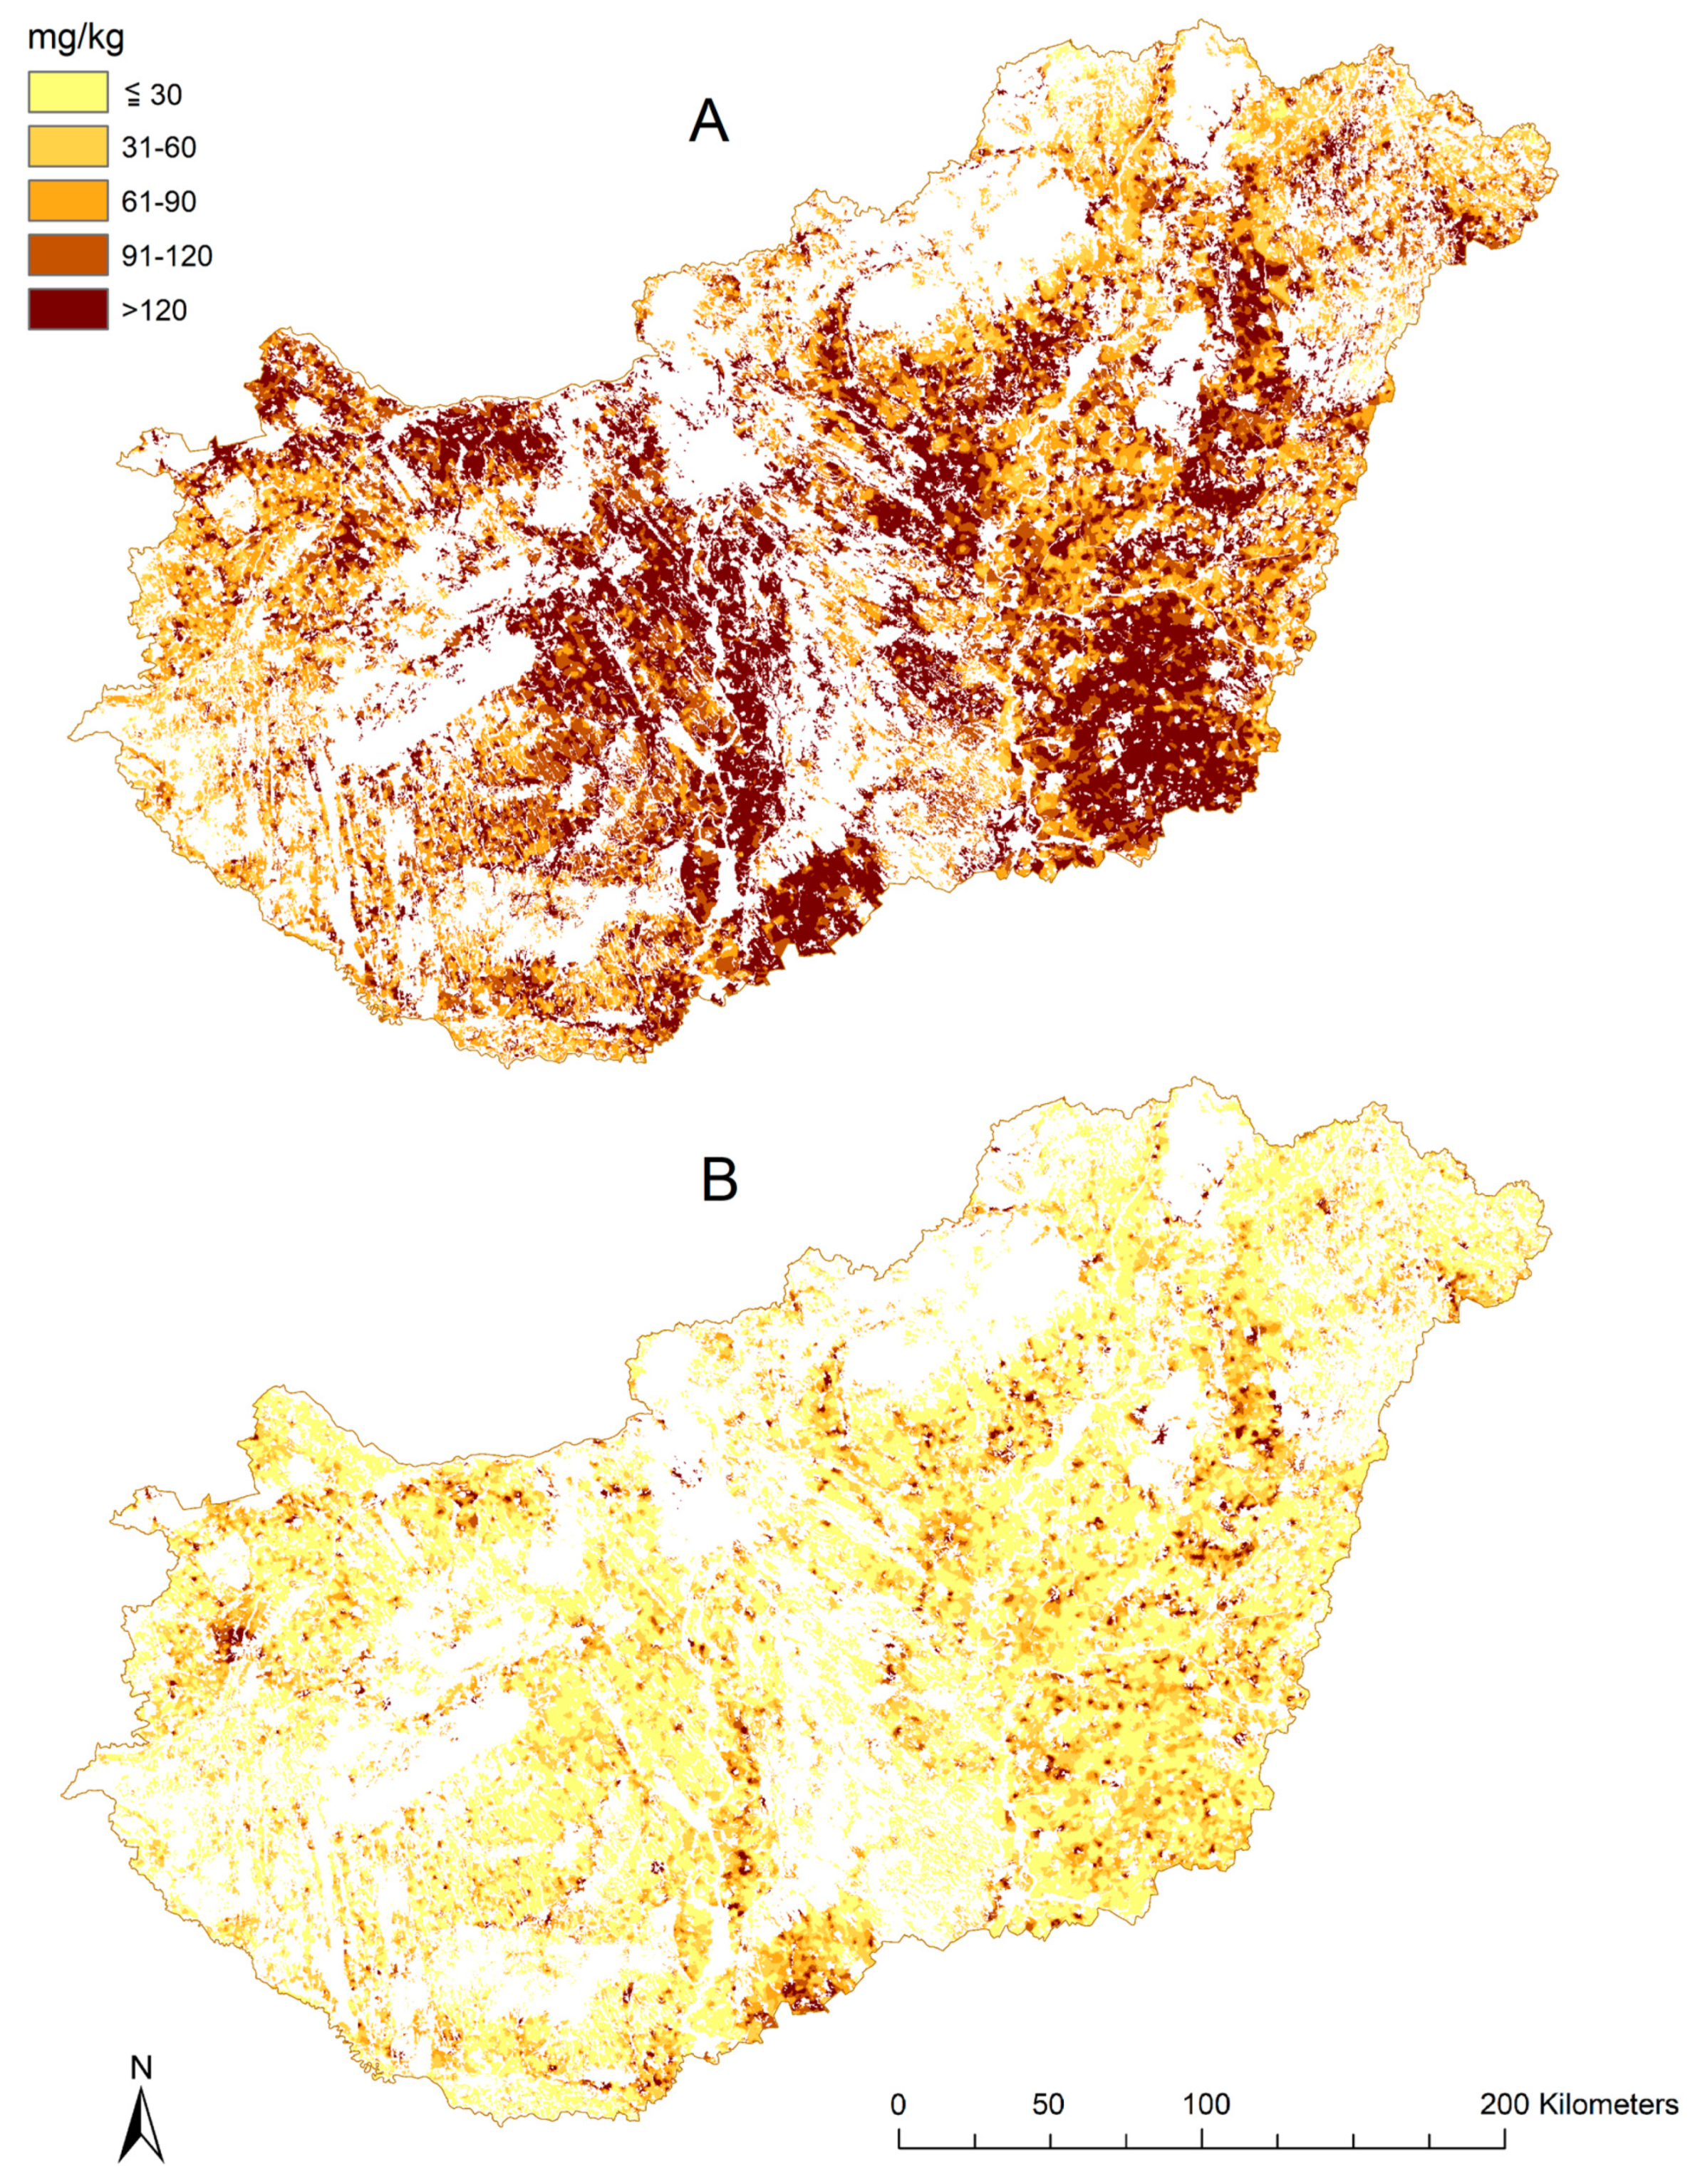
One of the main goals of our analyses was to map soluble phosphorus content in Hungarian soils for 1989 and 2009, the years for which measured soil P data were available. We also aimed to map the spatial pattern of phosphorus level change between the two periods.
In this study we mapped soil phosphorus content only on cropland area, where soil nutrient levels are of highest importance. As soluble soil phosphorus content at a given time depends mainly on the current agricultural use of soils (fertilization input, intensity of crop production), building a model from the commonly used environmental auxiliary variables such as other soil properties, climate and topography is not entirely adequate. However, fertilization input data and crop production data were not available at an appropriate resolution.
The advantage of the NPCPD is its point density (~80,000 samples on the cropland area of Hungary), which allows us to interpolate the soil soluble phosphorus content by kriging without auxiliary data. Therefore, the map representing P concentrations in 1989 was created with the ordinary kriging method without environmental covariates. Ordinary kriging is one of the most widely used interpolation methods. It serves to estimate a value at a point of a region for which a variogram is known, using data in the neighborhood of the estimation location [
23].
In the case of the LUCAS dataset (n = 317), the point density does not allow us to model phosphorus without auxiliary variables. As phosphorus level in agricultural areas mainly depends on the agricultural use, it is very difficult to find effective predictor variables for the estimation of phosphorus level. Our analyzes revealed that the change in phosphorus level can be estimated more efficiently because it turned out that the phosphorus change was significantly affected by soil chemistry. Therefore, we decided to map phosphorus change at first and then develop the phosphorus map for 2009 by using the change map and the map derived from the NPCPD (1989).
To estimate the phosphorus change in the first step, we selected the closest points of the NPCPD to the LUCAS sample points (
Table S2) As the NPCPD contains ~80,000 points in the agricultural area of Hungary it was dense enough to find points suitable for comparison within a few tens of meters. The values of the closest NPCPD points were joined to the LUCAS points and—after verification of the consistency of basic soil properties—the difference of soil phosphorus contents were calculated on each point. In the next step, we applied the regression kriging method to interpolate P values between the points in order to estimate the change of soil phosphorus at the country scale. Regression kriging is a hybrid interpolation technique that combines two conceptually different approaches to modelling and mapping spatial variability: (a) interpolation relying solely on point observations of the target variable and (b) interpolation based on regression of the target variable on spatially exhaustive auxiliary information [
24]. The maps of pH and CaCO
3 content of the soil property map series of Hungary were used as auxiliary variables to map phosphorus change.
Finally, we created the map of 2009 by adding the values of each cell of the change map to the values of the 1989 map.
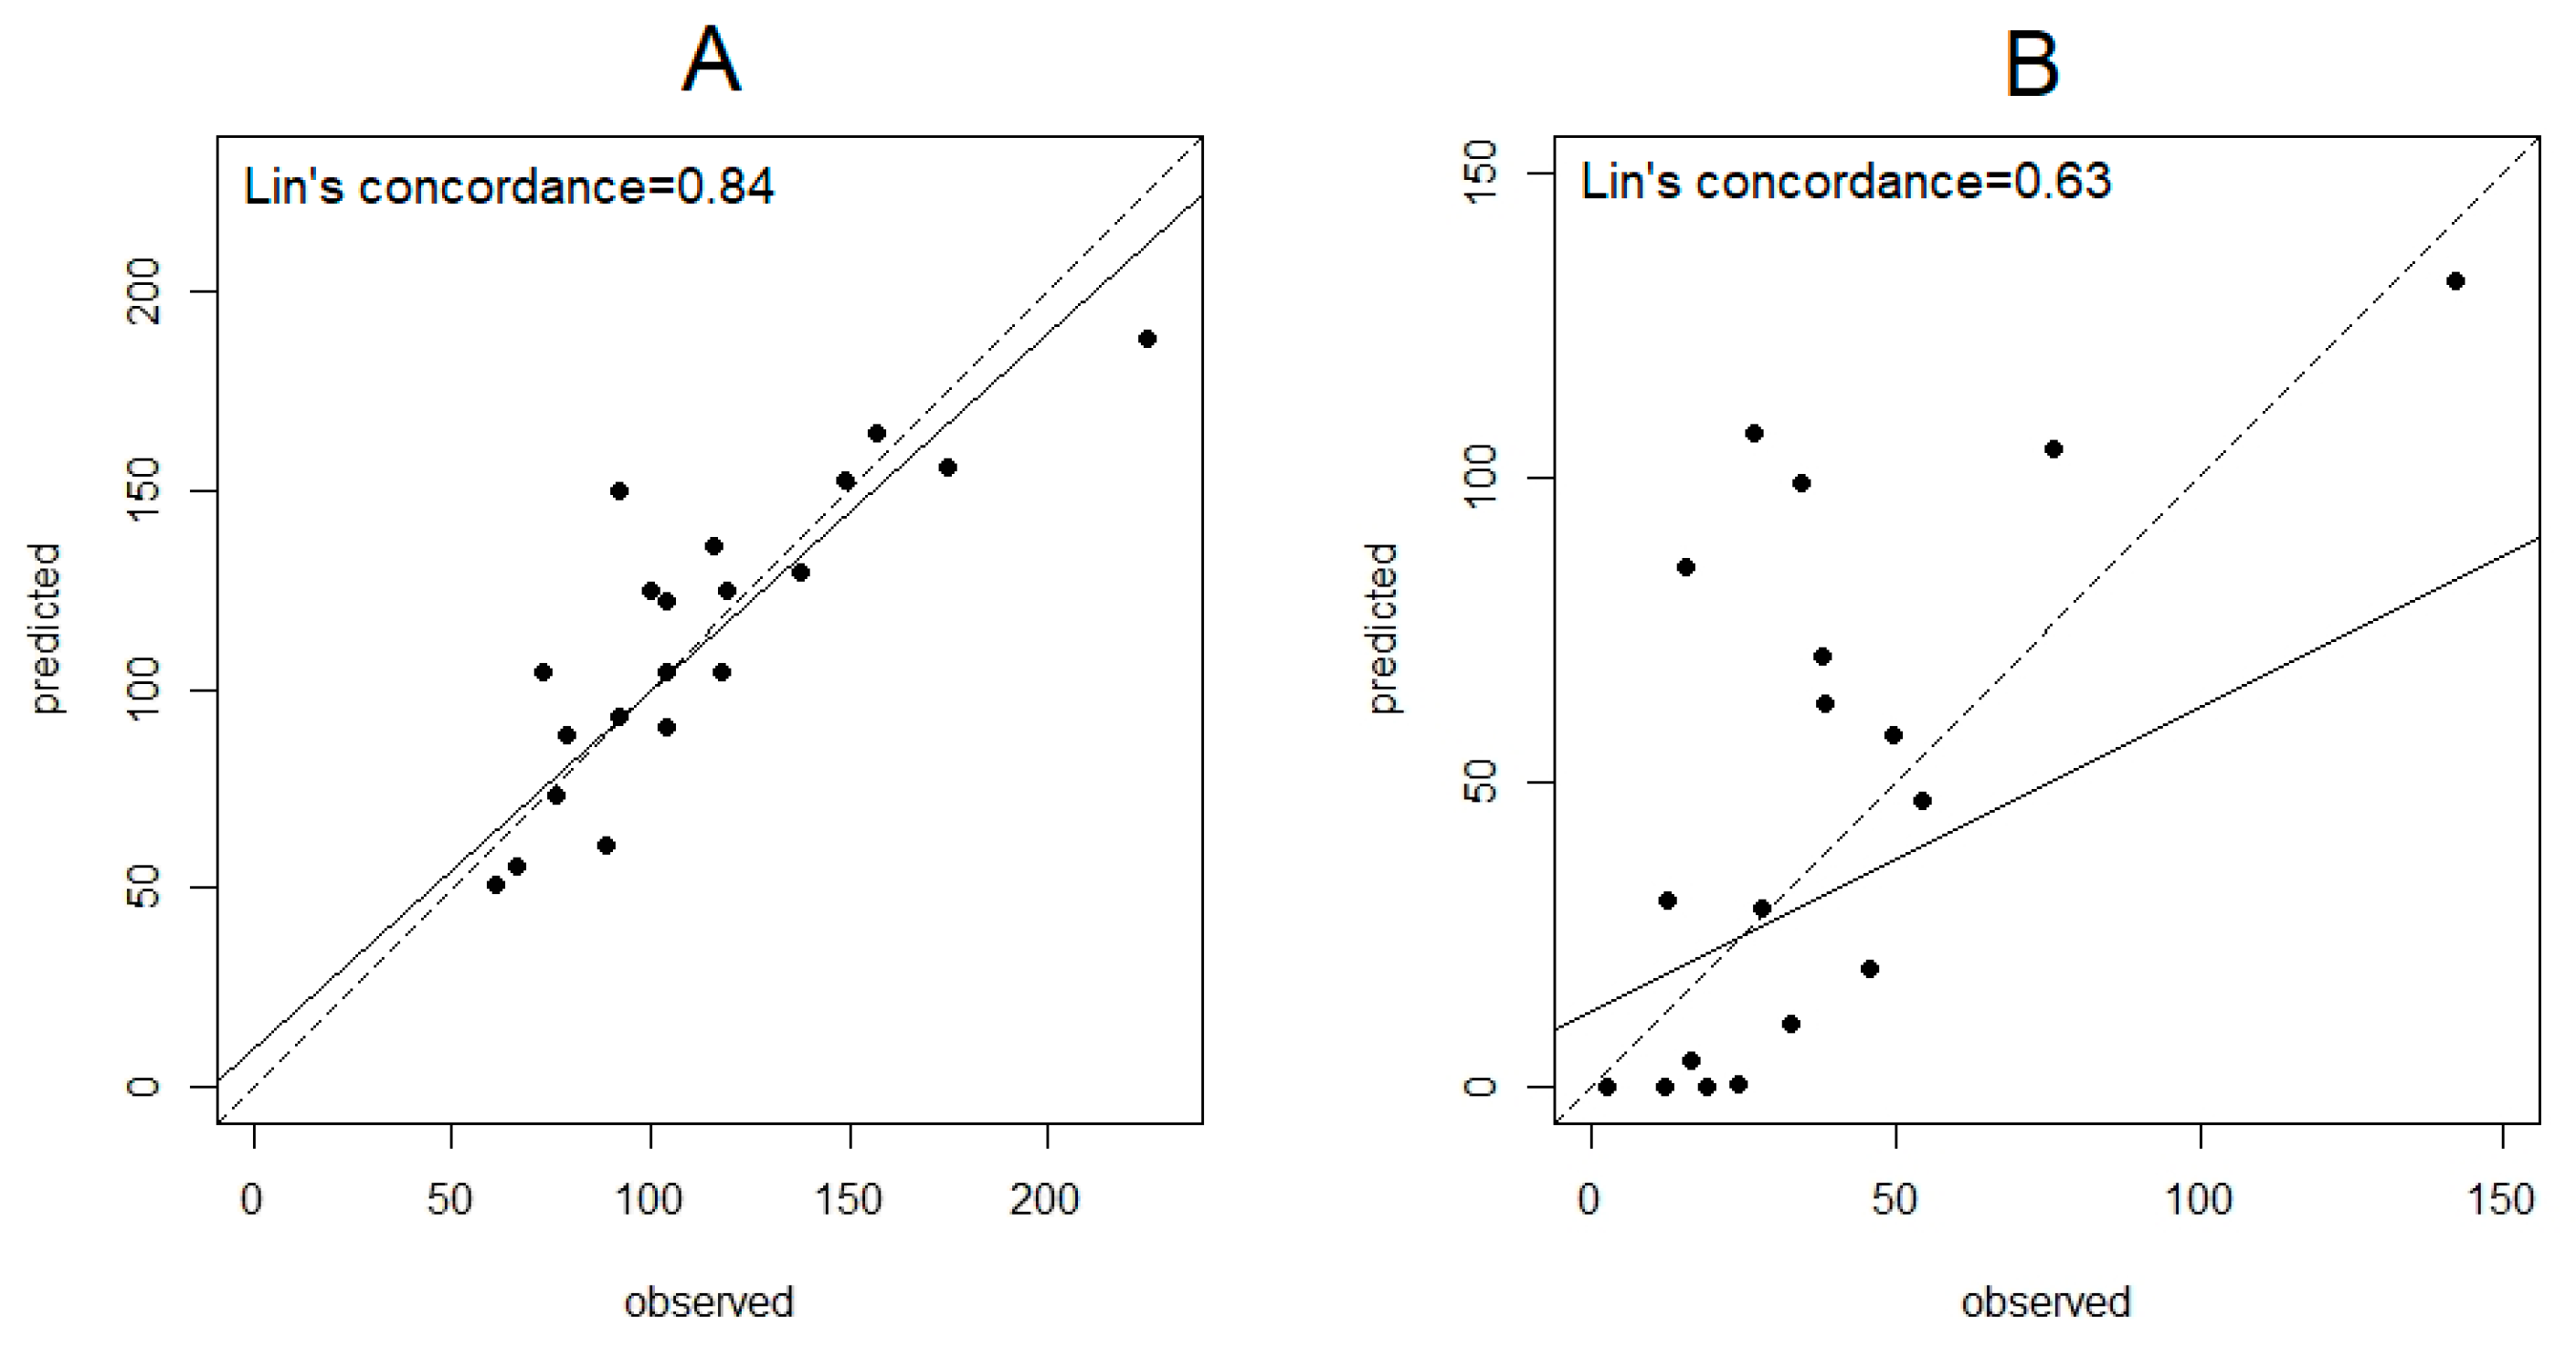
The maps were compiled uniformly at a resolution of 250 m. To validate the maps, randomly selected sample points were used, which were separated from the datasets before the mapping process. Lin’s concordance was employed to compare predicted and observed values.
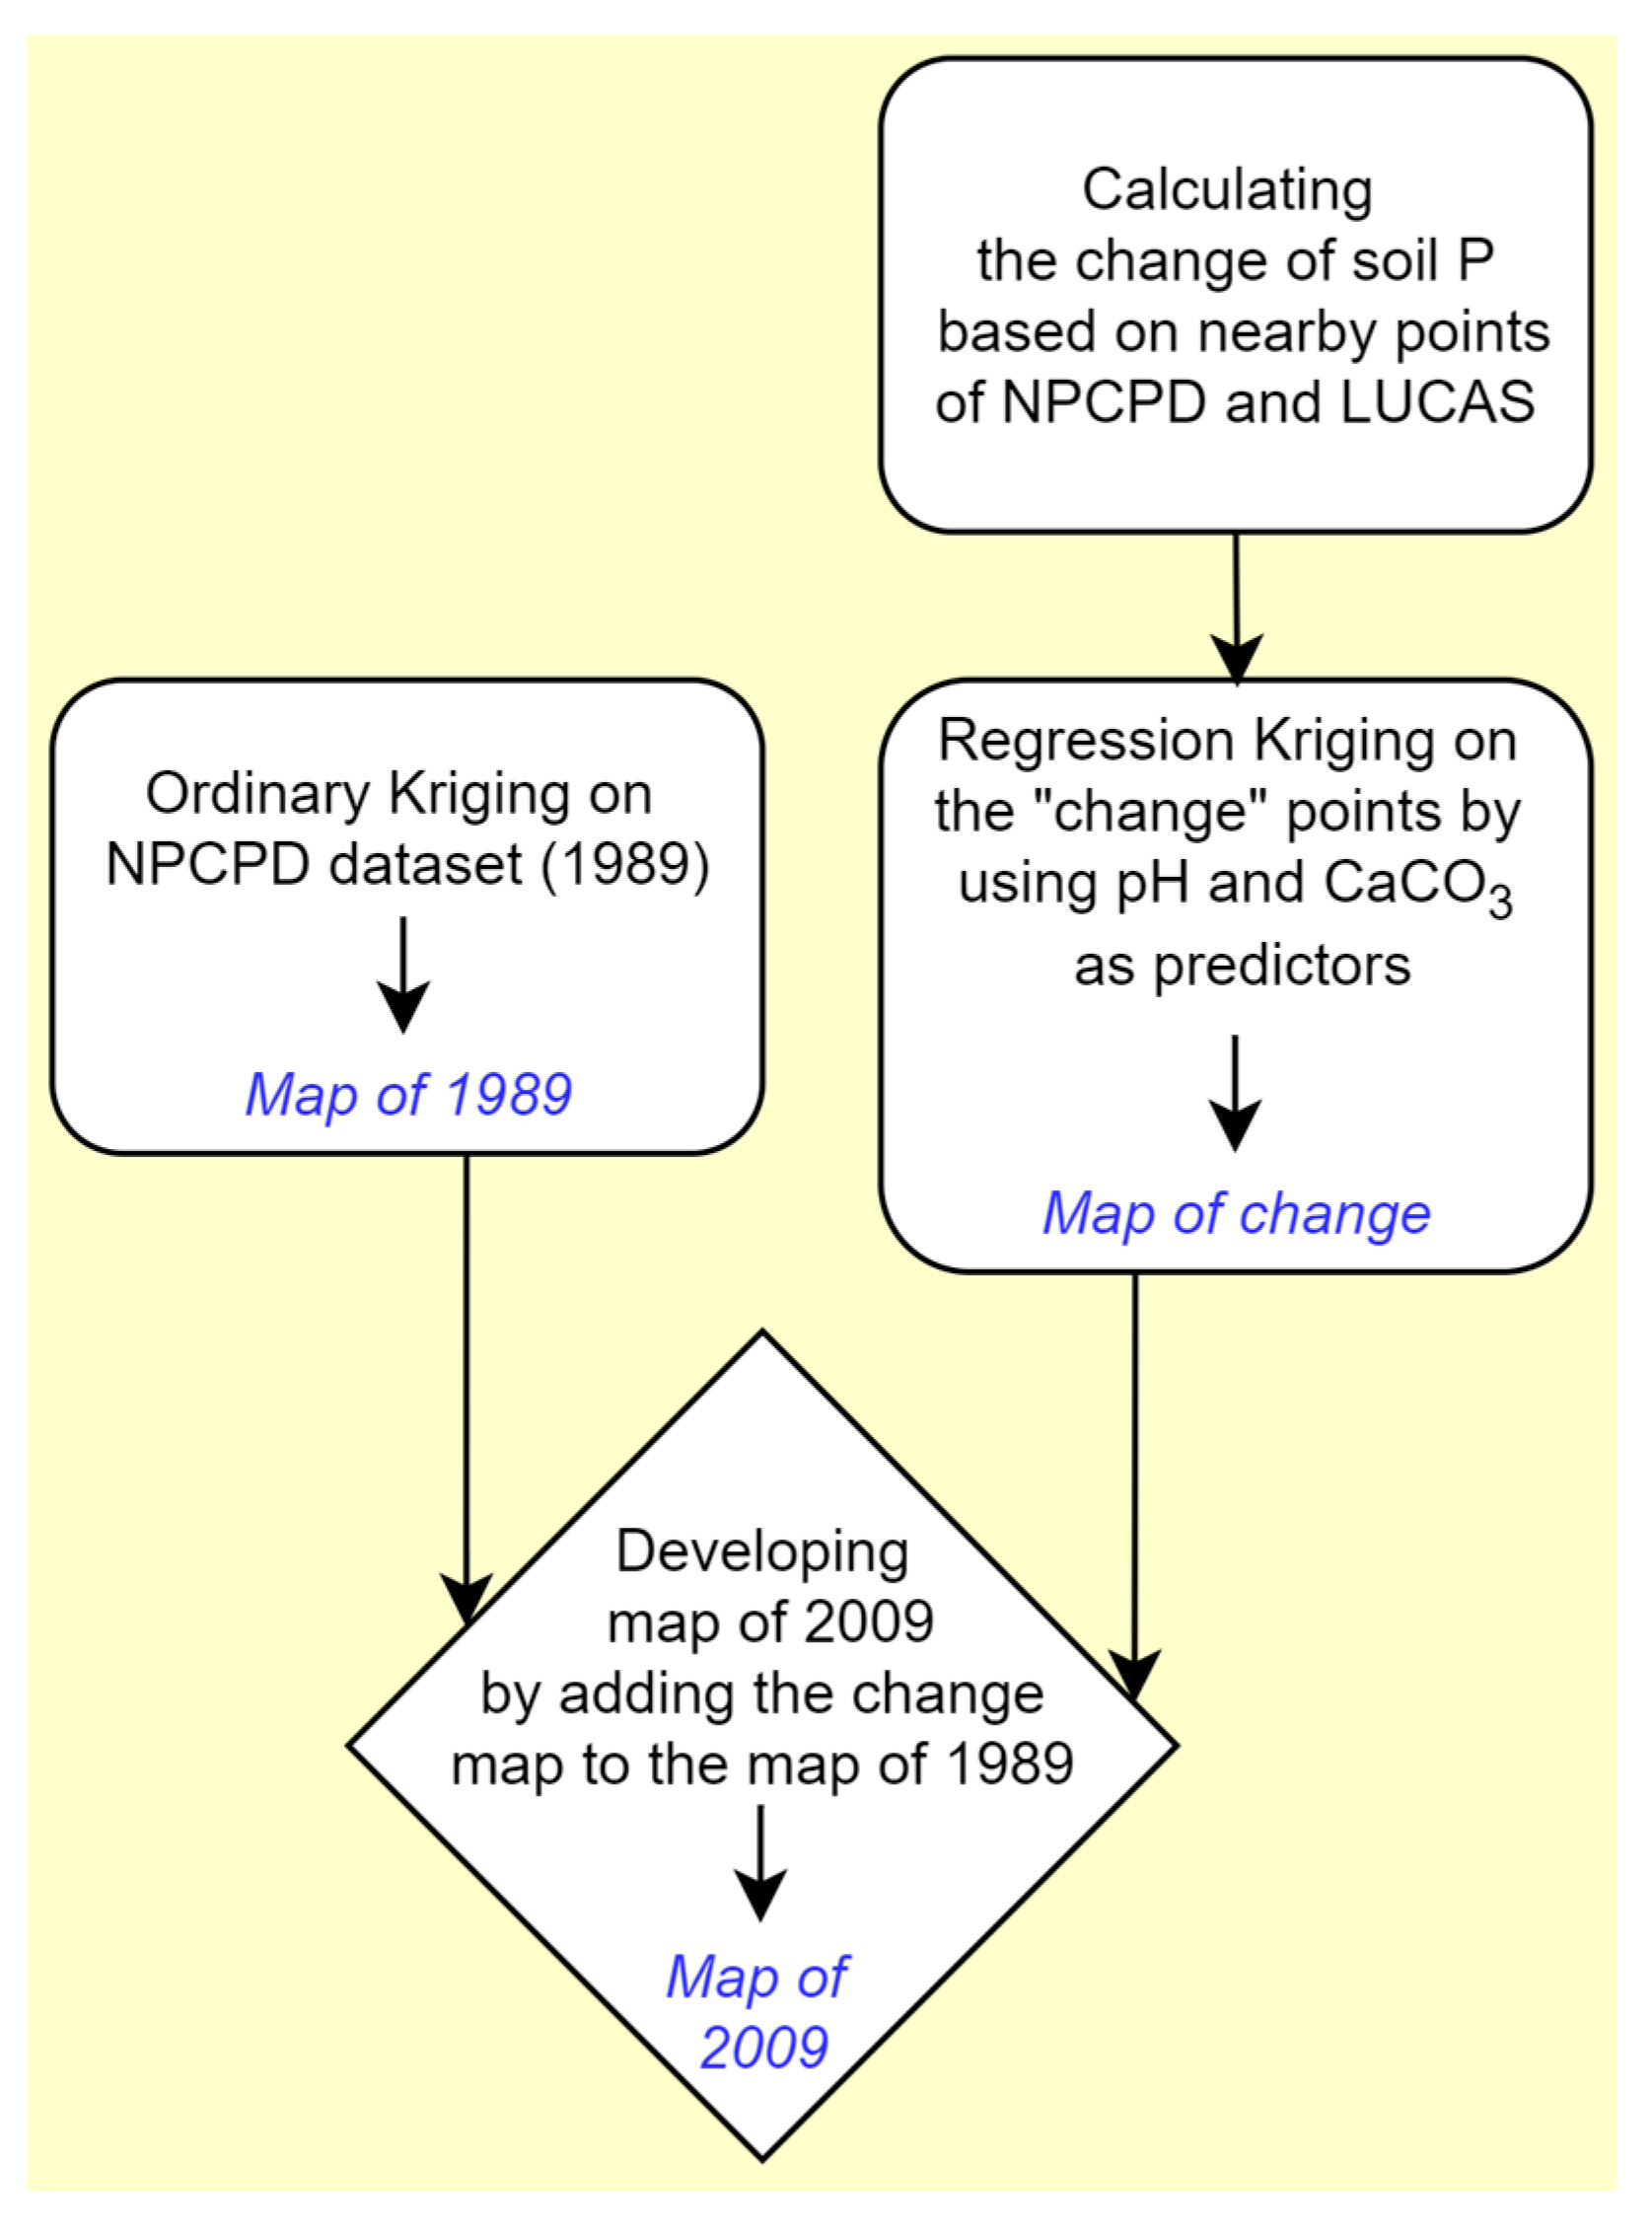
The main steps of the mapping process were as follows (
Figure 1):
- (i)
Mapping the spatial pattern of soil phosphorus of 1989 with the ordinary kriging method. ~80,000 points of the NPCPD dataset representing the over-fertilization period were used;
- (ii)
Calculating the change of phosphorus level based on the NPCPD and LUCAS sample points, which were selected based on spatial proximity. Assessing the pedological reasons of P change between 1989 and 2009 and establishment of correlation between soil properties and P change;
- (iii)
Extrapolation of P change to a country map with the regression kriging method;
- (iv)
Developing the P map for 2009 by adding the change map to the map of 1989.
With the help of the developed phosphorus change map, we also calculated the total decrease of soil phosphorus in the whole agricultural land of the country. Values (in mg/kg) of each cell of the phosphorus change map were converted into tons. Since data of both soil databases (NPCPD, LUCAS) were sampled from the tillage zone, we calculated the change for the top 30 cm of the soil. We used an average value (=1.4 g/cm) of bulk density in this calculation. The converted phosphorus change values of each cell were summed up in order to express the total loss of soluble soil phosphorus in agricultural areas.
As only harvested yield and corresponding nutrient amounts were taken into account as output in nutrient balance calculations [
11], the reported phosphorus balances [
8] allowed us to separate the amount of phosphorus removed by harvesting and the fixation/erosion loss in our estimation. For example, if the reported phosphorus balance is 1–0 kg/h in a year, it is easy to express the quantity of phosphorus decrease in soil due to harvesting in this year by multiplying the value of phosphorus balance by the agricultural area of the country in hectares. This calculation was performed for all the years between 1989 and 2009, and the results were added together. As the reported nutrient balances do not take phosphorus fixation and erosion into account, as output this calculation gives the quantity of phosphorus decrease by harvesting. The fixation and erosion losses were estimated by subtracting the harvesting “loss” from the total loss (which we estimated based on our change map).
We also expressed phosphorus total loss in monetary terms using current fertilizer prices.
4. Discussion
A country scale spatiotemporal assessment of phosphorus dynamics in Hungarian agricultural land was carried out to find out the main drivers and socioeconomic and pedological aspects of changes. Our results confirmed that phosphorus levels in agricultural areas depend mainly on phosphorus balance, namely fertilization as input and harvesting, fixation and erosion as outputs while soil characteristics play a smaller—although in some soils a significant—role. Positive correlation between the fertilization and the phosphorus level was found in the over-fertilization period (before 1989), which is also shown by the reported positive phosphorus balances from this period [
8]. The negative correlation between the phosphorus input and the phosphorus concentrations after 1989 can be associated with the negative phosphorus balances in this period and the residual long-term effect of the over-fertilization (before 1989) in certain areas. While some doubt may retrospectively arise on the accuracy of the statistical data on yields and fertilizer inputs during the communist period, no general tendency on over or underreporting can be revealed, and the reliability of the statistical figures was confirmed by studies from the time period covering before and after the fall of the communist system [
8]. As state subsidies for agriculture were applied throughout the country where agricultural land was dominated by large cooperatives, major differences in management practices diminished by the late 1980s.
According to the general principle of soil P dynamics, soils with higher CaCO3 content require higher P doses. In the case of the over-fertilization period, a significant correlation was found between CaCO3 and soil phosphorus concentration, but the r value indicated a very weak correlation. This suggests that before 1989, the differences due to soil properties were not considered when determining the phosphorus demand. In other words, high-dose nutrients were applied everywhere. After 1989, the correlation between CaCO3 and soil phosphorus concentration turned in a negative direction, which can also be a consequence of the negative phosphorus balances.
Nevertheless, the direct or indirect influences of the soil’s physical and chemical properties on soil phosphorus level are not doubted as several studies highlight it [
2,
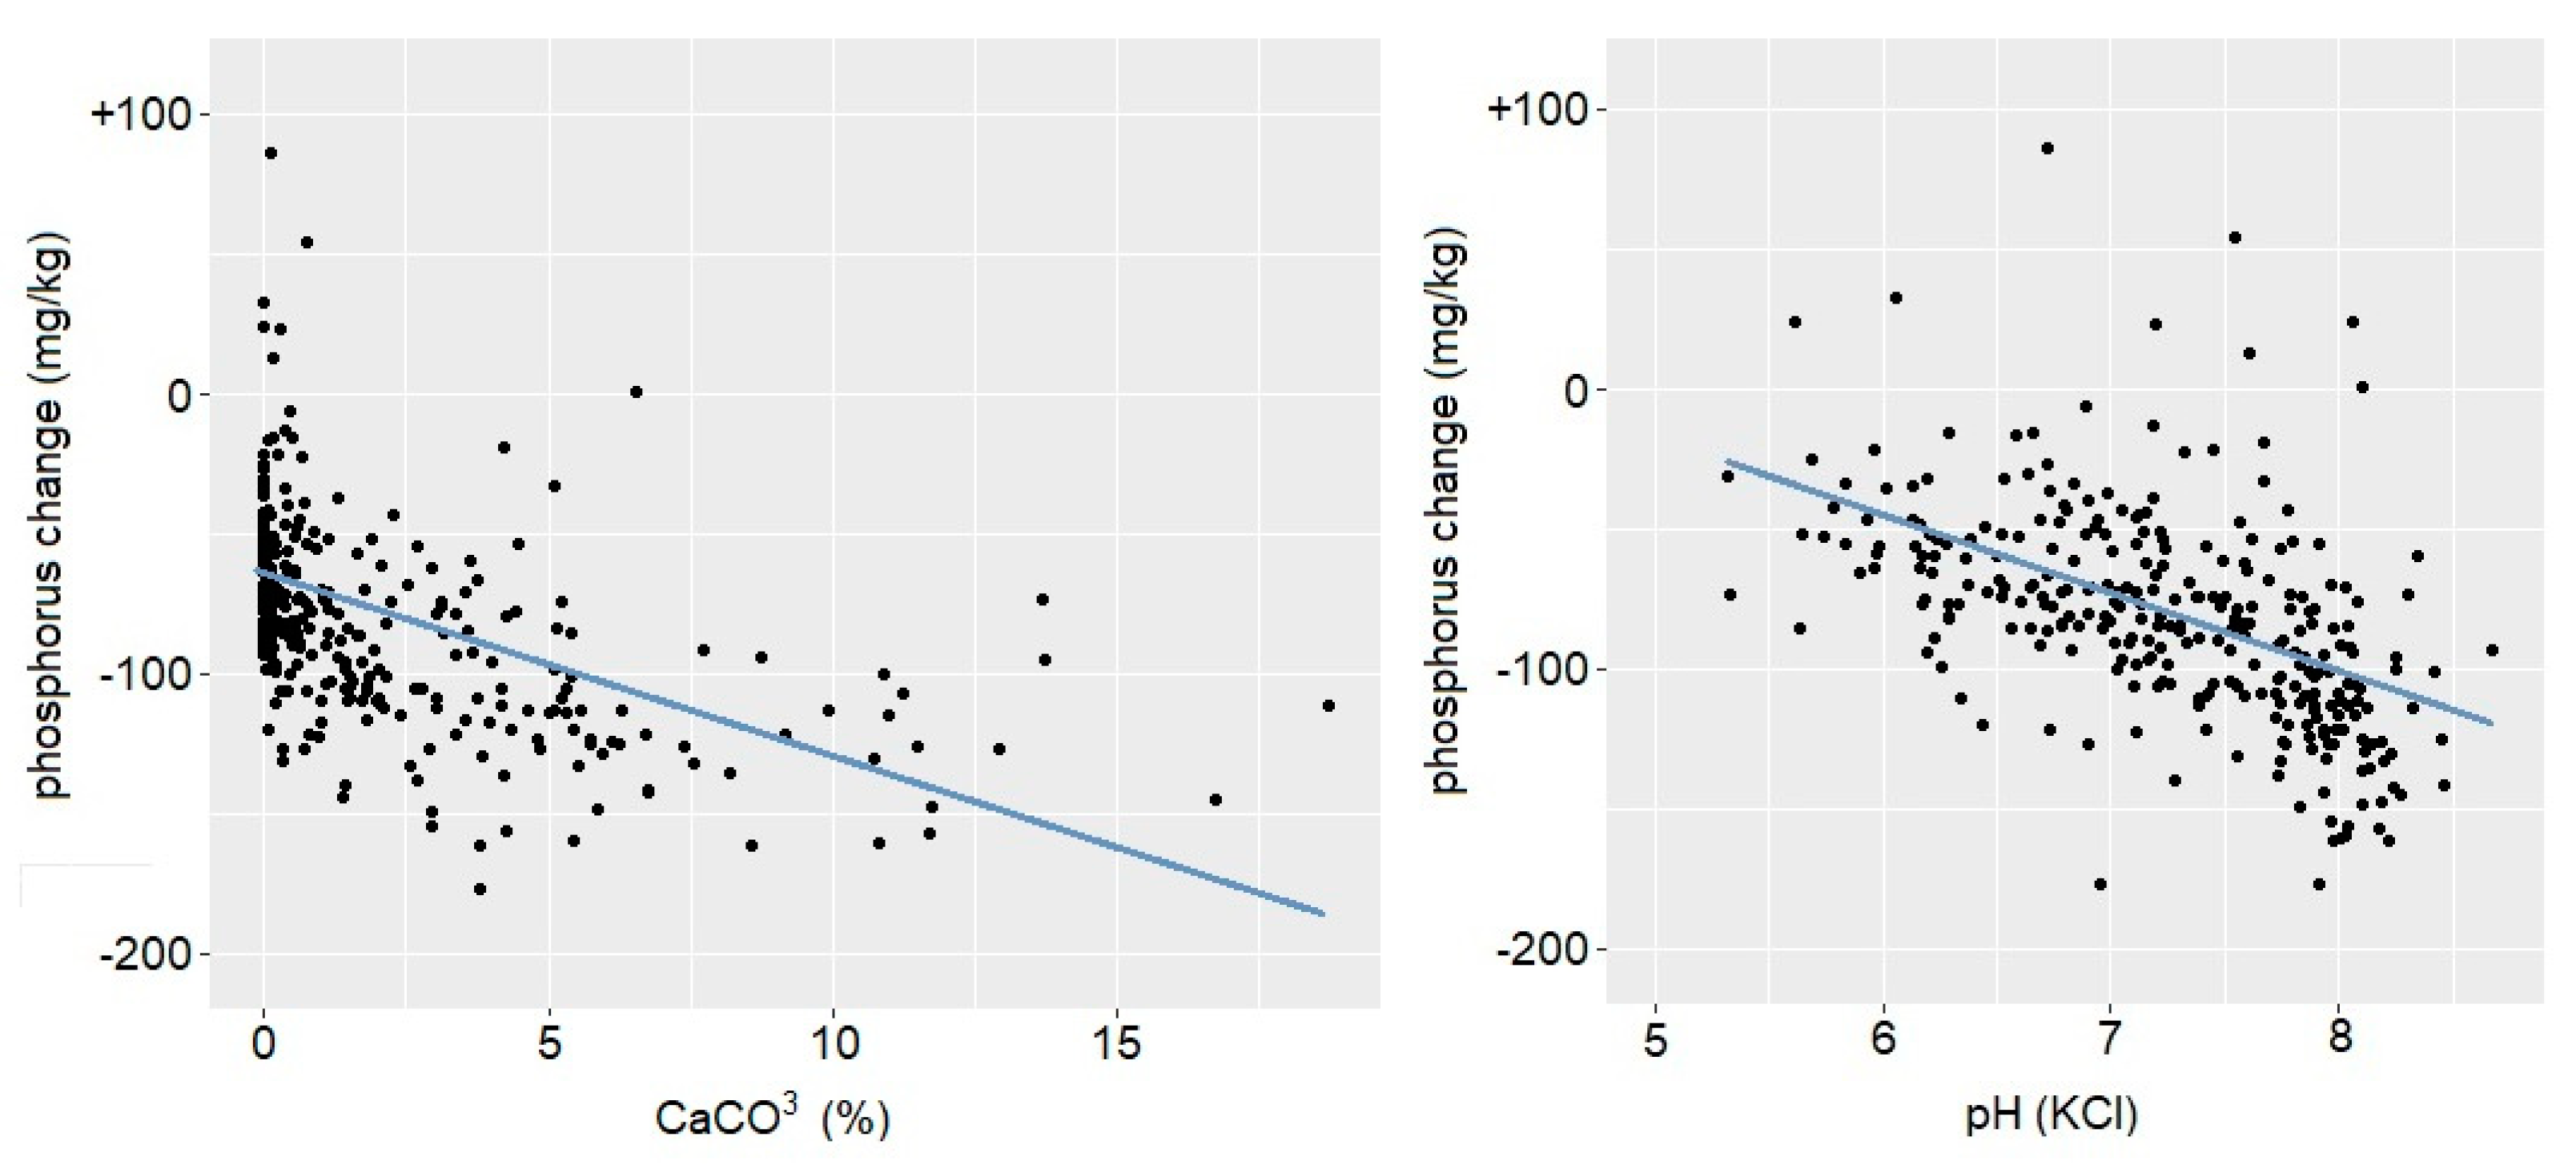
25]. However, where fertilization is significant (in agricultural areas) this effect is less investigable. In addition, our study has revealed that soil properties may play a greater role in the change of phosphorus levels than in actual phosphorus levels. We demonstrated that the decrease in soil phosphorus between the two periods was significantly influenced by soil chemistry (pH and CaCO
3). This effect is certainly due to phosphorus fixation. Several studies demonstrated [
26] that the fixing of phosphate takes place either at very low soil pH (through iron and aluminum) or high pH (through calcium). The optimal pH (KCl) for phosphorus availability is between 5 and 6. Although soil acidification is common in Hungary, very low pH is limited to very small areas. Phosphorus fixation is more characteristic of alkaline, calcareous soils in our case. According to our results, the degree of phosphorus decrease between the two periods starts to increase above pH KCl 5.5 and reaches its maximum around 8 (
Figure 3). This is slightly inconsistent with the scientific literature data, according to which above pH (KCL) 7 P precipitation by calcium starts to decline. However, in the pH (KCl) range above 7, in our case, there may be other factors in the background, such as salinization, which can also result in a decrease of bioavailable phosphorus.
In summary, we showed that at a given point in time actual phosphorus levels are most affected by agricultural use driven by socioeconomic conditions, but if we examine the change in the long-term, the role of soils can be demonstrated.
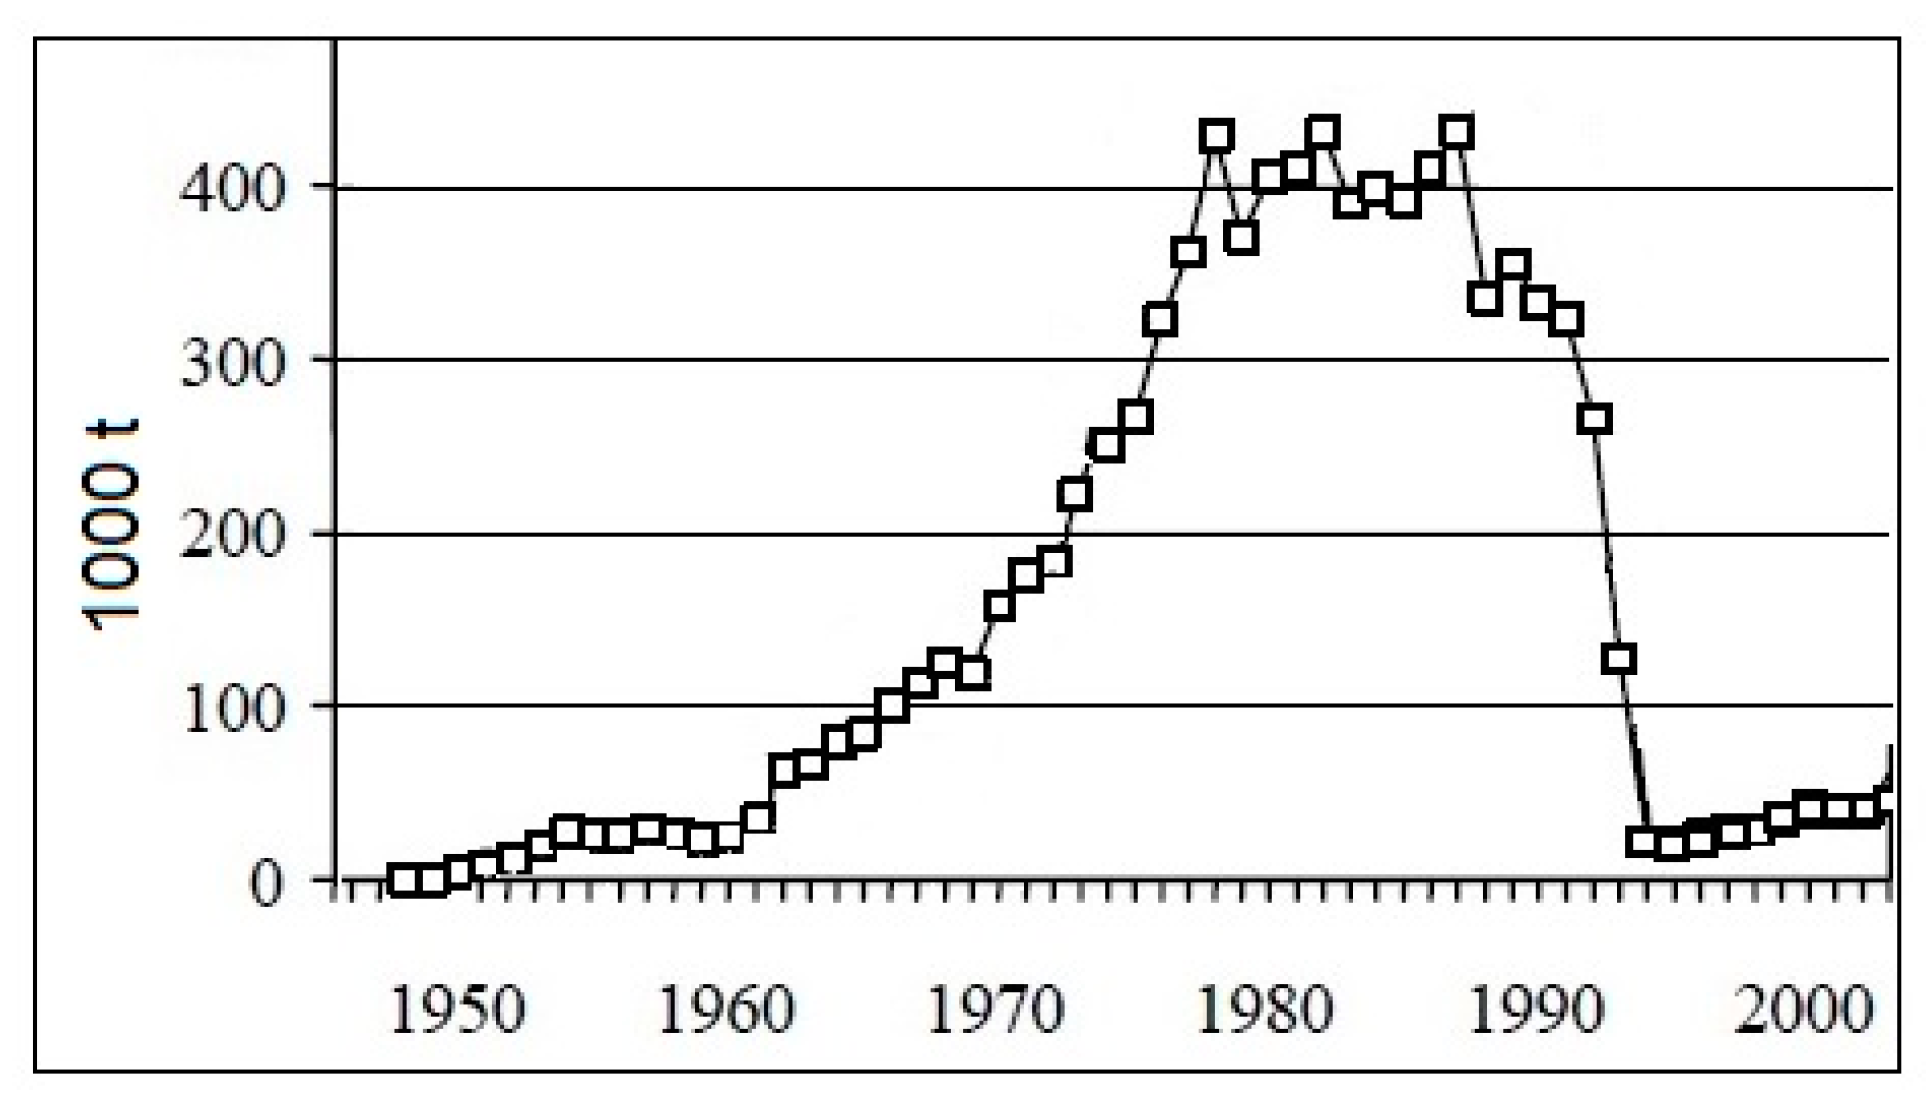
The decrease in phosphorus levels of Hungarian soils has been significant in recent decades. This is only in small part due to phosphorus fixation (which is only a factor explaining the territorial differences) and mainly driven by the drastic change in fertilization practices after 1989 (
Figure 7). In the socialist era, a “filling-up” style fertilization was suggested, for which the state provided financial support. In recent times, fertilization recommendation only aimed to maintain the nutrient level (without increasing it). After 1989, the level of fertilization initially decreased due to the lack of financial support, but low-level fertilization became a practice. The “filling-up” style nutrient application is no longer recommended, partly for environmental but presumably more for financial reasons.
In this study, we demonstrated that phosphorus levels in Hungarian soils have shown a dramatic decrease during recent decades—a total loss of 1.5 million tons of soluble P can be detected between 1989 and 2009. While there is no evidence that the decline has stopped, this can be confirmed with more recent data from soil monitoring systems (LUCAS) in the future. We assume that the “upfilled” phosphorus pool before 1989 greatly contributed to the success of farming in recent times. It is conceivable that the low fertilization can be maintained for a long time, but monitoring the phosphorus levels is very important in the control of nutrient depletion. As phosphorus balance remained negative in the last decade [
27] further decline is almost certain. Based on the overview of the European situation of P levels in agricultural soil [
7] we have a strong reason to believe that future trends will result in differentiated P concentrations in the soils of Hungary. In most EU countries, P levels of agricultural soils are diverse and follow the pattern of land productivity [
7]. It is very likely that in the future, if economic constraints will not play a major role in nutrient management, P concentration on fertile land will increase to a greater degree than on less fertile and marginal land in Hungary. The number and distribution of future livestock in the country can further modify the level of available P in soils.
Yields in agriculture significantly affect a country’s economic competitiveness. As the yields highly correlate with the nutrient supply of soil, proper fertilization is very important. According to literature data—still forming the basis of the Hungarian fertilization recommendation system [
28]—we have calculated that ~50% of the agricultural area is characterized by a very low phosphorus supply. In our opinion, maintenance style fertilization in these areas poses a risk for nutrient depletion; therefore, nutrient recovery will be required there. The only question is who is able to (or should) finance it.


