Abstract
Dissolved organic matter (DOM) in rivers are an important factor in pollution management due to the abundance of stored carbon. Using fluorescent spectroscopy, we investigated the temporal and spatial dynamics of DOM compositions, as well as their properties, for two of the major four regulated rivers—Han River (HR) and Geum River (GR) in South Korea. We collected eight sampling sites, four from each of the two rivers (from close to the weirs) in order to observe the integrated effects of different land use (terrestrial input) during the monsoon (July) and post-monsoon periods (September). High integral values of DOM compositions (July: 30.81 ± 9.71 × 10³ vs. September: 1.78 ± 0.66 × 10³) were present in all eight sites after heavy rainfall during the monsoon period, which indicated that Asian monsoon climates occupy a potent role in the DOM compositions of the rivers. Regarding DOM compositions, tryptophan-like and fulvic acid-like components were predominant in HR and GR, especially in GR with high integral values of protein-like and humus components. However, the properties of terrestrial DOM between HR and GR are markedly different. These results considered due to the different land use, where the terrestrial DOM shows a low degree of humification due to a high percentage of agriculture and urban land use in GR. Furthermore, these two rivers are typical regulated rivers, due to their weir constructions. High values of DOM components were present in the downstream of the weirs; however, increasingly high patterns appeared in the HR because of heavy rainfall (511.01 mm in HR; 376.33 mm in GR). In addition, a lower increasing trend of humic-like component was present in the GR due to a low percentage of forest land use/cover. These results suggest that the effect of the weir on rivers can be highlighted by the different percentages of land use/cover under the conditions of the monsoon period. Hence, DOM fluorescence can serve as an effective indicator for providing an early signal for the complex impacts of the different land use and rainfall in the regulated river systems.
1. Introduction
Rivers occupy a paramount role in water supply and the strengthening of human activities [1,2,3]. However, rivers are important not only for sustainable water supply for human activities (e.g., urban runoff, agriculture, industry, and landscape), but also for maintaining the biodiversity of local aquatic plants and animals [4]. Thus, many Asian countries (e.g., South Korea, China, and Japan) meet their water requirements through rivers, sometimes modifying their river systems to suit their own needs. Studies have shown that precipitation and terrestrial pollution sources (land use) are some of the paramount factors that determine the dynamics of the water quality of river systems [5,6,7]. In the unique Asian climate, heavy rainfall, caused by monsoons and/or typhoons produce heavy precipitation and impact the quality and quantity and change the flux of terrestrial pollution inputs from the surrounding catchment (land use) to the river ecosystems [3,6,8,9,10]. Studies have also shown that the high rates of agricultural and urban land cover tend to increase the nutrient load of rivers, found to be higher there than in rivers with natural forest and wetland cover [11,12].
South Korea has extremely vulnerable topographical conditions because of its mountainous features, accounting for 65% of its land area, which makes water management difficult. In addition, the dual effects of heavy use of the rivers by people and climate change have exacerbated the pollution of river ecosystems. Therefore, the Four Major Rivers Restoration Project (FMRRP) was planned in order to restore four large rivers of South Korea: the Han, the Nakdong, the Geum, and the Yeongsan rivers [13]. The project, which constructed 16 weirs to control flooding, protect water resources, and manage water quality, started in 2009 and finished in 2012 [14,15]. For the Han River (HR) and Geum River (GR), three movable multifunction weirs were built in each of the two rivers which can discharge sediment deposited on the riverbeds and adjust the amount of water according to climatic change [16]. Therefore, the target of this study, the HR and GR, are typical examples of regulated rivers in South Korea; the monsoon, weir flow control, and land use in the regulated river systems are also important issues. Changes in the water quality of regulated rivers have become serious problems facing countries of the world based on climatic change (monsoon) and land use patterns.
The key to solving these problems is to understand the influence of various factors, such as monsoon and land use, on water quality. However, the conventional physicochemical parameters can only characterize the changes in the quantity of nutrients in freshwater; with these parameters, it is difficult to explore the autochthonous reactions of water quality, based on terrestrial pollution sources. Recent studies have shown that fluorescent dissolved organic matter (DOM) has received considerable attention as a useful method for evaluating and managing water quality in various aquatic systems [17,18,19,20,21]. First, because DOM is rich in biological elements, such as carbon, nitrogen, and phosphorus [22,23,24], it can provide energy for microorganisms, thus playing a crucial role in the transportation, speciation, and bioavailability of carbon, nitrogen, and other elements in aquatic ecosystems [25,26]. Therefore, DOM occupies a paramount role in the matter cycle of aquatic ecosystems. Secondly, the compositions and properties of DOM in aquatic ecosystems are mainly related to terrestrial sources (e.g., urban runoff, agriculture, and industry) and endogenous sources (the growth and metabolism of plants, planktons, and microorganisms) [27,28]. Thus, DOM could be a paramount biogeochemical indicator which could be used for effectively managing water quality and controlling further deterioration. Thirdly, the fluorescence spectroscopy technique, especially three-dimensional excitation emission matrix (3D-EEM) fluorescence, can quickly and concisely provide the sources and compositions of DOM at natural concentrations without complex pretreatments before analysis [29,30,31].
In this study, we used the 3D-EEM spectra of DOM fluorescence to explore organic pollution sources and their impacts on the two regulated rivers (HR and GR). The three objectives of our study were to (1) explore the effects of terrestrial inputs during the monsoon and post-monsoon periods on the water quality of the two regulated rivers, (2) characterize the influences of the different surrounding land use on the two rivers by DOM fluorescence, and (3) discern the significance of the weir to the regulated rivers. These findings can provide a background for comprehending better and improving assessment and management practices in order to control terrestrial inputs from the river catchments to the waters, and for forecasting the future dynamics of river ecosystems under climatic change.
2. Materials and Methods
2.1. Study Area
The samples were collected from two regulated rivers in South Korea: the HR (sites H1U–H3U) and the GR (sites G1U–G3U), as illustrated in Figure 1. These sampling sites are located between 36–37° N (latitude) and 127° E (longitude). The HR and GR are two of the four major rivers in South Korea, with a drainage area of approximately 44,000 km2 (Figure 1 and Table 1). The main stem length of the HR and GR is ~494 km and ~389 km, respectively. The mean water depths of the two rivers were similar (~1.7 m). The HR flows through Seoul (the capital city of South Korea) and is the main provider of drinking water for more than 20 million people. These two rivers are typical regulated rivers because of the FMRRP, as the upper and lower areas of the three multifunction weirs in each of the two rivers were selected as study areas (HR: Gangcheon Weir, Yeoju Weir, and Ipo Weir; GR: Sejong Weir, Gongju Weir, and Baekje Weir). The monthly average temperatures of the rivers were 26 °C in July (2017) and 20 °C in September (2017) (Korea Meteorological Administration, http://www.kma.go.kr). The rivers undergo a typical monsoon climate with a monthly average precipitation of 511 mm (HR) and 377 mm (GR) in July (http://www.kma.go.kr). The information on the land use rates on the two rivers was downloaded from the Water Management Information System of Korea (WAMIS: http://www.wamis.go.kr). Forest is the most dominant land use in the basins of the two rivers: 71.1% (HR) and 61.7% (GR), as Table 1 summarizes.
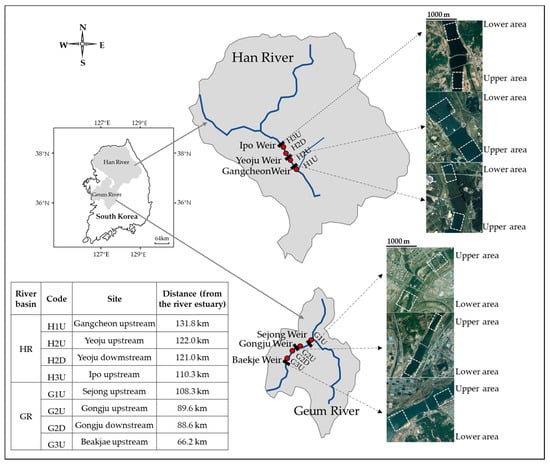
Figure 1.
Location of the sampling sites in South Korea. The Han River (HR) and Geum River (GR) are represented with blue lines. Red cirles represent the sampling location and black squares represent weirs.

Table 1.
Length, area, land use, air temperature, and monthly rainfall of the two river basins.
2.2. Sampling Strategy and Physicochemical Analyses
For this study, four sites in each of the two rivers were selected for sample collection, as illustrated in Figure 1. The eight sampling sites were located near the weirs. Sites H1U, H2U, H3U, G1U, G2U, and G3U were ~500 m above the weirs. H2D and G3D were ~500 m below the weirs. Water samples at the surfaces in the middle of the rivers were collected in July (during the monsoon period) and September (post-monsoon period) 2017 and the sampling time of each river took one day (10:00–15:00). The samples were filtered in situ using 0.45 μm glass microfiber filters (Whatman, GF/F, 47 mm in diameter). The filtered water samples were taken to the laboratory and stored at 4 °C for less than 24 h. The temperature, pH, and electrical conductivity (EC) of each water sample were measured onsite with a Horiba U-50 Series multiparameter water-quality meter. Data on total nitrogen (TN), total phosphorus (TP), total organic carbon (TOC), and chlorophyll a (Chl a) were collected from the WAMIS. TN was measured using the alkaline persulfate digestion method, TP was quantified using the ammonium molybdate method [32]; TOC was measured using a Shimadzu TOC-VCSH total organic carbon analyzer; Chl a was measured using the acetone extraction method [33].
2.3. EEM Fluorescence Spectroscopy
Before the measurements of the 3D-EEM, first, the samples were diluted with ultrapure water until the UV absorbance at 254 nm was below 0.05 cm−1 [34]. Second, the pH of the samples was adjusted to 3.0 to reduce the potential interference of heavy metals. Third, the samples from two rivers were measured by 3D-EEM using a Hitachi Fluorescence Spectrophotometer (F-7000), which was equipped with Fluorescence Solutions 2.1 software [35,36]. The 3D scan excitation wavelengths were set from 200 to 450 nm, with 5 nm as the step increment, and emission wavelengths from 280 to 550 nm with the same step increment, a bandwidth of 5 nm, and 0.5 s of integration time. The ultrapure water was used as a blank [37]. Fluorescence intensities and integral values were changed to quinine sulfate units [38].
To quantify the 3D-EEM results, we applied fluorescence regional integration (FRI), which was divided into five fluorescence regions of DOM according to the excitation–emission wavelengths [22,39,40], as illustrated in Table 2. In order to reflect the values of DOM composition in a specific area, the integral volume was normalized to a relative area. The normalized integral volume (Φi,n refers to the value area i) was calculated by OriginPro 2016 software. The obtainable parameters and indices were the humic-like fluorescence parameter (Fn (355)), protein-like fluorescence parameter (Fn (280)), fluorescence index (FI), humification index (HIX), and biological index (BIX). The Fn (355) value is the maximum fluorescence intensity of the emission wavelength region of 440–470 nm (excitation wavelength was kept at 355 nm). The Fn (280) value is the maximum fluorescence intensity of the emission wavelength region of 340–360 nm (excitation wavelength was kept at 280 nm) [41]. The FI value is the ratio of fluorescence intensity at the emission wavelengths of 470 and 520 nm (excitation wavelength was kept at 370 nm) [42]. The HIX value is the ratio of the integral area of the emission wavelength region of 435–480 nm and 300–345 nm under constant excitation of 254 nm [43,44]. The BIX value is the fluorescence intensity ratio at emission wavelengths of 380 and 430 nm (excitation wavelength was kept at 310 nm) [19].
Table 2.
The five compositions of fluorescence dissolved organic matter (DOM) in the two rivers.
3. Results
3.1. Physicochemical Properties of RiverWater
Table 3 summarizes the variations of water quality in the HR and GR during monsoon and post-monsoon periods. The average temperature of the two rivers showed higher values in July (26.53 ± 2.08 °C) than in September (22.78 ± 0.78 °C), revealing a temporal change pattern. The values of temperature in the HR were higher than those in the GR. The pH values found in the HR ranged from 7.78 to 7.95 and all the sites were similar in July and September in this regard. However, the values of the GR sites in July were lower compared to September (mean value: 7.34 ± 0.04 vs. 9.05 ± 0.04). The EC values of all the HR sites were similar at the same sampling time, but slightly higher in July. In the GR, the EC values decreased from the upstream to the downstream in both July and September. The TN concentrations showed clear temporal change and had high values in July (summer), which then decreased in September in the HR. The site H3U, which is located downstream of the HR, showed the highest TN concentrations in July and September. In the GR, relatively high TN concentrations were observed, showing similar values between the sites G1U and G2U. The TP concentrations found in the two rivers showed higher values in July (0.18 ± 0.09 mg/L), compared to September (0.05 ± 0.02 mg/L). The Chl a concentrations in the HR were lower than those in the GR. In the HR, the Chl a concentrations had a mean of 4.53 ± 1.79 μg/L in July and 16.70 ± 6.21 μg/L in September; however, in the GR, the Chl a concentrations ranged from 35.60 to 95.25 μg/L, with the water body showing signs of eutrophication. The TOC concentrations in the HR were shown to be 3.85 ± 2.17 mg/L in July and 2.07 ± 0.22 mg/L in September. In the case of the GR, TOC concentrations were higher than in the HR in both July and September. The TOC also showed strong temporal variations, with high values in July and relatively low values in September.
Table 3.
Basic properties of water samples in two rivers (HR and GR).
3.2. FRI Components of DOM
The integral volume values of the DOM components showed clear temporal changes in the two rivers, and the differences among all the sites were obvious, as illustrated in Figure 2a,b. The integral values of the DOM components were high in July and low in September, following a pattern similar to that of TOC. In the HR, the total integral values of the DOM components, except in site H2U (July), generally increased along the river (from the upstream to the downstream) in both July and September. Regarding the lower value showed in site H2U (July), could the causes of this result could be the precipitation of organic matters and the dilution of several tributaries along the river (HR). However, all the sites of the GR showed no significant changes. The dominant DOM components in the two rivers were the tryptophane-like (T) (ΦT,n: 11.71 ± 4.26 × 10³ in July, 0.58 ± 0.29 × 10³ in September) and fulvic acid-like (A) (ΦA,n: 9.25 ± 3.03 × 10³ in July, 0.55 ± 0.15 × 10³ in September) components. The temporal and spatial variations of the percent (Pi,n, the percent of Φi,n for the five components) in the two rivers are shown in Figure 2c,d. Regarding the temporal variation of the two rivers, the proportions of the five DOM components in the GR were relatively stable, and the orders of the proportions of the DOM components were as follows: PT,n > PA,n > PC,n > PD,n > PB,n. However, in the HR, significant changes were found. The percentages of the protein-like components (PB,n, PT,n, and PD,n) decreased greatly in September, while the A and humic acid-like (C) components increased simultaneously. Regarding the spatial variation of the two rivers, the sample sites of the GR were similar, but the sites of the HR changed; in both July and September, PT,n and PD,n increased and the humus components (PA,n and PC,n) decreased in the downstream of the HR (H3U).
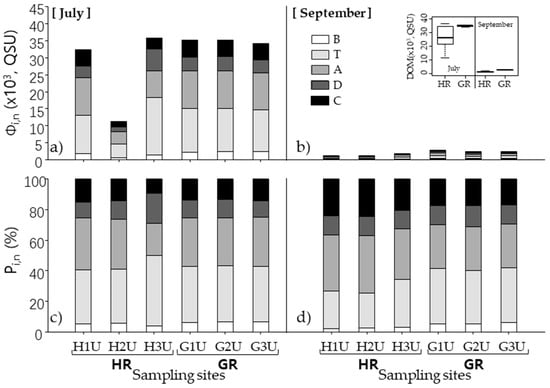
Figure 2.
Distributions of the abundance (a,b) and percentages (c,d) of DOM components in the two rivers (HR and GR): a and c during monsoon period, b and d during post-monsoon period.
A correlation analysis was performed to further explore the outcome of the five DOM components in the two rivers (Table 4). For the DOM components of the two rivers in July and September, there was a significant correlation between the A and C components (HR-July and GR-September: P < 0.01, HR-September and GR-July: P < 0.05). Furthermore, the humus substances (A and C) also showed different degrees of correlation with the protein-like substances (B, D, and T). However, there were no correlations among the B, T, and D components in the two rivers during July and September.
Table 4.
Correlations (Pearson’s r) among different fluorescence components of DOM from the two rivers (HR and GR).
3.3. Fluorescence Characteristic Parameter
Fn (355) represents the relative contents of the humic-like substance (C), and Fn (280) represents the relative contents of the protein-like substance. These two indicators were used to characterize the contributions of terrestrial and autonomous sources to the DOM composition of water bodies [41]. As shown in Figure 3, the temporal and spatial variations of the Fn (355) and Fn (280) values displayed significant differences in the two rivers. In the HR, except Fn (355)-July, all sampling sites showed an increasing pattern, from the upstream to the downstream of the river. Contrariwise, there was a decreasing pattern in the GR. Meanwhile, the Fn (280) values that represent the relative contents of the protein-like substance were higher than the Fn (355) values (the relative contents of the humic-like substance) in the two rivers, except the HR in September.
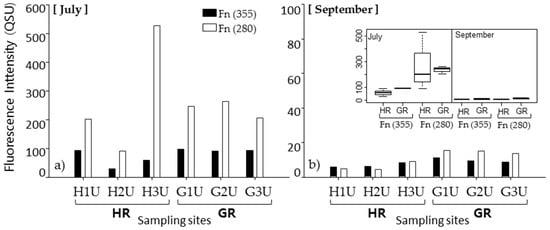
Figure 3.
Comparisons between Fn (355) and Fn (280) of DOM samples from two the rivers (HR and GR) in July (a) and September (b).
The FI is effectively used to differentiate the sources of the DOM (terrestrial or endogenous). FI > 1.9 indicates an endogenous source, mainly derived from growth and the metabolism of microorganisms and phytoplankton; however, FI < 1.4 indicates a terrestrial source derived from the human activities (industrial and/or agricultural) [19,42]; when the FI values are between 1.4 and 2.0, the sources of the DOM included both terrestrial and endogenous sources. As shown in Figure 4a, the FI values were significantly different for July and September. The FI values of the two rivers in July ranged from 1.22 to 1.48. In September, the FI values ranged from 1.74 to 1.96, higher than those from July. In this study, HIX values greater than 10 were used as an indicator of strong humification, mainly contributed to by terrestrial sources [19,44]. In Figure 4, the HIX values in this study ranged from 0.76 to 6.22, and were all much less than 10. The BIX can also indicate endogenous sources and provide proxies for the relative contribution of the freshly microbial produced DOM [19,45]. BIX > 0.8 indicates that the DOM was an obvious endogenous DOM, which was freshly produced by microorganisms [19,46]. In this study, all BIX values of the two rivers in July ranged from 0.65 to 0.76, and there was no significant difference between the HR and the GR (Figure 4b). However, the BIX values in September ranged from 0.86 to 0.97, and the BIX values of the HR were lower than that of the GR.
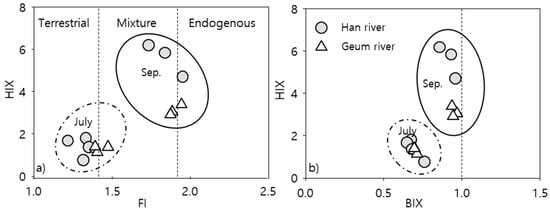
Figure 4.
Distributions of FI vs. HIX (a), and BIX vs. HIX (b) for the two rivers (HR and GR). FI indicates fluorescence index; HIX indicates humidification index; BIX indicates biological index).
4. Discussion
Various factors, including climatic (monsoon), hydrological, physicochemical, and/or biological factors, can affect the temporal and spatial dynamics of nutrients. The water quality results (TN, TP, and Chl a) changed greatly (Table 3), which were similar to the results found in the literature [47,48]. The concentrations of TN and TP in the two rivers show temporal changes. Except for one sampling site (G1U in September), TN concentrations at each site were higher in concentration during the monsoon period, ranging from 2.78 to 3.02 mg/L, compared to the post-monsoon period, which ranged from 2.48 to 2.91 mg/L. The TP concentrations showed similar changes to the TN; all the TP values were higher in July (the monsoon period). The precipitation in July was higher than in September (443.78mm vs. 60.73 mm) for both of the rivers, and the temporal difference suggests that nutrient pollution is associated with the surface runoff during the monsoon period [48,49]. In general, increased nutrient promoted phytoplankton growth (as measured by Chl a) was reported [50,51]. The Chl a values in the two rivers were relatively high in September, which was affected by the changes of temperature and nutrients [52,53]. The paramount factors of the changes of TN, TP, and Chl a in the aquatic ecosystems were terrestrial input, along with heavy rainfall, the growth and degradation of phytoplankton, and sediment release [52]. Additionally, local rainfall showed the strong effect of TOC [54]; all the TOC values in each site were higher in July. These results showed a clear relationship between water quality and monsoon impact (terrestrial input).
In this study, it was found that the river DOM was dominated by terrestrial-derived and aromatic compounds during the monsoon conditions, which was also shown in other research [55,56]. The A and C components were generally derived from the decay and degradation products of plant residues, having complex molecular structures and high aromaticity, which was a typical feature of terrestrial sources. In addition, protein-like components in DOM compositions were prone to causing DOM instability [57], especially tyrosine-like (B) and T components, which could also be utilized to trace endogenous DOM [50] and terrestrial DOM [45,58,59]. The T component represented freshly produced protein and had a lower degree of degradation than the B component, which had a higher degree of degradation. In Figure 2a,b, the results of the lack of the B component in the two rivers suggested that the protein-like components found in this study were dominated by freshly produced protein. In addition, the T component is also related to the biological oxygen demand (BOD) of and microbial activity in wastewater, which can be used to track terrestrial sources [59,60,61]. Therefore, the higher component T values of the DOM during the monsoon period (July) suggests that terrestrial influences are more significant. In addition, the higher integral values of protein-like components and humus components in GR suggest that terrestrial sources are degraded less by the high percentages of agriculture and urban land use (Table 1). These results indicate that agricultural activities (a high percentage of agricultural land use) have an influence on the humus content [45], and human activities (a high percentage of urban land use) have an effect on the protein content [38]. Hence, these findings could explain that both the quantity and quality of DOM components were different between HR and GR mainly due to their different land uses and monsoon impact. Furthermore, with climate change (the effects of global warming), the patterns of extreme climate events, such as monsoon or typhoons, might change, which might become an important factor in determining the water quality of river systems. Extreme climate events produce concentrated heavy rainfall, change the frequency of floods, and cause changes in the quantity and quality of DOM, which is consistent with our results.
For the two rivers, the A and C components are from a common source in all sites, but the order of correlation coefficients was HR-July and September (r = 1.00) > GR-September (r=.99) > GR-July (r = 0.95), which indicated the degree of humification and DOM composition are variables strongly influenced by surrounding land use (Table 4). The GR is surrounded by a high percentage of agricultural and urban land use (Table 1) and has a lower degree of humification than a forest ecosystem [47], resulting in less complicated DOM structures than in the HR (HR forest cover percentage: 71.1%). In the HR, the B component was correlated with the A and C components, and the correlation coefficients were higher in September (r = 1.00) than in July (r = 0.99). In the GR, the T component was correlated with the A and C components, and the correlation coefficients were also higher in September (r = 0.98) than in July (r = 0.95). These results indicate that the DOM components are more complicated during the monsoon period. Hence, the correlation analysis of the humus and protein-like substances reflects the impact of river catchments on terrestrial sources.
The indices of Fn (355), Fn (280), FI, HIX, and BIX clearly showed the properties and sources of the DOM [41,62,63]. The Fn (355) and Fn (280) values of the two rivers were higher in July, which indicates that a great deal of terrestrial DOM is inputted by rainfall (Table 1). In addition, the values of the two indicators are higher in the GR; this indicates that the DOM of the protein-like and humus substances are higher in the GR, which is consistent with that of the integral values of the DOM components (Figure 2a,b) because of the high percentage of agricultural and urban land use. The mean FI value of the two rivers was 1.37 ± 0.08 in July, indicating that the sources of the DOM are terrestrial DOM, affected by the monsoon. In September, the FI values in the GR were higher than 1.9 (higher than the HR), which is attributed to direct terrestrial influences (precipitation: 105 mm) in a high content of protein-like substances. In addition, abundant nutrients (Table 3) from agricultural runoff may have led to higher endogenous sources in the GR, which is consistent with that of the Chl a (Table 3). These results are supported by previous findings. The nutrients produced by different land uses (the terrestrial sources) enter the freshwater ecosystems, along with runoff, which increases phytoplankton biomass and thus enhances the endogenous source [62,63]. The mean HIX value of the two rivers was 2.67 ± 1.74 in July and September, indicating low humification. The cause of the low humification of the DOM in the two rivers can be inferred by three concrete reasons: (1) a low degree of humus development is affected by the characteristics of land use in the river basin; (2) the terrestrial inputs increase amount of microbial by-products, such as the humus substance, degraded by microorganisms [45,64]; (3) highly humic substances adsorbed on suspended particles are preferentially removed. The BIX values were lower in July (< 0.8), which indicates that terrestrial DOM was inputted in July while endogenous DOM dominated in September (> 0.8), which shows a positive and negative relationship with higher FI and HIX, respectively. These results inferred that endogenous DOM (high FI values) has a low degree of humus development, which may be related to the accumulation of microorganisms (high BIX values) in the post-monsoon period [19,45].
The dam and weir can have many positive effects on rivers, including the reduction of flooding and securing water resources [13,65]. However, the negative effects are likely to be considerable; in particular, one of the major functions of the artificial weirs is to slow down water flow, increasing water retention time and affecting not only the physicochemical properties of the water (including the accumulation of carbon and nutrients), but also the biomass and composition of algae. [66,67]. After construction of the weir, the long water retention time increased the release of the DOM degradation process of phytoplankton [27,28] and particulate organic matter in sediments [68,69]. In this study, the dynamics of DOM were significantly affected by the construction of the weirs. As shown in Figure 5a, the total integral values of the DOM components were higher in the downstream sites of the weirs (H2D and G2D) than the upstream sites (H2U and G2U) in the two rivers. This spatial pattern is consistent with some previous studies of the weir system [70] and suggests that a long hydraulic retention time, due to the weir regulation, is the main cause of DOM variations. In addition, the same increasing patterns occurred in the DOM indices (Figure 5b). However, the degrees of change were significantly different between the two rivers, not only regarding the abundance of the DOM compositions, but also the DOM indices. In the HR, all values increased more than one time in the H2D site. However, in the GR, the increasing trends of DOM were clearly lower than in the HR; this result is assumed to be related to the difference in precipitation (511.01 mm vs. 376.55 mm) between the two rivers. For DOM compositions, the variations of protein-like and C components were similar in the HR. However, in the GR, the protein-like substance increased greatly, compared to the C component. These results are assumed to be related to the different characteristics of land use in the surrounding area; a high forest cover percentage showed high values of humus substance and a relatively high degree of humus development [63,71]. In summary, due to the lack of water quality data available, we were not able to extrapolate the impact of the weirs on their respective rivers, but the impact of the weirs through the variations of the DOM is described in this study. In particular, the complex surrounding catchment (land use), coupled with extreme climate events (monsoon), can highlight the cumulative load impact of the weirs on their rivers.
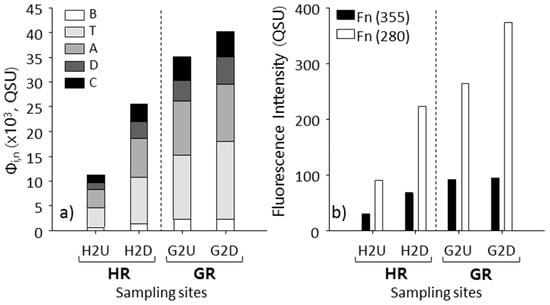
Figure 5.
Description of the abundance of DOM components (a) and the indices (b) of DOM from the upstream of the weir to the downstream of the weir in HR and GR in July.
5. Conclusions
The quantities and qualities of DOM in the two rivers were analyzed by 3D-EEM. The results allow us to draw the following three conclusions: (1) The intensity values of terrestrial protein-like and humus components in the two rivers were higher during the monsoon period, compared to the post-monsoon period. However, there were stable proportional relationships of DOM components, and these were sorted with the same order of compositions: T > A > C > D > B (except HR-September); if climate changes increase the frequency of monsoons and typhoons, the quantities of the DOM transported from land to water would increase, and thus the properties of DOM components might increasingly shift to terrestrial DOM; (2) Due to the high percentage of a forest ecosystem in HR (71.1%), the degree of humus development in GR was lower than in HR; this suggested that the different land use had a significant effect on the river ecosystems, along with the terrestrial DOM inputs; (3) The intensity values of the DOM components and indices values from the upstream to the downstream of the weirs showed increasing patterns indicating that the weirs increased the amount of river DOM, due to the degradation of phytoplankton and sediment release under the condition of a long water retention time. In general, this study provides a good reference on the quantity and quality of DOM as a paramount indicator for influence assessments of future anthropogenic change in regulated rivers under climatic change conditions.
Author Contributions
Conceptualization, M.-Y.J. and K.-H.C.; methodology, M.-Y.J. and K.-H.C.; formal analysis, M.-Y.J. and H.-J.O.; investigation, H.-J.O. and K.-H.C.; writing—original draft preparation, M.-Y.J.; writing—review and editing, K.-H.C. and J.-M.O.; visualization, M.-Y.J., J.S.H., Z.-Y.L. and K.-H.C.; supervision, K.-H.C. and J.-M.O.; project administration, K.-H.S., M.-H.J., H.-W.K. and B.C. All authors have read and agreed to the published version of the manuscript.
Funding
This research was funded by Korea Environment Industry & Technology Institute (KEITI) by the Korea Ministry of Environment (MOE) as Advanced Water Management Research Program (98640).
Conflicts of Interest
The authors declare no conflict of interest.
References
- Sheldon, F.; Thoms, M.C.; Berry, O.; Puckridge, J. Using disaster to prevent catastrophe: Referencing the impacts of flow changes in large dryland rivers. Regul. Rivers Res. Manag. 2000, 16, 403–420. [Google Scholar] [CrossRef]
- Bertrand, C.; Siauve, V.; Fayolle, S.; Cazaubon, A. Effects of hydrological regime on the drift algae in a regulated Mediterranean river (River Verdon, southeastern France). Regul. Rivers Res. Manag. 2001, 17, 407–416. [Google Scholar] [CrossRef]
- Yoshimura, C.; Omura, T.; Furumai, H.; Tockner, K. Present state of rivers and streams in Japan. River Res. Appl. 2005, 21, 93–112. [Google Scholar] [CrossRef]
- Suen, J.P.; Eheart, J.W. Reservoir management to balance ecosystem and human needs: Incorporating the paradigm of the ecological flow regime. Water Resour. Res. 2006, 42. [Google Scholar] [CrossRef]
- Kim, B.; Choi, K.; Kim, C.; Lee, U.H.; Kim, Y.H. Effects of the summer monsoon on the distribution and loading of organic carbon in a deep reservoir, Lake Soyang, Korea. Water Res. 2000, 34, 3495–3504. [Google Scholar] [CrossRef]
- Dudgeon, D. An inventory of riverine biodiversity in monsoonal Asia: Present status and conservation challenges. Water Sci. Technol. 2002, 45, 11–19. [Google Scholar] [CrossRef]
- Baker, A.; Spencer, R.G. Characterization of dissolved organic matter from source to sea using fluorescence and absorbance spectroscopy. Sci. Total Environ. 2004, 333, 217–232. [Google Scholar] [CrossRef]
- Wiegner, T.N.; Seitzinger, S.P. Seasonal bioavailability of dissolved organic carbon and nitrogen from pristine and polluted freshwater wetlands. Limnol. Oceanogr. 2004, 49, 1703–1712. [Google Scholar] [CrossRef]
- Madhu, N.V.; Jyothibabu, R.; Balachandran, K.K.; Honey, U.K.; Martin, G.D.; Vijay, J.G.; Shiyas, C.A.; Gupta, G.V.M.; Achuthankutty, C.T. Monsoonal impact on planktonic standing stock and abundance in a tropical estuary (Cochin backwaters–India). Estuar. Coast. Shelf Sci. 2007, 73, 54–64. [Google Scholar] [CrossRef]
- Wilson, H.F.; Xenopoulos, M.A. Effects of agricultural land use on the composition of fluvial dissolved organic matter. Nat. Geosci. 2009, 2, 37–41. [Google Scholar] [CrossRef]
- Boyer, E.W.; Goodale, C.L.; Jaworski, N.A.; Howarth, R.W. Anthropogenic nitrogen sources and relationships to riverine nitrogen export in the northeastern USA. Biogeochemistry 2002, 57, 137–169. [Google Scholar] [CrossRef]
- Mattsson, T.; Kortelainen, P.; Laubel, A.; Evans, D.; Pujo-Pay, M.; Räike, A.; Conan, P. Export of dissolved organic matter in relation to land use along a European climatic gradient. Sci. Total Environ. 2009, 407, 1967–1976. [Google Scholar] [CrossRef] [PubMed]
- Lah, T.J.; Park, Y.; Cho, Y.J. The four major rivers restoration project of South Korea: An assessment of its process, program, and political dimensions. J. Environ. Dev. 2015, 24, 375–394. [Google Scholar] [CrossRef]
- Seo, D. Basin Environment management for the successful four great rivers project in Korea. J. Korean Soc. Civ. Eng. 2009, 57, 26–28. [Google Scholar]
- Jun, K.S.; Kim, J.S. The four major rivers restoration project: Impacts on river flows. KSCE J. Civ. Eng. 2011, 15, 217–224. [Google Scholar] [CrossRef]
- Ahn, J.M.; Lee, S.; Kang, T. Evaluation of dams and weirs operating for water resource management of the Geum River. Sci. Total Environ. 2014, 478, 103–115. [Google Scholar] [CrossRef] [PubMed]
- Coble, P.G. Marine optical biogeochemistry: The chemistry of ocean color. Chem. Rev. 2007, 107, 402–418. [Google Scholar] [CrossRef] [PubMed]
- Yamashita, Y.; Jaffe, R.; Maie, N.; Tanoue, E. Assessing the dynamics of dissolved organic matter (DOM) in coastal environments by excitation emission matrix fluorescence and parallel factor analysis (EEM–PARAFAC). Limnol. Oceanogr. 2008, 53, 1900–1908. [Google Scholar] [CrossRef]
- Huguet, A.; Vacher, L.; Relexans, S.; Saubusse, S.; Froidefond, J.M.; Parlanti, E. Properties of fluorescent dissolved organic matter in the Gironde Estuary. Org. Geochem. 2009, 40, 706–719. [Google Scholar] [CrossRef]
- Yao, X.; Zhang, Y.L.; Zhu, G.W.; Qin, B.Q.; Feng, L.Q.; Cai, L.L.; Gao, G. Resolving the variability of CDOM fluorescence to differentiate the sources and fate of DOM in Lake Taihu and its tributaries. Chemosphere 2011, 82, 145–155. [Google Scholar] [CrossRef]
- Zhang, Q.; Sun, P.; Chen, X.; Jiang, T. Hydrological extremes in the Poyang Lake basin, China: Changing properties, causes and impacts. Hydrol. Process. 2011, 25, 3121–3130. [Google Scholar] [CrossRef]
- Chen, W.; Westerhoff, P.; Leenheer, J.A.; Booksh, K. Fluorescence excitation—Emission matrix regional integration to quantify spectra for dissolved organic matter. Environ. Sci. Technol. 2003, 37, 5701–5710. [Google Scholar] [CrossRef] [PubMed]
- Yu, H.; Song, Y.; Tu, X.; Du, E.; Liu, R.; Peng, J. Assessing removal efficiency of dissolved organic matter in wastewater treatment using fluorescence excitation emission matrices with parallel factor analysis and second derivative synchronous fluorescence. Bioresour. Technol. 2013, 144, 595–601. [Google Scholar] [CrossRef]
- Yu, H.; Song, Y.; Gao, H.; Liu, L.; Yao, L.; Peng, J. Applying fluorescence spectroscopy and multivariable analysis to characterize structural composition of dissolved organic matter and its correlation with water quality in an urban river. Environ. Earth Sci. 2015, 73, 5163–5171. [Google Scholar] [CrossRef]
- Zhang, Y.; Yin, Y.; Feng, L.; Zhu, G.; Shi, Z.; Liu, X.; Zhang, Y. Characterizing chromophoric dissolved organic matter in Lake Tianmuhu and its catchment basin using excitation-emission matrix fluorescence and parallel factor analysis. Water Res. 2011, 45, 5110–5122. [Google Scholar] [CrossRef]
- Peng, J.; Ren, Z.; Song, Y.; Yu, H.; Tang, X.; Gao, H. Impact of spring flooding on DOM characterization in a small watershed of the Hun River, China. Environ. Earth Sci. 2015, 73, 5131–5140. [Google Scholar] [CrossRef]
- Mostofa, K.M.; Yoshioka, T.; Konohira, E.; Tanoue, E. Dynamics and characteristics of fluorescent dissolved organic matter in the groundwater, river and lake water. Water Air Soil Pollut. 2007, 184, 157–176. [Google Scholar] [CrossRef]
- Herzsprung, P.; von Tümpling, W.; Hertkorn, N.; Harir, M.; Büttner, O.; Bravidor, J.; Friese, K.; Schmitt-Kopplin, P. Variations of DOM quality in inflows of a drinking water reservoir: Linking of van Krevelen diagrams with EEMF spectra by rank correlation. Environ. Sci. Technol. 2012, 46, 5511–5518. [Google Scholar] [CrossRef]
- Stedmon, C.A.; Markager, S.; Bro, R. Tracing dissolved organic matter in aquatic environments using a new approach to fluorescence spectroscopy. Mar. Chem. 2003, 82, 239–254. [Google Scholar] [CrossRef]
- Jaffé, R.; McKnight, D.; Maie, N.; Cory, R.; McDowell, W.H.; Campbell, J.L. Spatial and temporal variations in DOM composition in ecosystems: The importance of long-term monitoring of optical properties. J. Geophys. Res. 2008, 113, G04032. [Google Scholar] [CrossRef]
- SanClements, M.D.; Oelsner, G.P.; McKnight, D.M.; Stoddard, J.L.; Nelson, S.J. New insights into the source of decadal increases of dissolved organic matter in acid-sensitive lakes of the Northeastern United States. Environ. Sci. Technol. 2012, 46, 3212–3219. [Google Scholar] [CrossRef] [PubMed]
- Kazi, T.G.; Arain, M.B.; Jamali, M.K.; Jalbani, N.; Afridi, H.I.; Sarfraz, R.A.; Bajg, J.A.; Shah, A.Q. Assessment of water quality of polluted lake using multivariate statistical techniques: A case study. Ecotoxicol. Environ. Saf. 2009, 72, 301–309. [Google Scholar] [CrossRef]
- Holm-Hansen, O.; Lorenzen, C.J.; Holmes, R.W.; Strickland, J.D. Fluorometric determination of chlorophyll. ICES J. Mar. Sci. 1965, 30, 3–15. [Google Scholar] [CrossRef]
- Hur, J.; Lee, D.H.; Shin, H.S. Comparison of the structural, spectroscopic and phenanthrene binding characteristics of humic acids from soils and lake sediments. Org. Geochem. 2009, 40, 1091–1099. [Google Scholar] [CrossRef]
- Jamieson, T.; Sager, E.; Guéguen, C. Characterization of biochar-derived dissolved organic matter using UV—Visible absorption and excitation—Emission fluorescence spectroscopies. Chemosphere 2014, 103, 197–204. [Google Scholar] [CrossRef] [PubMed]
- Shafiquzzaman, M.; Ahmed, A.T.; Azam, M.S.; Razzak, A.; Askri, B.; Hassan, H.F.; Ravikumar, B.N.; Okuda, T. Identification and characterization of dissolved organic matter sources in Kushiro river impacted by a wetland. Ecol. Eng. 2014, 70, 459–464. [Google Scholar] [CrossRef]
- Zhu, G.; Yin, J.; Zhang, P.; Wang, X.; Fan, G.; Hua, B.; Ren, B.; Zheng, H.; Deng, B. DOM removal by flocculation process: Fluorescence excitation–emission matrix spectroscopy (EEMs) characterization. Desalination 2014, 346, 38–45. [Google Scholar] [CrossRef]
- Goldman, J.H.; Rounds, S.A.; Needoba, J.A. Applications of fluorescence spectroscopy for predicting percent wastewater in an urban stream. Environ. Sci. Technol. 2012, 46, 4374–4381. [Google Scholar] [CrossRef]
- Wang, Z.; Wu, Z.; Tang, S. Characterization of dissolved organic matter in a submerged membrane bioreactor by using three-dimensional excitation and emission matrix fluorescence spectroscopy. Water Res. 2009, 43, 1533–1540. [Google Scholar] [CrossRef]
- Bilal, M.; Jaffrezic, A.; Dudal, Y.; Le Guillou, C.; Menasseri, S.; Walter, C. Discrimination of farm waste contamination by fluorescence spectroscopy coupled with multivariate analysis during a biodegradation study. J. Agric. Food Chem. 2010, 58, 3093–3100. [Google Scholar] [CrossRef]
- Zhang, Y.; Liu, M.; Qin, B.; Feng, S. Photochemical degradation of chromophoric-dissolved organic matter exposed to simulated UV-B and natural solar radiation. Hydrobiologia 2009, 627, 159–168. [Google Scholar] [CrossRef]
- Cory, R.M.; Miller, M.P.; McKnight, D.M.; Guerard, J.J.; Miller, P.L. Effect of instrument-specific response on the analysis of fulvic acid fluorescence spectra. Limnol. Oceanogr. Methods 2010, 8, 67–78. [Google Scholar]
- Ohno, T.; Fernandez, I.J.; Hiradate, S.; Sherman, J.F. Effects of soil acidification and forest type on water soluble soil organic matter properties. Geoderma 2007, 140, 176–187. [Google Scholar] [CrossRef]
- Ohno, T. Fluorescence inner-filtering correction for determining the humification index of dissolved organic matter. Environ. Sci. Technol. 2002, 36, 742–746. [Google Scholar] [CrossRef] [PubMed]
- Williams, C.J.; Yamashita, Y.; Wilson, H.F.; Jaffé, R.; Xenopoulos, M.A. Unraveling the role of land use and microbial activity in shaping dissolved organic matter characteristics in stream ecosystems. Limnol. Oceanogr. 2010, 55, 1159–1171. [Google Scholar] [CrossRef]
- Birdwell, J.E.; Engel, A.S. Characterization of dissolved organic matter in cave and spring waters using UV—Vis absorbance and fluorescence spectroscopy. Org. Geochem. 2010, 41, 270–280. [Google Scholar] [CrossRef]
- Park, S.M.; Shin, Y.K. The impact of monsoon rainfall on the water quality in the upstream watershed of southern Han River. Korean J. Ecol. Environ. 2011, 44, 373–384. [Google Scholar]
- Jeong, K.S.; Kim, D.K.; Shin, H.S.; Yoon, J.D.; Kim, H.W.; Joo, G.J. Impact of summer rainfall on the seasonal water quality variation (chlorophyll a) in the regulated Nakdong River. KSCE J. Civ. Eng. 2011, 15, 983–994. [Google Scholar] [CrossRef]
- Park, S.B.; Lee, S.K.; Chang, K.H.; Jeong, K.S.; Joo, G.J. The impact of monsoon rainfall (Changma) on the changes of water quality in the lower Nakdong River (Mulgeum). Korean J. Ecol. Environ. 2002, 35, 160–171. [Google Scholar]
- Bledsoe, E.L.; Phlips, E.J.; Jett, C.E.; Donnelly, K.A. The relationships among phytoplankton biomass, nutrient loading and hydrodynamics in an inner-shelf estuary. Ophelia 2004, 58, 29–47. [Google Scholar] [CrossRef]
- Liu, L.; Huang, Q.; Zhang, Y.; Qin, B.; Zhu, G. Excitation-emission matrix fluorescence and parallel factor analyses of the effects of N and P nutrients on the extracellular polymeric substances of Microcystis aeruginosa. Limnologica 2017, 63, 18–26. [Google Scholar] [CrossRef]
- Xu, H.; Paerl, H.W.; Qin, B.; Zhu, G.; Gaoa, G. Nitrogen and phosphorus inputs control phytoplankton growth in eutrophic Lake Taihu, China. Limnol. Oceanogr. 2010, 55, 420–432. [Google Scholar] [CrossRef]
- Paerl, H.W.; Xu, H.; McCarthy, M.J.; Zhu, G.; Qin, B.; Li, Y.; Gardner, W.S. Controlling harmful cyanobacterial blooms in a hyper-eutrophic lake (Lake Taihu, China): The need for a dual nutrient (N P) management strategy. Water Res. 2011, 45, 1973–1983. [Google Scholar] [CrossRef] [PubMed]
- Royer, T.V.; David, M.B. Export of dissolved organic carbon from agricultural streams in Illinois, USA. Aquat. Sci. 2005, 67, 465–471. [Google Scholar] [CrossRef]
- Guéguen, C.; Guo, L.; Wang, D.; Tanaka, N.; Hung, C.C. Chemical characteristics and origin of dissolved organic matter in the Yukon River. Biogeochemistry 2006, 77, 139–155. [Google Scholar] [CrossRef]
- Shin, Y.; Lee, E.J.; Jeon, Y.J.; Hur, J.; Oh, N.H. Hydrological changes of DOM composition and biodegradability of rivers in temperate monsoon climates. J. Hydrol. 2016, 540, 538–548. [Google Scholar] [CrossRef]
- Fellman, J.B.; Hood, E.; D’amore, D.V.; Edwards, R.T.; White, D. Seasonal changes in the chemical quality and biodegradability of dissolved organic matter exported from soils to streams in coastal temperate rainforest watersheds. Biogeochemistry 2009, 95, 277–293. [Google Scholar] [CrossRef]
- Baker, A. Fluorescence excitation−emission matrix characterization of some sewage-impacted rivers. Environ. Sci. Technol. 2001, 35, 948–953. [Google Scholar] [CrossRef]
- Baker, A. Fluorescence properties of some farm wastes: Implications for water quality monitoring. Water Res. 2002, 36, 189–195. [Google Scholar] [CrossRef]
- Henderson, R.K.; Baker, A.; Murphy, K.R.; Hambly, A.; Stuetz, R.M.; Khan, S.J. Fluorescence as a potential monitoring tool for recycled water systems: A review. Water Res. 2009, 43, 863–881. [Google Scholar] [CrossRef]
- Carstea, E.M.; Bridgeman, J.; Baker, A.; Reynolds, D.M. Fluorescence spectroscopy for wastewater monitoring: A review. Water Res. 2016, 95, 205–219. [Google Scholar] [CrossRef] [PubMed]
- Jiang, T.; Skyllberg, U.; Björn, E.; Green, N.W.; Tang, J.; Wang, D.; Gao, J.; Li, C. Characteristics of dissolved organic matter (DOM) and relationship with dissolved mercury in Xiaoqing River-Laizhou Bay estuary, Bohai Sea, China. Environ. Pollut. 2017, 223, 19–30. [Google Scholar] [CrossRef] [PubMed]
- Catalán, N.; Obrador, B.; Felip, M.; Pretus, J.L. Higher reactivity of allochthonous vs. autochthonous DOC sources in a shallow lake. Aquat. Sci. 2013, 75, 581–593. [Google Scholar] [CrossRef]
- Bianchi, T.S. The role of terrestrially derived organic carbon in the coastal ocean: A changing paradigm and the priming effect. Proc. Natl. Acad. Sci. USA 2011, 108, 19473–19481. [Google Scholar] [CrossRef] [PubMed]
- Maingi, J.K.; Marsh, S.E. Quantifying hydrologic impacts following dam construction along the Tana River, Kenya. J. Arid. Environ. 2002, 5, 53–79. [Google Scholar] [CrossRef]
- Li, Z.; Wang, S.; Guo, J.; Fang, F.; Gao, X.; Long, M. Responses of phytoplankton diversity to physical disturbance under manual operation in a large reservoir, China. Hydrobiologia 2012, 684, 45–56. [Google Scholar] [CrossRef]
- Lee, H.J.; Park, H.K.; Cheon, S.U. Effects of weir construction on phytoplankton assemblages and water quality in a large river system. Int. J. Environ. Res. Public Health 2018, 15, 2348. [Google Scholar] [CrossRef]
- Burdige, D.J.; Komada, T.; Magen, C.; Chanton, J.P. Modeling studies of dissolved organic matter cycling in Santa Barbara Basin (CA, USA) sediments. Geochim. Cosmochim. Acta 2016, 195, 100–119. [Google Scholar] [CrossRef]
- Chen, M.; Kim, J.H.; Nam, S.I.; Niessen, F.; Hong, W.L.; Kang, M.H.; Hur, J. Production of fluorescent dissolved organic matter in Arctic Ocean sediments. Sci. Rep. 2016, 6, 1–10. [Google Scholar] [CrossRef]
- Gołdyn, R.; Szeląg-Wasielewska, E. The Effects of Two Shallow Reservoirs on the Phyto- and Bacterioplankton of Lowland River. Pol. J. Environ. Stud. 2005, 14, 437–444. [Google Scholar]
- Piccolo, A. Humic Substances in Terrestrial Ecosystems; Elsevier: Amsterdam, The Netherlands, 1996; pp. 101–160. [Google Scholar]
© 2020 by the authors. Licensee MDPI, Basel, Switzerland. This article is an open access article distributed under the terms and conditions of the Creative Commons Attribution (CC BY) license (http://creativecommons.org/licenses/by/4.0/).