1. Introduction
Farm diversification is understood as the creation of any gainful activities that do not comprise any farm work but are directly related to the holding, that is, use of its resources or products, and have an economic impact on the holding [
1]. These activities can be a continuation of agricultural production using the farm’s agricultural output for processing, or may employ the farm’s equipment, buildings, and workforce for the production of goods and services other than growing crops or rearing animals [
2]. Barnes et al. define farm diversification as a process to produce income from activities that are not defined as conventional farming, or to process raw material on-farm, often in order to pursue a marketing strategy based on value-added products [
3]. Farm diversification comprises the reallocation and recombination of farm resources away from its original farming activity to generate another form of income [
4,
5]. Examples of farm diversification include accommodation and other leisure activities, handcraft, processing of farm products, small value chains (e.g. direct sale), aquaculture, production of renewable energy for the market, and contractual work using equipment of the holding.
In the EU classification, farm diversification is distinguished from the broader concept of pluri-activity which refers to all income-generating activities of the farmer, including off-farm work and additional businesses run by the farmer, which is not linked to the farm [
1,
6,
7]. Note that diversification activities can be carried out by persons other than the farm manager (his/her spouse, other family members, or people external to the household). In contrast, pluri-activity is assessed at the level of the farmer (the family farm manager and sole holder of the farm). A farmer is considered pluri-active if he carries out an activity other than farm work (in most cases) for remuneration. This can be outside the farm, in a non-agricultural enterprise, or on another farm; or on their own holding if diversification activities do not include any farm work. In the latter case, the definitions of pluri-activity and diversification overlap [
8]. In this paper we focus on diversification of the income basis into non-agricultural activities, as presented in Polish Rural Development Program 2007–2013. The objective of this measure is to provide support for farmers, household members, and farmers’ spouses starting or developing non-agricultural activity related to production or services [
9].
Van Der Ploeg and Roep classified farm diversification as engaging in ‘deepening’ or ‘broadening’ activities. ‘Deepening’ refers to the agricultural production, including those activities improving the product characteristics and/or moving down the line of the supply chain (e.g., farm gate sales, farmers’ market, sale to retailers, school or cooperatives, mobile sale, and processing). ‘Broadening’ creates new sources of income that are not directly related to agriculture but connected to agricultural resources (e.g., agro-tourism and care farms) [
10]. Similar classification but with the use of different terminology was presented by [
11], who distinguishes between vertical and lateral diversification. Vertical diversification represents ‘deepening’, while lateral corresponds to ‘broadening’ activities.
In microeconomic theory, which considers farmers as decision-makers seeking profit maximization, diversification is usually explained by models of optimal labor allocation [
7]. Farmers are assumed to maximize their utility by developing various types of activities subject to a number of constraints, such as time and budget. Morris et al. additionally list physical constraints of agricultural production, such as weather and land, as well as social and policy expectations [
12]. From a farming household perspective, farm diversification might be considered as a business strategy [
2] or, in some cases, a matter of farms’ durability [
13], which helps use unemployed workforce [
12], broaden the income base [
6], reduce dependence on agricultural subsidies [
14], and mitigate primary production uncertainty with more income streams. Other reasons for farm diversification might involve a farmer’s or family member’s background in certain activity. Żmija considers education or experience in the field as one of the main factors positively influencing a decision to diversify [
11]. Moreover, as demonstrated by [
15] marketing skills and entrepreneurial attitudes of farmers are essential for sustainable farm diversification.
From a broader macro- and meso-economic perspective, diversification is closely related to the concept of rural multi-functionality which has recently become a cornerstone of EU policy [
16]. After decades of policy intervention centered around farm concentration, specialization, and industrialization of agricultural production in the EU, there has been a gradual shift towards sustainable rural development and extensification of agriculture [
17,
18]. In line with the amendments to the common agricultural policy (CAP), policy support for farm diversification in the EU has recently received increased recognition [
6]. In years 2014–2020, EU countries have allocated 7.4% on average of total public expenditure to the measures dedicated to farm and business development, which includes, inter alia, support for farm diversification [
8]. Farm diversification is also a central issue in the debate surrounding the common agricultural policy (CAP) reform, as well as in the EU Horizon 2020 strategies [
19].
Although sustaining the income of farm households remains one of the main objectives of EU policy [
1], the EU supports farm diversification, not only for the farmers themselves but also, more generally, for the sustainability of the sector and the added value it brings to rural economies [
8]. Diversification helps achieve economic growth goals in rural areas, creates job openings, encourages in-migration [
3], enables steady farm and rural development [
2], and makes the sector more economically resilient [
3,
17]. It also aims to prevent marginalization of small farms, enhance rural entrepreneurship, and promote innovations in farming. From the structural policy perspective, diversification is also believed to strengthen the territorial and social cohesion of rural areas [
20].
Growing interest in farm diversification processes has been also noticeable in economic literature. Current studies mostly focus on diversification determinants from the farm perspective, such as farmer and household characteristics [
2,
13,
21], linkages to farm performance [
3,
19], impacts of financial incentives [
22,
23,
24], and farm location [
5,
6,
25,
26,
27,
28].
When analyzing the impact of farm location on diversification processes [
29] present diversification as a relevant option for farms located in areas with exogenous structural constraints. In these areas, low return from agricultural production incentivizes farmers to find new income strategies. Similar findings are presented by [
26] who shows that diversification has got positive effects on regional income in areas where agriculture is a minor player. This can be partly explained by a classical agricultural land rent theory, which explains grouping of activities in a specific area due to different marginal productivity levels caused by differences in soil quality. Conversely, the results of [
28] demonstrate that funds for diversification are better absorbed in the regions of relatively strong agricultural potential (expressed by farm size, agricultural productivity, livestock density etc.). This is in line with studies of [
2,
5,
6,
30,
31], which indicate that that larger farms are more likely to be diversified, since they can allocate and exploit available resources more efficiently. However, the relationship between economic size and propensity to diversify is found to be ambiguous amongst the different diversification activities. For ‘broadening’ activities a positive correlation is found, while deepening activities (associated with agricultural production) are significantly negatively influenced by increased farm size [
5].
Moreover, there is no consensus in the literature concerning the impact of farms’ proximity to urban areas on their likelihood to diversify the activities. Lange et al. record that ‘diversification rather seems to be associated with rurality and not so much with the proximity to urban consumer markets’ [
6]. Similarly, [
32] show that farm diversification probability is negatively influenced by closeness to urban areas. Also, [
25] underlies the role of landscapes attractiveness in explaining diversification. Boncinelli et al. outline that distant farms opt for diversification more often than farms situated closer to urban areas [
2], while [
4,
33] argue that urban demand for rural goods and services represents a driving factor to adapt farming activities in a multifunctional way. Thus, farmers closer to tourist sites or urban areas are more likely to diversify because of the higher demand for farming services. Moreover, as outlined by [
34] in peri-urban areas, the limited potential for farms’ expansion in terms of farm size makes the uptake of on-farm non-agricultural diversification an attractive strategy for farmers. Researching different forms of diversification [
5] concludes that only some of them (such as on-farm sales) substantially benefit from proximity to urban areas, gaining from lower transportation costs, higher turnovers, and reduced price volatility. Similar conclusions have been drawn by [
35] who states that consumer-oriented diversification activities, such as direct sale are common business strategies of farms within urban areas. Also [
36] presents the production of foods in close proximity to the consumers as one of benefits of urban agriculture.
These results might be context-specific and depend on initial motives behind farm diversification. Kristensen et al. distinguish between the ‘push’ and ‘pull’ motives behind engaging in on-farm activities depending on farm location [
27]. ‘Push’ motives dominate in remote and disadvantaged agricultural areas where unprofitable farm production forces the farmers to initiate new non-agricultural activities. Contrary, in peri-urban areas, farm diversification may be driven by ‘pull’ motives, such as purchasing a farm to start up a non-agricultural activity [
27] or regional and local policy [
15,
24]. The adoption of on-farm diversification strategy in peri-urban areas can also be interpreted as a specific business strategy developed by the most structured and market-oriented farms, which re-allocate the production factors in order to diversify (and to increase) income sources [
37,
38].
The purpose of this paper is to characterize spatial determinants of farm diversification in Poland by identifying and describing the territorial clusters (the definition of territorial clusters will be provided in the following section of the paper) of rural areas where farmers’ interest in diversification is above or below the national average. The existence of such clusters might suggest that the policy toward diversification favors areas with specific structural features, which might not be in line with the objective of territorial and social cohesion of rural areas.
In Poland, the excess of agricultural labor, along with strong regional differences in rural development levels, are considered as the main development obstacles of agriculture [
39,
40,
41]. Despite an evident need and great potential for diversification of Polish rural areas, less than 5% of Polish farms are diversified, which is below EU average [
8]. Around 5.2% of all EU farms are diversified. The situation is deeply contrasted across member states: while this share is less than 5% in Italy, Poland, Malta, Spain, Greece, Bulgaria, Romania, Cyprus and Lithuania, it reaches 52% in Denmark, 37.3% in Austria, 33.8% in Sweden, 31% in Germany, and 26% in Finland [
8]. In 2007–2013, the budget for ‘diversification into non-agricultural activities’ co-financed by the European Agricultural Fund for Rural Development reached 345.6 million Euros. In current rural development programing, diversification is a part of wider objective aiming to develop farms and enhance economic activity in rural areas, with the total budget of over 1.2 billion Euros. While these funds might indeed influence the farm diversification structure, the effects will strongly depend on their spatial distribution.
The outline of the paper is as follows. First, it presents the research method. Next, the method is used to explore municipality (NUTS 5) clusters in Poland with below- and above-average frequencies of applying for ‘diversification into non-agricultural activities’ (‘Diversification into non-agricultural activities’ is the official name of the program implemented in Polish Rural Development Program (RDP) 2007-2013), and, on that basis, to assess the impact of spatial characteristics on the farmers’ willingness to diversify. Finally, this paper concludes with a discussion on the spatial implications of the EU diversification policy in Poland, study limitations and policy recommendations.
2. Materials and Methods
The analysis involves Polish municipalities, which represent the smallest administrative units (NUTS 5 regions). The study population was composed of rural and urban-rural municipalities (urban municipalities were excluded). Frequency coefficients
were calculated for each municipality to reflect the farmers’ interest in applying for the measure ‘diversification into non-agricultural activities’ under the Polish Rural Development Program 2007–2013. ‘Diversification into non-agricultural activities’ is also implemented as part of the current EU financial perspective. However, as the program is in progress, no overall data on the applications is not available. Therefore, this paper focuses on the RDP 2007–2013 for which overall summaries are available. We took into consideration applications for all possible types of activities offered by the Polish Rural development program 2007–2013. In the PRDP 2007–2013, support under ‘diversification into non-agricultural activities’ was granted to farmers or a household member starting or developing activity related to: services for agricultural holdings or forestry, services for the population, services for tourists and connected with sports and leisure, transport services, public utility services, production of the energy products from biomass, wholesale and retail, craft and handicraft, construction and installation works and services, processing of agricultural products and edible forest products, warehousing and storage of products, accounting, and consulting services [
9]. The coefficients were defined as the ratio between the number of applications for ‘diversification into non-agricultural activities’ filed by the farmers and the total number of farms in each municipality. This study intentionally focused on the number of applications filed rather than on the number of agreements signed because the former figure better reflects the farmer’s interest in the program. Still, the proposed frequency coefficients are only proxy to analyze the ‘interest’ in diversification. Several reasons, such as the lack of specific support for selected diversification activities and/or to other policy constraints, as well as result of the type of activities, which may be not so dependent from public support might influence the low applications for the RDP measure. Note that the coefficients may be impacted by the population size (number of farms in a municipality), and therefore the precision of estimation may differ between them. This can have a distorting effect on the spatial distribution of frequencies. Coefficients based on a small population can result in the emergence of artifacts which reflect the lack of sufficient data rather than actual frequencies. The empirical Bayesian smoothing routine, as proposed by [
42], was used for the calculated coefficients in order to reduce these gaps as per the formula below:
where:
is the new Bayes smooth coefficient of frequency,
is the local weighted average (i.e., determined after joining direct neighbors),
is the smoothing coefficient, and
is the raw level of the coefficient of frequency.
This is especially useful if the coefficients are unstable due to small observation numbers for some less populated territories [
43]. Conversely, territories with large populations are described with stable coefficient that do not require any adjustments.
The spatial analyses were based on the Queen adjacency matrix with elements
(i.e., the assumption was made that the municipalities which share a border with a non-zero length are considered to be adjacent). The adjacency matrix was standardized so the rows sum to one in order to equalize the impact of municipalities with a large and small number of neighbors. The Moran’s global spatial autocorrelation coefficient
was used to check for spatial autocorrelation.
where:
– number of municipalities
,
– Bayes smooth coefficients of frequency in
and
municipalities
– global coefficient of frequency for Poland in the years covered by the analysis.
Low values of the coefficient suggest the absence of autocorrelation. If high (i.e., close to one) and statistically significant, the global Moran’s coefficient reflects a positive autocorrelation (i.e., a strong tendency to build clusters).
Cluster exploration means grouping together municipalities which exhibit a level of the feature considered (the frequency of applying for diversification support) above/below the average value for the entire territory covered by the analysis, specifically rural and urban-rural municipalities (urban municipalities were excluded)) This was done using the local Moran’s statistic developed by [
44], per the following formula:
The local Moran’s autocorrelation coefficient served as a basis for separating the statistically significant (at 0.05) cluster of above-average frequencies of applying for diversification support (High-High) from the cluster of below-average values (Low-Low) and outliers. The outliers are territories which statistically significantly differ from the adjacent municipalities in how they apply for diversification funds. If a municipality with a high level of the coefficient of applying for diversification support is adjacent to municipalities at low levels, it is designated as High-Low. In turn, if a municipality reporting a low level of the coefficient is surrounded by municipalities at high levels, it is labeled as Low-High.
In order to describe the clusters of municipalities where the frequency of applying for diversification funds was above or below the national average, synthetic characteristics of the Polish agriculture and rural areas were used, as presented by [
28]. The characteristics were established with a factor analysis based on 59 indexes of agricultural and rural characteristics at municipality level. The full list of the used indexes is presented in [
28]. The data came from public databases: the Polish Central Statistical Office, the Institute of Soil Science and Plant Cultivation, the State Research Institute, the Agricultural and Food Quality Inspection, and the Agency of Restructuration and Modernization of Agriculture in Poland. Each of the factors comprised a set of variables calculated based on statistical data, capturing 70.4% of the overall data variance in total. The extracted factors were: farm structures, infrastructure, organic agriculture, demography, animal production, entrepreneurship, and agricultural land greening.
Table 1 presents the factors with corresponding variables derived from the factor analysis.
This study used factor scores to measure the level of selected agricultural and rural features of each municipality. Factor scores, as composite measures created for each observation (municipality) of each factor extracted in the factor analysis, are standardized to reflect a z-score. Thus, factor scores for all municipalities sum up to zero. At the municipality level, the factor score reflects the position relative to the level of the extracted features of Polish agriculture and rural areas.
Due to skewness of data obtained from the factor analysis, non-parametric methods were used in describing the characteristics of the territories included in the groups covered by the analysis. This was done using the Kruskal–Wallis test together with the Dunn–Bonferroni post-hoc test.
When describing the characteristics of areas at high/low frequency of applications for diversification funds, High-Low outliers with high coefficients were merged with High-High clusters to form a group referred to as High. In turn, Low-High outliers and Low-Low clusters formed a group designated as Low.
Geospatial analyses were performed in GeoDa v1.14. Other statistical analyses were carried out in PQStat v1.6.8. The significance level was set at alpha = 0.05.
3. Results
The applied method allows to extract municipality clusters exhibiting statistically different frequencies of applying for the diversification measure (Moran’s global statistic 0.488, p<0.001).
Table 2 shows the numbers of municipalities which form clusters at the above-average application frequency for diversification funds (High-High); municipalities which form clusters at below-average application (Low-Low), High-Low and Low-High outliers and out-of-cluster municipalities (at medium levels of the coefficient of frequency), calculated using the Moran’s local statistic.
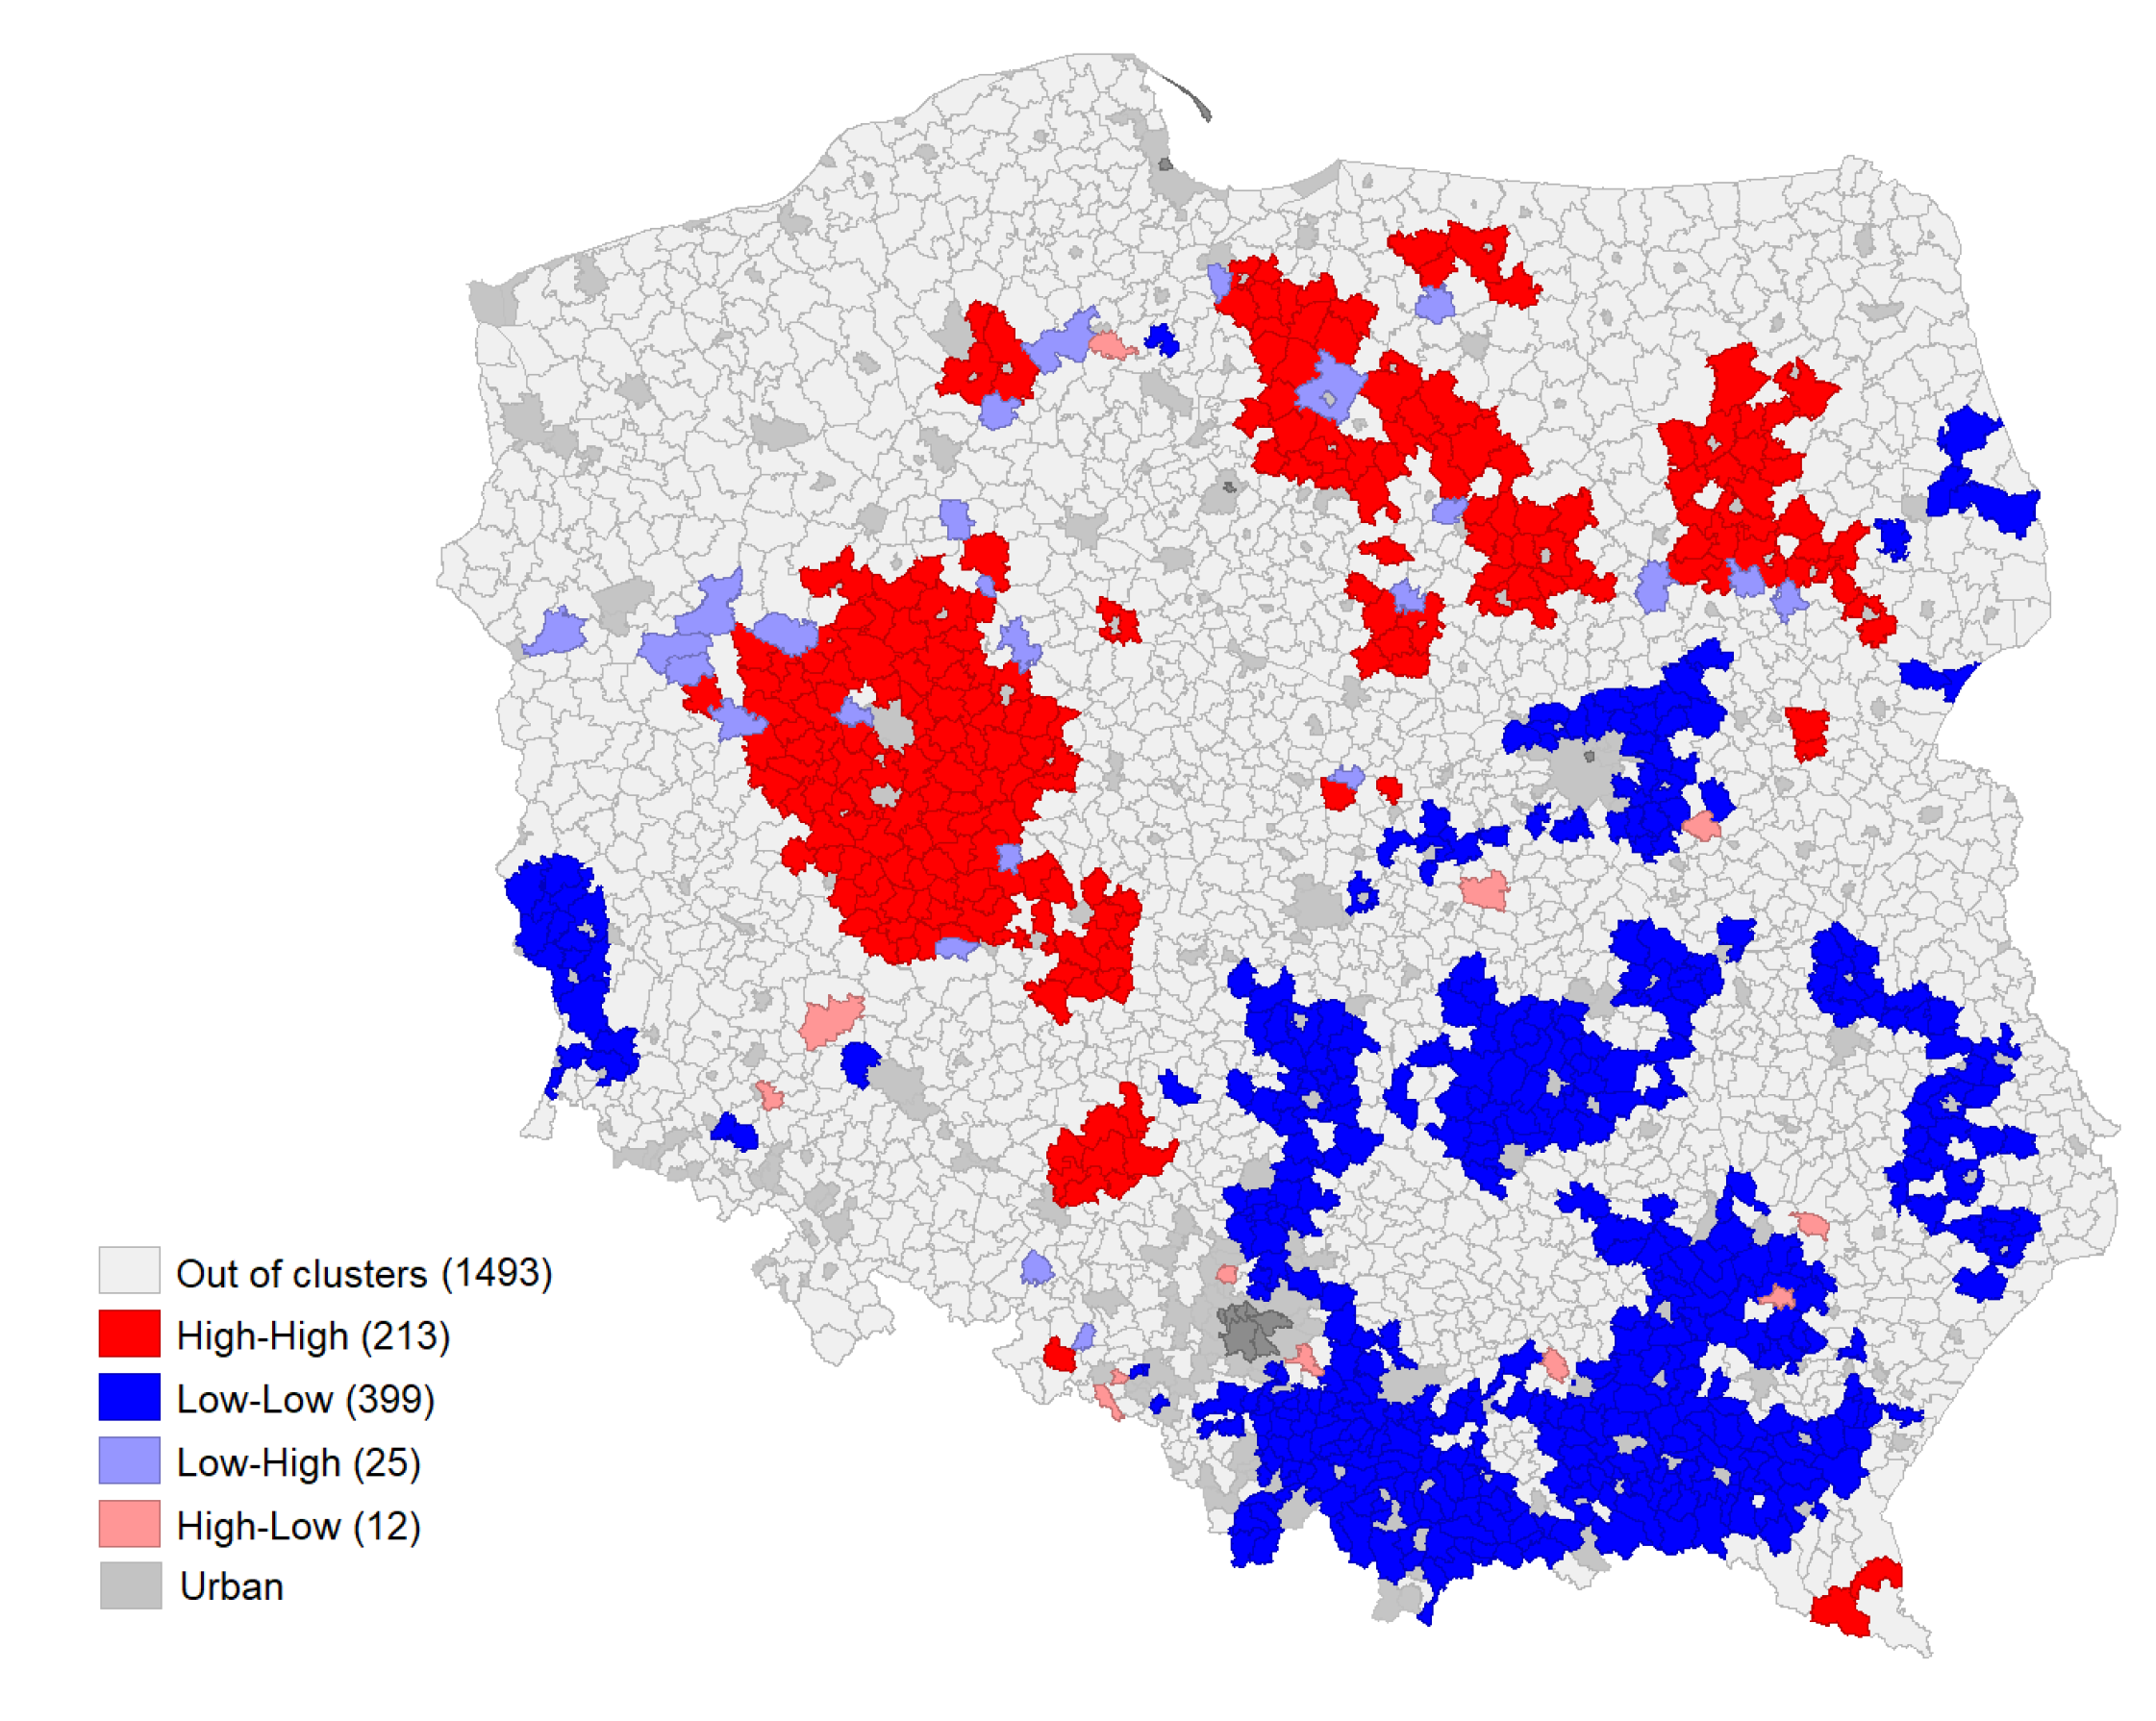
Figure 1 presents the location of the clusters identified.
Slightly more than 30% of the municipalities covered by this analysis were allocated to clusters, including 213 (9.9%) to the cluster exhibiting a high frequency of applying for the measure ‘diversification into non-agricultural activities’ (High-High), and 399 (18.6%) to the cluster with a frequency below the national average (Low-Low). Outliers represented only approximately 2% of municipalities, including 25 which had below-average application frequencies for diversification funds, but were adjacent to municipalities at higher levels (Low-High outliers). Only 12 municipalities exhibited much higher frequency coefficients than the surrounding units (High-Low outliers). The out-of-cluster group was composed of municipalities at medium levels of the coefficient.
The largest cluster of municipalities demonstrating high frequency coefficients is located in the central-west part of Poland. This part of the country is home to 12 out of 25 Low-High outliers. Other High-High clusters are mostly found in the north-east of Poland, which is also the location of 10 Low-High outliers. The clusters with below-average frequency coefficients (Low-Low) are mostly located in the south-east of Poland. This part of the country also has 9 out of 12 High-Low outliers.
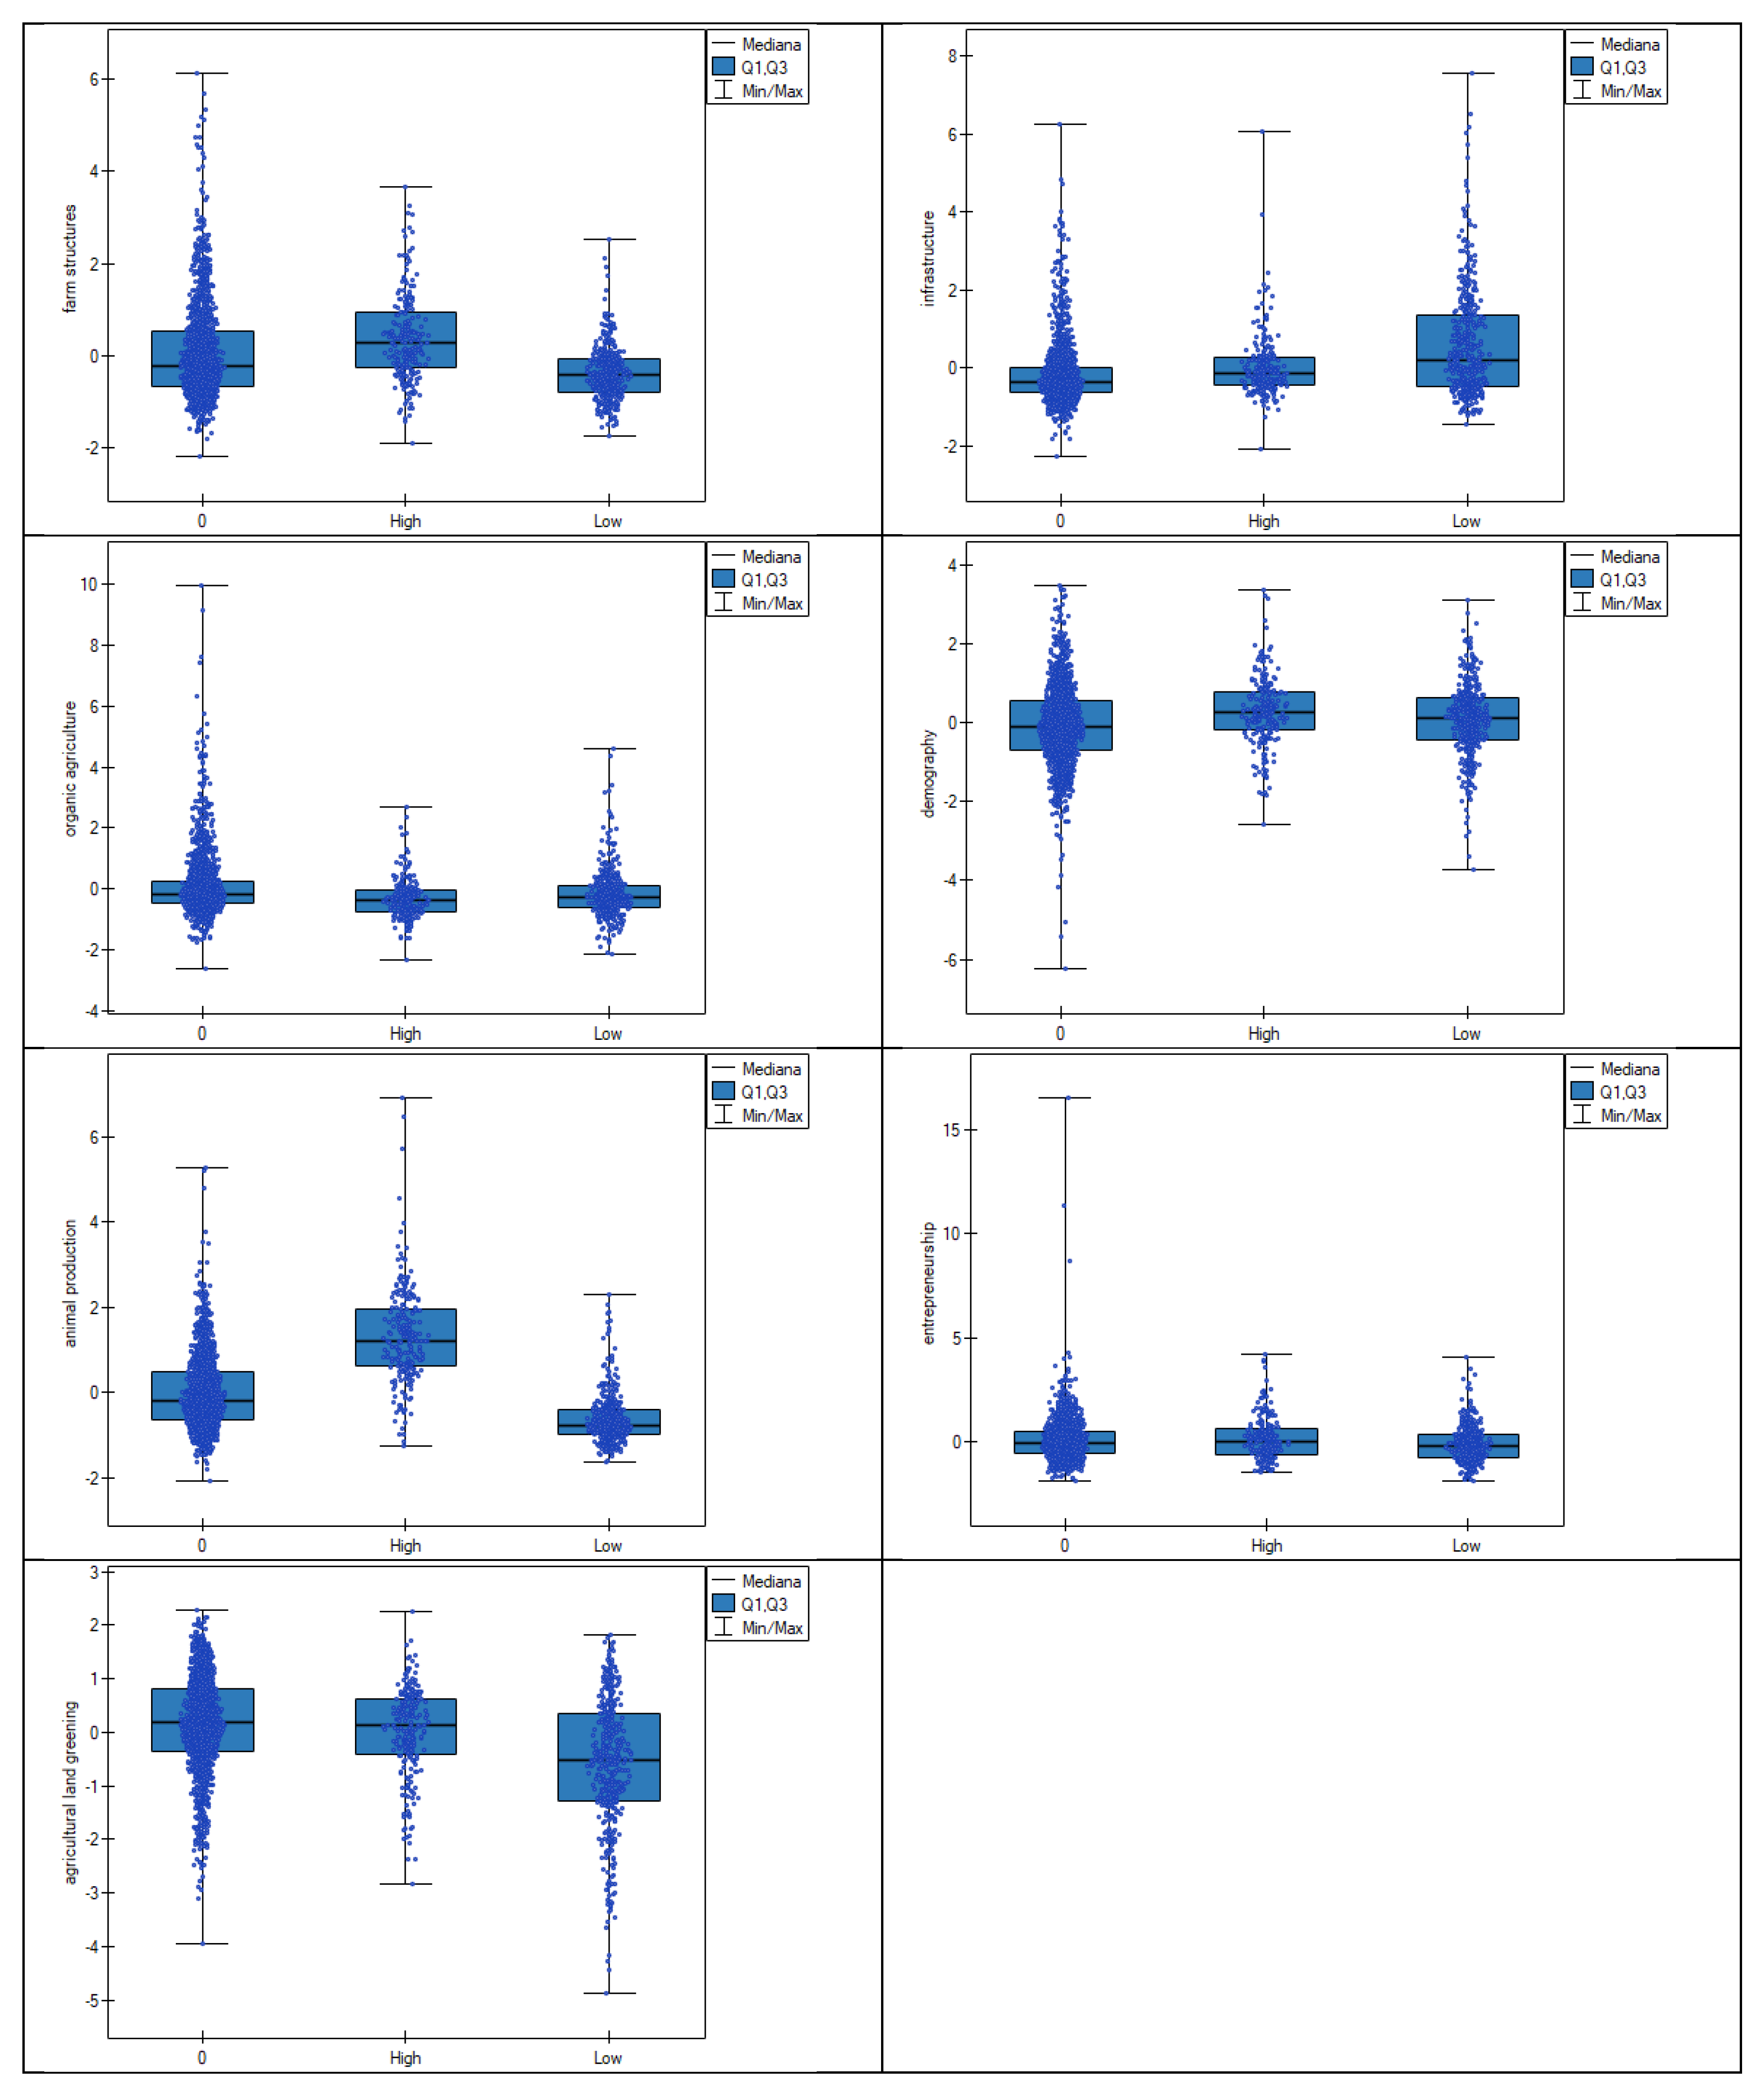
Table 3 presents the factor scores characteristic of municipality groups at the above-average application frequency for the diversification measure (the HH cluster and HL outliers), and of municipalities at levels below the national average (the LL cluster and LH outliers). The results demonstrate that factor scores significantly differed between the municipality groups covered by the analysis.
Figure 2 provides visualization of the factor scores for the municipality groups covered.
The Kruskall–Wallis test yielded statistically significant results for all factor scores (at p < 0.0001). The results of the Dunn–Bonferroni post-hoc test show that all of the groups identified statistically significantly differ from each other in five factors: farm structures, infrastructure, organic agriculture, animal production, and demography.
The highest values of the factor representing farm structures were recorded in members of the High group (median score 0.28, upper quartile 0.95). The lowest values of that factor were found in members of the Low group (median -0.42, upper quartile -0.08). The variables covered by that factor (variables are listed in the method’s description) relate to the quality of agrarian structure. Therefore, the findings suggest that the measure ‘diversification into non-agricultural activities’ was statistically more frequently applied by farmers in municipalities with more favorable structural conditions for farming such as larger average farm area, a larger average sown area, a greater share of industrial crops, and production performance.
Similar conclusions can be drawn when comparing the animal production factor. In this case, the highest factor score was found in the High group (with a median of 1.2), whereas the lowest levels were recorded in members of the Low group (a median of −0.77). The above suggests that regions with a high coefficient of frequency of applying for the measure ‘diversification into non-agricultural activities’ exhibited a relatively good level of animal production compared to the rest of the country. Compared to other groups, municipalities of the High group also exhibited higher levels of the demography factor which reflects an above-average demographic structure.
Conversely, the infrastructure indicators reached higher levels in the Low group (municipalities with lower coefficients of frequency of applying for diversification funds) than in other territories. This indicator reflects the level of technical infrastructure (gas supply network and sewage network density) and social infrastructure (density of schools, etc.) in rural areas. High values of the indicator are recorded in municipalities with relatively high population density, which are primarily situated in the southern part of Poland.
In the High group, the organic production indicator was significantly lower compared to other groups. The analysis suggests that the High and Low groups significantly differ in the level of agricultural land greening as well. That indicator is lower in municipalities with a lower frequency of applying for the measure ‘diversification into non-agricultural activities’ than in the other two groups of municipalities covered by this analysis. Another difference between the High and Low group was in the entrepreneurship indicator, with higher levels being recorded in the High group compared to the Low group.
The identification of municipality groups at high and low levels of the application frequency for the diversification measure also enabled us to assess the impact of farms’ proximity to urban areas on their likelihood to diversify the activities in Poland. To do this, the share of rural and rural-urban municipalities was compared between the High, Low, and out-of-cluster groups (
Figure 3). These results show that in the High group, residents of rural-urban municipalities applied for the diversification measure significantly more often compared to other municipality groups (the share of rural-urban municipalities is 37% in the High group and 25% in the Low group).
4. Discussion
The ‘diversification into non-agricultural activities’ is a measure implemented to pursue the 3rd goal of the 2007–2013 RDP which was to ‘improve the quality of living in rural areas and to diversify the rural economy.’ Measures under the 3rd goal of the 2007–2013 RDP (Axis 3) contribute to the rural development through economic and social impact, both as a result of the ‘diversification into non-agricultural activities’ and the ‘establishment and development of micro-enterprises’. Those activities are expected to be supplementary as they provide new jobs and new possibilities to obtain income in rural areas [
9]. However, the main difference between them concerns a definition of beneficiaries. ‘Diversification into non-agricultural activities’ is designated to farmers or a household member of such a farmer, while ‘establishment and development of micro-enterprises’ to any natural person, legal person or organizational unit without legal personality. In this paper only ‘diversification into non-agricultural activities’ is analyzed. In accordance with the 2007–2013 RDP, that measure was taken to establish non-agricultural revenue streams and promote rural employment outside agriculture. It was supposed to create conditions for a sustainable socioeconomic rural development and for maintaining rural viability. Another assumption was that the diversification measure would also indirectly affect the farming population’s ability to seek employment in other sectors of the economy and, as a consequence, would create conditions for the internal transformation of the agricultural sector [
9].
The application for funds available under the diversification measure is voluntary. Therefore, one of the prerequisites for the attainment of the defined goals is the farmers’ interest in participating in the program. Current research on rural population interest in the CAP development programs [
45,
46,
47,
48] reveals that socioeconomic and structural characteristics affect the capacity of individual areas to attract the funds. [
49,
50,
51,
52] found spatial context to be of considerable significance to the overall rural entrepreneurial process. However, as emphasized by [
6] there is still a lack of empirical data at regional level in relation to farmers’ decision regarding the adoption of diversification activities affected by CAP. In particular, there is limited evidence of a link between the spatial characteristics of land where the farms are based and diversification activities in different EU countries. This paper investigates the spatial determinants of farm diversification in Poland by identifying areas (municipality clusters) with a significantly higher or significantly lower frequency of applying for the ‘diversification into non-agricultural activities,’ and by defining their characteristics.
The presented results provide three main insights into a discussion on diversification determinates. First, the extraction of municipality clusters exhibiting statistically different frequencies of applying for the diversification shows a clear concentration of farmers’ interest in diversifying in certain regions. The distinct clusters of municipalities which report an above-average frequency of applying for the diversification are mostly located in the central-western and north-eastern part of Poland. Findings from the comparison of municipality groups established in this paper suggest that these areas demonstrate above-average levels of agrarian structures development, animal production, demographic indicators, and natural conditions for agricultural development. Also, these territories had above-average indicators of entrepreneurship.
These findings are consistent with the results of studies on regional differences in Poland [
53,
54] which show that the central-western and north-eastern parts of Poland have a good agrarian structure and a high level of agricultural development compared to the rest of the country. These are regions with an above-average farm size, and a high assets-to-labor ratio. Moreover, compared to the rest of the country, these regions exhibit high levels of: investment expenditure, intermediate consumption (covering purchases made by farmers for raw and auxiliary materials that are used as inputs for crop an animal production; it also includes expenditure on veterinary services, repairs and maintenance, and other services) per hectare of agricultural, and average herd size.
These results are also in line with what was found by [
2,
5,
6,
30,
31], who demonstrated that larger farms are more likely to diversify their activity. The farm structure factor (which is higher in municipalities with above-average indicators of applying for diversification funds) includes farm area and the share of farms with an area of over 15 ha. Hence, it can be concluded that in Poland, too, larger and economically stronger farms apply for diversification funds more often than their weaker peers. Note, however, that when considered on an EU-wide basis, farm size is a relative term, and therefore the conclusions formed by the analysis can only be limited to a defined territory. In Poland, the average farm area is relatively small compared to the EU, and is 11 ha. For a detailed characteristic of the Polish agriculture, consider [
54]. This can be partly explained by the fact that smaller and economically weaker farms, might be reluctant to apply for the diversification as it requires co-financing. These findings are somewhat corroborated by the mix of investment types implemented under the diversification measure. According to the report by the Agency for Restructuring and Modernization of Agriculture, 69.5% of projects were investments related to “services for agriculture and forestry” [
55]. Most of these investments were implemented by owners of large farms with extensive resources of machinery who offered farming equipment to other farmers. The share of the other 11 types of investment projects eligible under the measure ‘diversification into non-agricultural activities’ was very low. For instance, tourism services accounted for only 7% of the projects, while the share of handicraft and processing of agricultural products was only 1.1% and 0.4%, respectively, of the total number of projects.
It is worth noticing that the types of diversification activities applied by farmers varied regionally. Overall, in regions of good agrarian structure (the central-western and north-eastern parts of Poland) a higher share of ‘services for agriculture and forestry’ was recorded. Similarly, in regions with fragmented agrarian structure (the south-eastern part of the country) projects involving small services for the population prevailed. Tourism and related activities have been implemented primarily in areas defined as traditional places of rest, such as mountains, the Baltic Sea and lake areas. Projects for processing agricultural or forestry products were implemented mainly in central and north-eastern parts of Poland, but do not follow a clear clustering pattern [
56]. These results suggest that there is a link between the economic size and a type of diversification. It shows that in Poland larger farms tend to gain additional income mostly by offering farming equipment to other farmers, while smaller farms exhibit other forms of diversification classified both as ‘broadening’ and ‘deepening’ activities.
Moreover, the relatively high demographic indicator in municipalities of the High cluster supports the relationship between the diversification of agricultural activities and farmers’ age, as demonstrated by [
22,
31,
32]. Indeed, in Poland, that measure was applied far more often by farmers based in municipalities which had a more favorable demographic structure.
Clusters with low frequency coefficients include 19% of Polish municipalities, mostly located in the south-eastern part of the country. The analysis of characteristics of the municipalities at below-average application frequency for the diversification measure demonstrated that these are areas have below-average agrarian structures, lower indicators of animal production, and less favorable conditions for agricultural development. Local entrepreneurship indicators are lower as well. Findings from research on territorial disparities in rural and agricultural development in Poland [
39,
53,
57] suggest that, when compared to the rest of the country, the south-east region is affected by extreme fragmentation of farmland and a defective agrarian structure. Also, it reports below-average levels of intermediate consumption, investment expenditure, and ratio of assets to farming labor. These are relatively technologically underdeveloped regions which are home to poorly efficient economic operators, and will increasingly feel the production and economic gap separating them from regions with a much better agrarian structure [
57].
The presented results seem not to be consistent with the program’s expectations. The existence and characteristics of clusters suggest that the policy toward diversification in Poland favors areas of better developed agriculture. In the poorer regions affected by structural disadvantages where diversification is most needed, the program’s performance has been only modest. Such a geographic structure of farmers’ willingness to participate in the program seems to be disadvantageous from the perspective of the overarching objective of the EU’s structural policy focusing on rural areas, which is to strengthen the territorial and social cohesion of rural areas.
Second, the results of a comparison of the share of rural and rural-urban municipalities between the High, Low and out-of-cluster groups suggest that in Poland, proximity to urban areas is a favorable factor associated with higher rates of applications for farm diversification funds. Further studies will be needed to address the question whether these results can be driven by ‘pull’ motives of diversification, as suggested by [
27], or other determinants motivating owners of already existing farms, such as urban demand for rural goods and services, or being an attractive tourist destination.
Third, the results of this study allowed for identification of the outlying municipalities. Low-High outliers were municipalities which, despite favorable development conditions and territorial proximity of municipalities of the High cluster, recorded below-average levels of activity in applying for the measure concerned. Conversely, High-Low outliers were municipalities which, despite a difficult structural situation and proximity of the Low cluster, demonstrated outstanding performance in applying for the measure. The existence of the outliers means that, despite the determinants of applying for diversification funds specified in this paper (such as the agricultural and rural development level), the applicants may be driven by a series of other conditions. This provides room for further detailed analysis of specific factors that affect the application for diversification funds in the outlying municipalities identified in this study. Such analyses could be particularly useful for Low-High outliers as they could indicate the barriers to applying for funds (other than the structural factors of rural and agricultural development). However, such a study would require extending the research methodology with analyses in the field of sociology and political science. As demonstrated by [
58,
59] factors such as social capital endowment and leadership strength, together with institutional and governance quality might influence entrepreneurship and the contrasting socio-economic performances of neighboring territories.
According to [
55], implementing the measure contributed to the creation of almost 12 thousand permanent jobs in rural areas. Although positive impacts of the introduction of financing for diversification measures can be noticed, these outcomes vary considerably between regions. Moreover, the majority of jobs created were related to additional services for farms and forestry [
55]. This testifies to the poor diversification of employment resulting from actions taken under the program.
The contradictions between the program’s objectives and its implementation, as demonstrated in this paper, have important policy and planning implications. First, the results of this study confirm that rural development programs need to be better aligned with local needs and potentials, as stated earlier in literature by [
6,
45,
60]. A more flexible planning of regional limits for diversification could better adjust the program to the beneficiaries’ needs. Second, to avoid domination of a single diversification activity, some quota should be imposed on specific diversification sub-programs. These limits could also be linked to specific regional or local potentials of rural areas. Moreover, it is important to develop a motivation system to encourage farmers to diversify their activities, including additional financial incentives for farmers based in areas with particularly disadvantageous structural conditions.
Additional insights for a rational implementation of the measure, and thus a more efficient territorial allocation of public payments, could be derived from a thorough analysis of application barriers faced by outliers identified in this study.


