Article

Energy and Environmental Comparison between a Concrete Wall with and without a Living Green Wall: A Case Study in Mexicali, Mexico

by
Angeles Campos-Osorio
1,
Néstor Santillán-Soto
1,*,
O. Rafael García-Cueto
1,
Alejandro A. Lambert-Arista
2 and
Gonzalo Bojórquez-Morales
3
1
Instituto de Ingeniería, Universidad Autónoma de Baja California, Mexicali 21280, Mexico
2
Facultad de Ingeniería, Universidad Autónoma de Baja California, Mexicali 21280, Mexico
3
Facultad de Arquitectura y Diseño, Universidad Autónoma de Baja California, Mexicali 21280, Mexico
*
Author to whom correspondence should be addressed.
Sustainability 2020, 12(13), 5265; https://doi.org/10.3390/su12135265
Submission received: 3 March 2020 / Revised: 26 March 2020 / Accepted: 31 March 2020 / Published: 29 June 2020

Abstract

:
In cities with dry arid climate, air conditioning (AC) equipment is necessary for thermal comfort in indoor spaces. The use of this equipment generates an increase in electricity consumption and an increment in CO₂ emissions to the environment; thus, one way to mitigate these negative effects is the Living Green Wall (LGW). The objective of this research is to assess the decrease in thermal gain, energy benefits, and estimate the greenhouse gas (GHG) emissions that are not emitted by the use of the LGW. Measurements of heat flux, solar radiation, and temperatures were made on a concrete wall and another with an LGW in a west-facing building in the city of Mexicali, Mexico. The results indicate that it is possible to reduce 49% of the heat flow through the wall, which reduces the thermal load 102,212 Btu/h to the indoor space, implying the additional work of 8.53 tons of AC. This excess equals 985.6 kWh of electrical energy and generates a total of 697 kg of CO₂ emissions during the warm season. It is concluded that shading with an LWG becomes a very influential element to mitigate the heat fluxes towards the indoor spaces.

1. Introduction

The absence of green areas in cities and high urbanization as a consequence of population growth induce perturbations in the microclimate of the external spaces resulting in an increase of air temperature [1,2]. Since the 1940s when Balchin [3] introduced the term “Urban Heat Island” (UHI), effects on the atmosphere caused by the increase of air temperature in a city compared to its surroundings have been considered [4]. The low level of vegetation in a city allows the absorption of solar radiation directly by the buildings that do not have architectural or natural elements that prevent this [5], causing an increase of temperature in exposed walls and, therefore, a greater heat transfer toward the interior of the building [6]. The dense mix of buildings in urban complexes causes a significant heat gain due to the characteristics of construction materials, which also affect heat fluxes in cities with important vertical development where it is generated in the urban canyon of the surrounding areas, depending on the external factors (wind, sun, relative humidity, etc.) of the area and building materials [7], mainly on exposed facades to solar radiation. For example, in Hong Kong with a subtropical climate, the surfaces of exposed walls to radiation in summer may have temperatures above 35 °C, while unexposed walls have temperatures of 30 °C [8]. Another study carried out in a semi-arid climate [1] showed walls with average temperatures of 45 °C.
Due to these urban thermal impacts, the intensity of the UHI and its effect on energy consumption depend on multiple parameters, in particular, the type of surfaces, the characteristics of the buildings, anthropogenic activity, as well as the local microclimate [9,10]. The aforementioned effects are intensified in places with arid climate, when the use of air conditioning (AC) equipment becomes necessary to maintain an acceptable level of comfort indoor space; this causes high electricity consumption because there is a direct relationship between electricity consumption and room temperature [11], and therefore an increase in anthropogenic greenhouse gases (GHG) such as CO₂ [12,13]. The commercial and residential sectors have an important role in the energy consumption of buildings, this increases day by day, and the indicators of the International Energy Agency (IEA) range from 20% to 40% in developed countries [14]. At the global level, the energy consumption registered per capita in 2014 was 3127.3 kWh [15]. For Mexico, in 2017, the demand for electricity was 309,727 GWh, showing an increase of 3.7% compared to the previous year [16].
In buildings, the demand for electrical power for use in air conditioning systems is particularly significant because that represents 50% of total energy consumption in countries such as the United States and England [14]. While in Mexico, Secretaría de Energía (Ministry of Energy) [16] reports that during the months from May to October (hot period) the highest levels of electricity consumption are recorded, representing 54.1% of the annual national consumption in 2017, averaging 15,580,260 kWh per month.
In the particular case of Baja California, according to data from the energy profile of Baja California 2010–2020 [17], the city of Mexicali represents only 34% of all users, but its electricity consumption reaches 52.8% of the total State. The Mexicali residential sector has an average annual consumption of 8193 kWh, of which 73% is due to the use of AC [18]. During the hot period (May to October), the average consumption per capita in Mexicali is significantly increased by the use of air conditioning equipment, reaching an average consumption of 998 kWh per month [19], while the others cities in the state present an average of 252 kWh [17]; that is, during the hot season, the rest of the state consumes a quarter of what Mexicali consumes.
Accordingly, the power generation is an important source of carbon dioxide (CO₂), and UHI mitigation strategies should be proposed as a tool to reduce energy consumption in cities and, as a result, reduce global CO₂ emissions [20]. It is noteworthy that in Mexico, the residential and commercial sectors reported emissions of 25,639.35 Gg of CO₂e in 2013, contributing to 3.9% of total emissions [21]. For the year 2006, it was estimated that CO₂ emissions by fuel/electricity related to the residential use of air conditioning or cooling energy consumption, was 5500 Gg of CO₂e [22], for 2010 this increased to 18,692.3 Gg CO₂e [23].
One way to mitigate the above-mentioned effects is green areas within the urban mosaic, but the proportion of these are different in each city, depending mainly on urban use and climate type [24]. While there are insulation systems that delay the heat gain into the indoor spaces, through materials that increase the mass of the wall, on critical summer days they are insufficient. So, the use of passive systems such as the Living Green Wall (LGW) can help existing thermal insulation systems to maintain thermal comfort in buildings [25]. In relation to the above, The World Health Organization (WHO) recommends 9 m² green areas cover per person [26]. In Mexico, only Mexico City complies with the WHO proposal with 15.10 m², while the rest of the cities are below 5% of urban area destined for green areas [27]. In Mexicali, the proportion of green areas is 2.01% [28], so the amount of green area is 2.94 m² per person [29].
Some studies in cities with a Mediterranean climate (Brighton, England [30]; Genoa, Italy [31]; La Salta, Argentina [32]), documented decrements in the surface temperatures using a LGW, which has been used over time as a passive method for cooling buildings, providing economic, environmental and ecological benefits that facilitate the reduction of the UHI effect in urban areas, improve air quality, and contribute to energy savings [33]. In addition, the LGW can be used for urban rehabilitation because they contribute to the insertion of vegetation into the urban context without requiring additional space [34]. For these purposes, it is necessary to know the types of LGWs, which are classified into two major groups: green facades and LGW. The green facades have foliage of vegetation that covers the entire surface of the wall (species of more than 2 m in their adult life), without additional support elements. While LGWs use containers of different types of materials and require an additional support structure system on the wall, in addition to placing only small vegetation (less than 60 cm in their adult life) [35].
This paper aims to evaluate the decrease in thermal gain of a concrete wall by using an LGW in a west-facing building in the dry arid climate of the city of Mexicali, calculate the energy benefits on AC equipment, and estimate greenhouse gas (GHG) emissions that would cease to be emitted due to the use of a LGW.

2. Materials and Methods

2.1. Study Area and Urban Characteristics

The study was conducted in the city of Mexicali, Mexico, which is located at latitude 32°33′04″ north, longitude 115°04′08″ west, and an altitude of 4 meters above sea level; its climate type BW(h′)hs(x′)(e′), indicates that the city of Mexicali has a dry, very arid climate, with a rainy winter and an annual oscillation of very extreme average monthly temperatures [36]. It has an average annual temperature of 22.4 °C, June to September with average temperatures above 33.1 °C, and a maximum average of 42.2 °C; the coldest month corresponds to January with a monthly average of 12.4 °C [7]. The highest temperature recorded in Mexicali, occurred on 28 July 1995, with a value of 52.0 °C, and the lowest on 13 January 1963, with a value of −7.0 °C.
The experiment site is located within the Central Mexicali Campus of the UABC (Universidad Autónoma de Baja California). Its surroundings are mostly covered by soils with concrete and asphalt, the buildings are stone materials and there is a continuous flow of vehicles as it is inside a parking lot and adjacent to a street with constant flow of automobiles.
The mentioned conditions and the climatic characteristics of the city hinder the growth of vegetation, so for the experiment we used Bugambillea (Bugambilia brasiliensis): a deciduous climbing shrub; of medium height; from Brazil; of ovate lanceolate leaves arranged alternately; that develops small thorns; greatly resists soils; and requires little consumption of water [37].

2.2. Experimental Design

A concrete wall without insulation was selected at a west orientation with an area of 38 m². The selection of this orientation is due to the fact that its exposure to direct solar radiation is presented from 12:00 to 19:00 h. A module made of wood (2 m high by 2.40 m long with a width of 0.80 m) was placed and in its interior Bugambillea (LGW) were planted. On the same wall, with a lateral separation of one meter an area of 1 m2 without LGW was selected as a concrete wall (CW as the witness wall or exposed wall) for comparison. In this area, surface sensors were placed as shown in Figure 1.
Through thermocouples, sensors of heat flux and temperature were placed behind the shade of the foliage at a height of 1 to 1.5 m for LGW and at a height of 1.5 for CW, with net radiometers at 1.5 m (vertical orientation to the west); then measurements were carried out (Table 1). Data for every ten minutes were averaged to obtain hourly data. In addition, reference data from a meteorological station (air temperature and solar radiation) were available located on the roof of the Engineering Institute of the UABC at a distance of approximately 400 m from the experimental site; the sensors of this station are located at a height of 20 m from floor level.
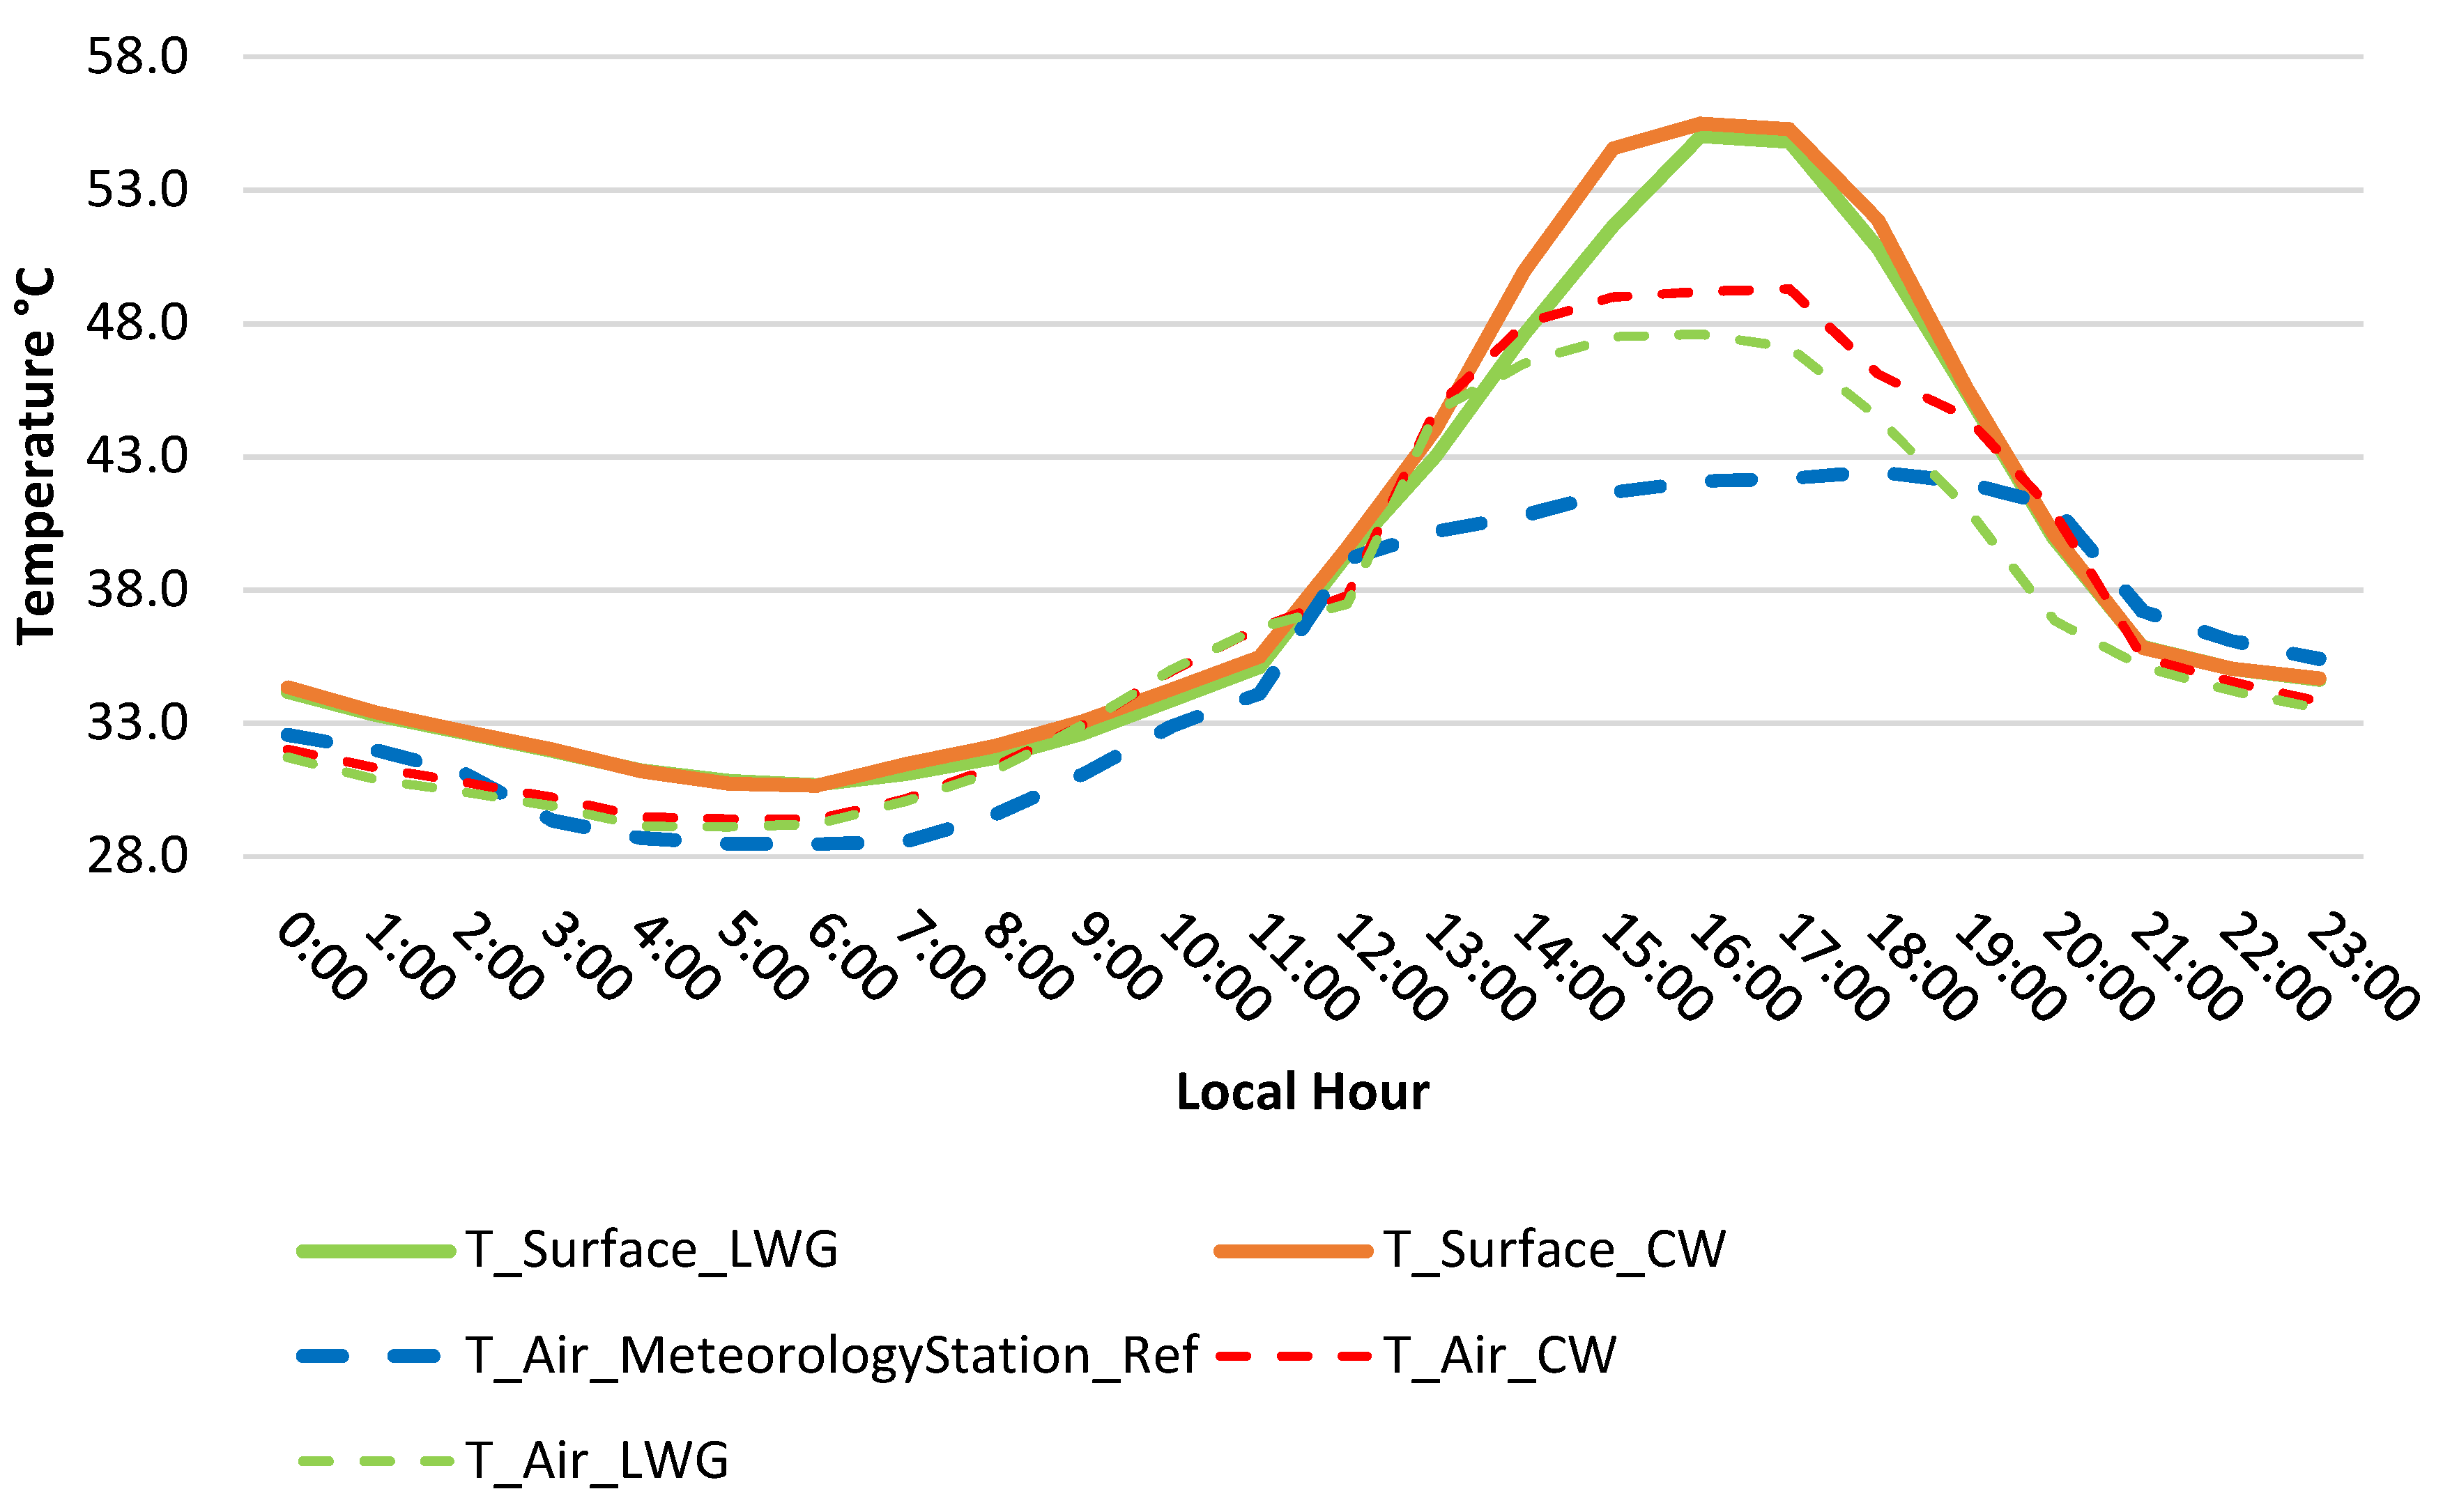
For this case study, the heat flux density is assumed unidirectional, because the heat transfer is given in the direction of the temperature differential, where the indoor space has a controlled air temperature (approximately 25 °C), always less than any outside air temperature close to the wall (36 °C at 11:00 am to 47 °C at 16:00 minimum and maximum temperature, respectively; Figure 2), so the heat flux is given inwards and the effect of borders is neglected for practical purposes. With respect to the growth of the LGW, sufficient shading was achieved to contrast with the concrete wall (CW). Thus assuming and projecting, total coverage of the wall was obtained as was the difference in the hourly flux between the CW and LGW (multiplying by 38 m² which is the total area of the wall); later this result was multiplied by the conversion factor to obtain the data in Btu/h (1 kW = 3412.142 Btu/h). The results, already converted to Btu/h, were divided between 12,000 (12,000 Btu/hr = 1 t AC) to obtain the AC ton needed to remove the excess thermal load. In this way, the additional electricity consumption was obtained from the ratio of 1 t AC = 1.446 kW of electrical energy, applicable for an extreme arid climate [38]. Each hourly result was then added up to obtain the additional quantity of AC tons needed to remove that surplus within a period of 6 h. Considering that the warm season is 4 months, the consumption obtained was multiplied by 80 days (office days).
For comparative purposes, the cumulative electricity consumption was introduced into the Environmental Protection Agency (EPA) Greenhouse Gas Equivalencies Calculator [39] and the CO₂ emission results and some comparative equivalents were obtained. The measurement campaign was from 21 to 23 July 2018. These days were selected because they presented particularly extreme weather and sky conditions such as a clear sky, shortwave radiation values up to 900 W/m2, and a wind value below 2 m/s (in order to neglect the advective and convective effects).

3. Results and Discussion

According to the data, the maximum air temperature recorded by the meteorology station reference was 45.9 °C, which was presented on 23 July at 18:00 h. At the experimental site, a maximum air temperature of 53.0 °C was recorded the same day and time, while the maximum surface temperature detected by thermocouples on the exposed concrete wall was 61.0 °C at 17:00 h. The highest global radiation value (meteorology station reference) was presented at 13:00 h with an intensity of 996.0 W/m², while in the vertical component (radiometer oriented vertically to the west in situ) the maximum intensity was 738.2 W/m² at 16:00 h.
The behavior of surface temperatures (continuous lines) and on-site air (dashed lines) is presented in Figure 2. The model is distinguished with the Bugambillea in green tones, concrete wall (CW) in red tones, and finally the air temperature of the meteorology station reference in blue tones.
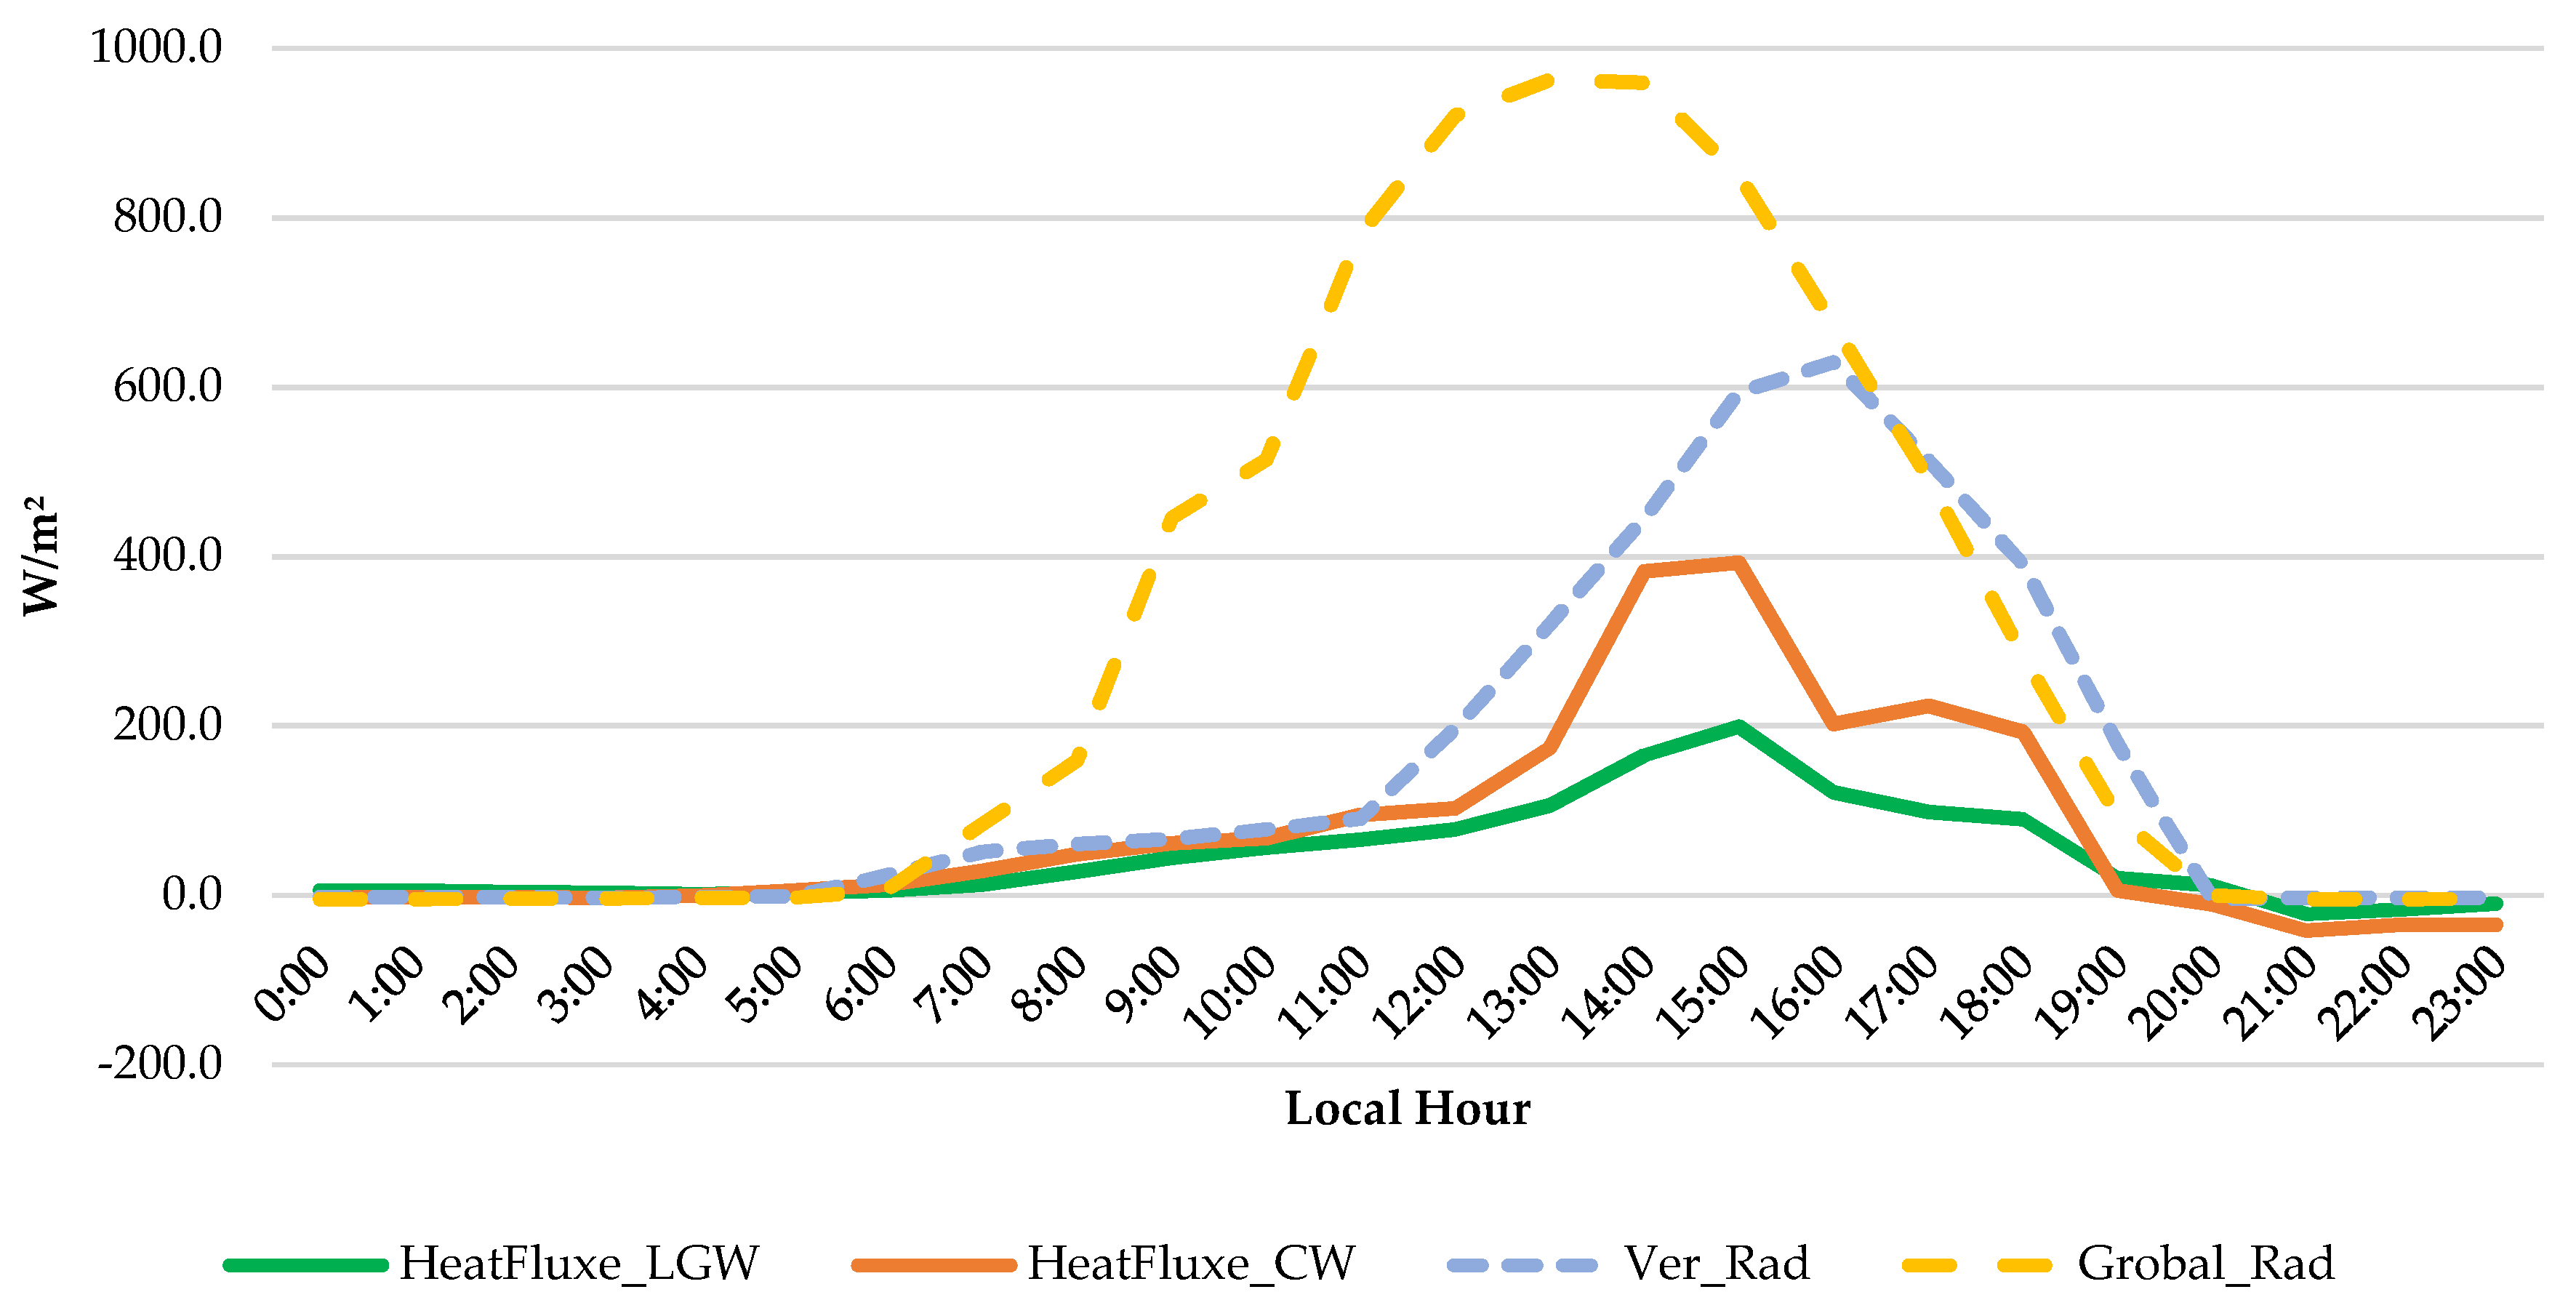
Figure 3 shows the comparison between the heat fluxes (continuous lines), where HeatFluxe_LGW is indicated in green, HeatFluxe_CW in red, global radiation (Global_Rad, yellow dashed line) recorded at the meteorology station and the vertical radiation recorded at experimental site (Ver_Rad, blue dashed line).
As expected, the air temperature magnitudes of the reference station presented a marked difference from the experimental site, because it is made up of materials such as concrete, asphalt, and faces a significant vehicular flow, which promotes an increase in air temperature of up to 6.1 °C, as shown in Table 2.

Heat Flux and GHG Emissions

In Table 3 it can be observed that the intensity of vertical solar radiation (Ver_Rad) on the west wall is higher in the afternoon than the global radiation (Global_Rad) recorded at the meteorology station reference. In the hours analyzed the intensity ratio increases in the vertical component as the time of recording advances, impacting this shortwave energy on both surfaces of the CW and LGW. This happens because the sensor captures the incident solar radiation perpendicular to its surface, for this reason, greater magnitudes are registered in the sensor with vertical orientation as the afternoon progresses. Also shown are the differences in heat fluxes between the CW and LGW, whereby converting the thermal load from kW/m² to Btu/h and multiplying by the total area of the wall of 38 m² ((CW-LGW)*(Area)) represents the additional heat that would drive through the wall without a LGW and add a thermal surplus to the AC equipment. Subsequently, the necessary tons and the amount of kWh involved in offsetting this additional load are then shown. Finally, the total GHG and equivalent are obtained with the accumulated electric energy (Table 4).
Considering that the hot period is four months, we assumed these results for a total of 80 office days, resulting in 985.6 kWh (12.32 kWh × 80 days = 985.6 kWh), as shown in Table 3. Total emissions and some equivalents are presented in Table 4 [39]. These indicators allowed us to magnify and compare the excess consumption with typical elements or daily circumstances that impact and guide the consciences of the citizens towards sustainability.
The difference in heat fluxes between the CW and LGW is equivalent to 49% of heat not being transferred through the wall (0.779/1.568 = 0.49; Table 3), which implies that it becomes an electric energy saving of approximately 985.6 kWh, which means 697 kg of CO₂ can be avoided. For practical purposes Table 4 provides examples from the Environmental Protection Agency of GHG equivalencies: 12.2% of a house’s annual electricity consumption; 296.77 liters (78.4 gallons) of gasoline consumed; 28.5 cylinders (capacity of each cylinder 18 lbs = 8.16 kg) of propane gas [39]. Thus, with the implementation of an LGW, a fraction of the energy is transformed into latent heat, by means of the leaves and the air channel that is formed between the building and the LGW, where the most important effect to reduce heat gain on walls surface is shading [30,32,40]. In coincidence and in accordance with the results obtained, it is possible to reduce the energy demand derived from the use of air conditioning by a range of 40%–60% [31,41,42], not only in Mediterranean climates, but also in arid climates where the urban environment hinders the growth of plants especially if they do not have some architectural shading element to protect them in the hours of greater sun exposure; as happened in this case study and in coincidence with what was observed by Riley [43] in a building in Osaka, Japan, in an LGW system plants that are protected under the shade of some architectural element are subjected to less stress, which facilitates their growth and hence their maintenance.

4. Conclusions

Exposure of walls to direct solar radiation is the most important factor in the gain of thermal energy on exposed walls, so shading with an LGW becomes a very influential element to mitigate the heat fluxes into indoors.
In summary, for the study carried out in the city of Mexicali, implementing an LGW with a climbing shrub-like plant, it is possible to reduce 49% of the heat fluxes through a concrete wall without insulation, at a west orientation and during the hours of greatest exposure (13:00 to 18:00), which reduces the thermal load 102,212 Btu/h to the indoor space and represents the additional work of 8.53 tons of AC, during the hot period. If this flux is not counteracted, the effects on the environment can be quantified since the extra performance of AC equipment causes 697 kg of CO₂ to be emitted into the atmosphere. The use of vegetation for this case study not only saves energy and protects the environment, but also contributes to the aesthetic improvement of the site, which generates a more desirable landscape for urbanization. It is important to mention that the selection of vegetation must be suitable for climate type and the orientation of the surface to be covered.
One of the limitations of this research was slow growth of the plant species Bugambilia brasiliensis, due to the extreme temperature and solar radiation conditions recorded at the experimental site as a result of the surrounding urban characteristics. It is therefore necessary to continue the research by combining natural shading with architectural elements (other species and artificial foliage), in order to achieve a greater coverage of vegetation on the wall and to mitigate the thermal flux towards the interior.

Author Contributions

Conceptualization, N.S.-S.; methodology, A.C.-O., N.S.-S., and O.R.G.-C.; formal analysis, N.S.-S., O.R.G.-C., and A.A.L.-A.; investigation, A.C.-O. and N.S.-S.; resources, N.S.-S., O.R.G.-C., and G.B.-M.; data curation, A.C.-O.; writing—original draft preparation, A.C.-O. and N.S.-S.; writing—review and editing, N.S.-S., O.R.G.-C., and A.A.L.-A.; visualization, N.S.-S., O.R.G.-C., and A.A.L.-A.; supervision, N.S.-S., O.R.G.-C., and A.A.L.-A.; project administration, N.S.-S. All authors have read and agreed to the published version of the manuscript.

Funding

This research received no external funding.

Acknowledgments

The authors are grateful to the Engineering Institute of Autonomous University of Baja California for the support given to conduct this project and to the National Council of Science and Technology (CONACYT) for financial support for Angeles Campos Osorio. We also like to thank engineer Michelle Bogush for her review of the English language and style.

Conflicts of Interest

The authors declare no conflicts of interest.

References

  1. Victorero, F.; Vera, S.; Bustamante, W.; Tori, F.; Bonilla, C.; Gironás, J.; Rojas, V. Experimental Study of the Thermal Performance of Living Walls under Semiarid Climatic Conditions. Energy Procedia 2015, 78, 3416–3421. [Google Scholar] [CrossRef] [Green Version]
  2. Yang, F.; Yuan, F.; Qian, F.; Zhuang, Z.; Yao, J. Summertime thermal and energy performance of a double-skin green facade: A case study in Shanghai. Sustain. Cities Soc. 2018, 39, 43–51. [Google Scholar] [CrossRef]
  3. Balchin, W.G.V.; Pye, N. A micro-climatological investigation of bath and the surrounding district. Q. J. R. Meteorol. Soc. 1947, 73, 297–323. [Google Scholar] [CrossRef]
  4. Stewart, I.D.; Oke, T.R. Local Climate Zones for Urban Temperature Studies. Bull. Am. Meteorol. Soc. 2012, 93, 1879–1900. [Google Scholar] [CrossRef]
  5. Vox, G.; Blanco, I.; Schettini, E. Green façades to control wall surface temperature in buildings. Build. Environ. 2018, 129, 154–166. [Google Scholar] [CrossRef]
  6. Haggag, M.; Hassan, A.; Elmasry, S. Experimental study on reduced heat gain through green façades in a high heat load climate. Energy Build. 2014, 82, 668–674. [Google Scholar] [CrossRef]
  7. Djedjig, R.; Bozonnet, E.; Belarbi, R. Modeling green wall interactions with street canyons for building energy simulation in urban context. Urban Clim. 2016, 16, 75–85. [Google Scholar] [CrossRef]
  8. Wong, I.; Baldwin, A.N. Investigating the potential of applying vertical green walls to high-rise residential buildings for energy-saving in sub-tropical region. Build. Environ. 2016, 97, 34–39. [Google Scholar] [CrossRef]
  9. Kolokotroni, M.; Ren, X.; Davies, M.; Mavrogianni, A. London’s urban heat island: Impact on current and future energy consumption in office buildings. Energy Build. 2012, 47, 302–311. [Google Scholar] [CrossRef] [Green Version]
  10. García-Cueto, R.; Jauregui-Ostos, E.; Toudert, D.; Tejeda-Martínez, A. Detection of urban heat island in Mexicali, B.C. Mexico and its relationship with land use. Atmósfera 2007, 20, 111–131. [Google Scholar]
  11. Romero, R.A. Vivienda y Consumo de Energía Eléctrica en Zonas Áridas: El caso Mexicali, 1st ed.; Universidad Autónoma de Baja California: Mexicali, México, 2011; p. 141. ISBN 978-607-607-033-8. [Google Scholar]
  12. Santillán-Soto, N.; García-Cueto, R.; Peñuelas-García, G.; López-Velázquez, J.E.; Ojeda-Benitez, S.; Velázquez-Limón, N.; Cruz-Sotelo, S. Análisis comparativo de emisiones de CO2 y su impacto económico en dos complejos habitacionales de Mexicali, México. In Clima, Sociedad, Riesgos y OrdenaciÓn del Territorio; Universidad de Alicante Servicio de Publicaciones: Alicante, España, 2016; pp. 613–622. [Google Scholar]
  13. Santillán-Soto, N.; Cueto, O.R.G.; Lambert, A.; Ojeda-Benitez, S.; Cruz-Sotelo, S.E. Comparative Analysis of Two Urban Microclimates: Energy Consumption and Greenhouse Gas Emissions. Sustainability 2019, 11, 2045. [Google Scholar] [CrossRef] [Green Version]
  14. Perez-Lombard, L.; Ortiz, J.; Pout, C. A review on buildings energy consumption information. Energy Build. 2008, 40, 394–398. [Google Scholar] [CrossRef]
  15. Banco Mundial BM. Consumo de Energía Eléctrica per Cápita. Available online: https://datos.bancomundial.org/indicador/EG.USE.ELEC.KH.PC (accessed on 8 June 2018).
  16. Programa de Desarrollo del Sistema Eléctrico Nacional PRODESEN 2018–2032. Secretaría de Energía. pp. 51-60. Available online: https://www.gob.mx/cms/uploads/attachment/file/331770/PRODESEN-2018-2032-definitiva.pdf (accessed on 4 May 2019).
  17. COPLADE. Programa Especial de Energía 2015–2019. Available online: http://www.copladebc.gob.mx/programas/especiales/Programa%20Especial%20de%20Energia.pdf (accessed on 13 February 2019).
  18. Suástegui, J.; Perez, C.; Campbell, H.; Magaña, H. Prospectiva del programa de ahorro sistemático integral en Mexicali, Baja California, México. Ingeniería mecánica, tecnológica y desarrollo 2013, 4, 129–134. [Google Scholar]
  19. Suástegui, J.A. Evaluación del impacto en el consumo eléctrico del programa de ahorro sistemático integral en Mexicali, Baja California. In Tesis de Doctorado en Ingeniería; Universidad Autónoma de Baja California: Mexicali, México, 2020. [Google Scholar]
  20. Kikegawa, Y.; Genchi, Y.; Kondo, H.; Hanaki, K. Impacts of city-block-scale countermeasures against urban heat-island phenomena upon a building’s energy-consumption for air-conditioning. Appl. Energy 2006, 83, 649–668. [Google Scholar] [CrossRef]
  21. SEMARNAT. First Biennial Update Report to the United Nation Framework Convention on Climate Change. Available online: https://unfccc.int/files/national_reports/non-annex_i_parties/biennial_update_reports/application/pdf/executive_summary.pdf (accessed on 20 August 2018).
  22. Rosas-Flores, J.A.; Rosas-Flores, D.; Gálvez, D.M. Saturation, energy consumption, CO2 emission and energy efficiency from urban and rural households appliances in Mexico. Energy Build. 2011, 43, 10–18. [Google Scholar] [CrossRef]
  23. SEPRIM. Inventario Nacional de Emisiones de GEI. Available online: https://www.gob.mx/cms/uploads/attachment/file/164241/2a_parte.pdf (accessed on 10 April 2018).
  24. Li, C.; Li, Y.; Zhou, Y.; Shi, Y.; Zhu, X. Investigation of a coupling model of coordination between urbanization and the environment. J. Environ. Manag. 2012, 98, 127–133. [Google Scholar] [CrossRef]
  25. Susorova, I.; Angulo, M.; Bahrami, P.; Stephens, B. A model of vegetated exterior facades for evaluation of wall thermal performance. Build. Environ. 2013, 67, 1–13. [Google Scholar] [CrossRef]
  26. Sorensen, M.; Barzetti, V.; Keipi, K.; Williams, J. Manejo de las Áreas Verdes Urbanas. Documento de Buenas Prácticas 1998. Washington, D.C. No. ENV-109. Available online: http://www.sistemamid.com/panel/uploads/biblioteca/2014-09-28_11-36-58111070.pdf (accessed on 23 July 2018).
  27. Procuraduría Ambiental y de Ordenamiento Territorial PAOT. Available online: http://www.paot.org.mx/contenidos_graficas/delegaciones/detalle.php?id_elemento=11&anio=2016&de_oficio=0&distribucion=3&tema=14 (accessed on 17 November 2019).
  28. IMIP. Programa de Desarrollo Urbano de Centro de Población de Mexicali, PDUCP 2010-2025. Available online: http://www.mexicali.gob.mx/transparencia/administracion/plandesarrollourbano/pducp2025.pdf (accessed on 27 October 2019).
  29. CONAPO. Perfil sociodemográfico del municipio de Mexicali. Available online: http://www.copladebc.gob.mx/publicaciones/2018/Mensual/Febrero.pdf (accessed on 28 October 2019).
  30. Sheweka, S.; Mohamed, N. Green Facades as a New Sustainable Approach towards Climate Change. Energy Procedia 2012, 18, 507–520. [Google Scholar] [CrossRef] [Green Version]
  31. Perini, K.; Paolo, R. Cost–benefit analysis for green façades and living wall systems. Build. Environ. 2013, 70, 110–121. [Google Scholar] [CrossRef]
  32. Larsen, S.F.; Filippín, C.; Lesino, G. Thermal Simulation of a Double Skin Façade with Plants. Energy Procedia 2014, 57, 1763–1772. [Google Scholar] [CrossRef] [Green Version]
  33. Perini, K.; Ottelé, M.; Fraaij, A.; Haas, E.; Raiteri, R. Vertical greening systems and the effect on air flow and temperature on the building envelope. Build. Environ. 2011, 46, 2287–2294. [Google Scholar] [CrossRef]
  34. Virtudes, A.; Manso, M. Green façades: As a feature in urban design. In Proceedings of the ICEUBI 2011, International Conference on Engineering UBI2011, Covilhã, Portugal, 28–30 November 2011. [Google Scholar]
  35. Silvan, M.M.; Castro-Gomes, J. Thermal analysis of a new modular system for green walls. J. Build. Eng. 2016, 7, 53–62. [Google Scholar]
  36. Ley, J.; Denigri, M.; García, O.; Venegas, F.; Ochoa, M. Atlas de Riegos del Municipio de Mexicali. 2010. Available online: http://dceg.bajacalifornia.gob.mx/Sasip/documentos/archivos/sid10636282967094206693.pdf (accessed on 26 December 2018).
  37. Giridhar, G.; Deval, K.; Maheswari, R.; Vasudevan, P. Bougainvillea: A source of energy. Biomass 1985, 7, 241–244. [Google Scholar] [CrossRef]
  38. Energy Efficient Design of New Building, Except Low-Rise Residential Buildings; ASHRAE. Standard 90.1; American Society of Heating, Refrigerating and Air Conditioning Engineers: Atlanta, GA, USA, 2007.
  39. Environmental Protection Agency EPA. Greenhouse Gas Equivalencies Calculator. 2019. Available online: https://www.epa.gov/energy/greenhouse-gas-equivalencies-calculator (accessed on 11 November 2019).
  40. Spilková, J.; Vágner, J. The loss of land devoted to allotment gardening: The context of the contrasting pressures of urban planning, public and private interests in Prague, Czechia. Land Use Policy 2016, 52, 232–239. [Google Scholar] [CrossRef]
  41. He, Y.; Yu, H.; Ozaki, A.; Dong, N.; Zheng, S. An investigation on the thermal and energy performance of living wall system in Shanghai area. Energy Build. 2017, 140, 324–335. [Google Scholar] [CrossRef]
  42. Charoenkit, S.; Yiemwattana, S. Living walls and their contribution to improved thermal comfort and carbon emission reduction: A review. Build. Environ. 2016, 105, 82–94. [Google Scholar] [CrossRef]
  43. Riley, B. The state of the art of living walls: Lessons learned. Build. Environ. 2017, 114, 219–232. [Google Scholar] [CrossRef]
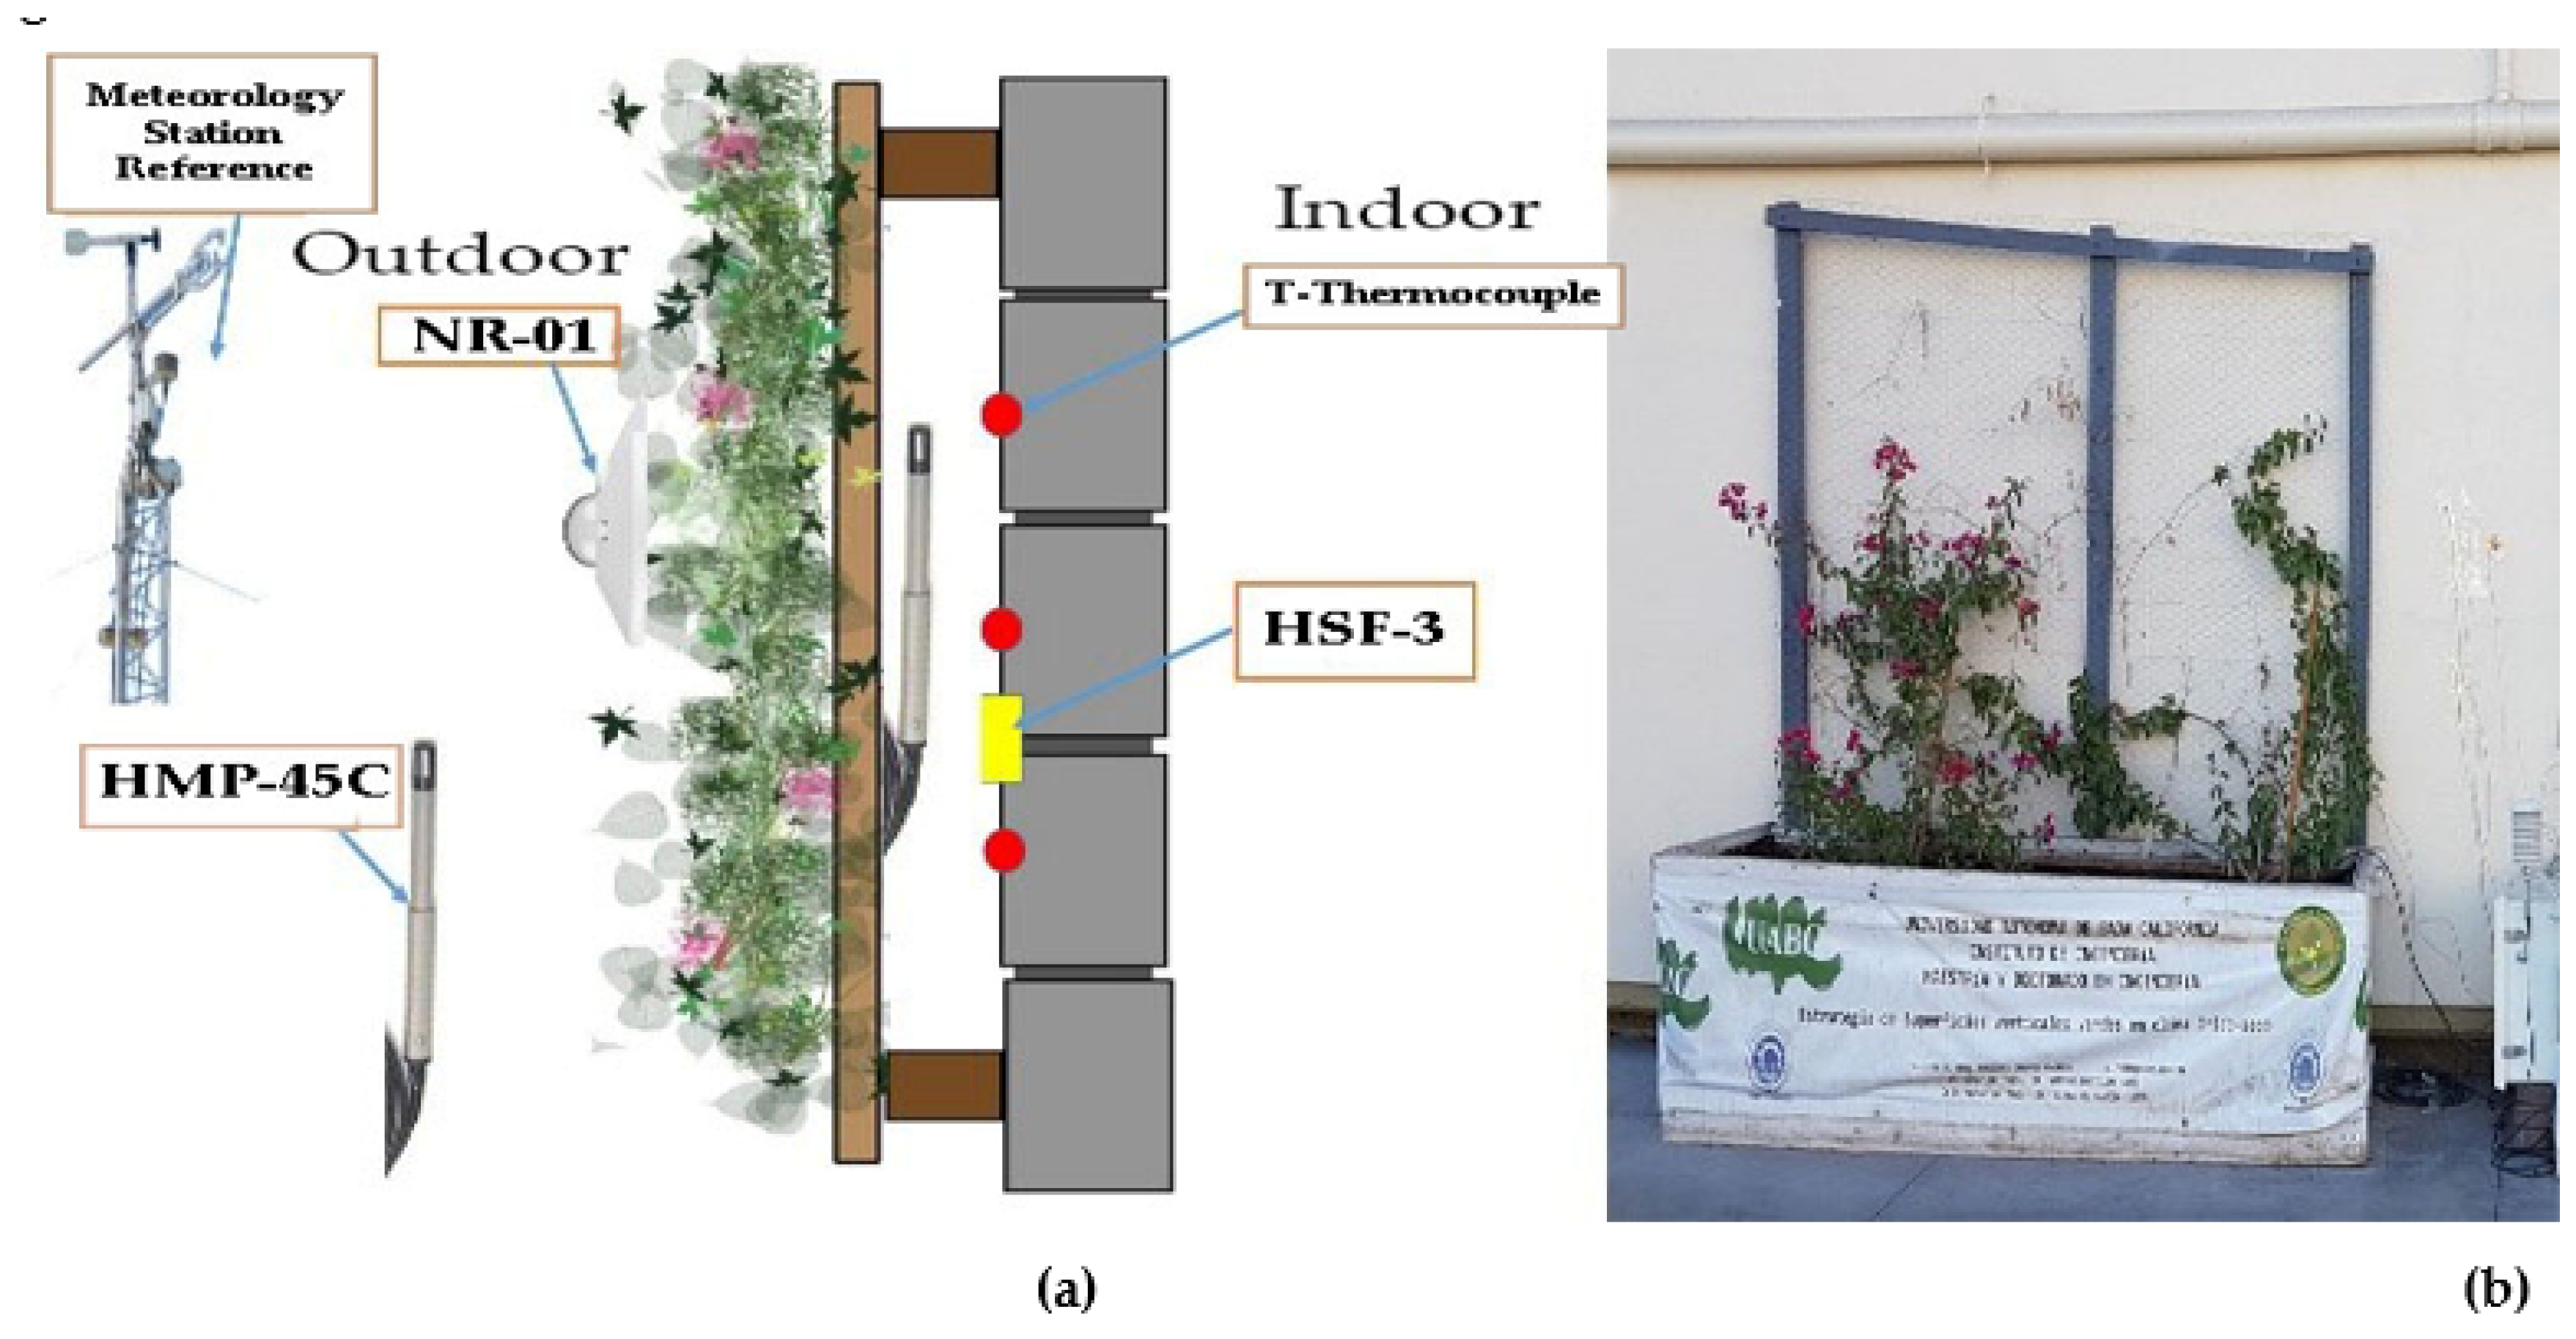
Figure 1. (a) Section plan layout of measuring equipment. (b) Photo of Bugambillea on experimental site.
Sustainability 12 05265 g001
Figure 2. Surface temperature (continuous lines) and air temperature (discontinuous lines), hourly averages 21–23 July 2018.
Sustainability 12 05265 g002
Figure 3. Heat fluxes, global radiation, and vertical radiation. Average hours 21–23 July 2018.
Sustainability 12 05265 g003
Table 1. Measuring instruments in situ.
ModelParameterQtyUnitAccuracy
Temp Probe HMP–45CAir Temperature2°C±0.05 °C
Flux Sensor HSF–3Heat Flux2W/m²±0.7 μW
Type T ThermocoupleSurface Temperature6°C±0.4 °C
NR-01 Net RadiometerSolar Radiation1W/m²±0.4 W/m²
Table 2. Hourly average temperature data of surface and air temperatures in Living Green Wall (LGW), concrete wall (CW), and reference meteorological station, 21–23 July 2018.
Local HourSurface Temperature
Site °C
Air Temperature
Site °C
Air Temperature Reference Station °C
LGWCWLGWCW
13:0043.044.144.744.840.2
14:0047.650.046.548.040.8
15:0051.654.647.549.041.7
16:0055.055.547.649.242.1
17:0054.855.347.149.342.2
18:0050.851.944.546.142.4
Average50.551.946.347.741.6
Table 3. Hourly averages of radiation, heat fluxes, additional air conditioning (AC), and surplus kWh, 21–23 July 2018.
Local Hour* Global Rad* Ver RadVer Rad/Global Rad** CW** LWG** CW–LWG
in 1 m²
** CW–LWG
in 38 m²
Btu/hTons ACExcess
kWh
13:000.9630.320.330.1740.1060.0682.5658752.140.731.05
14:000.9590.450.460.3830.1650.2188.272628,227.292.353.40
15:000.8510.590.700.3920.1990.1937.341625,050.582.093.02
16:000.6730.630.930.2030.1220.0813.07810,502.570.881.27
17:000.4920.511.040.2230.0980.1264.76916,272.511.361.96
18:000.2820.391.380.1930.0900.1033.929213,406.991.121.62
---------Summation:1.5680.7790.788329.96102,212.088.5312.32
Note: * global radiation kW/m2, ** heat flux kW/m2.
Table 4. Greenhouse gas (GHG) equivalencies, Environmental Protection Agency (EPA) 2019.
GHG Equivalencies
kWh = Emissions985.6 kWh = 697 kg CO278.4 gallons of gasoline consumed
1704 Miles driven by average passenger vehicle
762 pounds of coal burned
0.122 homes‘ electricity use for one year
88,872 number of smartphones charged
26.5 incadescent lamps switched to light-emitting diodes (LEDs)
1.6 barrels of oil consumed
28.5 propane cylinders used for home barbeques