Article

Analysis of the Possibility of Transport Mode Switch: A Case Study for Joinville Students

by
Thamires Ferreira Schubert
1,
Elisa Henning
2,* and
Simone Becker Lopes
3
1
Civil Engineering Department, Santa Catarina State University, 89219-710 Joinville, Brazil
2
Mathematics Department, Santa Catarina State University, 89219-710 Joinville, Brazil
3
Mobility Engineering Department, Federal University of Santa Catarina, 89219-600 Joinville, Brazil
*
Author to whom correspondence should be addressed.
Sustainability 2020, 12(13), 5232; https://doi.org/10.3390/su12135232
Submission received: 14 May 2020 / Revised: 21 June 2020 / Accepted: 22 June 2020 / Published: 28 June 2020

Abstract

:
This work mainly aims to identify and understand the factors influencing the switching of transportation modes among higher-education students in Joinville, Brazil, when traveling to universities. An online questionnaire was prepared for data collection which obtained 511 responses from six higher education institutions. The revealed preference survey identified the bus as the most used by students today, while the stated preference survey assessed the possibility of changing modes. Employing a multinomial logit model, the results indicate that students would be interested in switching from individual motor vehicles to other options. The scenarios for switching to buses presented the highest switching probability. Bus cost was the most important factor for switching. Despite the small number, the students showed interest in switching from the car to active modes. This may indicate the lack of current infrastructure and the need for investments so these modes can be seen as quality options for users. Finally, a transport mode switch would occur only if alternative modes to the car or their infrastructure are improved; otherwise, students maintain their usual choices. This knowledge can assist in the development of public policies aimed at urban management seeking to increase the supply and the quality of more sustainable modes of transport.

1. Introduction

Good mobility planning requires knowledge of what users demand to make it possible to invest in available resources more effectively with measures that encourage more sustainable modes of transport, such as collective and active transport. The demand for transportation is linked to the user’s preference for a certain transport mode. This choice is influenced by several factors, such as user characteristics, the social environment into which they are inserted, and transportation aspects.
Understanding the factors influencing this choice is fundamental to identifying the main factors leading to one transport being used more than another. Thus, the use of alternative modes to the automobile, which is one of the transport modes generating the highest congestion in urban centers, is being promoted. The factors discouraging the use of other modes can also be determined by promoting improvements in the transport system, thereby offering better options.
In this context, this study proposes the identification and understanding of the factors influencing the switch of transport mode among higher-education students in their commute to universities, focusing on the choice of alternative means to the car. For this purpose, a revealed preference survey was performed to learn the current commuting form of respondents, while a stated preference survey was conducted to evaluate the possibility of switching transport modes by employing hypothetical scenarios. The data from these surveys were used in a multinomial regression model. The city of Joinville, which is located in the north of the Santa Catarina state, was chosen for this study. Joinville is an industrial center in the southern region of Brazil with an estimated population of more than 583,000 inhabitants, which makes it a medium-sized city [1].
Medium- and large-sized cities already have a considerable road network, and its expansion can be discarded if the existing space is better used. Thus, knowing the characteristics that inhabitants consider relevant in a transport mode is necessary for improving the conditions of less-used modes, creating an initial incentive for the population to change their behavior. The balance of using different transport modes is precisely the key to change, which reduces the use of individual motor vehicles and encourages collective and active transport, including buses, bicycles, and walking.
Students were selected as the target audience of this research because they belong to a class that is generally young and can represent a possible tendency of change in behavior toward their commute mode choices. Moreover, students have varied attributes. They are adults with autonomy to decide how to travel and present information that is easier to access for research. Educational institutions are travel-generating poles and, in their majority, attract significant numbers of users in a given time range, thereby contributing to the increase in traffic in the region. With the analysis of this concentrated commute, the flow can be relieved and distributed in a more organized manner.
The article presents a descriptive research with the application of a questionnaire designed to assess the possibility of a change in the choice of transport mode by the student. The study intends to understand the travel patterns of students considering their significant influence on urban displacement, especially in the times of entry and exit from classes. It is expected to find information about the characteristics of the students and how it affects their daily choices regarding the transport system. For this, the multinomial logit model was chosen, which is the simplest among the multinomial regression models to be the first applied in view of the fact that an analysis of modal choice has never been performed in the city.
To assess the urban mobility of Joinville, data from the last origin/destination survey conducted in 2010 are used, which contains information of the modal split and the characteristics of the trip, such as purpose and travel time. The survey carried out by the municipality does not show the association between modal choice and the characteristics of transport users, nor does it suggest what improvements could be made for residents to change their choices to more sustainable options.
In this vein, this study presents a more practical way and with less investment in both cost and manpower for data collection. A free and digital questionnaire was created which can be adapted according to the research focus. Considering that schools have access to the internet, even those students who do not have a computer at home can participate. That way, the survey can return more responses in less time. With the use of revealed and stated preference research, it is possible to have two surveys with the application of one instrument; in the first case, the current situation regarding the modal choice is raised, and in the second it indicates the possibility of change.
This paper is structured in six sections. Section 2 presents a brief literature review and Section 3 describes the study area. Section 4 explains the materials and methods. Section 5 discusses and shows the main results for this research and Section 6 concludes the paper.

2. Literature Review

The literature presents many studies that address the mode choice for understanding the factors influencing the use of a certain transport mode. Most studies focus on binary options [2,3,4,5,6] by analyzing two transport modes (e.g., car and public transport) or motorized or non-motorized mode categories. Other studies investigated the mode choice through multinomial models (i.e., with more than two options for the dependent variable) [7,8,9,10,11]. In a more restricted manner, some studies used students as their target audience, regardless of whether they were university students [12,13,14] or children [15].
Among the factors found, the commute time was quite significant. Users would be less likely to choose transport modes with longer commute times [16]. The perception of the commute time is more sensitive to the bus mode (i.e., a shorter or longer trip can influence bus use more than the other modes) [17].
For university students, time is also an important factor, considering that longer and further routes encourage the use of individual vehicles [18]. Time can be analyzed as the total commute time, just the time of commute within the vehicle, waiting time, or access time to the boarding place. In this context, if the walking time to a boarding point is shorter, and the commute time of the car increases, a significant possibility of switching the car for public transportation can be observed [19]. The waiting and the period inside the vehicle during the commute are more important for decision-making than the walking time to access transport and reach the destination [20].
Users’ interest in switching to a more efficient public transport mode grows as the commute time and costs for private transport increase [17].
For students, the bicycle choice is influenced both by the commute times using the bicycle and the bus [21].
Users would be encouraged to use public transport if they received a bonus or had reduced fare even if the total commute time was longer [22]. In some cases, public transport users would be willing to pay higher for a more comfortable and frequent service with up to 15 min of waiting [17] or for a shorter travel time [19].
Cost is another very relevant factor for the transport mode choice, on which switching has a direct influence. The increase in fares in transport reduces its utility, which is the measure of the mode attraction [17]. A 10% change in the commute costs would not change the user’s choice, but a 20% increase in the commute costs by car could switch the choice to public transport [19]. The bicycle has an advantage in this sense because it presents low acquisition cost and does not consume fuel, thereby exempting this mode from expense [6]. For students, low-cost parking would encourage car use [23].
The greater the distance to work or school, the lower the probability of going by bicycle and the greater the probability of using public transportation in the absence of a car [16,24]. Students who move to another city to study are already looking for housing close to educational institutions and usually shift to walking or traveling by bicycle. None of the students who moved up to 2 km close to the Institution of Higher Education (IHE) used public transportation because they preferred to walk or cycle, which is an option also influenced by cost [13].
The socioeconomic characteristics of respondents also frequently appear in the literature [24]. In terms of gender, women use public transport more [18] and are less likely to commute by bicycle compared to men [20,24]. Among students, the conclusions follow the same trend, with women preferring cars to bicycles [23]. Women also prefer buses to cars when compared to men and are less likely to have a driver’s license [25].
Regarding age, the youngest are more likely to walk to the destination [20], as is compatible with the age group of the students.
Students with incomes close to the middle-class value give less importance to bus fare than people with other income levels [21]. For users in general, the bicycle [24] and public transport [26] modes have lower chances of being used as incomes increase.
Another point is the family structure, in which married users and those from larger families tend to use cars more often [16].
Factors such as weather [23], the provision of parking spots, accessible routes, and showers at the destination for pedestrians and cyclists encourage the use of the walking and cycling modes [6].
In addition to promoting other transport modes, discouraging the use of individual vehicles can help in the possible change in behavior in the way people choose to commute [27]. Meanwhile, other quality transport modes must be offered when decreasing car usage. [23] evaluated the increased cost of parking in educational institutions as a disincentive measure to the car. However, they noted that a coordinated action with the municipal government is needed to avoid overburdening areas surrounding the university with parked cars. Charging for parking inside the university campus would be the most impacting measure to decrease the car mode attractiveness [21]. For [20], the availability and cost of parking are not significant.
The factors influencing the choice of transport mode can be extracted based on the works found in the literature. These factors are presented in Table 1. “Costs” and “time” had the highest occurrence. Studies also brought another interesting point: for the user to choose a certain transport mode, both mode characteristics and structure at the destination, such as parking availability and changing rooms, are sufficient.

3. Characteristics of the Study Area

The city of Joinville is the study area. Joinville is located in the north of Santa Catarina state (Figure 1). It is the largest city in the state, and its main activities are concentrated in the industry of the metal-mechanical, plastic, and metallurgical sectors [28].
Joinville was chosen as the study area because it is the largest city in the state and is a medium-sized city with congestion that exceeds peak hours. Taking into account the size of the city and its relevance in the region, quality urban development is expected, with planning to meet the demand for transport. For this, it is necessary to have information about the use of transport modes by users—not only the mode used, but the factors that lead to this choice.
The last origin/destination survey in Joinville that is used as a reference was conducted in 2010 [29]. It presented a modal division of 35% car use, followed by public transport with 24%, walking with 23%, and the bicycle with 11%. In 2017, the population index per vehicle was 1.47 (i.e., 3.14 in 2000). The vehicle fleet almost tripled in 17 years.
For public transportation, the city has an integrated bus system with 10 terminals and a single ticket payment. Bus transportation has reduced in the number of users since 2000. The indicator of passengers transported per day in terms of the population fell from 32% in 2000 to 17% in 2017 [29].
The city has 3 public higher education institutions, in addition to 10 private higher education institutions considering presence-based courses, with approximately 15,000 students [30]. The survey covered six institutions of higher education, while the others did not authorize the collection of data long enough for approval by the ethics committee.

4. Materials and Methods

The data were obtained through the application of a questionnaire consisting of sample characterization and information about the daily commute in a revealed and stated preference survey format.
The elaboration of the questionnaire was based on other revealed and stated preference surveys found in the literature [3,11,12,14,19,20], adapting the questions to the reality of the study area. Table 2 presents the main questions asked to students in each section of the questionnaire, which was divided into three parts; parts A and B of the questionnaire were related to the characterization and aspects of the user’s current commute, respectively, and part C, which presented the proposed scenarios to evaluate the possible switch in transport mode choice for users, was available only to those who use cars as their current transport mode.
For the elaboration of the scenarios, it was necessary to determine which factors would be shown to the respondent to assess their importance. Among the relevant factors for the modal choice were costs, time, distance, availability of the mode of transport, existence of an exclusive lane (such as a bus or bicycle lane and accessible sidewalks), comfort, and structure at the destination (parking, changing room). This list of factors resulted in an experiment design with many scenarios.
Therefore, a preliminary survey was conducted with students from Institution A to assess which factors were most important, and only those were maintained.
To organize these factors in combinations that would form the scenarios of Part C, an experimental orthogonal arrangement was developed based on a fractional factorial. The orthogonal arrangement is an experiment planning technique which allows you to design experiments efficiently. The orthogonal arrangement is suitable when it is desired to test several factors with a reduced number of experiments. From that, an orthogonal arrangement experiment was performed, resulting in eight scenarios with six attributes of the transport modes with two levels each.
The respondent was presented with a chart explaining all the factors and their levels (Figure 2) to facilitate the understanding of questions. As an example, for the walking mode, the existence of accessible pavement was evaluated, being described as a good pavement that allows the locomotion of people with reduced mobility.
Appendix A shows the summary of the eight scenarios.
The face and content of the questionnaire were validated and approved by the university’s ethics committee (project identification code: 96026418.8.0000.0118, approval date: 1 November 2018, by Research Ethics Committee Involving Humans of Santa Catarina State University—CEP/UDESC).
The data collected were estimated to be at a minimum of 400 responses, considering a 95% confidence level, 5% margin of error, and a population of 10,000 students. Six institutions were selected from a total of 13 (i.e., A, B, C, and Others (D)). For analysis purposes, University C, composed of two poles, had the pole with fewer students included in group D because it had similar characteristics to others and was located far away from the northern region.
All the participating educational institutions offer presence-based courses with both free and paid tuition. Among the free institutions are a state university (A) and a federal university (B), which both focused on the technology and exact sciences fields. In private colleges (C, D), the courses are of diverse fields, and classes are in all periods (i.e., mainly night and morning). Institutions that offered online-based learning courses at the time of the research were excluded.
The questionnaire was applied in online format between November 2018 and January 2019. A total of 511 responses were received. Most of the responses were from students in the northern part of the city (i.e., from universities A to C), with a response rate of 83.2%.

Logit Model

Discrete choice models are a recurrent method for the analysis of the revealed and stated survey data. This type of model is useful for reproducing, describing, or evaluating situations where individuals must select an option from a finite set of alternatives [31]. One of the applications for the discrete choice models is in understanding users’ preference for different transport modes.
Logit models “represent complex aspects of user displacement decisions, incorporating important demographic and policy-sensitive explanatory variables.” [18] (p. 1415).
A binary logit model comprises the choice between two dependent variables (e.g., choosing to use a car or a public transport). The individual chooses between yes or no (0 or 1). The multinomial logit model has more than two categories for the dependent variable [32].
The choice of an individual can be predicted by the random utility model: “The main assumption is that each person associates a quantity, called utility, to each alternative, selecting the alternative with the greatest utility.” [33] (p. 2). A logit model is mathematically based on the theory of maximizing this utility. The utilities come from the attribute characteristics and the individuals themselves and are related to the attractiveness of choice and the individual [31].
This study proposed the identification of influential variables both in the current transport mode choice and in an eventual shift of the students’ commute mode through hypothetical scenarios alternative to the current one. Two distinct multinomial logit models were adjusted and presented in the subsections that follow. The first one refers to the revealed preference survey (n = 411). The second one refers to the stated preference (i.e., only for those who use cars; n = 150). To specify the revealed preference model, the answers of students who did not live in Joinville (29) and those referring to the “Other transport mode” (14) and carpooling (56) were removed.
The dependent variable is the transport mode with four options: by car (reference), walking, by bicycle, and bus. The independent variables are educational institution, age, gender, income, who they live with, whether they work, and commute time. The scenario variables were also included for the stated preference models.
The model evaluation was conducted using the pseudo r2 (McFadden, adjusted McFadden, Nagelkerke and Cox, and Snell). A likelihood ratio test was performed. The results of the confusion matrix, general accuracy values, sensitivity, specificity, and Kappa index were also analyzed. The results of the confusion matrix were used only for the stated preference survey considering the number of answers. The odds ratio values were used to analyze the significant parameters.
All analyses were performed in R software [34] using the mlogit [35], nnet [36], and DoE.Base [37] packages. For modeling, the sample was divided into two parts: 70% for model calibration and 30% for validation, with a 5% significance level. The QGIS software [38] was used to visualize the spatial distribution of the place of origin of the students’ travels and analyze the transport mode chosen in terms of distance to the universities.

5. Results and Discussion

The sample characterization indicated that of the 511 respondents, 302 were women and 209 were men. Most were between 18 and 25 years old. The mean age of the respondents between 18 and 44 years old was 22 years old. Income comprised the average family income (if the respondent lives with them) or only theirs (if they live alone or with friends). The average income of three to five minimum wages was more frequent (44%), followed by an income of up to two minimum wages (27%). Most of the respondents were single, live with their families or partners, know how to ride a bicycle, know how the city’s public transportation system works, have no children, and live in Joinville.
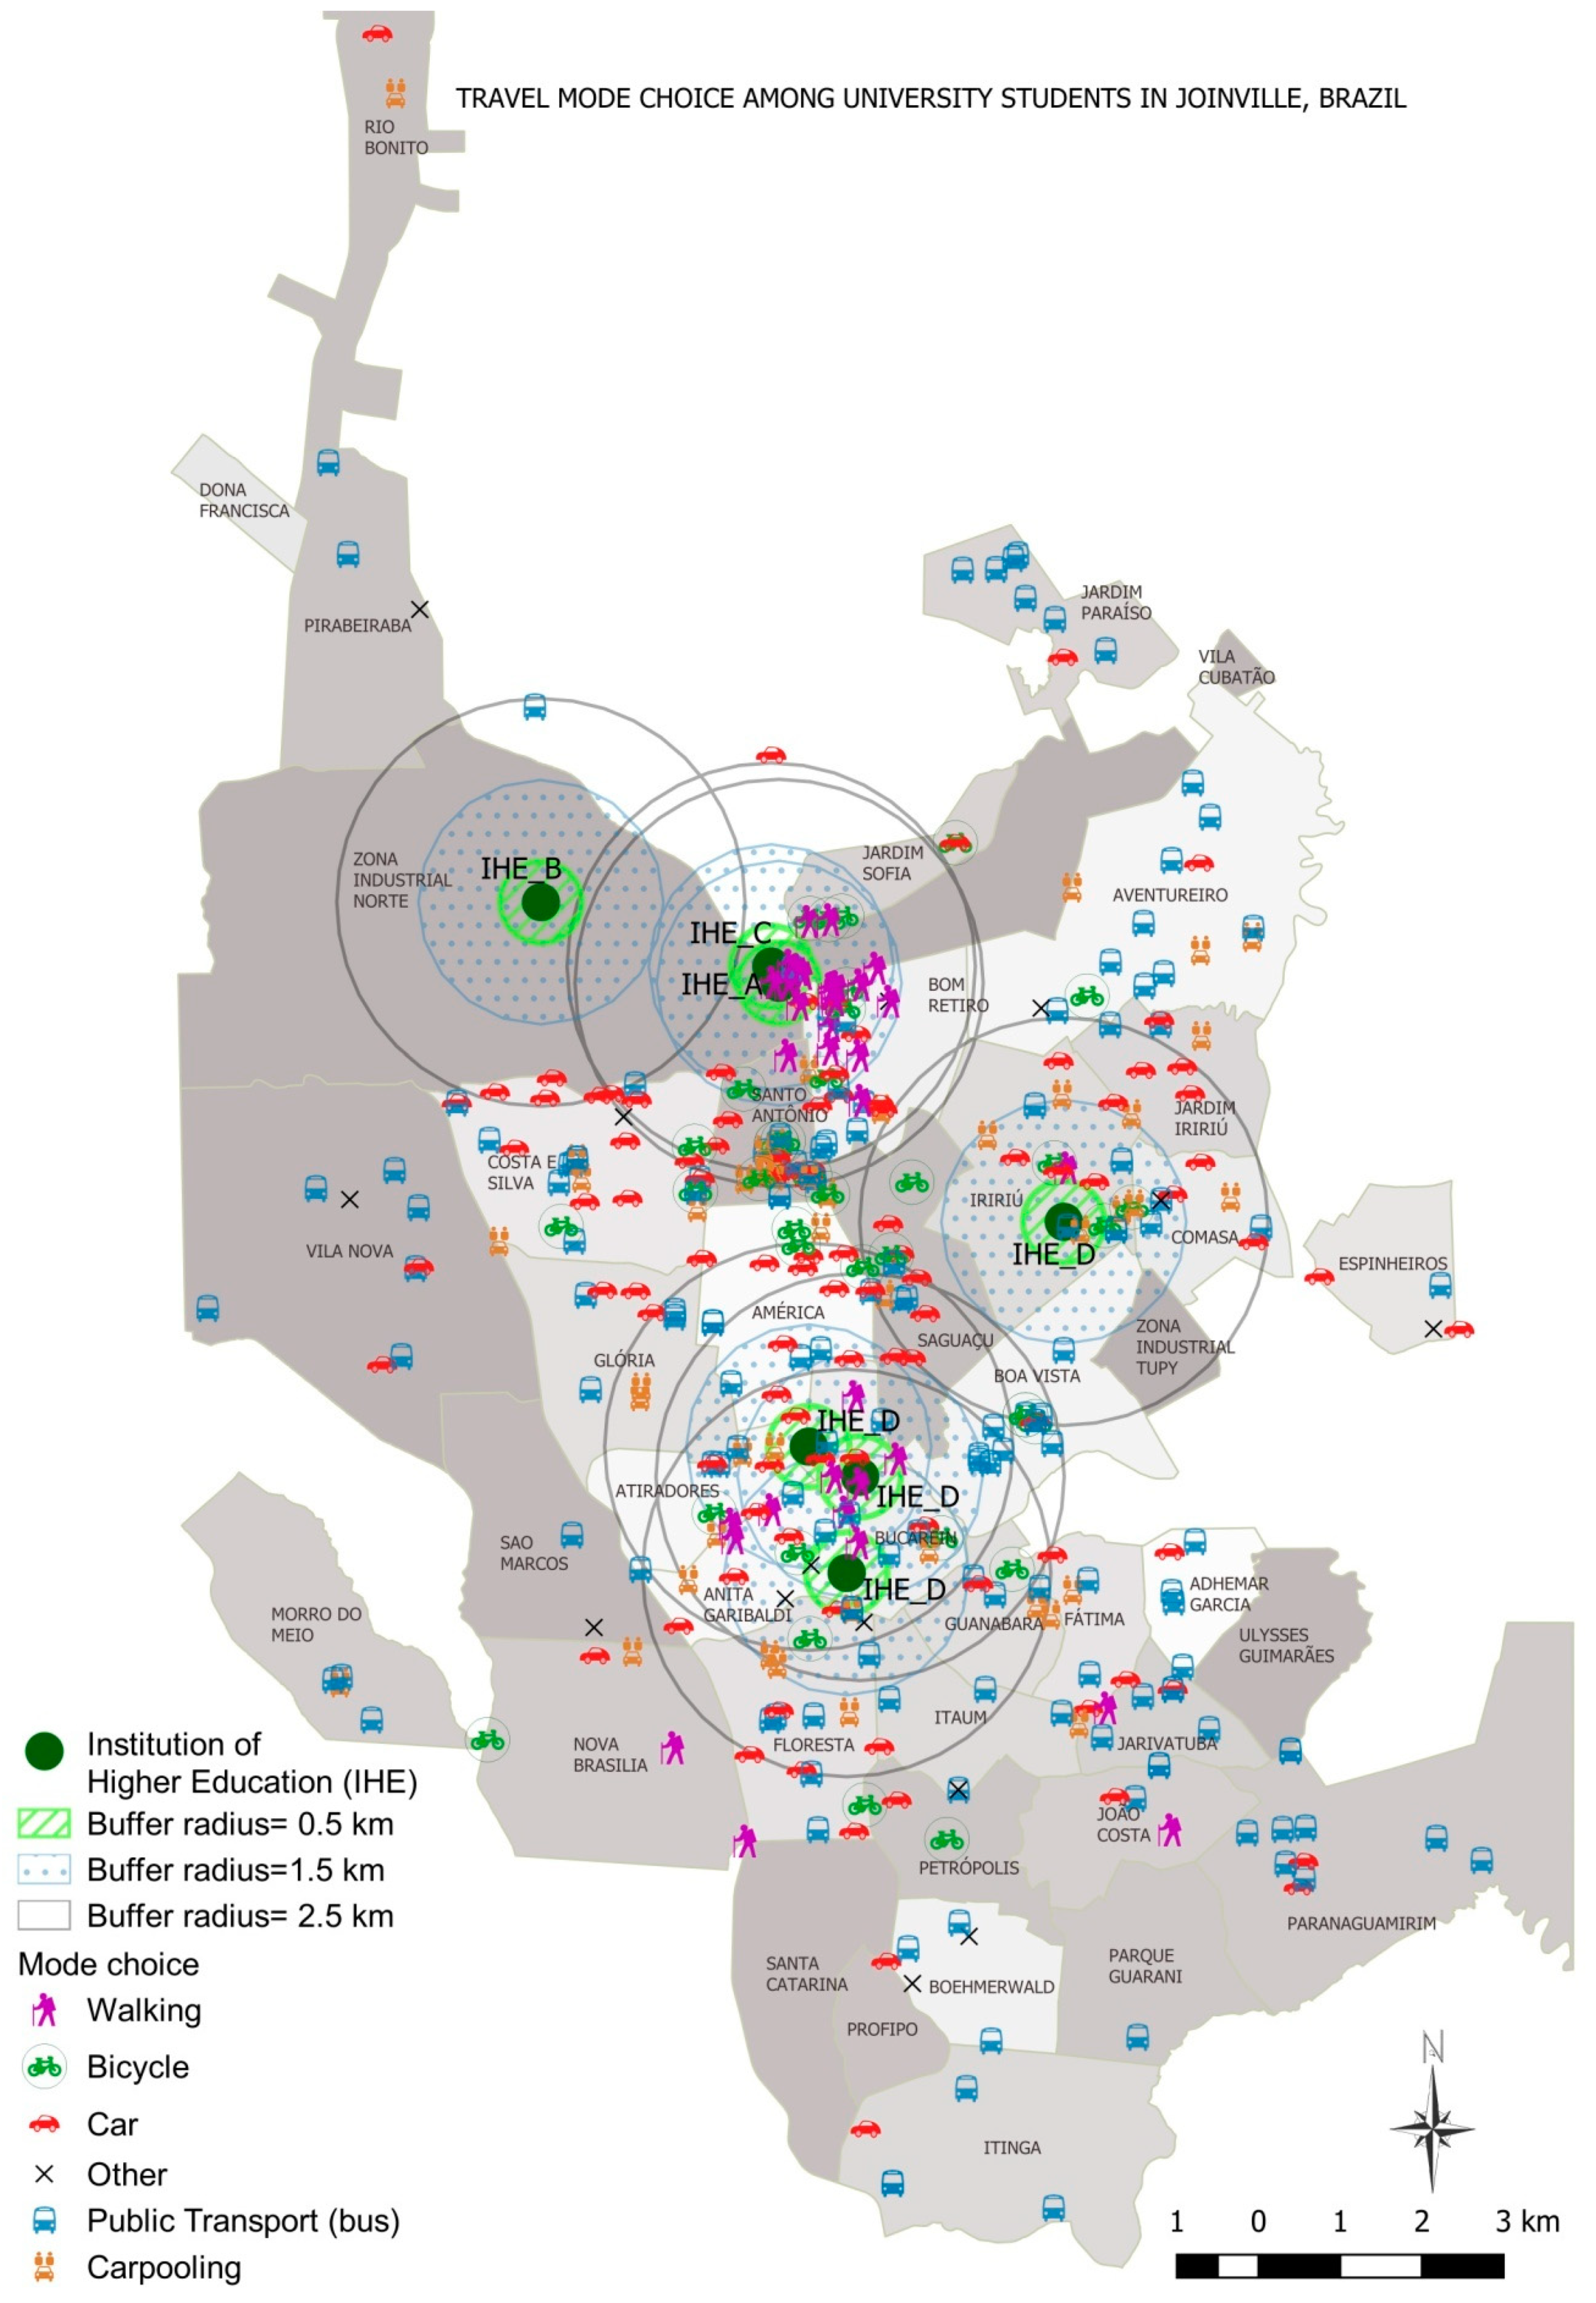
The most used mode of travel between the origin (home or work) and the IHE is the bus (184 students: 36%), followed by the car (150 students: 29%) and carpooling (11%). Carpooling obtained an impressive number because University B is located in a region with little transport supply and transport infrastructure. Thus, carpooling has become an easier way to commute.
Half of the students who said they use “Other transport modes” do not live in Joinville and use a private bus or van/mini-bus (16 students) and motorcycles (12 students).
Compared to the modal split of the origin/destination survey carried out in 2010 [29], the use of motorized modes (car and bus) increased from 59% to 65%, while active modes decreased from 34% to 18% according to student responses. This may indicate a change in the modal division of city residents, motivating the need to conduct further research to understand changes in users’ choices and how it affects the transport system. In contrast, the bus had an increase in use from 24% to 36% when compared to the 2010 survey. This variation can be justified by the insufficient income of students who cannot buy or maintain a car, opting for the bus.
In general, students usually spend an average of 36 min to make the commute to the IHE. Specifically, 34% (174 students) take 11 to 20 min, and 28% (144) take more than 41 min on their way. Appendix B presents a table with the sample characteristics.
Table 3 shows the sample characteristics separated by the respondent’s current transport mode. Students who use cars had the highest mean age (24.73 years old), while the lowest mean was from those who use buses (21.21 years old). However, the values can be considered very close considering that the mean of the total sample was 22.53 years old.
Men use cars and bicycles more, while women use buses, walk, and catch rides more. Regarding income, students who use cars have a higher income, while those who use buses have an income of up to five minimum wages.
Most married students use cars (29 students), followed by those who use buses (18 students) and bicycles (6 students). A total of 166 single students commute by bus. Those who share a house with friends usually go by car or catch rides to college. The “living alone” option does not affect the mode choice. For students who live with their families or classmates, the most chosen option is the bus (160 students), followed by the car (114).
Students who work use the bus more, followed by the car.
Even if most of them know how to ride a bicycle, only half of them have one. Even the latter group uses other transport modes aside from the bicycle. Some indications showed that owning a bicycle does not change the transport mode choice.
Among the educational institutions, institution C had more students who use buses (42.5%) and less cars compared to others. Universities B and D had more students who use cars (35.8% and 34.9%, respectively).
Students use public transport more at the beginning of their education and as they move to the middle and end of their education. The opposite happens with the car transport mode, thereby increasing usage as students advance to the end of their education.
The mean bus time was 55.1 min, which is close to the mean time of the “Other transport modes” (i.e., you can compare the time that you spend riding buses within the city with that spent by those who have come from other cities to study). The shortest mean time was obtained for walking because this mode is associated with short distances.
A cyclist can travel 3.2 km in 10 min considering an average speed of 20 km/h [39]. The mean time of the responding students (23.9 min for cycling) may represent a longer distance traveled than the reference distance of 3 km. In turn, the average time for the car is less than half the time for the bus (24.2 min).
To complement the descriptive analysis, Figure 3 illustrates the mapping of the student responses to the transport mode chosen for daily use. The point indicated by the car design, for example, is the location of the residence or a junction near the home of the student who uses a car to commute to the IHE. Buffers (limiting regions by a certain radius) were inserted to evaluate the distances covered by the different means of locomotion.
The 0.5 and 1.5 km buffers covered most non-motorized displacements, as stated by [11]. The region with the highest incidence of this occurrence was around universities A and C. This is a fact justified by the presence of two very close universities. Another reason is the existence of much student housing in that region, considering that many respondents come from other cities to live in Joinville to study. The central region also favors walking as a form of commute. However, in the southern region some students choose to walk even if the distance is more than 2.5 km.
Some bicycle movements outside the limited regions were noted, indicating that some students cycle more than 2.5 km to go to college.
The 2.5 km buffer is the region in which students mostly used cars and buses; however, many motorized commutes are made beyond these distances. This shows that students come from quite diverse backgrounds in the city but are at the bottlenecks near the destination.

5.1. Logit Model for the Revealed Preference

Table 4 presents the results of Model 1 for the revealed preference survey. The sensitivity values of Model 1 were good for the car (0.76) and bus (0.86) classes, indicating that the model was correct for the true positives. The sensitivity for the walking mode was 0.55, while that for the cycling mode was 0.18, which proved to be a little less correct. For specificity, all the classes had a result above 0.81, which means that the model was correct for the true negatives. The overall accuracy of the model was 0.724 (i.e., Model 1 hits 72.4% of the results).
The analysis of the variables showed that students in University B have smaller chances of using the bus and bicycle modes. As mentioned, the university location has been changed, and access to the new location is easier by car because the route near the university has no bike lanes and only has a few bus lines. The roadside is also precarious.
The OR evaluation indicated that a student from University A is almost five times more likely to walk than use a car. Young people between the ages of 18 and 35 years are more likely to walk to their destination [20]. Distances of up to 2 km are usually covered by walking or cycling [13]. Students who live on rent worry about finding houses or apartments near the area where they study [13]. Figure 3 shows that many walking distances are close to A within the 1.5 km region, which is a place with many student houses.
Older students are less likely to choose the bus or walk because they usually have enough income to own and maintain cars. Male students are six times more likely to use bicycles than females, which is in agreement with [20,23,24].
Meanwhile, the higher the income, the greater the chance of using cars.
Respondents who take a longer commute usually come by bus and bicycle. The result depends on the sample profile.

5.2. Logit Model for the Stated Preference

This multinomial model analyzes the possibility of the transport mode switch. For this step, 150 answers from Part C of the questionnaire were used. In this case, no division needed to be considered between the calibration and validation samples.
The chosen model (i.e., Model 2) presented the following variables: age, gender, income, who the student lives with, whether they work, travel time, and scenario variables.
By evaluating the coefficients in Table 5, we can identify the factors influencing the mode switch or the continued use of the car. Most variables resulted in a positive sign, indicating the switch from the car mode to another mode.
All the IHEs had a positive impact on switching from car to bus. However, C students do not switch their cars for walking or cycling even if the university currently provides covered bicycle racks. Considering that 68.4% of the students in this university work, one hypothesis for this result is that the students have many activities to do before or after class, which, according to [40], can impair their choice of modes other than the car. However, the model pointed out that working students would switch the car for any other transport mode. One possible justification would be the perception that working students value their money more and would, therefore, think about the savings made by eliminating car expenses. No other model would have this expense if paid parking at work is considered.
Male students are less likely to switch to the bus and more likely to switch to the bicycle. This result is in agreement with that obtained by [20]. Living with a family or a partner would make the user switch from car to bus. The higher the student’s income, the less the likelihood of changing modes (i.e., those who earn more would continue to use cars). In addition to the time and cost of the trip, the increase in the user’s income brings resistance to switching from car to bus, as described by [26].
The time variable is shown as an important factor in the choice in several studies, as in [16,17,18,19], indicating that the increase in travel time creates resistance to change. According to the “Travel time” variable, the longer the commute time for the car, the greater the tendency to switch to all other means of transport, which supports the idea of creating limits for the use of individual vehicles, thereby reducing its incentive.
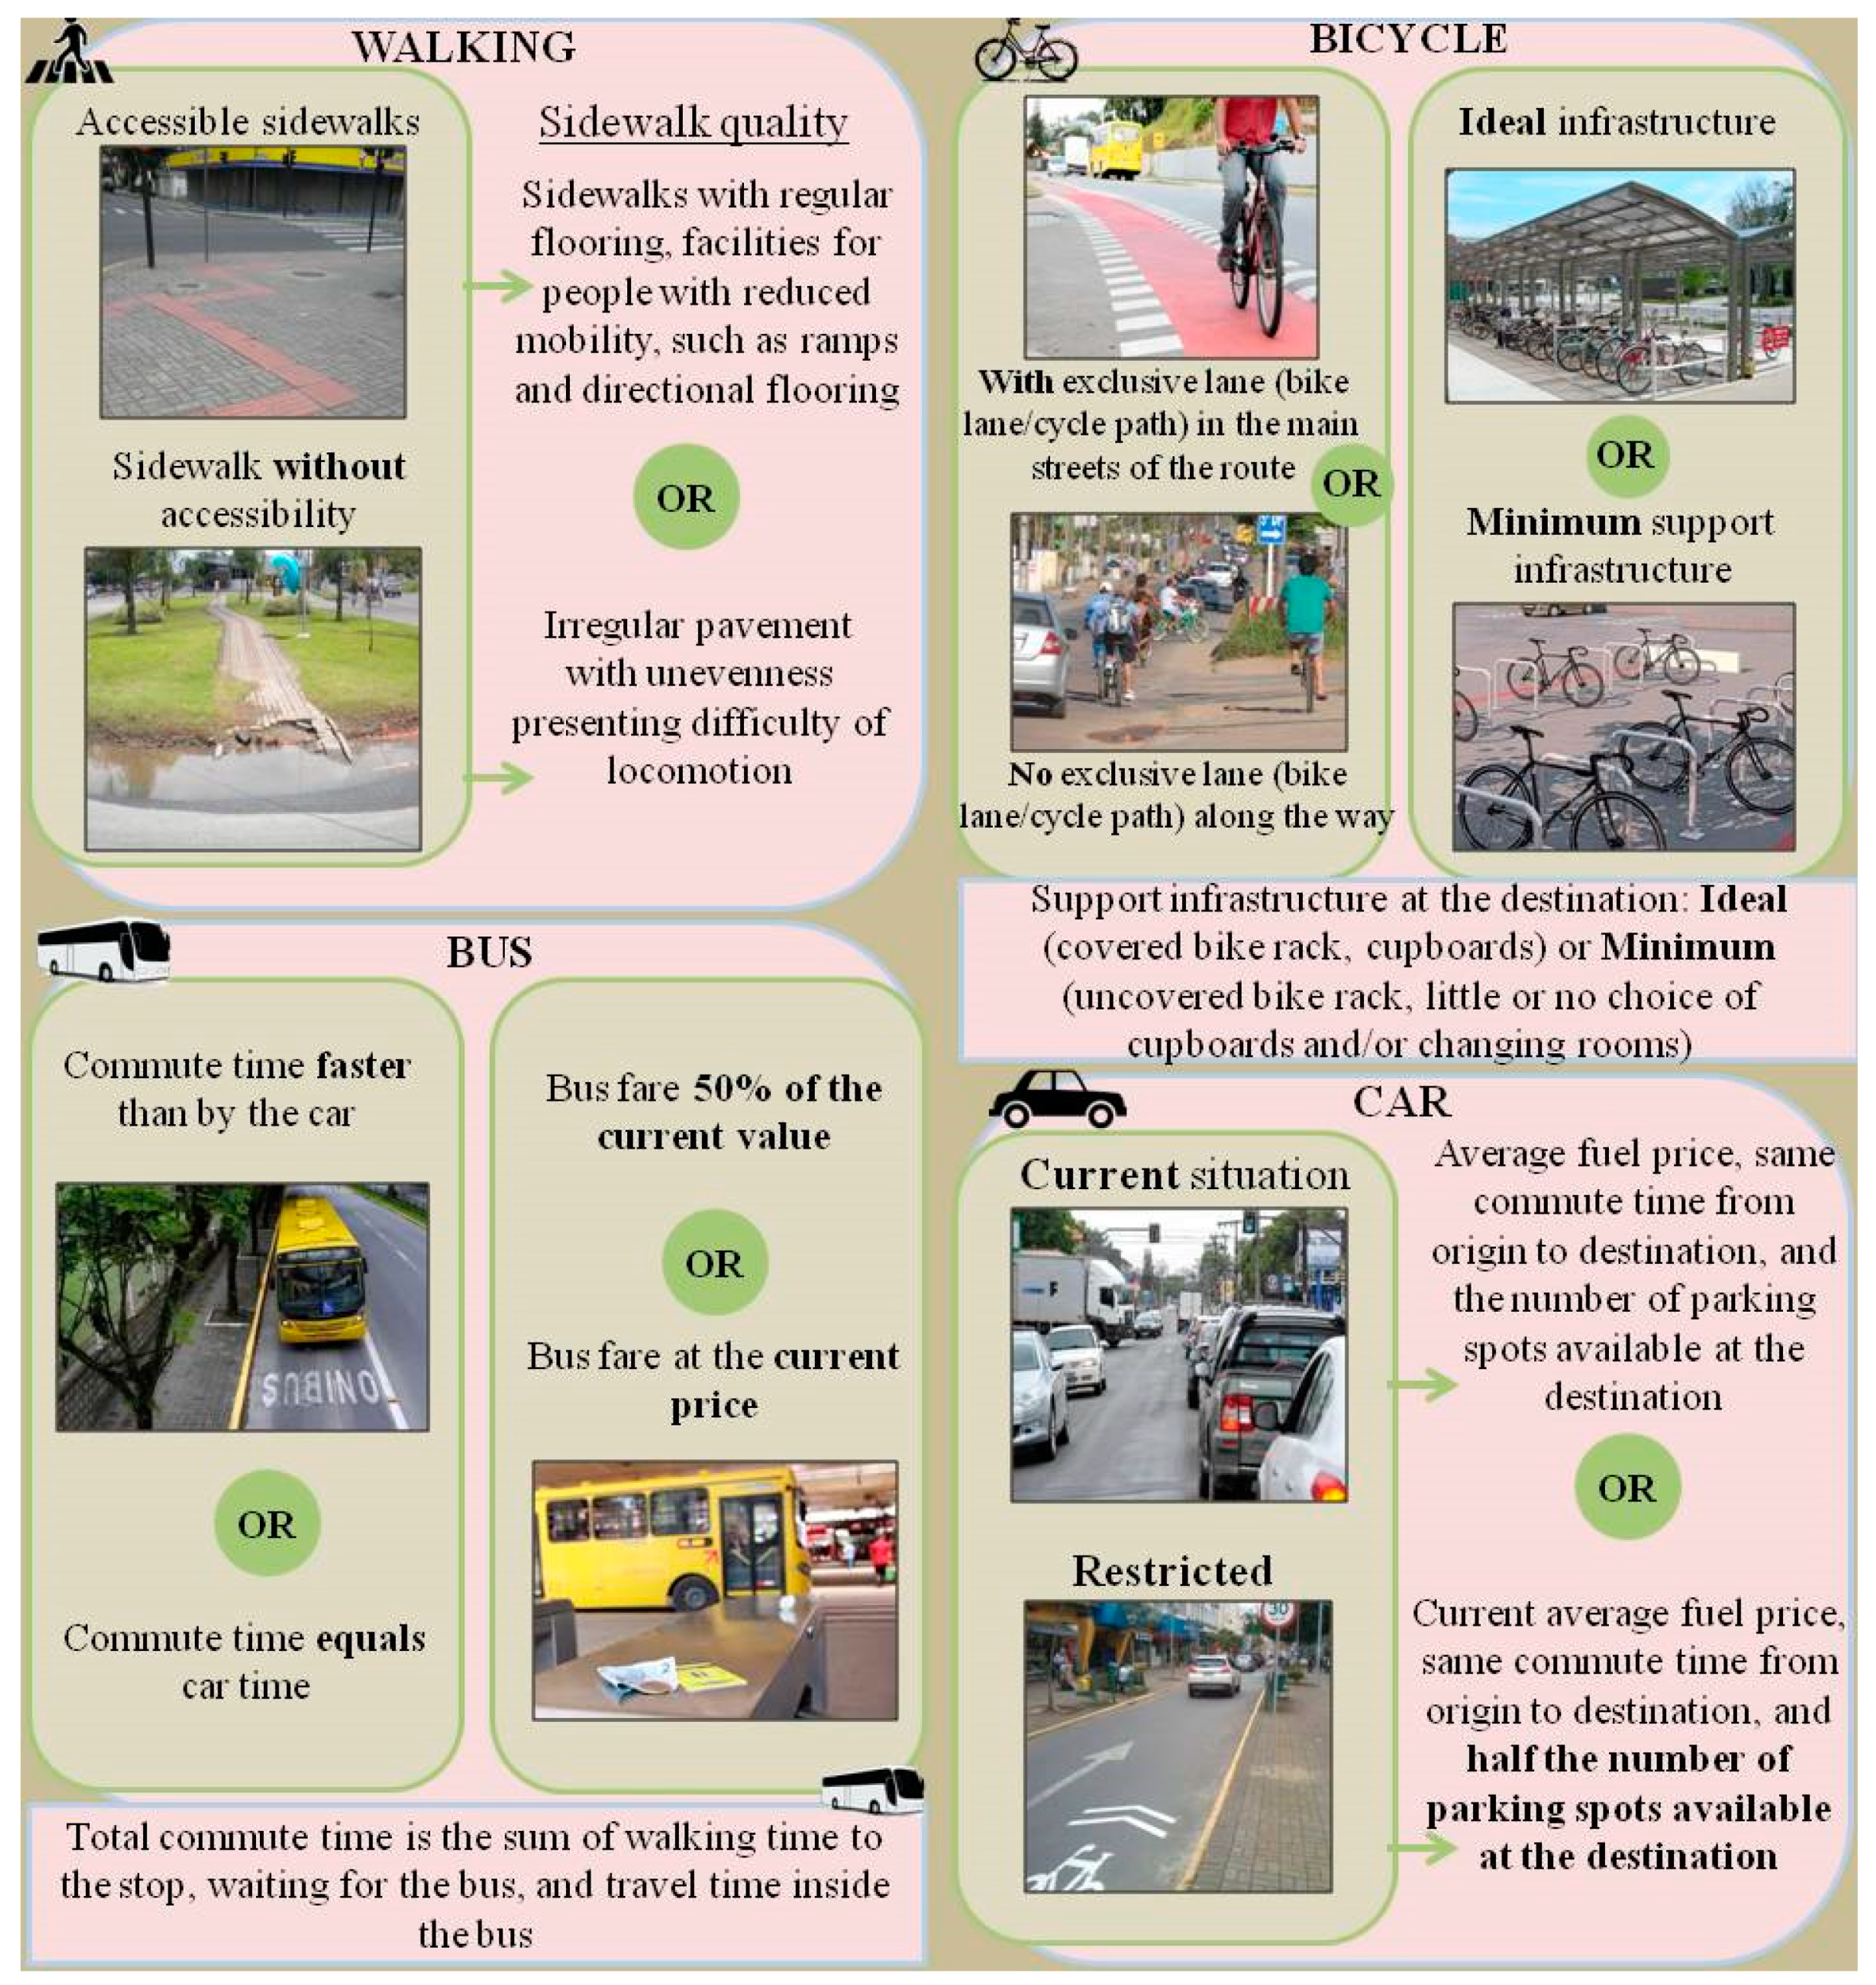
All the improvements suggested by the scenarios were positively evaluated, reflecting the transport mode switch. That is, if the road offers accessible sidewalks, the user would switch to walking or taking a bus. Perhaps the bus was representative because the students related the accessible sidewalk as an incentive to walking to or from the bus stop to the destination. The availability of exclusive lanes encourages the switch from car to bicycle. Exclusive lanes can increase a cyclist’s sense of safety and confidence, especially those with little experience, as [41] reported.
The minimum infrastructure for the cyclist decreased the likelihood of switching between car and bicycle (i.e., offering support structures, such as appropriate bicycle racks, and changing rooms can encourage bicycle use). This result is consistent with that obtained by [6,42].
If the bus offered less travel time than the car, a likelihood of switching to the bus would be observed. If the bus cost was lower than the current cost, the student would switch to going by bus, bicycle, or walking. The perception of the commute time by users is more sensitive to the bus and well evaluated as time is reduced and its reliability is increased [17]. An increase in the cost and time of the car positively affected the switch to the bus [17].
The “Bus cost” variable is positive for the switch from car to bus, bicycle, and walking if the public transport presents a lower cost than the current cost. This is consistent with the result obtained by [11,17,21,43]. An increased bus cost usually discourages its use [11]. Student responses may indicate dissatisfaction with the current service, opting for its use only if the cost is reduced.
The parking restriction did not influence the students at the time of the mode switch, although charging the parking lot would be an important measure for reducing the car mode attractiveness [21]. Meanwhile, [20] showed that the availability and cost of parking are not significant for switching modes.
These differences in the respondents’ perceptions can be generated by the wide availability of parking spots in most of the analyzed institutions. In this sense, the student could consider getting to class earlier to secure the few parking spots available or seek to park in the vicinity of the university. Parking restrictions should not be made as the only way to reduce the car mode attractiveness.
Table 3 presents the OR for the significant variables to switch the transport mode, which indicates the trend for this switch.
Male students are approximately twice as likely to switch from car to bicycle. If the student lives with their family or a partner, the likelihood of switching from car to bus is 2 times higher. For working students, the probability of switching from car to bus is 1.5 times higher compared to that of those who are not working. For the bicycle, the probability is almost 2 times higher. A 5.6 times higher likelihood of switching to walking was also obtained.
With relevance to the increase in time for the car mode, the probability of switching exists, albeit small (i.e., less than 2% for all modes). This indicates that although time is an important variable, it may not be the main one. All institutions have a probability of switching to the bus mode in comparison with the reference located in the central area.
The scenario proposals stimulated the switch to all other transport modes. Offering accessible sidewalks would result in a 9 times greater chance of walking compared to low-quality sidewalks. Providing bike lanes would make switching from cars to bicycles 10 times more likely. If the time of commuting by bus is less than that when using a car, the likelihood of switching to the bus would be 2.5 times higher, while that for the lower cost would be 7 times higher.
Nevertheless, a more resistant group of 23 people (15%) who do not switch modes in any of the scenarios was identified. Furthermore, 56% chose to keep their cars in at least one of the scenarios. In half of the scenarios, the respondents remained with the car option. The bus was chosen in 32% of the scenarios (i.e., a switch from car to public transportation would be observed considering the hypothesis of improvements in buses).
Appendix C presents the proportion of choices for each transport mode according to the scenario responses.
In part C of the questionnaire, questions were also asked on a Likert scale and on questions to mark. Analyzing these responses, it is observed that approximately 70% of the respondents use the car because of its comfort and 20% consider the public transport of the city inefficient. It is worth remembering that only respondents who use the car as a current option answered this part of the questionnaire. This information is consistent with the profile of the sample when it was found that 61 people did not know how to ride a bus. In other words, some students may not know the public transport system and still evaluate it in a negative way.
Among respondents, 65% agreed with the statement that the bus fare is cheap. This information may be mistaken, because if drivers do not know how to ride a bus, they may be out of date on the fare. They also disagree about the existence of bus stops near their origin and destination to wait for public transport.
It is evident that there is a deficiency in the perception of the quality of the public transport service. Some students who use cars do not know how to ride a bus but still consider it a bad way. Making some improvements to the system itself, it is possible to carry out campaigns to instruct and encourage the use of this mode of transport.
Other questions about environmental aspects, such as understanding the car to be an agent that contributes to pollution, concern about the pollution generated by vehicles, and the perception of congestion, indicated that most drivers are aware of the impact of the individual vehicle on society. However, 45% responded that the car is absolutely necessary in their routine and 55% like to drive.
Students also expressed a desire to cycle to college (49%) and stated the absence of cycle paths (67%) mentioned by [6] as a barrier to using this mode. Concerning walking, 52% considered it dangerous to walk on their route.
According to the literature, cost and time are important factors for the user to make a decision. The results of the scenarios show that these variables are relevant for the Joinville student. To encourage the use of the bus, the ticket could reduce its value or justify the price charged by increasing the comfort or speed in commuting. Apparently, students who use the car do not see the price of the ticket as a worthwhile value for the quality of the bus service. The speed of the bus has reduced and this is a factor easily observable by the user. He prefers to stay in the jam in the comfort of his car rather than standing on the bus.
The variable “car situation” was not significant and therefore was not included in the model. This may have happened because students have always been able to park at the college free of charge and this may have generated a habit that prevented them from imagining the situation differently. Perhaps if at any time the college parking lot is partially blocked, the student will think about the influence of this variable.
Some working students said they would switch modes beyond the bus, including cycling and walking. Observing the improvements proposed by the scenarios, this behavior could be encouraged with the installation of changing rooms and cabinets to perform personal hygiene and store the user’s belongings, respectively. Assessing the different characteristics of users, to further encourage the use of these modes it would be interesting to see other factors that make men choose the bicycle more than women, such as public safety, for example.
Due to the ease of access to active modes, these modes of transport can be further explored so that their use increases. As they are modes that occupy less space on the roads, they can receive smaller but effective investments, such as adequate pavements, lighting and road signs.

6. Conclusions

To the best of our knowledge, no similar research has yet identified and analyzed the possible changes in the transportation mode choice among university students in Joinville. Being the IHE travel generator poles, student commutes can affect the performance of the urban transportation system.
This survey mainly aimed to contribute to the identification of the factors considered by the user to be the most relevant when deciding to switch from a transport mode used in their routine to another option.
The multinomial logit model for the revealed preference survey showed that the IHEs, age, gender, income, who the student lives with, and commute time are significant variables for the respondent’s choice of transport mode. In addition to the variables already mentioned, the improvements in the scenario also contributed to the choice switch in the stated preference survey model. The results indicate that students would be interested in switching from individual motor vehicles to other options. The mode with the greatest number of positive variables for switching was the bus, but the bicycle and walking modes were also of interest.
With the increase in car commute time and reduction in bus costs compared to the current values, students would switch to any other mode, as would working students. The results of the scenarios showed that cost and time are relevant variables for Joinville students, influencing the switch in the user’s choice for all other modes (i.e., bus, bicycle, and walking). Unlike in the literature, the restriction on the number of parking spaces was not important for the users.
Note that the possibility of quality reduction in car use causes users to switch transport modes. This idea is supported by the literature expressing that reducing the usefulness of cars reduces preference. At the same time, the need to improve other transport services is evident, giving the user the conditions to choose the best option for their routine.
This is the first study to evaluate the mode choices among city students. This exploratory research provides information that can help identify behavior patterns. A difference was observed between the modal split pointed out in 2010, indicating a reversal between public transportation and cars: students in this survey use buses more than the respondents in 2010. This public transportation mode can be used to keep them with this choice and motivate other users, thereby making this mode more attractive.
The city of Joinville proved promising for the development of new incentive measures for alternative modes to individual vehicles because there would be a demand for this transport switch. Aside from the students’ answers, the city counts on projects to improve the transportation system, such as the road plan revision. The data used for the transport surveys in Joinville were from 2010, back when the last origin-destination survey was conducted. The results described can serve as a basis for new studies and proposals for interventions according to demand.

Contributions and Future Research

The first direct contribution is to obtain a database. An example of data collection was developed through a free and digital platform through a computer or cell phone and Internet access. Considering that the school environment has computers and internet, even students who do not have these resources at home can participate in the research. In this way, more data can be collected with fewer resources than source-destination surveys that collect data by telephone or home interviews.
In approximately 3 months, 511 responses were collected. With the support and publicity of the city government, a much larger number could be reached among students, which would result in a larger representative of the population. This could contribute to generating a model that better portrays the reality of Joinville.
Another contribution of the article is the verification of the modal split considering the students of Joinville. Different results of modal choice were found compared to the last origin and destination survey of 2010. This may indicate that the data used for city planning is out of date and could be collected with a shorter interval to keep up to date.
In the presentation of scenarios that evaluated the change in the mode of transport, many stated that they would like to switch from the car to another mode. This result brings a positive signal, as it indicates that part of the users would be willing to not use the car anymore if there was a better quality mode of transport, especially for the bus. This can help to create and encourage public policies that favor other modes of transport to improve their quality. Verifying that there is potential public for other modes of transport can be a good argument for investing in the development of infrastructure that meets more sustainable modes, allowing the use of these modes more safely.
As this was the first survey on modal choice and possible changes in the travel behavior of residents of Joinville, many other surveys can be developed to continue the study. It is suggested to compare the method adopted with others to assess the quality of the model, as well as to increase the number of responses, obtaining greater coverage and conducting research with other sectors of the city that also generate flow of people, such as the industrial sector.
Another point was the need to use an experimental design that did not keep all combinations as scenarios. That is to say, of 64 combinations generated by the orthogonal factorial, only 8 were used. In another study, this could be solved by presenting the scenarios in blocks.
Looking at the research in general, it is worth highlighting some issues that can be improved in future research. For the construction of part C of the questionnaire, it was necessary to reduce the factors that would generate the combinations for the development of hypothetical scenarios. At this point, even if preliminary research has been carried out, important factors may have been ruled out. Factors such as comfort and safety, for example, were not addressed and may have affected the students’ response.

Author Contributions

Conceptualization, T.F.S. and S.B.L.; methodology, T.F.S., E.H. and S.B.L.; software, T.F.S. and E.H.; validation, T.F.S. and E.H.; formal analysis, T.F.S., E.H. and S.B.L.; investigation, T.F.S. and E.H.; resources, T.F.S. and E.H.; data curation, T.F.S. and E.H.; writing—original draft preparation, T.F.S. and E.H.; writing—review and editing, T.F.S., E.H. and S.B.L.; visualization, T.F.S., E.H. and S.B.L.; funding acquisition, E.H. All authors have read and agreed to the published version of the manuscript.

Funding

This research received no external funding.

Acknowledgments

The authors would like to acknowledge Santa Catarina State University (UDESC), Postgraduate Monitoring Scholarship Program (PROMOP) for the financial support for this research.

Conflicts of Interest

The authors declare no conflict of interest.

Appendix A

Table A1. Scenarios.
FactorsAttributesScenario 1Scenario 2Scenario 3Scenario 4Scenario 5Scenario 6Scenario 7Scenario 8
Accessible sidewalkYesxxxx
No xxxx
Exclusive bike laneYesxx xx
No xx xx
Infrastructure at destinationIdealx x x x
Minimum x x x x
Bus timeSmallerx x x x
Just like the car x xx x
Bus cost50% of currentlyx x xx
Same as today xx x x
Car situationSame as todayxx xx
With restriction xxxx

Appendix B

Table A2. Survey sample characteristics.
VariableLevelsFrequencyPercentage (%)
Age—age groupBetween 18 and 25 years old43285%
(continuous numerical variable)Between 26 and 30 years old5213%
Over 31 years old273%
GenderFemale *30259%
Male20941%
Income Up to two m.w. *13927%
(minimum wage = m.w.)Three to five m.w.22444%
Six to nine m.w.9519%
Over ten m.w.5310%
Marital statusSingle45188%
Married *6012%
Lives withWith family/partner38776%
With friends *5110%
Alone7314%
WorkYes25049%
No *26151%
Has childrenYes306%
No *48194%
Can ride a bikeYes47593%
No *367%
Has a bikeYes25450%
No *25750%
You know how to use busesYes45088%
No *6112%
CityJoinville *48294%
Other296%
IHEIHE_A10922%
IHE_B12324%
IHE_C19341%
IHE_D *8613%
Type of IHEPrivate *27955%
Public23245%
Course typeGraduation *48094%
Postgraduate316%
Course phaseStart *11923%
Half29057%
Graduating10220%
Travel modeCar *15029%
Bus18436%
Bicycle459%
Walking459%
Carpooling5811%
Other296%
Travel time0 to 10 min5511%
(continuous numerical variable)11 to 20 min17434%
21 to 30 min9519%
31 to 40 min438%
More than 41 min14428%
* Reference.

Appendix C

Table A3 presents the proportion of choices for each transport mode according to the user responses to the eight scenarios in Part C of the questionnaire.
The last column of Table A3 represents the proportion of times the mode was selected considering the sum of all eight scenarios.
Table A3. Proportion of transport mode choice in the scenarios.
Scenarios Modes12345678Sum
Car27%66%61%41%59%29%56%77%52%
Bus47%9%27%50%7%57%38%21%32%
Bicycle23%21%5%3%33%14%5%1%13%
Walking3%3%6%6%1%1%1%03%

References

  1. Instituto Brasileiro de Geografia e Estatistica. Estimativas da População Residente Com Data De Referência: 1o de julho de 2018. Available online: https://cidades.ibge.gov.br/brasil/sc/joinville/panorama (accessed on 22 August 2018).
  2. Weng, J.; Tu, Q.; Yuan, R.; Lin, P.; Chen, Z. Modeling Mode Choice Behaviors for Public Transport Commuters in Beijing. J. Urban Plan. Dev. 2018, 144, 1–9. [Google Scholar] [CrossRef]
  3. Stradling, S.; Carreno, M.; Rye, T.; Noble, A. Passenger perceptions and the ideal urban bus journey experience. Transp. Policy 2007, 14, 283–292. [Google Scholar] [CrossRef]
  4. Creemers, L.; Tormans, H.; Bellemans, T.; Janssens, D.; Wets, G. Knowledge of the concept Light Rail Transit: Exploring its relevance and identification of the determinants of various knowledge levels. Transp. Res. Part A Policy Pract. 2015, 74, 31–43. [Google Scholar] [CrossRef]
  5. Ryley, T.J. The propensity for motorists to walk for short trips: Evidence from West Edinburgh. Transp. Res. Part A Policy Pract. 2008, 42, 620–628. [Google Scholar] [CrossRef] [Green Version]
  6. Nkurunziza, A.; Zuidgeest, M.; Brussel, M.; Maarseveen, M.V. Examining the potential for modal change: Motivators and barriers for bicycle commuting in Dar-es-Salaam. Transp. Policy 2012, 24, 249–259. [Google Scholar] [CrossRef]
  7. Lattarulo, P.; Masucci, V.; Pazienza, M.G. Resistance to change: Car use and routines. Transp. Policy 2019, 74, 63–72. [Google Scholar] [CrossRef]
  8. Munshi, T. Built environment and mode choice relationship for commute travel in the city of Rajkot, India. Transp. Res. Part D Transp. Environ. 2016, 44, 239–253. [Google Scholar] [CrossRef]
  9. Thomas, T.; Puello, L.L.P.; Geurs, K. Intrapersonal mode choice variation: Evidence from a four-week smartphone-based travel survey in the Netherlands. J. Transp. Geogr. 2019, 76, 287–300. [Google Scholar] [CrossRef]
  10. Hu, H.; Xu, J.; Shen, Q.; Shi, F.; Chen, Y. Travel mode choices in small cities of China: A case study of Changting. Transp. Res. Part D Transp. Environ 2018, 59, 361–374. [Google Scholar] [CrossRef]
  11. Toşa, C.; Sato, H.; Morikawa, T.; Miwa, T. Commuting behavior in emerging urban areas: Findings of a revealed preferences and stated-intentions survey in Cluj-Napoca, Romania. J. Transp. Geogr. 2018, 68, 78–93. [Google Scholar] [CrossRef]
  12. Whalen, K.E.; Páez, A.; Carrasco, J.A. Mode choice of university students commuting to school and the role of active travel. J. Transp. Geogr. 2013, 31, 132–142. [Google Scholar] [CrossRef]
  13. Nguyen-Phuoc, D.Q.; Amoh-Gyimah, R.; Tran, A.T.P.; Phan, C.T. Mode choice among university students to school in Danang, Vietnam. Travel Behav. Soc. 2018, 13, 1–10. [Google Scholar] [CrossRef]
  14. Busch-Geertsema, A.; Lanzendorf, M. From university to work life—Jumping behind the wheel? Explaining mode change of students making the transition to professional life. Transp. Res. Part A Policy Pract. 2017, 106, 181–196. [Google Scholar] [CrossRef]
  15. Pojani, D.; Boussauw, K. Keep the children walking: Active school travel in Tirana, Albania. J. Transp. Geogr. 2014, 38, 55–65. [Google Scholar] [CrossRef] [Green Version]
  16. Amoh-Gyimah, R.; Aidoo, E.N. Mode of transport to work by government employees in the Kumasi metropolis, Ghana. J. Transp. Geogr. 2013, 31, 35–43. [Google Scholar] [CrossRef]
  17. Kaffashi, S.; Shamsudin, M.N.; Clark, M.S.; Sidique, S.F.; Bazrbachi, A.; Radam, A.; Adam, S.U.; Rahim, K.A. Are Malaysians eager to use their cars less? Forecasting mode choice behaviors under new policies. Land Use Policy 2016, 56, 274–290. [Google Scholar] [CrossRef]
  18. Anwar, A.M.; Yang, J. Examining the effects of transport policy on modal shift from private car to public bus. Procedia Eng. 2017, 180, 1413–1422. [Google Scholar] [CrossRef]
  19. Frei, C.; Hyland, M.; Mahmassani, H.S. Flexing service schedules: Assessing the potential for demand adaptive hybrid transit via a stated preference approach. Transp. Res. Part C Emerg. Technol. 2017, 76, 71–89. [Google Scholar] [CrossRef]
  20. Idris, A.O.; Habib, K.M.N.; Shalaby, A. An investigation on the performances of mode shift models in transit ridership forecasting. Transp. Res. Part A Policy Pract. 2015, 78, 551–565. [Google Scholar] [CrossRef]
  21. Dell’olio, L.; Bordagaray, M.; Ibeas, A. A methodology to promote sustainable mobility in college campuses. Transp. Res. Proc. 2014, 3, 838–847. [Google Scholar] [CrossRef] [Green Version]
  22. Nesheli, M.M.; Ceder, A.; Estines, S. Public transport user’s perception and decision assessment using tactic-based guidelines. Transp. Policy 2016, 49, 125–136. [Google Scholar] [CrossRef]
  23. Delmelle, E.M.; Delmelle, E.C. Exploring spatio-temporal commuting patterns in a university environment. Transp. Policy 2012, 21, 1–9. [Google Scholar] [CrossRef]
  24. Cools, M.; Fabbro, Y.; Bellemans, T. Free public transport: A socio-cognitive analysis. Transp. Res. Part A Policy Pract. 2016, 86, 96–107. [Google Scholar] [CrossRef] [Green Version]
  25. Melia, S.; Clark, B. What happens to travel behaviour when the right to park is removed? Transp. Policy 2018, 72, 242–247. [Google Scholar] [CrossRef]
  26. Minal, S.M.; Chalumuri, R.S. Commuter’s sensitivity in mode choice: An empirical study of New Delhi. J. Transp. Geogr. 2016, 57, 207–217. [Google Scholar]
  27. Buehler, R. Determinants of transport mode choice: A comparison of Germany and the USA. J. Transp. Geogr. 2011, 19, 644–657. [Google Scholar] [CrossRef]
  28. Secretaria de Planejamento Urbano e Desenvolvimento. Joinville Cidade em Dados: Características Gerais; Prefeitura de Joinville/SC: Joinville, Brazil, 2018. [Google Scholar]
  29. Secretaria de Planejamento Urbano e Desenvolvimento. Joinville Cidade em Dados: Mobilidade; Prefeitura de Joinville/SC: Joinville, Brazil, 2018. [Google Scholar]
  30. Secretaria de Planejamento Urbano e Desenvolvimento. Joinville Cidade em Dados: Promoção Social; Prefeitura de Joinville/SC: Joinville, Brazil, 2018. [Google Scholar]
  31. Ortuzár, J.D.D.; Willumsen, L.G. Modelling Transport, 4th ed.; John Wiley & Sons Ltd.: Chichester, UK, 2011. [Google Scholar]
  32. Greene, W.H. Econometric Analysis, 5th ed.; Prentice Hall: Upper Saddle River, NJ, USA, 2002. [Google Scholar]
  33. Bierlaire, M. Biogeme: A free package for the estimation of discrete choice models. In STRC 2003 3rd Swiss Transport Research Conference; Monte Verita: Ascona, Switzerland, 2003. [Google Scholar]
  34. The R Development Core Team. R: A Language and Environment for Statistical Computing; R Foundation for Statistical Computing: Vienna, Austria, 2019. [Google Scholar]
  35. Croissant, Y. Mlogit Multinomial Logit Model, R package version 0.2-4; 2013; Available online: https://www.r-project.org//package=mlogit (accessed on 18 April 2019).
  36. Venables, W.N.; Ripley, B.D. Modern Applied Statistics with S, 4th ed.; Springer: New York, NY, USA, 2002. [Google Scholar]
  37. Groemping, U. R Package DoE.base for Factorial Designs. J. Stat. Softw. 2018, 85, 1–41. [Google Scholar]
  38. QGIS Development Team. QGIS Geographic Information System; Open Source Geospatial Foundation Project; 2019; Available online: http://qgis.osgeo.org (accessed on 1 April 2019).
  39. European Commission. Cidades para Bicicletas, Cidades de Futuro; Serviço das Publicações Oficiais das Comunidades Europeias: Luxemburgo, 2000. [Google Scholar]
  40. Cumming, I.; Weal, Z.; Afzali, R.; Rezaei, S.; Idris, A.O. The impacts of office relocation on commuting mode shift behaviour in the context of Transportation Demand Management (TDM). Case Stud. Transp. Policy 2019, 7, 346–356. [Google Scholar] [CrossRef]
  41. López, M.C.R.; Wong, Y.D. Attitudes towards active mobility in Singapore: A qualitative study. Case Stud. Transp. Policy 2017, 5, 662–670. [Google Scholar] [CrossRef]
  42. Batur, I.; Koç, M. Travel Demand Management (TDM) case study for social behavioral change towards sustainable urban transportation in Istanbul. Cities 2017, 69, 20–35. [Google Scholar] [CrossRef]
  43. Morfoulaki, M.; Myrovali, G.; Kotoula, K. Increasing the attractiveness of public transport by investing in soft ICT based measures: Going from words to actions under an austerity backdrop e Thessaloniki’s case, Greece. Res. Transp. Econ. 2015, 51, 40–48. [Google Scholar] [CrossRef]
Figure 1. Joinville location [28].
Sustainability 12 05232 g001
Figure 2. Factors.
Figure 2. Factors.
Sustainability 12 05232 g002
Figure 3. Joinville and respondent choices.
Sustainability 12 05232 g003
Table 1. Factors influencing the switch of the transport mode choice.
Factors
Costs (travel, parking)Frequency (time)
DistanceThe time within the transport mode (time)
ComfortSeat availability (capacity)
Exclusive lane availabilityAccess to college (from parking to college)
Structure at destinationAccess to the transport mode (time)
Table 2. Sections of the questionnaire.
PartDescription
Part ACharacterization of respondentsInstitution of higher education, course, period, age, gender, income, marital status, if they work, if they have children, if they know how to ride a bike, etc.
Part BRevealed preference: description of current commuteTransport mode currently used, commute time, commute routine, travel time, etc.
Part CStated-preference: analysis of switch in transport mode choiceEight scenarios with different infrastructure or current transportation system situations, with four options each (walking, by bicycle, bus, and car).
Table 3. Sample characteristics by transport mode.
LevelsTransport Mode (%)
CarBusBicycleWalkingCarpoolOtherTotal
15018445455829511
Gender
Female29.839.15.09.611.94.6302
Male28.731.614.47.710.57.2209
Income
Up to 2 m.w.18742.410.813.711.52.9139
3 to 5 m.w.28.137.97.66.312.08.0224
6 to 9 m.w.36.830.59.57.411.64.295
Over ten m.w.49.120.87.59.47.55.753
Marital status
Single26.836.88.69.812.45.5451
Married48.330.010.01.73.36.760
Lives with
family/partner29.541.18.35.48.87.0387
With friends31.49.815.79.831.42.051
Alone27.427.46.82610.91.473
Work
Yes27.239.29.66.87.210.0250
No31.433.08.010.715.31.5261
Has children
Yes43.333.33.310.010.0030
No28.536.29.18.711.46.0481
Can ride a bike
Yes29.935.29.58.411.65.5475
No22.247.2013.98.38.336
Has a bike
Yes25.633.117.78.78.76.3254
No33.138.908.914.05.1257
Knows how to use buses
Yes26.240.78.78.711.14.7450
No52.51.69.89.813.113.161
City
Joinville29.437.59.19.311.63.0482
Other28.0103.007.052.029
IHE
IHE_A26.633.013.819.34.62.8109
IHE_B35.833.37.3022.01.6123
IHE_C24.442.57.37.38.89.8193
IHE_D34.929.18.111.610.55.886
Type of IHE
Private27.638.47.58.69.38.6279
Public31.533.210.39.113.82.2232
Course phase
Start17.647.18.47.613.45.9119
Half32.433.87.910.711.43.8290
Graduating34.329.411.84.98.810.8102
Travel time (min) 511
Mean24.2 (24.4)55.1 (28.1)23.9 (11.1)16.6 (11.9)22.2 (8.15)55.5 (38.6)
Age
Mean24.73 (5.68)21.21 (3.62)23.56 (4.72)21.87 (3.68)21.28 (2.83)21.52 (2.78)
Standard deviation is in brackets.
Table 4. Model 1 estimates.
Significant VariablesCoefficientsStandard ErrorOR2.5%97.5%
Age
Bus−0.1970.057 ***0.8200.7330.917
Walking−0.1520.070 *0.8580.7470.985
Gender
FemaleReference
Male
Bicycle1.8390.535 ***6.2922.2040.179
Income
Up to two m.w.Reference
Three to five m.w.
Bus−0.9400.5150.3900.1421.073
Bicycle−1.1570.6000.31420.0961.019
Walking−1.4760.676*0.2280.0600.860
Over ten m.w.
Bus−1.6690.019*0.2110.0510.865
Bicycle−1.7420.835*0.1750.0340.900
Lives with
FriendReference
Family/companion
Bicycle−1.8350.920 *0.1950.0260.968
Walking−2.7641.188 *0.0620.0060.647
Alone (a)
Bicycle−1.6570.9580.1900.0291.247
Travel time
Bus0.1130.016 ***1.1201.0841.157
Bicycle0.0430.020 *1.0431.0031.085
IHE
IHE_DReference
IHE_A
Walking1.5310.789.4.6230.9842.17
IHE_B
Bus−1.8760.729 **0.1530.0370.629
Bicycle−2.3340.940 *0.0960.01530.612
Accuracy0.724
95% CI(0.669, 0.775)
Kappa index0.565
Values of ρ2
McFadden0.377
Adjusted McFadden0.272
Nagelkerke0.6534
Cox and Snell0.593
Testing the likelihood ratio258,18
(p-value < 0.001)
AIC498,20
SensitivitySpecificity
Car0.7640.828
Bus0.8610.813
Walking0.5510.968
Bicycle0.1870.964
Significance. codes: 0 ‘***’ 0.001 ‘**’ 0.01 ‘*’ 0.05 ‘.’ 0.1. The odds ratio (OR) for the significant coefficients of Model 1 show that if the coefficient results are smaller than one, it becomes more likely to choose the reference category (car).
Table 5. Model 2 estimates.
Significant VariablesCoefficientsStandard ErrorOR2.5%97.5%
Gender
FemaleReference
Male
Bus−0.5880.164 ***0.5550.403 0.765
Bicycle0.6410.214 ***1.8981.2462.889
Income:
Up to two m.w.Reference
Over ten m.w.
Bus−0.6110.273 *0.5420.3170.926
Lives with:
FriendReference
Family/partner
Bus0.7910.286 **2.2061.2583.867
Work
NoReference
Yes
Bus0.4200.173 *1.5221.119 2.965
Bicycle0.5990.248 *1.8221.0832.139
Walking1.7340.510 ***5.6682.08315.423
IHE: IHE_D Reference
IHE_A
Bus1.3060.266 ***3.69432.190 6.230
IHE_B
Bus1.7390.269 ***5.6953.355 9.668
IHE_C
Bus0.9710.225 ***2.6421.696 4.114
Bicycle−0.5380.2900.5830.3301.031
Walking−1.8140.684 **0.1620.0420.623
Travel time
Bus0.0070.0371.0070.9991.014
Bicycle0.0120.004 **.1.0131.0041.021
Walking0.0110.0061.0110.998 1.023
Scenario variables
Accessible _ sidewalk
NoReference
Yes
Bus0.3620.148 *1.4361.0741.921
Walking2.3420.619 ***10.4063.093e35.011
Bike_lane
NoReference
Yes
Bicycle2.3060.256 ***10.0396.07016.602
Infrastructure
IdealReference
Minimum
Bicycle−0.7250.205 ***
Time
SameReference
Less
Bus0.9240.161 ***2.5201.8363.459
Bus_cost
SameReference
Smaller
Bus1.9560.163 ***7.0715.130 9.746
Walking0.8650.394 *2.3761.097 5.143
Significance codes: 0 ‘***’ 0.001 ‘**’ 0.01 ‘*’ 0.05 ‘.’ 0.1. -.

