Article

Secular Trends in the Achievement of Physical Activity Guidelines: Indicator of Sustainability of Healthy Lifestyle in Czech Adolescents

1
Faculty of Physical Culture, Palacký University Olomouc, 771 11 Olomouc, Czech Republic
2
Institute of Sport Science, The Jerzy Kukuczka Academy of Physical Education, 40-065 Katowice, Poland
3
Faculty of Education, University of West Bohemia, 301 00 Plzeň, Czech Republic
4
Faculty of Science, Humanities and Education, Technical University of Liberec, 460 15 Liberec, Czech Republic
*
Author to whom correspondence should be addressed.
Sustainability 2020, 12(12), 5183; https://doi.org/10.3390/su12125183
Submission received: 5 June 2020 / Revised: 18 June 2020 / Accepted: 23 June 2020 / Published: 25 June 2020
(This article belongs to the Special Issue Physical Education, Health Promotion, and Sustainability)

Abstract

:
(1) Background: The increasing socio-economic and educational demands on adolescents should be reflected in their lifestyles accordingly. The aim of the study was therefore to identify the trends in the achievement of physical activity (PA) guidelines by Czech adolescents through objective and subjective PA monitoring. (2) Methods: The research was carried out between 2010 and 2017 and involved 49 secondary schools, 2 higher vocational schools, and 8 universities in the Czech Republic. In total, the projects involved 1129 girls and 779 boys. PA monitoring was performed by Yamax SW-700 pedometers and IPAQ-long questionnaires. (3) Results: The results according to the average number of steps/day confirm a decrease in the amount of PA in boys and girls and in the achievement of the recommended 11,000 steps/day. However, the estimates of meeting the recommended weekly PA expressed as MET-min/week based on the IPAQ-long questionnaire are not so convincing about the decrease. (4) Conclusions: The combination of objective monitoring of weekly PA using wearables and subjective estimates of weekly PA using a questionnaire regarding the ease of application, appears to be a sufficient indicator of the status of and trend in PA and thus the sustainability of a healthy lifestyle in youths.

1. Introduction

The growing burden on adolescents in education and information-technology areas [1,2] or in socio-economic areas brings health risks [3] that require an adequate response concerning the lifestyle of youths. The requirements for changes to support a healthy lifestyle in adolescents [4] respond to an increase in sedentary behaviour [5,6,7] and a decrease in physical activity (PA) and physical fitness in youths globally [8,9,10]. The call for action in getting to know the trends in levels and structures of PA is apparent in research methods [1,7,8]. In adolescents, the most important observation highlighted a decrease in vigorous PA (VPA) [11], which is primarily associated with cardiorespiratory fitness [12]. However, according to Booth, Rowlands, and Dollman [13], there is little evidence of the decrease in PA among children and adolescents. Moreover, interventions for improving muscular fitness in adolescent boys demonstrated small-to-moderate effects [14].
A firm association between the level of PA and sedentary behaviour on the one hand and a high prevalence of overweight and obesity in children and adolescents on the other has been globally demonstrated [15]. The severity of the condition does not change, although the trends in overweight and obesity in children and adolescents, for example in most European countries, have stabilized [16,17]. In recent decades, however, the indicators of mental health in adolescents have become significantly worse, including depressive symptoms, anxiety, and others [18,19]. “The Lancet Commission” calls for a global solution [20]. A challenge for Czech schools is the fact that almost 25% of adolescents in secondary schools show depression symptoms and academic stress [21].
Decreasing PA and increasing sedentary behaviour is also reflected in the meeting of PA guidelines. A significant number of youths fail to achieve the recommendation of at least 60 min PA/day [22] or the guidelines for school PA [23,24,25], leisure PA [26], or active transport [27]. Objective and subjective measures allow us to get estimates for meeting such guidelines from a long-time perspective.
In the Czech Republic, there has also been a decrease in PA and an increase in sedentary behaviour in youths [10,28] accompanied by non-achievement of PA guidelines in the main segments of the school day, i.e., before school, during school, and after school [21,24,29]. Most adolescent girls and boys also fail to meet the recommendations on active travel on at least five or more days per week for 30 or more minutes [30].
In the structure of weekly PA, higher PA on school days as opposed to weekend days has long been confirmed [31,32,33,34]. In the Central European region, the least PA was observed on Sunday among secondary school students [2,32]. In the Czech Republic and Poland, the most physically active day for adolescents is Friday [29,32].
According to the authors of the present paper, a serious problem is that it is impossible to maintain an adequate level of health and life satisfaction considering the long-term decreasing PA and increasing sedentary behaviour trends and, at the same time, meet the increasing demands on academic performance of adolescents in schools. Therefore, the following research questions have been formulated: What are the differences in the meeting of PA guidelines in girls and boys monitored in two-year stages over a period of eight years? What are the differences in PA trends monitored by pedometers and estimated by questionnaires? Does the weekly PA structure change over time?
The aim of the study was to identify the trends in the achievement of physical activity guidelines by Czech adolescents through objective and subjective PA monitoring.

2. Materials and Methods

2.1. Participants and Setting

The research involved 49 secondary schools, 2 higher vocational schools, and 8 universities in the Czech Republic, and it was performed in spring (April to June) and autumn (September to November) between 2010 and 2017. During the research period, there were no extreme seasonal differences in weather. The secondary schools were selected according to the placement of student teachers training, but with proportional correction by type of school (general, vocational, apprentice) and size of the location (<30,000; 30,000–100,000; >100,000 inhabitants). Higher vocational schools and universities were selected according to established long-term research cooperation. In these schools, the research involved first-year students. In total, the research involved 1129 girls and 779 boys aged 15–19 years (Table 1). Only 15.8% of boys and 8.4% of girls were in the overweight and obese category. Students with regular swimming and or sports training that did not allow the use of wearables were involved in the monitoring, but their results were not included in the final sample.

2.2. Measures

2.2.1. Objective Monitoring of Step Counts

Throughout the whole period of the research, objective monitoring of weekly PA was performed by Yamax Digiwalker SW-700 pedometers (Yamax Corporation, Tokyo, Japan), which are suitable devices for monitoring habitual PA [35]. The participants wore the pedometers on the hip in the region of the body’s centre of gravity throughout the whole day (except during showering and swimming) until their evening personal hygiene activities before bed. Measures worn on the hip appear to be most suitable and sufficiently accurate [1].
The data were cleaned in compliance with the recommendation by Tudor-Locke at al. [36]; therefore, data in the range of 1000–30,000 step/days were used. Furthermore, records of at least three school days and one weekend day were used in compliance with the requirements for accelerometer monitoring [37]. Any missing school days in the record were replaced by the closest preceding school day and the first missing day by the following day. A missing weekend day was replaced by any recorded weekend day. Due to non-compliance with the requirements, a total of 153 participants were removed from the dataset, and 124 data were complemented with daily step counts.
According to Adams, Johnson, and Tudor-Locke [38], the recommendation of ≥ 60 min/day of moderate-to-vigorous physical activity (MVPA) would ideally correspond to 11,500–14,000 steps/day; therefore, the recommendation on the daily number of steps was determined identically to other research studies [21,39,40], i.e., 11,000 steps/day.

2.2.2. Subjective Estimates of Physical Activity

The weekly participants’ PA was examined using the Czech version of the “International Physical Activity Questionnaire—long form” (IPAQ-LF) [41], which allows more detailed analyses of the weekly structure of PA in young and middle-aged adults (15–69 years). Its use for adolescents aged 15–17 significantly correlated for time spent in active travel and for moderate and vigorous activities as well as for total physical activity [42,43]. The Czech version was subject to the required translation procedure according to the “EORTC Quality of Life Group” [44] and empirically verified in international comparative studies [2,34,40]. Since our experience and empiric results indicate the overestimation of time spent doing vigorous PA and the underestimation of time spent sitting [45] and the data adjustments according to the IPAQ-LF manual affect the composition of weekly PA, our procedure was as follows: (a) compared to the IPAQ-LF manual, the MET-min of vigorous PA (VPA) was multiplied by six instead of the recommended multiplication by eight to reduce overestimation in this variable; (b) estimated minutes in each type of PA, sitting, and transportation (travel in a motor vehicle, e.g., train, bus, car, or tram) over a week were converted to average minutes of PA per day; (c) the maximum average daily sum of PA, transportation, and sitting was set at 960 min. A total of 116 respondents were removed from the dataset for non-compliance with these criteria.
The PA recommendation based on the results of the IPAQ-LF questionnaire was set at 60 min of MVPA on 5 or more days per week, which is closest to the generally acknowledged recommendations according to Healthy People 2020 [46], 2008 Physical Activity Guidelines for Americans [47], and EU Physical Activity Guidelines [48].

2.2.3. Design and Procedures

At the initial meeting in the computer room, all participants registered in the web application “International Database for Research and Educational Support” (Indares) (www.indares.com). The participants were informed about the method of data processing and compliance with the General Data Protection Regulation in the European Union in the Indares web application.
Further procedure: (a) Completion of individual identification characteristics; (b) presentation of pedometers, method of wearing, and recording of time and steps; (c) subjective evaluation of PA for the past 7 days in the IPAQ-LF questionnaire; (d) on the following day, initiation of weekly PA pedometer monitoring; (e) after a week, pedometers and record sheets were returned and; (f) usually within 2 to 3 weeks, there was a submission of feedback on group achievement of PA recommendations and information on the possibilities of analysis of individual results using the Indares web application.

2.2.4. Statistical Analysis

The Statistica version 13 (StatSoft, Prague, Czech Republic) and SPSS version 25 (IBM, Armonk, NY: IBM Corp.) software was used for the statistical analyses. Descriptive characteristics and cross tables to assess the differences in compliance with the PA guidelines were used. The Kruskal–Wallis ANOVA and Mann–Whitney U test were used to investigate the differences in PA by MET-min and the four time stages (I—2010–2011; II—2012–2013; III—2014–2015; IV—2016–2017). To determine the difference in PA by steps/day and time stages, One-Way ANOVA and the Scheffe post-hoc test were used. To analyse the structure of weekly PA, Repeated Measures ANOVA and the Scheffe post-hoc test were used. The practical significance was estimated using the η2, ηp2, and w coefficients [49,50], which were interpreted as follows: η2: 0.01–0.059 small, 0.06–0.139 medium, and ≥ 0.14 large effect size and w: 0.1–0.29 small, 0.3–0.49 medium, and ≥ 0.5 large effect size. Statistical significance was set at a level of p ≤ 0.005.

3. Results

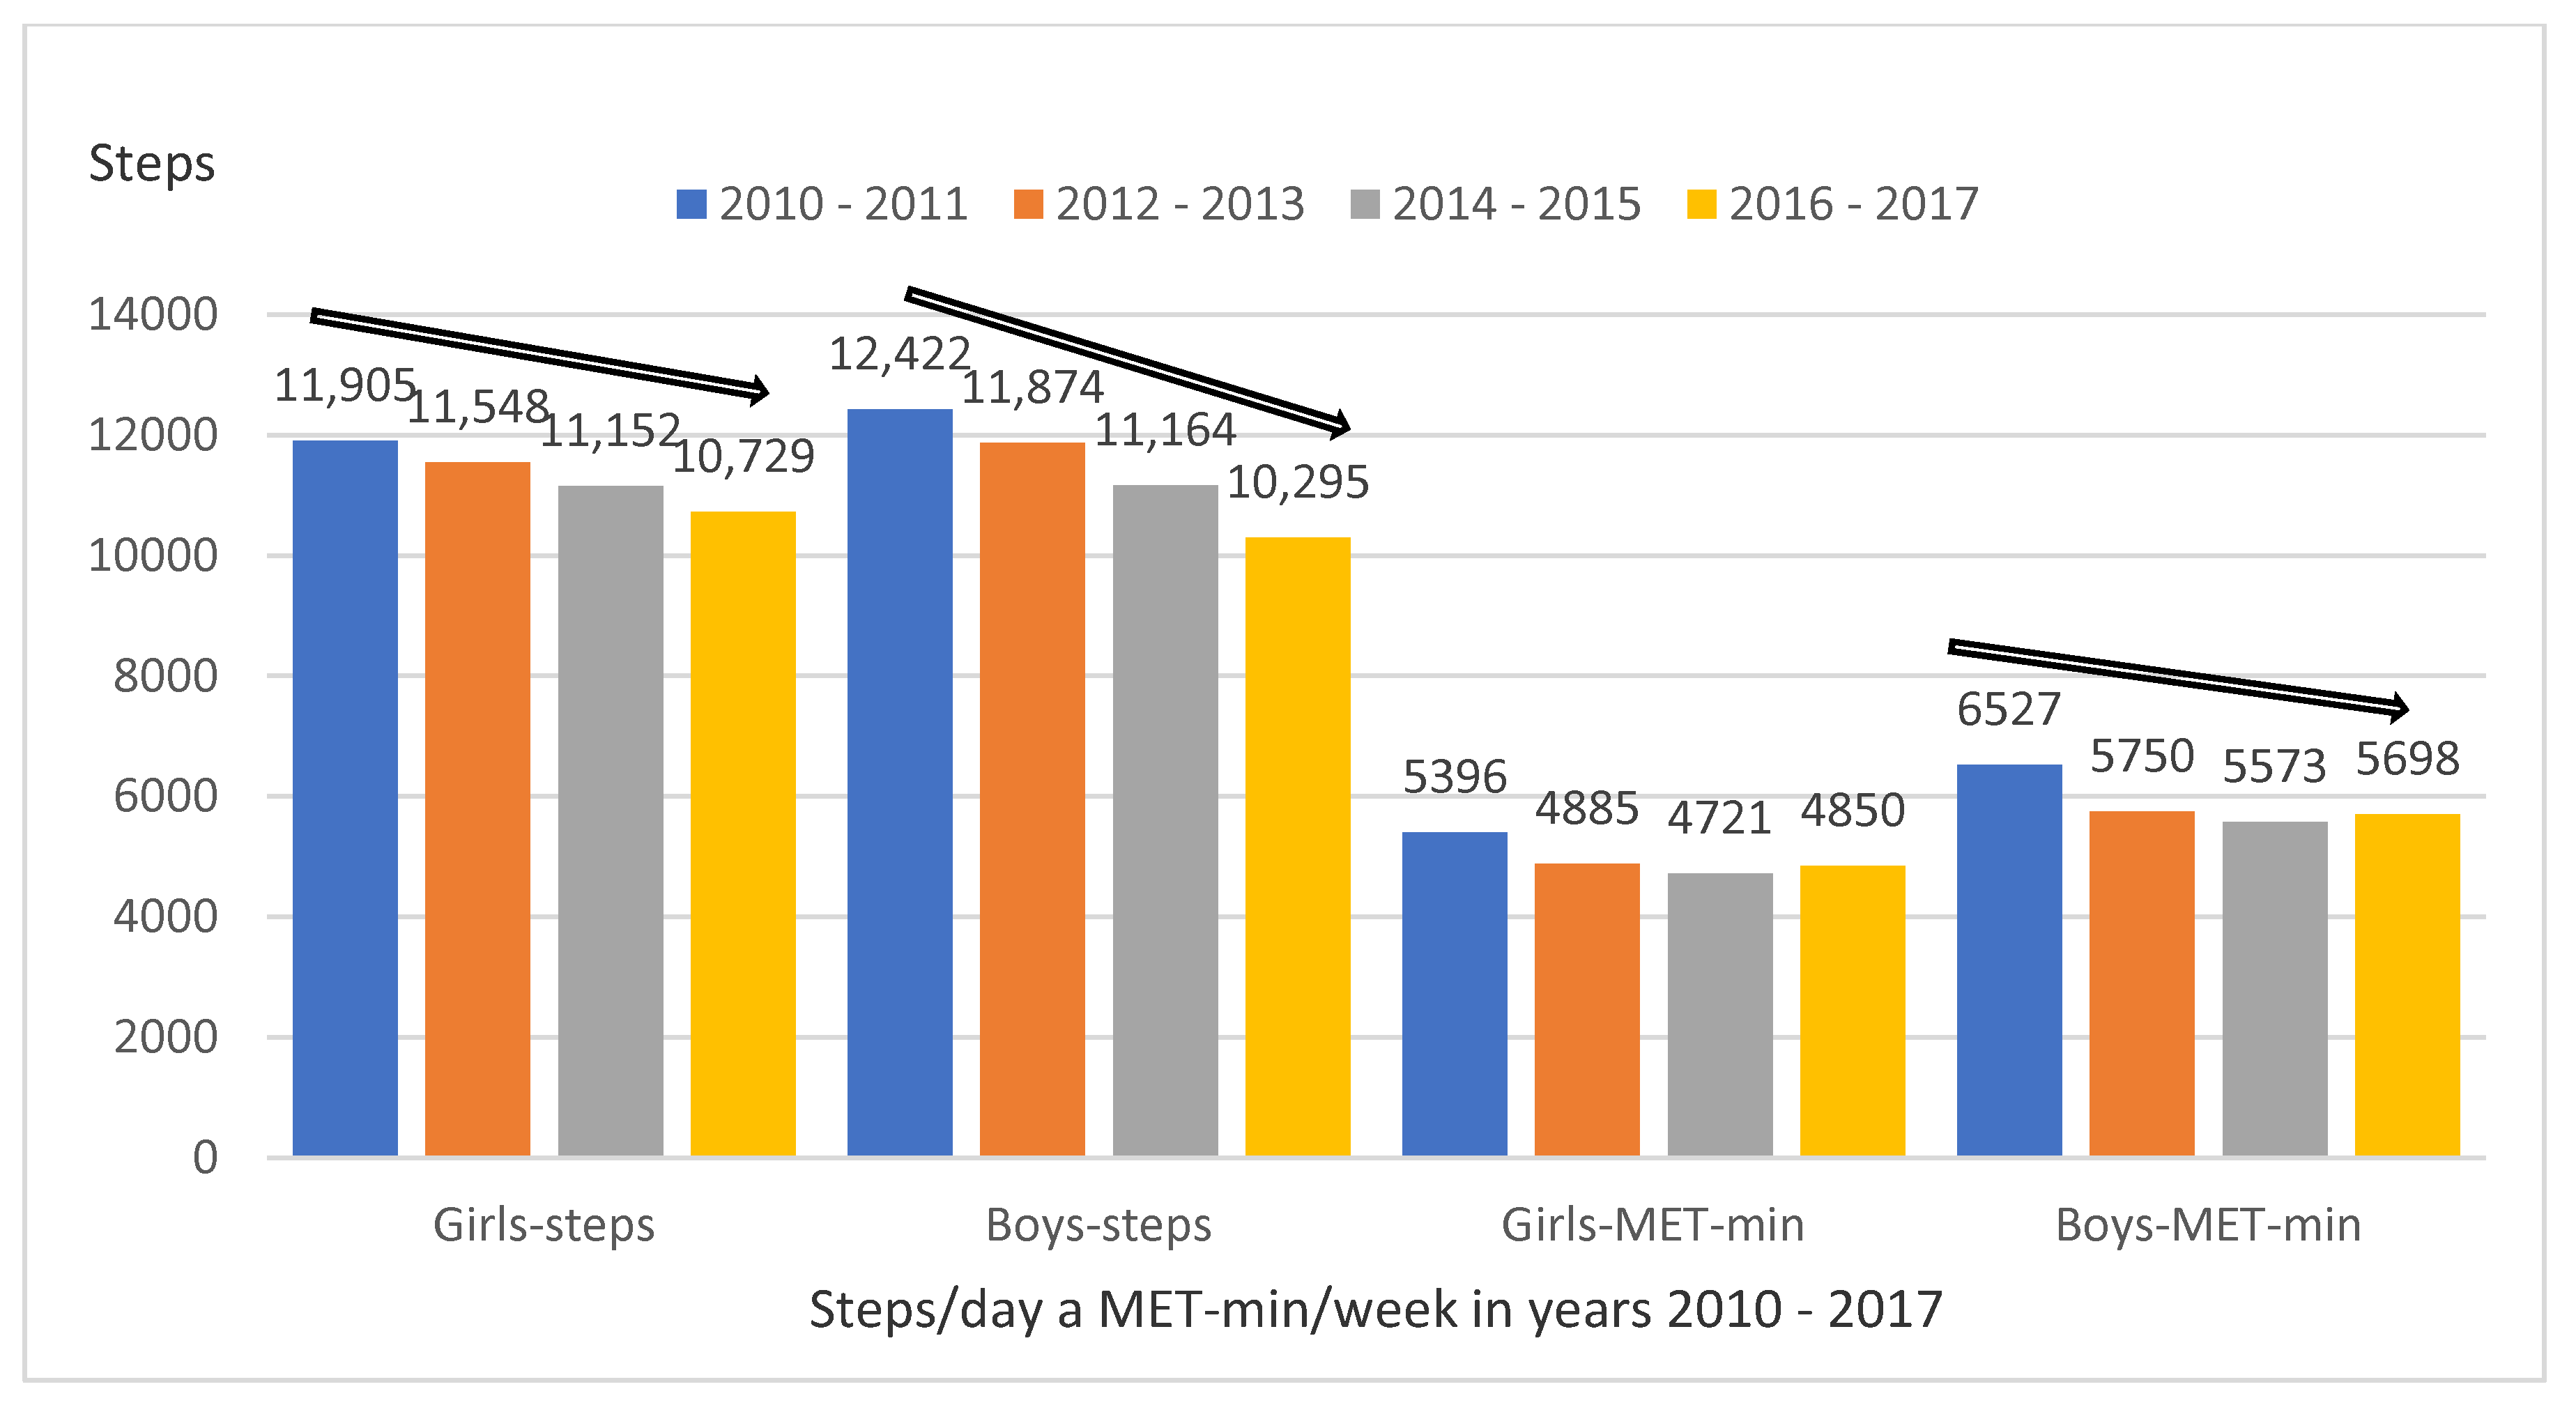
3.1. Trends in Physical Activity By Average Daily Number of Steps and Using the IPAQ-LF Questionnaire

Between time stages 2010–2011 and 2016–2017, a statistically significant decrease was observed in the number of steps/day in girls (F(3,1125) = 8.09, p < 0.001; ηp2 = 0.021) as well as boys (F(3,775) = 15.34, p < 0.001; ηp2 = 0.056) (Figure 1). The differences according to the estimate of weekly PA by the IPAQ-LF questionnaire between MET-min/week were statistically significant in boys (F(3,775) = 2.88, p = 0.035; ηp2 = 0.011) but not in girls (F(3,1125) = 2.11, p = 0.097; ηp2 = 0.006).
In the interaction between sex, school level, and time stages (2 sex × 2 secondary and tertiary schools × 4 time stages) the differences were not statistically significant for steps/day (F(16,1892) = 0.79, p = 0.497, ηp2 = 0.001) or MET-min/week (F(16,1892) = 1.02, p = 0.384, ηp2 = 0.002). This suggests that the type of school variable does not play a significant role in the decrease of PA over the time stages.

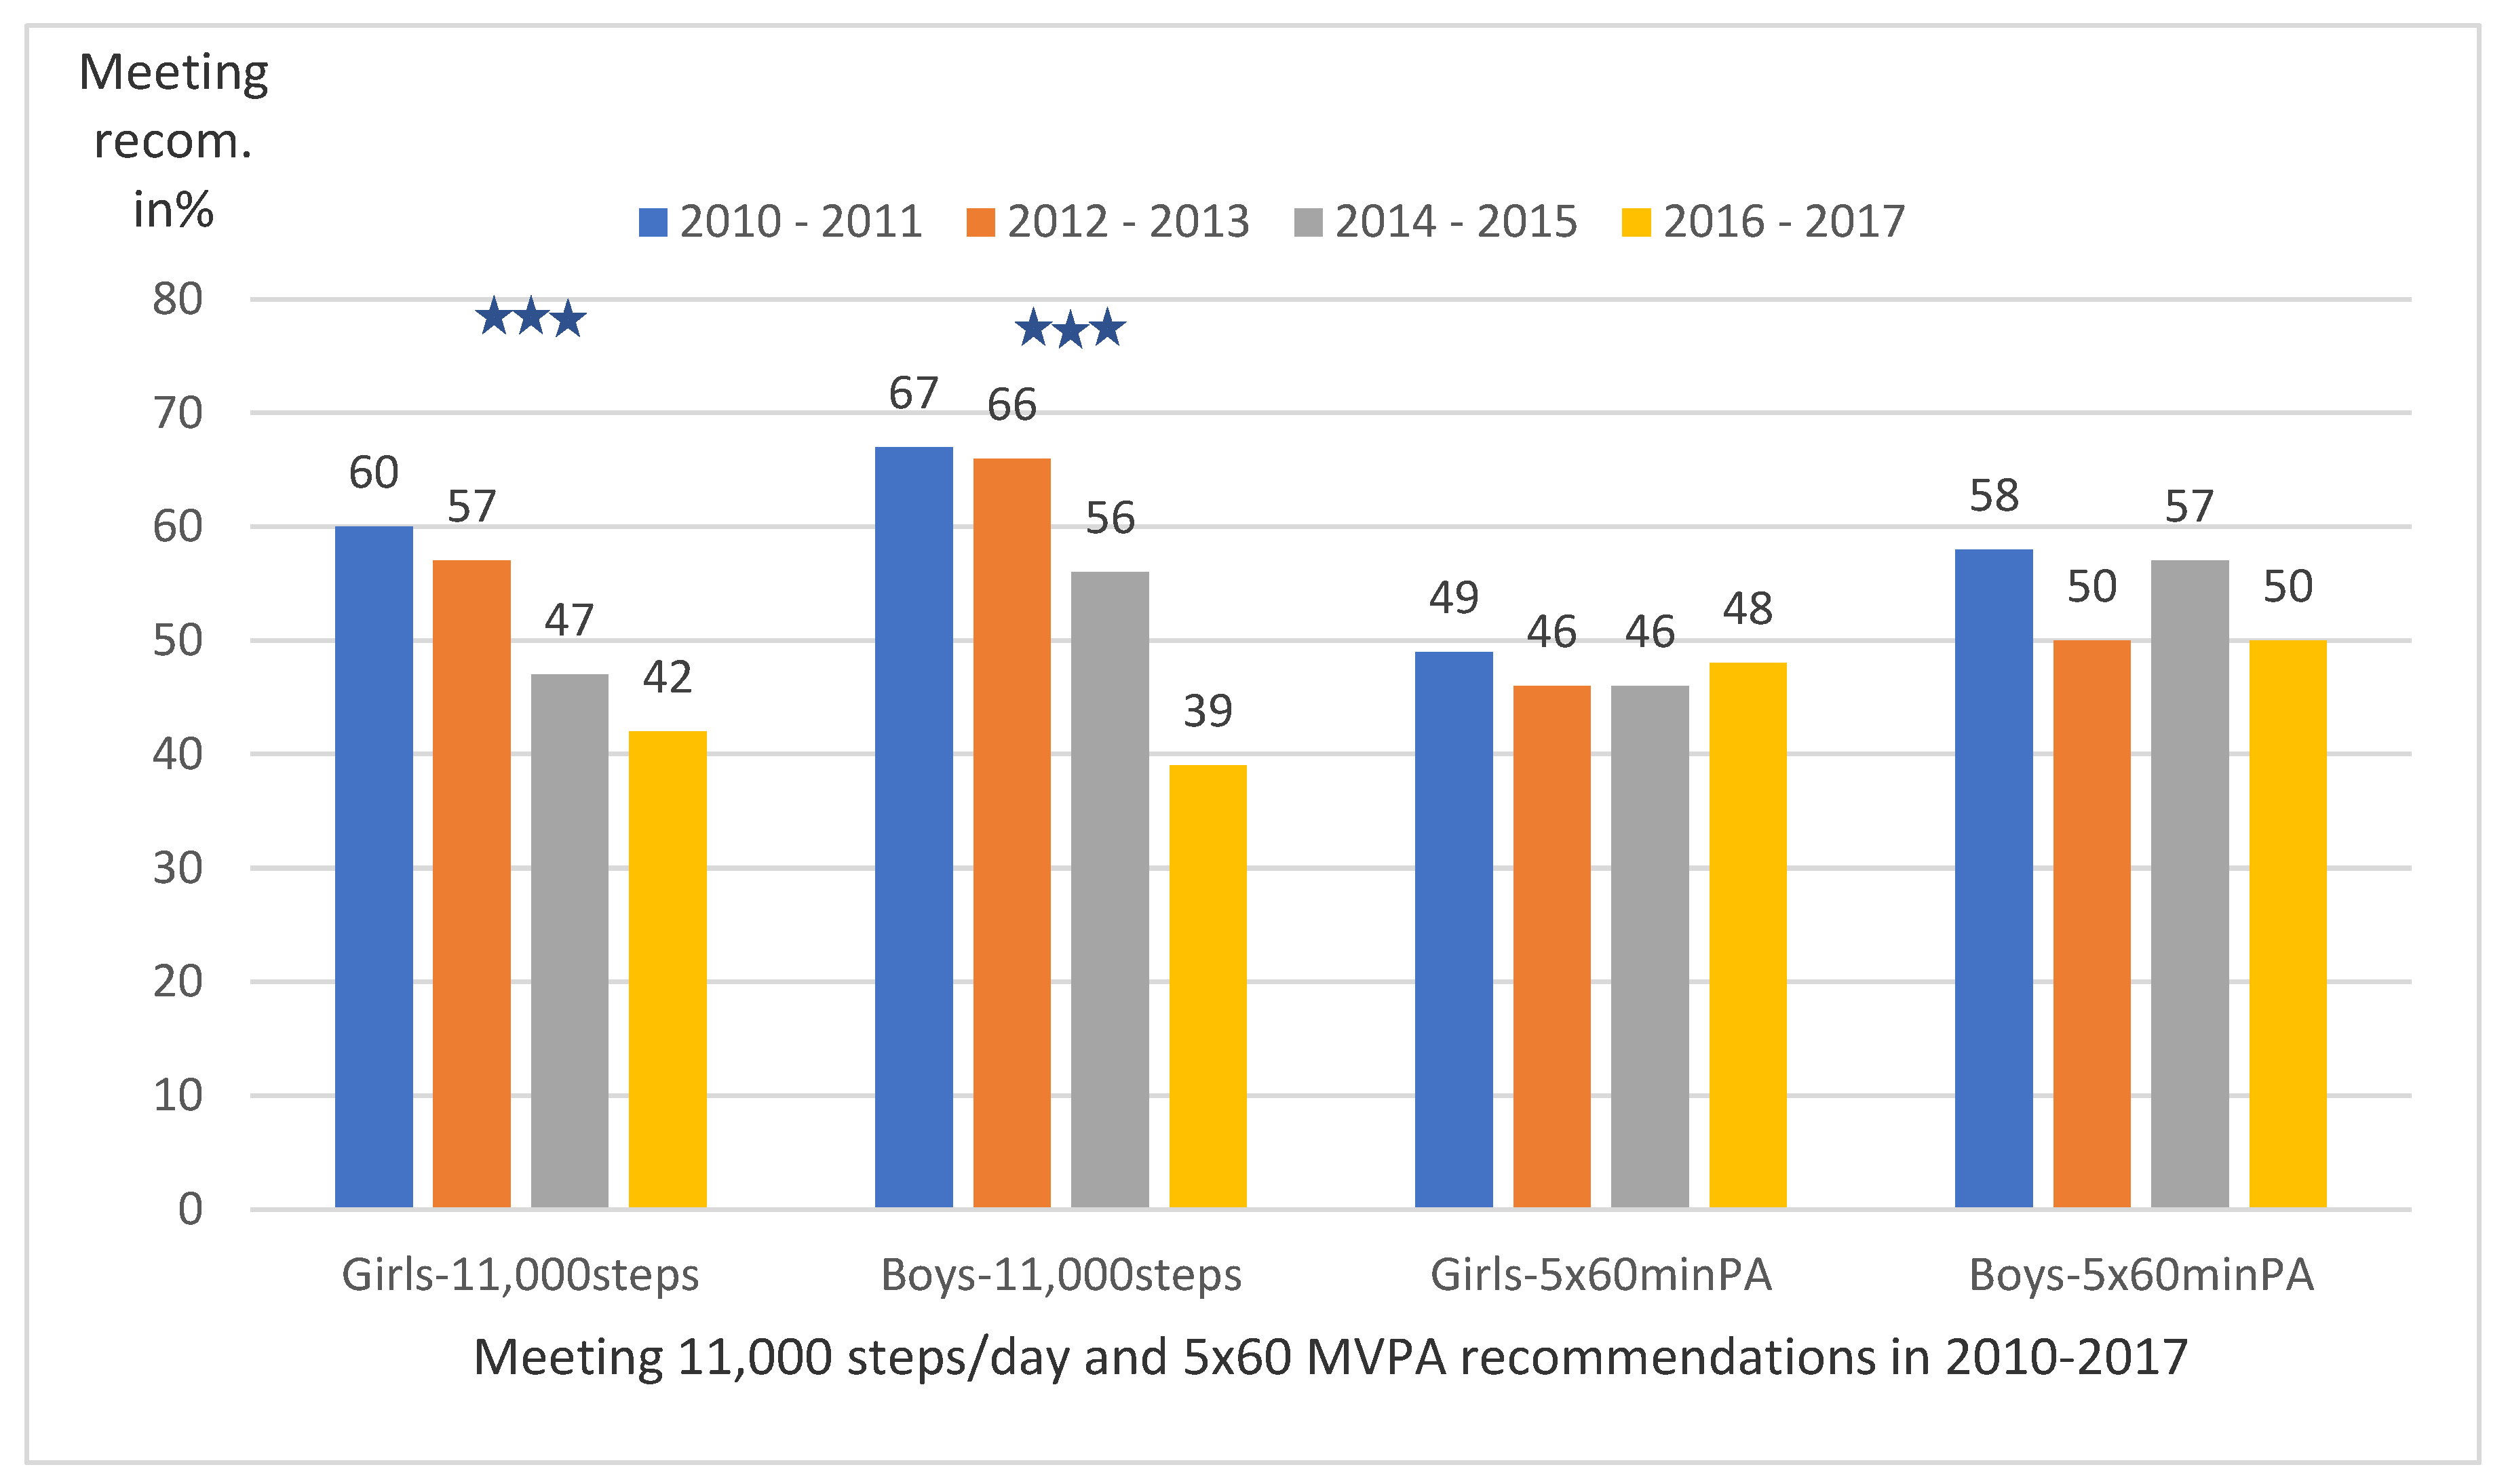
3.2. Trend in The Achievement of Physical Activity Guidelines

Moreover, in the meeting of the recommendation of 11,000 steps/day, a statistically significant decrease was observed in girls (χ2 = 17.01, p < 0.001, w = 0.123) and boys (χ2 = 34.73, p < 0.001, w = 0.211) (Figure 2). Concerning the achievement of the recommendation of at least 5 × 60 min MVPA, the differences between the stages are not statistically significant neither in girls (p = 0.831) nor in boys (p = 0.123).

3.3. Trend in the Structure of Weekly PA in Girls and Boys by Steps/Day

The differences between the days of the week and time stages (7 days × 4 stages) are statistically significant in both girls (F(18,6948) = 3.05, p < 0.001; ηp2 = 0.008) and boys (F(18,4860) = 2.43, p < 0.001; ηp2 = 0.009). Statistically significant differences concerning individual days of the week between stages 2010–2011 and 2016–2017 were observed in girls on Wednesday (p = 0.015), Thursday (p < 0.001), Friday (p < 0.001), and Saturday (p = 0.003) (Figure 3A) and in boys on Monday (p = 0.005), Tuesday (p < 0.001), Wednesday (p = 0.047), Thursday (p < 0.001), Friday (p < 0.001), and Saturday (p = 0.007) (Figure 3A). The biggest difference in steps/day between these stages was observed on Friday in girls (13,654 versus 11,296 steps/day) as well as boys (14,405 versus 11,849 steps/day).

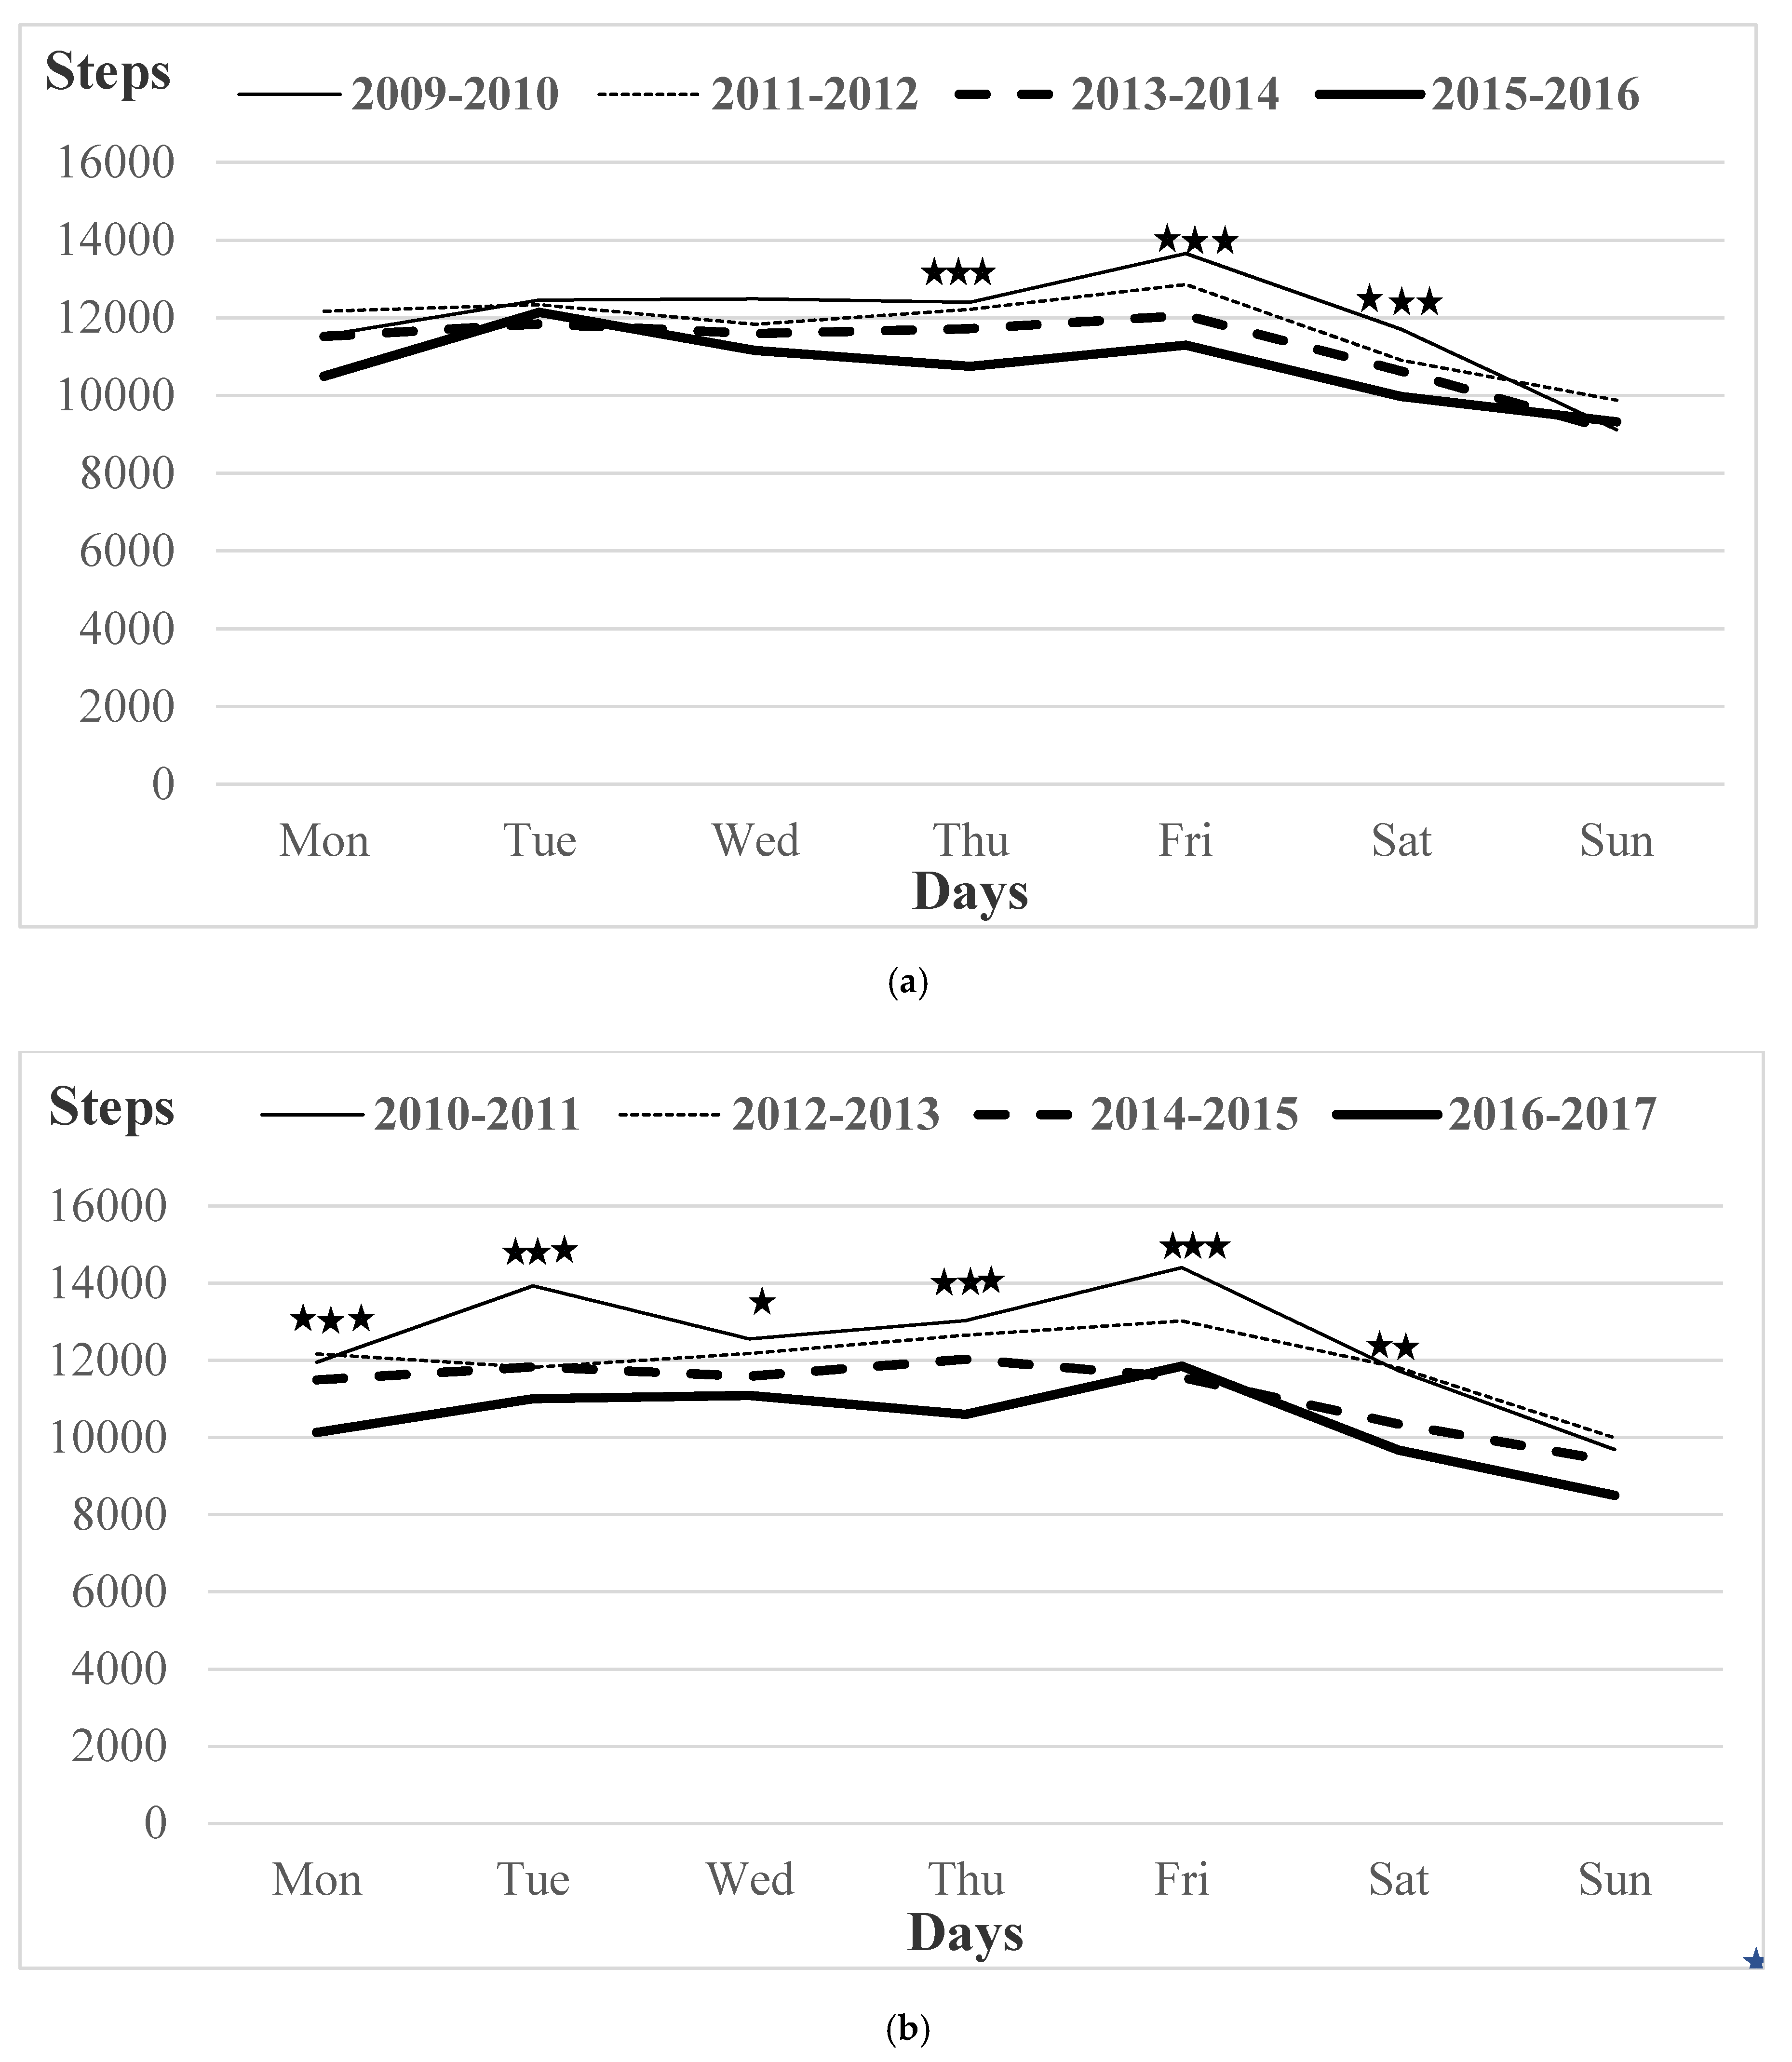
3.4. Trends in The Achievement of the Recommendations of 11,000 Steps/Day in Girls and Boys on Individual Days of the Week

The decrease in steps/day in 2016–2017 as opposed to 2010–2011 was also confirmed in the meeting of the recommendation of 11,000 steps/day on most days of the week (Table 2). In boys, there was no statistically significant decrease in the meeting of the recommendation except on Saturday and in girls, on Monday, Tuesday, and Sunday.

3.5. Trend in the Structure of Weekly PA in Girls and Boys By MET-min/week According to IPAQ-LF

In all types of PA, a decrease was observed between 2010–2011 and 2016–2017, but it was statistically significant only in boys in home PA, moderate PA, and vigorous PA, and in girls in vigorous PA only (Table 3). A comparison only between 2010–2011 and 2016–2017 in girls suggests a statistically significant decrease in recreation PA (p = 0.016). In boys a statistically significant decrease was observed in home PA (p = 0.014), moderate PA (p = 0.002), and overall weekly PA (p = 0.044). An important finding is that in the interaction between sex, school level, and stages (2 sex × 2 secondary and tertiary schools × 4 time stages) the differences are not statistically significant (F (16, 1892) = 1.02, p = 384, ηp2 = 0.002).

4. Discussion

The purpose of this study was to identify secular trends in the achievement of PA guidelines by Czech adolescents. The most important finding is a continuous statistically significant decrease in the average number of steps/day in girls and boys over the eight-year period of pedometer PA monitoring until 2016–2017. The results are consistent with the previously observed decrease in the number of steps/day in adolescent boys but not girls in the Czech Republic in 1998–2000 and 2008–2010 [10]. A secular decrease in steps/day and, at the same time, MVPA from 2003/2004 to 2016/2017 was also reported by Sasayama et al. [51] in Japanese children. In Swedish adolescents, Raustorp et al. [52] observed a decrease in average steps/day between 2000 and 2017 by 24% in boys and 30% in girls. The fact that in girls a secular decrease in overall PA subjectively estimated by the IPAQ-LF questionnaire was not confirmed is probably related to the overall lower weekly PA in girls as opposed to boys, but this in principle does not challenge the conclusions on the overall decrease in PA over the eight-year period.
A negative secular trend is even more evident in the meeting of the 11,000 steps/day recommendation in girls by 18 percentage points and in boys by the even higher amount of 28 percentage points. Sigmundová et al. [10] focused on a ten-year period (2000 to 2010) and observed a decrease only in boys by 13 percentage points. The recommendation of 11,000 steps/day is achieved by only 42% of girls and 39% of boys, which is alarming. Despite this significant decrease in the meeting of the recommendations, boys and girls from European regions still achieve significantly more steps/day than young people from the U.S. and Canada [53]. Vigorous measures should be taken to stop this undesirable trend, also because the risk of a similar development in Central Europe is very likely unless effective preventive actions are taken. The fact that the statistically significant decrease in the meeting of PA guidelines was not confirmed by the IPAQ-LF questionnaire highlights the limitations of questionnaire surveys and the need for deeper objective analyses combined with existing studies that examine the achievement of PA recommendations using this questionnaire [30,40].
Monitoring of the trend concerning overall PA and meeting of PA guidelines is a top global priority. It is also significant in terms of sustainable development and in the context of the Global action plan on PA 2018–2030 [54], according to which increasing PA will directly contribute to several sustainable development goals (e.g., good health and well-being; quality education; gender equality; reduced inequalities; partnerships; etc.). However, in demographic, geographical, socio-economic, political, educational, and other specific conditions, it is also of great importance to monitor the trends in PA structure. So far, there have been no studies focusing on PA trends in the segments of the school day. More knowledge is available on the structure of PA concerning especially the previously mentioned associations between school and weekend days [2,39] but also between school days [44]. So far, schools in Central Europe have not responded to the fact that adolescents are most physically active on Friday and least physically active on Monday [40,55], which was also confirmed by this study. Given the lowest amount of PA on Sunday, the combination of weekend days with Monday represents a great risk for youths in terms of health.
The decrease in recreation PA in girls identified in the study is a call for extracurricular PA organized by schools and other institutions that provide organized leisure-time PA. Moseley et al. [56] emphasise that in adolescents, recreation PA accounts for 60.2% (42.5% in young adults), which, according to Wold et al. [26], means that more focus should be on leisure-time PA in adolescents. In the present study, recreation PA represents only 31.1% of overall PA (expressed in MET-min/week). Another study in Spain dealing with participation of school children in health programs [57] identified the factors influencing associations of satisfaction and preferences with participation in PA programs. Similarly, in the Czech Republic and Poland, adolescent outdoor PA is promoting well-being; and if able to participate in preferred PA, adolescents were more likely to meet the weekly PA recommendations [39].
The recommended combination of objective and subjective PA monitoring [58,59] allows better use of positive implications and the elimination of negative implications of the research in long-term PA monitoring. The application of subjective estimates of PA and subsequent objective monitoring using wearables allows better interpretation of the shortcomings of various types of PA, such as respecting gender differences in the willingness to complete the questionnaires or the overestimation of PA and underestimation of sedentary behaviour [60].
On the basis of the results of this study and experience in providing feedback to the participants in schools, the authors believe that use modern technologies should be beneficial when involving adolescents in monitoring and becoming aware of their PA and sedentary behaviour in the main segments of the day and week but also for longer time cycles. It is desirable to develop and support diverse PA programmes to promote students’ activities related to lifestyle changes, give publicity to students’ achievements, and integrate health promotion and sustainability in most subjects and projects in schools. It is only a comprehensive and multi-sector strategy that can lead to an improvement in the current state and trends [61]. A crucial part of the strategy is physical education, where the key aspects are the adoption of physical literacy and the development of the foundations of a healthy lifestyle in adolescents.

Limitations and Future Research

The greatest limitation of the study was that the research sample was not random but deliberate, although the sampling procedure remained identical each year. Over the years it was impossible to maintain identical proportions of participants in terms of age and sex. However, as a result of the sampling procedure applied, it was possible to maintain a natural school environment throughout the project period without disturbing the habitual school programme and hence to ensure participation and inspection by the same research team.
Future research on time trends in PA in schools could use a similar strategy by using subjective PA evaluation with subsequent objective PA monitoring. It also appears appropriate to use the newly verified Youth Activity Profile questionnaire [62] and monitor at least weekly PA using simple wearables (bracelets) suitable for longitudinal use.

5. Conclusions

Long-term monitoring of the state and trend in adolescents’ PA is a major indicator of health sustainability in youths. The eight-year research using pedometers confirmed a secular decrease in adolescents’ PA and a decrease in the achievement of the 11,000 steps/day recommendation. During the last stage, this guideline was met by only 42% of girls and 39% of boys (compared with 60% of girls and 67% of boys during the first stage). The current estimates of weekly PA using the IPAQ-LF questionnaire were not so conclusive concerning the decrease in PA. As far as the structure of weekly PA is concerned, throughout the whole research period both girls and boys were least physically active on Sunday and most physically active on Friday. The combination of objective pedometer monitoring and subjective PA estimates using questionnaires successfully proved this approach for long-term PA monitoring. The results of the research should incite positive changes and promotion of a physically active and healthy lifestyle at all school levels, in all types of leisure-time institutions, and especially in the family environment. The sustainability of the economic implications of an unhealthy lifestyle is related to regular monitoring, education, and long-term PA research.

Author Contributions

Conceptualization, J.M. and K.F.; methodology, J.M. and K.F.; formal analysis, K.F.; investigation, J.M., K.F., P.V., A.S., D.G., and M.V.; resources, J.M. and K.F.; writing—original draft preparation, J.M. and K.F.; writing—review and editing, P.V., A.S., D.G., and M.V.; visualization, J.M.; supervision, K.F. All authors have read and agreed to the published version of the manuscript.

Funding

This research was funded by Czech Science Foundation, grant numbers 13-32935S, 14-26896S and 17-24378S.

Conflicts of Interest

The authors declare no conflict of interest. The funders had no role in the design of the study; in the collection, analyses, or interpretation of data; in the writing of the manuscript; or in the decision to publish the results.

References

  1. Bassett, D.R., Jr.; Lindsay, P.; Toth, L.P.; LaMunion, S.R.; Scott, E.; Crouter, S.E. Step counting: A review of measurement considerations and health-related applications. Sports Med. 2017, 47, 1303–1315. [Google Scholar] [CrossRef] [PubMed] [Green Version]
  2. Kudláček, M.; Frömel, K.; Jakubec, L.; Groffik, D. Compensation for adolescents’ school mental load by physical activity on weekend days. Int. J. Environ. Res. Public Health 2016, 13, 308. [Google Scholar] [CrossRef] [PubMed] [Green Version]
  3. Arias, N.; Calvo, M.D.; Benítez-Andrades, J.A.; Álvarez, M.J.; Alonso-Cotrés, B.; Benavides, C. Socioeconomic status in adolescents: A study of its relationship with overweight and obesity and influence on social network configuration. Int. J. Environ. Res. Public Health 2018, 15, 2014. [Google Scholar] [CrossRef] [PubMed] [Green Version]
  4. Colley, R.C.; Clarke, J.; Doyon, C.Y.; Janssen, I.; Lang, J.J.; Timmons, B.W.; Tremblay, M.S. Trends in physical fitness among Canadian children and youth. Health Rep. 2019, 30, 3–13. [Google Scholar] [CrossRef]
  5. Bassett, D.R.; John, D.; Conger, S.A.; Fitzhugh, E.C.; Coe, D.P. Trends in physical activity and sedentary behaviors of United States youth. J. Phys. Act. Health 2015, 12, 1102–1111. [Google Scholar] [CrossRef]
  6. Joshi, P.; Cole, K.; Overton, M. Trends in sedentary behaviors among high school students: Analysis of television and other screen-time activities. J. Phys. Educ. Sport 2016, 16, 1142–1145. [Google Scholar] [CrossRef]
  7. Ryu, S.; Kim, H.; Kang, M.; Pedisic, Z.; Loprinzi, P.D. Secular trends in sedentary behavior among high school students in the United States, 2003 to 2015. Am. J. Health Promot. 2019, 33, 1174–1181. [Google Scholar] [CrossRef]
  8. Armstrong, N. Understanding the role of aerobic fitness in relation to young people’s health and well-being. Phys. Ther. Rev. 2017, 22, 133–138. [Google Scholar] [CrossRef]
  9. McAnally, H.M.; Reeves, L.M.; Sligo, J.L.; Hancox, R.J. Intergenerational changes in adolescents’ physical fitness and weight in New Zealand. N. Z. Med. J. 2018, 131, 16–28. [Google Scholar]
  10. Sigmundová, D.; Ansari, W.E.; Sigmund, E.; Frömel, K. Secular trends: A ten-year comparison of the amount and type of physical activity and inactivity of random samples of adolescents in the Czech Republic. BMC Public Health 2011, 11, 731. [Google Scholar] [CrossRef] [Green Version]
  11. Corder, K.; Sharp, S.J.; Atkin, A.J.; Andersen, L.B.; Cardon, G.; Page, A.; Davey, R.; Grøntved, A.; Hallal, P.C.; Janz, K.F.; et al. Age-related patterns of vigorous-intensity physical activity in youth: The International Children’s Accelerometry Database. Prev. Med. Rep. 2016, 4, 17–22. [Google Scholar] [CrossRef] [PubMed] [Green Version]
  12. Gralla, M.H.; Mcdonald, S.M.; Breneman, C.; Beets, M.W.; Moore, J.B. Associations of objectively measured vigorous physical activity with body composition, cardiorespiratory fitness, and cardiometabolic health in youth: A review. Am. J. Lifestyle Med. 2016, 13, 61–97. [Google Scholar] [CrossRef]
  13. Booth, V.M.; Rowlands, A.V.; Dollman, J. Physical activity temporal trends among children and adolescents. J. Sci. Med. Sport 2015, 18, 418–425. [Google Scholar] [CrossRef] [PubMed]
  14. Cox, A.; Fairclouhg, S.J.; Kosteli, M.-C.; Noonan, R.J. Efficacy of school-based interventions for improving muscular fitness outcomes in adolescent boys: A systematic review and meta-analysis. Sports Med. 2020, 50, 543–560. [Google Scholar] [CrossRef] [Green Version]
  15. Bauman, A.; Rutter, H.; Baur, L. Too little, too slowly: International perspectives on childhood obesity. Pubulic Health Res. Pract. 2019, 29, e2911901. [Google Scholar] [CrossRef] [PubMed] [Green Version]
  16. Ahluwalia, N.; Dalmasso, P.; Rasmussen, M.; Lipsky, L.; Currie, C.; Haug, E.; Kelly, C.; Damsgaard, M.T.; Due, P.; Tabak, I.; et al. Trends in overweight prevalence among 11-, 13- and 15-year-olds in 25 countries in Europe, Canada and USA from 2002 to 2010. Eur. J. Public Health 2015, 25, 28–32. [Google Scholar] [CrossRef] [Green Version]
  17. Garrido-Miguel, M.; Cavero-Redondo, I.; Álvarez-Bueno, C.; Rodríguez-Artalejo, F.; Moreno, L.A.; Ruiz, J.R.; Ahrens, W.; Matínez-Vizcaíno, V. Prevalence and trends of overweight and obesity in European children from 1999 to 2016: A systematic review and meta-analysis. JAMA Pediatr. 2019, 173, e192430. [Google Scholar] [CrossRef] [PubMed]
  18. Allen, M.S.; Walter, E.E.; Swann, C. Sedentary behaviour and risk of anxiety: A systematic review and metaanalysis. J. Affect. Disord. 2019, 242, 5–13. [Google Scholar] [CrossRef]
  19. Bélair, M.-A.; Kohen, D.E.; Kingsbury, M.; Colman, I. Relationship between leisure time physical activity, sedentary behaviour and symptoms of depression and anxiety: Evidence from a population-based sample of Canadian adolescents. BMJ Open 2018, 8, e021119. [Google Scholar] [CrossRef]
  20. Patel, V.; Saxena, S.; Lund, C.; Thornicroft, G.; Baingana, F.; Bolton, P.; Chisholm, D.; Collins, P.Y.; Cooper, J.L.; Eaton, J.; et al. The Lancet Commission on global mental health and sustainable development. Lancet 2018, 329, 1553–1598. [Google Scholar] [CrossRef] [Green Version]
  21. Frömel, K.; Šafář, M.; Jakubec, L.; Groffik, D.; Žatka, R. Academic stress and physical activity in adolescents. BioMed. Res. Int. 2020, 2020, 4696592. [Google Scholar] [CrossRef] [PubMed] [Green Version]
  22. Kalman, M.; Inchley, J.; Sigmundova, D.; Iannotti, R.J.; Tynjälä, J.A.; Hamrik, Z.; Haug, E.; Bucksch, J. Secular trends in moderate-to-vigorous physical activity in 32 countries from 2002 to 2010: A cross-national perspective. Eur. J. Public Health 2015, 25, 37–40. [Google Scholar] [CrossRef] [PubMed] [Green Version]
  23. Hills, A.P.; Dengel, D.R.; Lubans, D.R. Supporting public health priorities: Recommendations for physical education and physical activity promotion in schools. Prog. Cardiovasc. Dis. 2015, 57, 368–374. [Google Scholar] [CrossRef] [PubMed] [Green Version]
  24. Frömel, K.; Svozil, Z.; Chmelík, F.; Jakubec, L.; Groffik, D. The role of physical education lessons and recesses in school lifestyle of adolescents. J. Sch. Health 2016, 86, 143–151. [Google Scholar] [CrossRef] [Green Version]
  25. Grao-Cruces, A.; Segura-Jiménez, V.; Conde-Caveda, J.; Garcia-Cervantes, L.; Martinez-Gómez, D.; Keating, X.D.; Castro-Pinero, J. The role of school in helping children and adolescents reach the physical activity recommendations: The UP&DOWN Study. J. Sch. Health 2019, 89, 612–618. [Google Scholar] [CrossRef]
  26. Wold, B.; Littlecott, H.; Tynjälä, J.; Samdal, O.; Moore, L.; Roberts, C.; Kannas, L.; Villberg, J.; Aarø, L.E. Changes from 1986 to 2006 in reasons for liking leisure-time physical activity among adolescents. Scand. J. Med. Sci. Sports 2016, 26, 951–959. [Google Scholar] [CrossRef] [Green Version]
  27. Rothman, L.; Macpherson, A.K.; Ross, T.; Buliung, R.N. The decline in active school transportation (AST): A systematic review of the factors related to AST and changes in school transport over time in North America. Prev. Med. 2018, 111, 314–322. [Google Scholar] [CrossRef]
  28. Gába, A.; Rubín, L.; Badura, P.; Roubalová, E.; Sigmund, E.; Kudláček, M.; Sigmundová, D.; Dygrýn, J.; Hamrik, Z. Results from the Czech Republic’s 2018 report card on physical activity for children and youth. J. Phys. Act. Health 2018, 15, S338–S340. [Google Scholar] [CrossRef] [Green Version]
  29. Groffik, D.; Mitáš, J.; Jakubec, L.; Svozil, Z.; Frömel, K. Adolescents’ physical activity in education systems varying in the number of weekly physical education lessons. Res. Q. Exerc. Sport 2020, 1–11. [Google Scholar] [CrossRef]
  30. Frömel, K.; Groffik, D.; Mitáš, J.; Dygrýn, J.; Valach, P.; Šafář, M. Active travel of Czech and Polish adolescents in relation to their well-being: Support for physical activity and health. Int. J. Environ. Res. Public Health 2020, 17, 2001. [Google Scholar] [CrossRef] [Green Version]
  31. Brusseau, T.A.; Kulinna, P.H.; Tudor-Locke, C.; van der Mars, H.; Darst, P.W. Children’s step counts on weekend, physical education and non-physical education days. J. Hum. Kin. 2011, 27, 116–134. [Google Scholar] [CrossRef]
  32. Nováková Lokvencová, P.; Frömel, K.; Chmelík, F.; Groffik, D.; Bebčáková, V. School and weekend physical activity of 15–16 year old Czech, Slovak and Polish adolescents. Acta Univ. Palacki. Olomuc. Gymn. 2011, 41, 39–45. [Google Scholar] [CrossRef] [Green Version]
  33. Frömel, K.; Kudlacek, M.; Groffik, D.; Chmelik, F.; Jakubec, L. Differences in the intensity of physical activity during school days and weekends in Polish and Czech boys and girls. Ann. Agric. Environ. Med. 2016, 23, 357–360. [Google Scholar] [CrossRef] [PubMed] [Green Version]
  34. Vašíčková, J.; Frömel, K.; Groffik, D.; Chmelík, F. Decrease in weekend number of steps in adolescents. Acta Univ. Palacki. Olomuc. Gymn. 2013, 43, 49–55. [Google Scholar] [CrossRef] [Green Version]
  35. Schneider, P.L.; Crouter, S.E.; Bassett, D.R., Jr. Pedometer measures of free-living physical activity: Comparison of 13 models. Med. Sci. Sports Exerc. 2004, 36, 331–335. [Google Scholar] [CrossRef]
  36. Tudor-Locke, C.; Giles-Corti, B.; Knuiman, M.; McCormack, G. Tracking of pedometer-determined physical activity in adults who relocate: Results from RESIDE. Int. J. Behav. Nutr. Phys. Act. 2008, 5, 39. [Google Scholar] [CrossRef] [Green Version]
  37. Hansen, B.H.; Kolle, E.; Steene-Johannessen, J.; Dalene, K.E.; Ekelund, U.; Anderssen, S.A. Monitoring population levels of physical activity and sedentary time in Norway across the lifespan. Scand. J. Med. Sci. Sports 2019, 29, 105–112. [Google Scholar] [CrossRef] [Green Version]
  38. Adams, M.A.; Johnson, W.D.; Tudor-Locke, C. Steps/day translation of the moderate-to-vigorous physical activity guideline for children and adolescents. Int. J. Behav. Nutr. Phys. Act. 2013, 10, 49. [Google Scholar] [CrossRef] [Green Version]
  39. Fromel, K.; Kudlacek, M.; Groffik, D.; Svozil, Z.; Simunek, A.; Garbaciak, W. Promoting healthy lifestyle and well-being in adolescents through outdoor physical activity. Int. J. Environ. Res. Public Health 2017, 14, 533. [Google Scholar] [CrossRef] [Green Version]
  40. Mitáš, J.; Sas-Nowosielski, K.; Groffik, D.; Frömel, K. The safety of the neighborhood environment and physical activity in Czech and Polish adolescents. Int. J. Environ. Res. Public Health 2018, 15, 126. [Google Scholar] [CrossRef] [Green Version]
  41. Craig, C.L.; Marshall, A.L.; Sjöström, M.; Bauman, A.E.; Booth, M.L.; Ainsworth, B.E.; Pratt, M.; Ekelund, U.; Yngve, A.; Sallis, J.F.; et al. International physical activity questionnaire: 12-country reliability and validity. Med. Sci. Sports Exerc. 2003, 35, 1381–1395. [Google Scholar] [CrossRef] [PubMed] [Green Version]
  42. Hagströmer, M.; Bergman, P.; De Bourdeaudhuij, I.; Ortega, F.B.; Ruiz, J.R.; Manios, Y.; Rey-López, J.P.; Phillipp, K.; von Berlepsch, J.; Sjöström, M.; et al. Concurrent validity of a modified version of the International Physical Activity Questionnaire (IPAQ-A) in European adolescents: The HELENA study. Int. J. Obes. 2008, 32, S42–S48. [Google Scholar] [CrossRef] [PubMed] [Green Version]
  43. Ottevaere, C.; Huybrechts, I.; De Bourdeaudhuij, I.; Sjöström, M.; Ruiz, J.R.; Ortega, F.B.; Hagströmer, M.; Widhalm, K.; Molnár, D.; Moreno, L.A.; et al. Comparison of the IPAQ-A and Actigraph in relation to VO2max among European adolescents: The HELENA study. J. Sci. Med. Sport 2011, 14, 317–324. [Google Scholar] [CrossRef] [PubMed] [Green Version]
  44. Cull, A.; Sprangers, M.; Bjordal, K.; Aaronson, N.; West, K.; Bottomley, A. EORTC Quality of Life Group Translation Procedure, 2nd ed.; EORTC Quality of Life Unit: Brussels, Belgium, 2002. [Google Scholar]
  45. Cerin, E.; Cain, K.L.; Oyeymi, A.L.; Owen, N.; Conway, T.L.; Cochrane, T.; Van Dyck, D.; Schipperijn, J.; Mitáš, J.; Toftager, M.; et al. Correlates of agreement between accelerometry and self-reported physical activity. Med. Sci. Sports Exerc. 2016, 48, 1075–1084. [Google Scholar] [CrossRef] [PubMed] [Green Version]
  46. U.S. Department of Health and Human Services. Healthy People 2020; U.S. Department of Health and Human Services: Washington, DC, USA, 2010.
  47. U.S. Department of Health and Human Services. Physical Activity Guidelines for Americans, 2nd ed.; U.S. Department of Health and Human Services: Washington, DC, USA, 2018.
  48. European Commission. Study on the Implementation of the European Physical Activity Guidelines; Publication Office of the European Union: Brussels, Belgium, 2016. [Google Scholar] [CrossRef]
  49. Cohen, J. Statistical Power Analysis for the Behavioral Sciences, 2nd ed.; Lawrence Erlbaum Associates: Hillsdale, NJ, USA, 1988. [Google Scholar]
  50. Sheskin, D.J. Handbook of Parametric and Nonparametric Statistical Procedures, 4th ed.; Chapman & Hall/CRC: Boca Raton, FL, USA, 2007. [Google Scholar]
  51. Sasayama, K.; Adchi, M. Secular changes in total steps and moderate-to-vigorous physical activity among fourth-grade students in Japan in 2003/2004 and 2016/2017. J. Sports Sci. 2020, 38, 416–421. [Google Scholar] [CrossRef]
  52. Raustorp, A.; Fröberg, A. Comparisons of pedometer-determined weekday physical activity among Swedish school children and adolescents in 2000 and 2017 showed the highest reductions in adolescents. Acta Pediatr. 2019, 108, 1303–1310. [Google Scholar] [CrossRef]
  53. Beets, M.W.; Bornstein, D.; Beighle, A.; Cardinal, B.J.; Morgan, C.F. Pedometer-measured physical activity patterns of youth: A 13-country review. Am. J. Prev. Med. 2010, 38, 208–216. [Google Scholar] [CrossRef]
  54. World Health Organization. Global Action Plan on Physical Activity 2018–2030: More Active People for a Healthier World; World Health Organization: Geneva, Switzerland, 2018. [Google Scholar]
  55. Valach, P.; Vašíčková, J.; Frömel, K.; Jakubec, L.; Chmelík, F.; Svozil, Z. Is academic achievement reflected in the level of physical activity among adolescents? J. Phys. Educ. Sport 2020, 20, 186–195. [Google Scholar] [CrossRef]
  56. Moseley, C.A.; Skinner, A.C.; Perrin, E.M.; Armstrong, S.C.; Peterson, E.D.; Wong, C.A. Adolescent and young adult recreational, occupational, and transportation activity: Activity recommendation and weight status relationships. J. Adolesc. Health 2019, 65, 147–154. [Google Scholar] [CrossRef]
  57. Sainz de Baranda, P.; Visiedo, A.; Ruiz-Díaz, A.; Pérez-Sánchez, J.M.; Romera-García, F.; Martínez-Romero, M.T.; Cejudo, A.; Rodríguez-Ferrán, O. Niveles de Satisfacción y Preferencias de los escolares participantes en el Programa SALUD 5-10. J. Sport Health Res. 2020, 12 (Suppl. 1), 39–52. [Google Scholar]
  58. Atkin, A.J.; Gorely, T.; Clemes, S.A.; Yates, T.; Edwardson, C.; Brage, S.; Salmon, J.; Marshall, S.J.; Biddle, S.J.H. Methods of measurement in epidemiology: Sedentary behaviour. Int. J. Epidemiol. 2012, 41, 1460–1471. [Google Scholar] [CrossRef] [PubMed] [Green Version]
  59. Biddle, S.J.H.; Asare, M. Physical activity and mental health in children and adolescents: A review of reviews. Br. J. Sports Med. 2011, 45, 886–895. [Google Scholar] [CrossRef] [PubMed] [Green Version]
  60. Hagstromer, M.; Ainsworth, B.E.; Oja, P.; Sjostrom, M. Comparison of a subjective and an objective measure of physical activity in a population sample. J. Phys. Act. Health 2010, 7, 541–550. [Google Scholar] [CrossRef] [PubMed]
  61. Pate, R.R.; Flynn, J.I.; Dowda, M. Policies for promotion of physical activity and prevention of obesity in adolescence. J. Exerc. Sci. Fit. 2016, 14, 47–53. [Google Scholar] [CrossRef] [PubMed] [Green Version]
  62. Saint-Maurice, P.F.; Welk, G.J. Validity and calibration of the Youth Activity Profile. PLoS ONE 2015, 10, e0143949. [Google Scholar] [CrossRef] [Green Version]
Figure 1. Average steps/day and aggregate MET-min/week in girls (n = 1129) and boys (n = 779) between 2010 and 2017.
Sustainability 12 05183 g001
Figure 2. Meeting the recommendation of 11,000 steps/day and at least 5 × 60 min of MVPA in girls (n = 1129) and boys (n = 779) between 2010 and 2017. *** p < 0.001.
Sustainability 12 05183 g002
Figure 3. Steps/day during the week in girls (a) and boys (b) between 2010 and 2017. * p < 0.05, ** p < 0.01, *** p < 0.001.
Sustainability 12 05183 g003
Table 1. Sample characteristics.
CharacteristicsnAge
(Years)
Weight
(kg)
Height
(cm)
BMI
(kg·m−2)
GenderTime StagesMSDMSDMSDMSD
Girls2010–201132717.921.9959.738.00167.546.2621.252.33
2012–201334218.401.7160.478.42167.746.7121.492.73
2014–201523318.211.7659.948.89166.997.0221.452.55
2016–201722718.671.5459.898.07167.576.3421.312.46
Boys2010–201125218.681.7573.4110.26180.687.1122.442.48
2012–201318918.182.0673.0211.66178.868.9422.803.16
2014–201516218.721.6874.6315.49179.256.0923.224.80
2016–201717618.601.7574.1711.43180.267.9322.762.82
Note. M = mean; SD = standard deviation; BMI = body mass index.
Table 2. Meeting the 11,000 steps/day recommendation on individual days of the week by time stages in girls (n = 1129) and boys (n = 779), Bold numbers show the significant differences.
DaySexStages % (n)Differences between Stage I and IV
I
2010–2011
II
2012–2013
III
2014–2015
IV
2016–2017
Χ2pw
MondayGirls48.9 (160)56.1 (192)54.5 (127)43.6 (99)1.520.2170.037
Boys51.2 (129)49.7 (94)51.2 (83)35.2 (62)10.690.0010.117
TuesdayGirls56.3 (184)58.2 (199)55.4 (129)54.2 (123)0.240.6270.015
Boys66.3 (167)53.4 (101)54.3 (88)47.2 (83)15.58<0.0010.141
WednesdayGirls40.7 (133)32.8 (112)33.9 (79)27.8 (63)9.780.0020.093
Boys39.3 (99)35.5 (67)35.8 (58)28.4 (50)5.400.0200.083
ThursdayGirls38.5 (126)39.2 (134)33.9 (79)26.4 (60)8.800.0030.088
Boys43.7 (110)43.4 (82)36.4 (59)27.8 (49)11.09< 0.0010.119
FridayGirls50.5 (165)43.5 (149)39.1 (91)31.7 (72)19.22<0.0010.130
Boys55.6 (140)49.2 (93)37.0 (60)38.1 (67)12.69<0.0010.128
SaturdayGirls50.5 (165)40.6 (139)38.2 (89)40.1 (93)4.840.0280.065
Boys47.2 (119)50.8 (96)43.2 (70)38.1 (67)3.530.0600.067
SundayGirls29.4 (96)27.8 (95)30.5 (71)30.8 (70)0.140.7090.011
Boys35.7 (90)36.0 (68)35.2 (57)23.9 (42)6.820.0090.094
Table 3. Estimates of the type of physical activity (MET-min/week) in girls and boys in 2010–2017.
CharacteristicsnType of Physical Activity
SchoolTransportHomeRecreation
SexYearsMdnIQRHpη2MdnIQRHpη2MdnIQRHpη2MdnIQRHpη2
Girls2010–2011327101726525.490.1390.00279215183.360.3400.0003908905.810.1210.002127817286.63 a0.0850.003
2012–20133427202280743121842076010801559
2014–20152338101940690115527063011341875
2016–20172279902805693108936067010601638
Boys2010–2011252171036717.180.0660.00592412692.960.3980.0004099558.67 a0.0340.007157223503.480.3230.001
2012–201318999029137431443405117011791872
2014–2015162118628228091338283102013512098
2016–201717613382742693140325381013112228
VigorousModerateWalkingSum
Girls2010–201132784019509.380.0250.006117018606.080 a0.1090.003158426072.580.4610.000441350036.860.0760.003
2012–20133427051560103816601650221141934436
2014–2015233660174096013701436231038654420
2016–2017227780198094515581485194739604312
Boys2010–2011252162028359.990.0190.0091670229610.71 a0.0130.010168324341.390.7090.002556160497.20 a0.0660.005
2012–201318910802880146024702244224448695757
2014–201516211702460125017001535252552294717
2016–201717615902970115318081493207950685558
Mdn = median; IQR = interquartile range; H= Kruskal–Wallis test; p = level of significance; η2 = effect size coefficient; a = statistical significance between time stages 2010–2011 and 2016–2017.

