Article

Modeling Viscosity and Density of Ethanol-Diesel-Biodiesel Ternary Blends for Sustainable Environment

1
Department of Mechanical, Mechatronics and Manufacturing Engineering (New Campus), University of Engineering and Technology, Lahore 54000, Pakistan
2
Centre for Energy Science, Department of Mechanical Engineering, University of Malaya, Kuala Lumpur 50603, Malaysia
3
School of Mechanical, Aerospace and Automotive Engineering, Faculty of Engineering, Environment and Computing, Coventry University, Coventry CV1 5FB, UK
4
Department of Mechanical Engineering, Bahauddin Zakariya University, Multan 60800, Pakistan
5
Alternative Fuels Research Laboratory (AFRL), Energy Division, Department of Mechanical Engineering, Faculty of Engineering, Erciyes University, Kayseri 38039, Turkey
6
Department of Mechanical Engineering & Design, School of Engineering and Applied Science, Aston University, Aston Triangle, Birmingham B4 7ET, UK
*
Authors to whom correspondence should be addressed.
Sustainability 2020, 12(12), 5186; https://doi.org/10.3390/su12125186
Submission received: 17 April 2020 / Revised: 17 June 2020 / Accepted: 23 June 2020 / Published: 25 June 2020
(This article belongs to the Special Issue Sustainable Conversion of Renewable Energy Sources)

Abstract

:
Rapid depletion in fossil fuels, inflation in petroleum prices, and rising energy demand have forced towards alternative transport fuels. Among these alternative fuels, diesel-ethanol and diesel-biodiesel blends gain the most attention due to their quality characteristics and environmentally friendly nature. The viscosity and density of these biodiesel blends are slightly higher than diesel, which is a significant barrier to the commercialization of biodiesel. In this study, the density and viscosity of 30 different ternary biodiesel blends was investigated at 15 °С and 40 °С, respectively. Different density and viscosity models were developed and tested on biodiesel blends soured from different feedstock’s including palm, coconut, soybean, mustard, and calophyllum oils. The prognostic ability and precisions of these developed models was assessed statistically using Absolute Percentage Error (APE) and Mean Absolute Percentage Error (MAPE). The MAPE of 0.045% and 0.085% for density model and 1.85%, 1.41%, 3.48% and 2.27%, 1.85%, 3.50% for viscosity models were obtained on % volume and % mass basis. These developed correlations are useful for ternary biodiesel blends where alcohols are the part of biodiesel blends. The modeled values of densities and viscosities of ternary blends were significantly comparable with the measured densities and viscosities, which are feasible to avoid the harm of vehicles’ operability.

Graphical Abstract

1. Introduction

The rapid depletion of fossil fuels has been a major concern for many decades, and about 80% of fossil fuels are already exhausted [1,2,3,4,5]. On the other hand, energy demand is increasingly growing due to the rapidly expanding population coupled with the increasing urbanization rate [6,7,8]. The global economy has been affected badly by the predominant energy crisis [9,10,11,12]. The developing countries’ economies have been uncompetitive because of unavailability of useable energy [13,14,15,16]. Pakistan, having vast agricultural land and a population approaching two hundred and twenty million, has the potential to produce renewable power on a large scale [17,18,19]. Fossil fuels are widely used to compensate this energy demand. Emissions associated with the use of these fossil fuels present another challenge. Fossil fuels are responsible for 85% of CO2 emissions and 64% of total greenhouse gas emissions [20,21,22,23,24,25,26]. Biofuels, derived from a variety of natural resources, have recently emerged as an alternative energy source [27,28,29]. Biodiesel is gaining more popularity among alternative energy sources due to its comparable engine performance with reduced emissions [30,31,32,33]. Biodiesel has the potential to replace fossil fuels and eliminate energy crises.
Biodiesels are plagiaristic mono-fatty acid alkyl esters produced from different vegetable oils or animal fats, using a process recognized as transesterification [34,35,36,37]. Edible and nonedible oils have been used for the production of biodiesel and the physiochemical characteristics of biodiesels mainly depend upon its raw feedstock [38]. The most important properties of biodiesel are density and viscosity, which have a strong influence on the engine performance characteristics and combustion process [39,40]. Biodiesel has higher density and viscosity compared to high-speed diesel (HSD) that can cause serious engine problems when used in cold areas [41]. The higher density and viscosity can affect the process of atomization during biodiesel combustion, resulting in lower engine performance and increased NOx emissions [42]. The density of binary rapeseed biodiesel blends was observed as decreased by increasing the temperature from 273.15 K to 333.15 K, also with the addition of ethanol into binary blends [43]. Long-term use of higher viscosity fuel in engines can affect engine durability, and unburned hydrocarbon deposition can affect engine lubricants that may harm engines. In addition, fuels with higher viscosities need more power in the fuel pumping, and they also wear the injection system [44]. In colder regions, the viscosity of biodiesel increases, and the biodiesel sticks in fuel injectors [45]. The filter plugging problems were reported with the use of biodiesel due to an increase in viscosity at lower temperature [46].
With the introduction of alcohol in binary blends, the density and viscosity of biodiesel blends have been reduced to make ternary blends [47]. The addition of ethanol into binary blends makes them follow the quality standards concerning the density, viscosity, modelling, and simulation of the fuel injection and combustion process [48]. Ternary blends have physiochemical characteristics to be close to high-speed diesel with comparable engine performance with reduced engine emissions [49]. Ethanol has been recognized for the blending purpose due to its lower viscosity as compared to other alcohols. The numerous use of alcohols in the petroleum industry may require accurate and exact knowledge of the viscosities of alcohols in order to commercialize these ternary blends for the transportation purposes [50]. As ternary blends consist of ethanol-diesel-biodiesel, so the physiochemical characteristics, epically density and viscosity, of individual constituents are changed from each other; diesel consists of 200 types of hydrocarbons, biodiesels consist of 25 different long-chain fatty acid methyl or ethyl esters, and ethanol is considered as a pure substance [51]. The diesel-ethanol-biodiesel ternary blends have the potential to use as alternative fuels [52,53]. Reliable data on the biodiesel viscosity as well as specific viscosity models incorporating temperature dependence are very significant in the creation of combustion models as well as designing, simulation, and optimization of equipment including reactors, mixing vessel being used in the combustion processes [54]. Different correlations have been developed for the prediction of density and viscosity of liquid blends. The interaction coefficients can be considered as negligible for the viscosity prediction of hydrocarbon blends; in this case, viscosity is considered as an additive quantity and it has been calculated through an ideal additive model. To develop an interaction among the fatty acid methyl esters, small interaction coefficients were used, and the same interactions were used for diesel and biodiesel blends [55,56]. When alcohols are blended with diesel and biodiesel, the individual species react strappingly and the interaction parameters attained from experiments should be considered. The increasing quantity of alcohol in ternary blends shows a nonlinear decrease in the kinematic viscosity. The ethanol content less than 36% by volume justifies the diesel fuel quality standards [57,58]. Several temperature-dependent viscosity and density models have been reported in the literature for the biodiesels sourced from various different oils. Kay’s rule, simple and weighted semi-logarithmic model, Refutas model was used for viscosity and linear and polynomial regression, by free version of the Rackett equation and, by group contribution methods, was used for density determination of ternary blends [59,60].
Three correlations were proposed for the prediction of kinematic viscosity of fatty acid methyl esters in a wide range of varying temperatures; one correlation was used for saturated, and two correlations were used for unsaturated species [61]. The dynamic viscosity of different binary and ternary biodiesel blends were predicted using a three-parameter equation, the prediction error of ±3%, 3.7% was observed for the biodiesel binary and ternary blends, respectively [62]. It becomes challenging to predict the exact value of density and viscosity of biodiesel blends due to their different characteristics. Indiscriminate correlations have been used to predict the density and viscosities of liquid blends [63]. In these correlations, viscosities are assumed to be an additive quantity and it can be modeled by ideal additivity method. To develop a viscosity model for biodiesel-diesel blends, the interaction coefficients of long-chain fatty acid methyl esters have been accounted using small interaction coefficients, while to develop a viscosity model for ethanol-diesel-biodiesel, the interaction parameters were attained from experimental statistics and needed to satisfy the ideal additivity model [57,64].
In this present study, five different types of biodiesels including palm biodiesel (PBD), soybean biodiesel (SBD), coconut biodiesel (CBD), calophyllum biodiesel (CaBD) and mustard biodiesel (MBD) were prepared, and then six different ethanol-diesel-biodiesel ternary blends with 92%, 84%, 76%, 68%, 55%, 45% by volume diesel and 5%, 10%, 15%, 20%, 30%, and 40% by volume biodiesel and 3%, 6%, 9%, 12%, and 15% by volume ethanol were used to compute densities and viscosities of the blends and developed an interaction among the constituents of these ternary blends. These ternary blends contain low content of alcohols due to lower value of cetane number of ethanol; the ternary blends with higher content of ethanol are not feasible for diesel engines [49]. The density of ethanol-diesel-biodiesel blends was measured and modeled using different correlations including Key’s mixing equation (KED) and a new developed density model with three parameters obtained by the regression analysis; these density models are used for the calculation of densities of ternary blends at 15 °С. Although, the viscosity of ethanol-diesel-biodiesel blends were measured and modeled using four different viscosity models including the Grunberg–Nissan model and three newly developed models using regression analysis, exponential regression analysis, and log–log regression analysis with three, four, and five parameters, respectively. In density and viscosity models, both mass fraction and volume fraction analysis were performed. These models were evaluated using a statistical tool known as Absolute Percentage Error (% APE) and Mean Absolute Percentage Error (% MAPE).

2. Materials and Methods

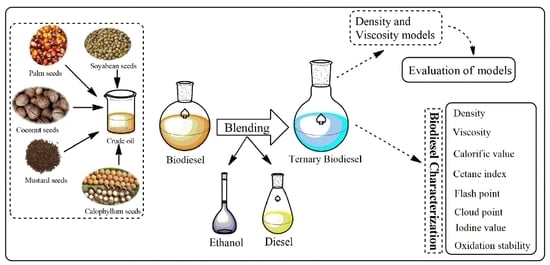
2.1. Biodiesel Blends and Characterization

Biodiesel production and characterization of pure alcohols, biodiesel, and HSD were carried out at the Department of Chemical Engineering of the University of Engineering and Technology Lahore, (New Campus). HSD used in this study was supplied from Shell (Pakistan) and had zero oxygen content with properties within the range identified by Pakistan’s fuel supplier agencies. Biodiesel used in this study was sourced from palm, soybean, coconut, mustard, and calophyllum oils. These raw oils are converted into biodiesel through the transesterification process in the presence of homogeneous catalyst KOH and methanol. The operating parameters of the transesterification process were kept, reaction temperature of 57.50 °С, catalyst concentration of 1 wt.%, methanol-to-oil ratio of 8.50:1, reaction speed of 600 rpm, and reaction time of 2 h. Alcohols used in this work were purchased from Central Chemicals Pvt. Ltd. Pakistan. The purity of alcohol used in this work was 99.9%. The composition of tertiary blends used in this work is shown in Table 1.
The physicochemical characteristics of HSD, biodiesels, and ethanol are shown in Table 2. Acid value is the representation of residual acid in fuel; the physicochemical properties of the fuel may be altered with higher acid value [65]. The acid value of all biodiesels was observed within the ASTM standards specified limits, ranging from 0.20 to 0.30 mg KOH/g. Biodiesel with high saturation can cause higher flash-point value with poor cold flow properties [66]. Palm methyl ester (PME) has a medium level of saturation, due to which it has moderate flow properties and possesses higher viscosity and density as compared to the HSD [67]. The composition of any biodiesel depends upon the feed stock oil used for the production. The composition of fatty acid methyl esters (FAME) of PBD, CBD, SBD, MBD, and CaBD were determined using an Agilent 6869 gas chromatograph and mass spectrum (GCMS). Physiochemical characteristics of different biodiesels and bioethanols used in this study are illustrated in Table 2, while the (FAME) composition with their saturation levels of PBD, CBD, SBD, MBD, and CaBD are shown in Table 3. The GCMS analysis revealed that palm biodiesel consists of 44.51%, 42.43%, and 13.06% saturated, monounsaturated, and polyunsaturated fatty acids, respectively. Coconut biodiesel has the highest level of saturated fatty acids of 87.5%, and mustard biodiesel has the lowest level of saturated fatty acids of 5% with the highest level of monounsaturated of 74.3%; maximum polyunsaturated fatty acids were identified in CaBD with a value of 56.3%.

2.2. Density and Viscosity Measurement

The density and viscosity of ethanol-diesel-biodiesel ternary blends were measured at 15 °С and 40 °С according to ASTM standards D4052 and D7042, respectively, using SVM 3000 viscometer. Each sample was tested three times while keeping the standard deviation ±0.0005; however, the effect of temperature variation on density and viscosity of individual biodiesels, diesel, and ethanol was also determined. The temperature range for biodiesels and diesel was kept at 15 °С to 105 °С, and for ethanol it varied from 15 °С to 75 °С.

2.3. Equations for Density and Viscosity Modeling

The equations used to predict the density of ethanol-diesel-biodiesel blends were based on a Kay’s mixing rule (KED), in which the density of the blends was determined using the individual characteristics of the components of the blends [68]. The KED equation is described below:
ρ b l e n d = ρ D × D + ρ B D × B D + ρ E t O H × E t O H
where ρblend is the predictable density of the blend, ρ D , ρ B D , ρ E t O H are the density of the diesel, biodiesel, and ethanol, respectively, and D , B D , E t O H are the mass fraction or volume fraction of diesel, biodiesel, and ethanol, respectively. Another mathematical model was developed with the help of regression analysis of higher determination coefficients and standard deviations for the prediction of biodiesel mixes. This model has been tested to calculate the ultimate density of the blends at 40 °С. The mathematical equation of this model is shown below:
ρ b l e n d = a × D + b × B D + c × ρ B D + X
where, D is the percentage fraction of diesel, BD is the percentage fraction of biodiesel, ρ B D represents the density of the individual biodiesel in ternary blends and (a, b, c, X) are regression parameters. Both % volume and % mass analysis were tested on both KED and density model.
To investigate the viscosity of the diesel-biodiesel-ethanol blends, (Grunberg–Nissan) correlation with three interaction parameters was used, and three new mathematical models were developed for the determination of viscosities of blends based on regression analysis, exponential regression analysis, and log–log regression analysis.
ln ( η υ ) = D × ln ( η D ) +   B D × ln ( η B D ) +   E t O H × ln ( η E t O H ) + D × B D × G D × B D + B D × E t O H × G B D × E t O H + E t O H × D × G E t O H × D
where, η υ represents the kinematic viscosity of the ternary blends (mm2/s), η D , η B D , and η E t O H represent the kinematic viscosities of the diesel, biodiesel, and ethanol, respectively, D , B D , E t O H are the mass fraction or volume fraction of diesel, biodiesel, and ethanol, respectively, and G represents the interaction coefficients.
The newly developed models were named as viscosity model 1, viscosity model 2, and viscosity model 3. In viscosity model 1, the values of the constants used was calculated from the slope where the coefficients were obtained by the regression analysis. This model predicts the effects of each of the individual components on the viscosity of the final ternary blend. The higher value of R2 in this model represents that this model is a very good fit for calculating the viscosities of blends. The mathematical form of this model is shown below in Equation (4).
l n ( η b l e n d ) = a × l n ( D ) + b × l n ( B D ) + c × l n ( η B D )     d × l n ( E t O H ) + X
Viscosity model 2 was more accurate based on exponential regression analysis, and it was established as a decent model for the prediction of kinematic viscosity of ternary blends at 40 °С. The mathematical form of this model is illustrated in Equation (5), with a low value of standard deviation.
l n ( η b l e n d ) = a × ( D ) + b × ( B D ) + c × l n ( η B D )     X
Viscosity model 3 was more suitable and required less effort for obtaining the viscosity of blends. In this model, the variables including the percentages of the discrete constituents were reserved the same, with the variables including individual viscosities being modified to each component’s density. By doing this analysis, an optimum model was identified with suitable R2 and standard deviation. The mathematical form of this model is shown in Equation (6) below:
l n ( η b l e n d ) = a × l n ( D )     b × l n ( B D ) + c × l n ( E t O H )     d × l n ( ρ B D ) + e                          × l n ( ρ b l e n d ) X
η blend and ρ blend represent the viscosity and density of the final ternary blend,   D ,   BD and EtOH represent the percentage mass or percentage volume portion of diesel, biodiesel, and bioethanol in the ternary blend, respectively, ρ BD represents the density of the biodiesel. This viscosity model was developed using log–log regression analysis. The values of the regression parameters, SD, and R2 are shown in Table 4.

2.4. Evaluation of Models

The analytical capacity and precision of the developed density and viscosity models were observed with the help of some statistical tools: Absolute Percentage Error (APE), Mean Absolute Percentage Error (MAPE), Standard deviation (SD), and coefficients of determinations (R2) are illustrated in Equations (7)–(10).
A P E ( % ) = | x c a l c x e x p t | x e x p t × 100
M A P E ( % ) = i = 1 N | x c a l c   x e x p t | x e x p t   × 100 N
S D = i = 1 N ( x c a l c i x e x p t i ) 2 N 2  
R 2 = i = 1 N (   x c a l c i x e x p t ¯ ) 2 i = 1 N (   x e x p t i x e x p t ¯ ) 2
where, xexpt and xcalc represent the density and viscosity values obtained from experiments and calculated respectively from the proposed models, x e x p t ¯ represents the average value of the measured densities and viscosities, and N shows the total number of observations.

3. Results and Discussion

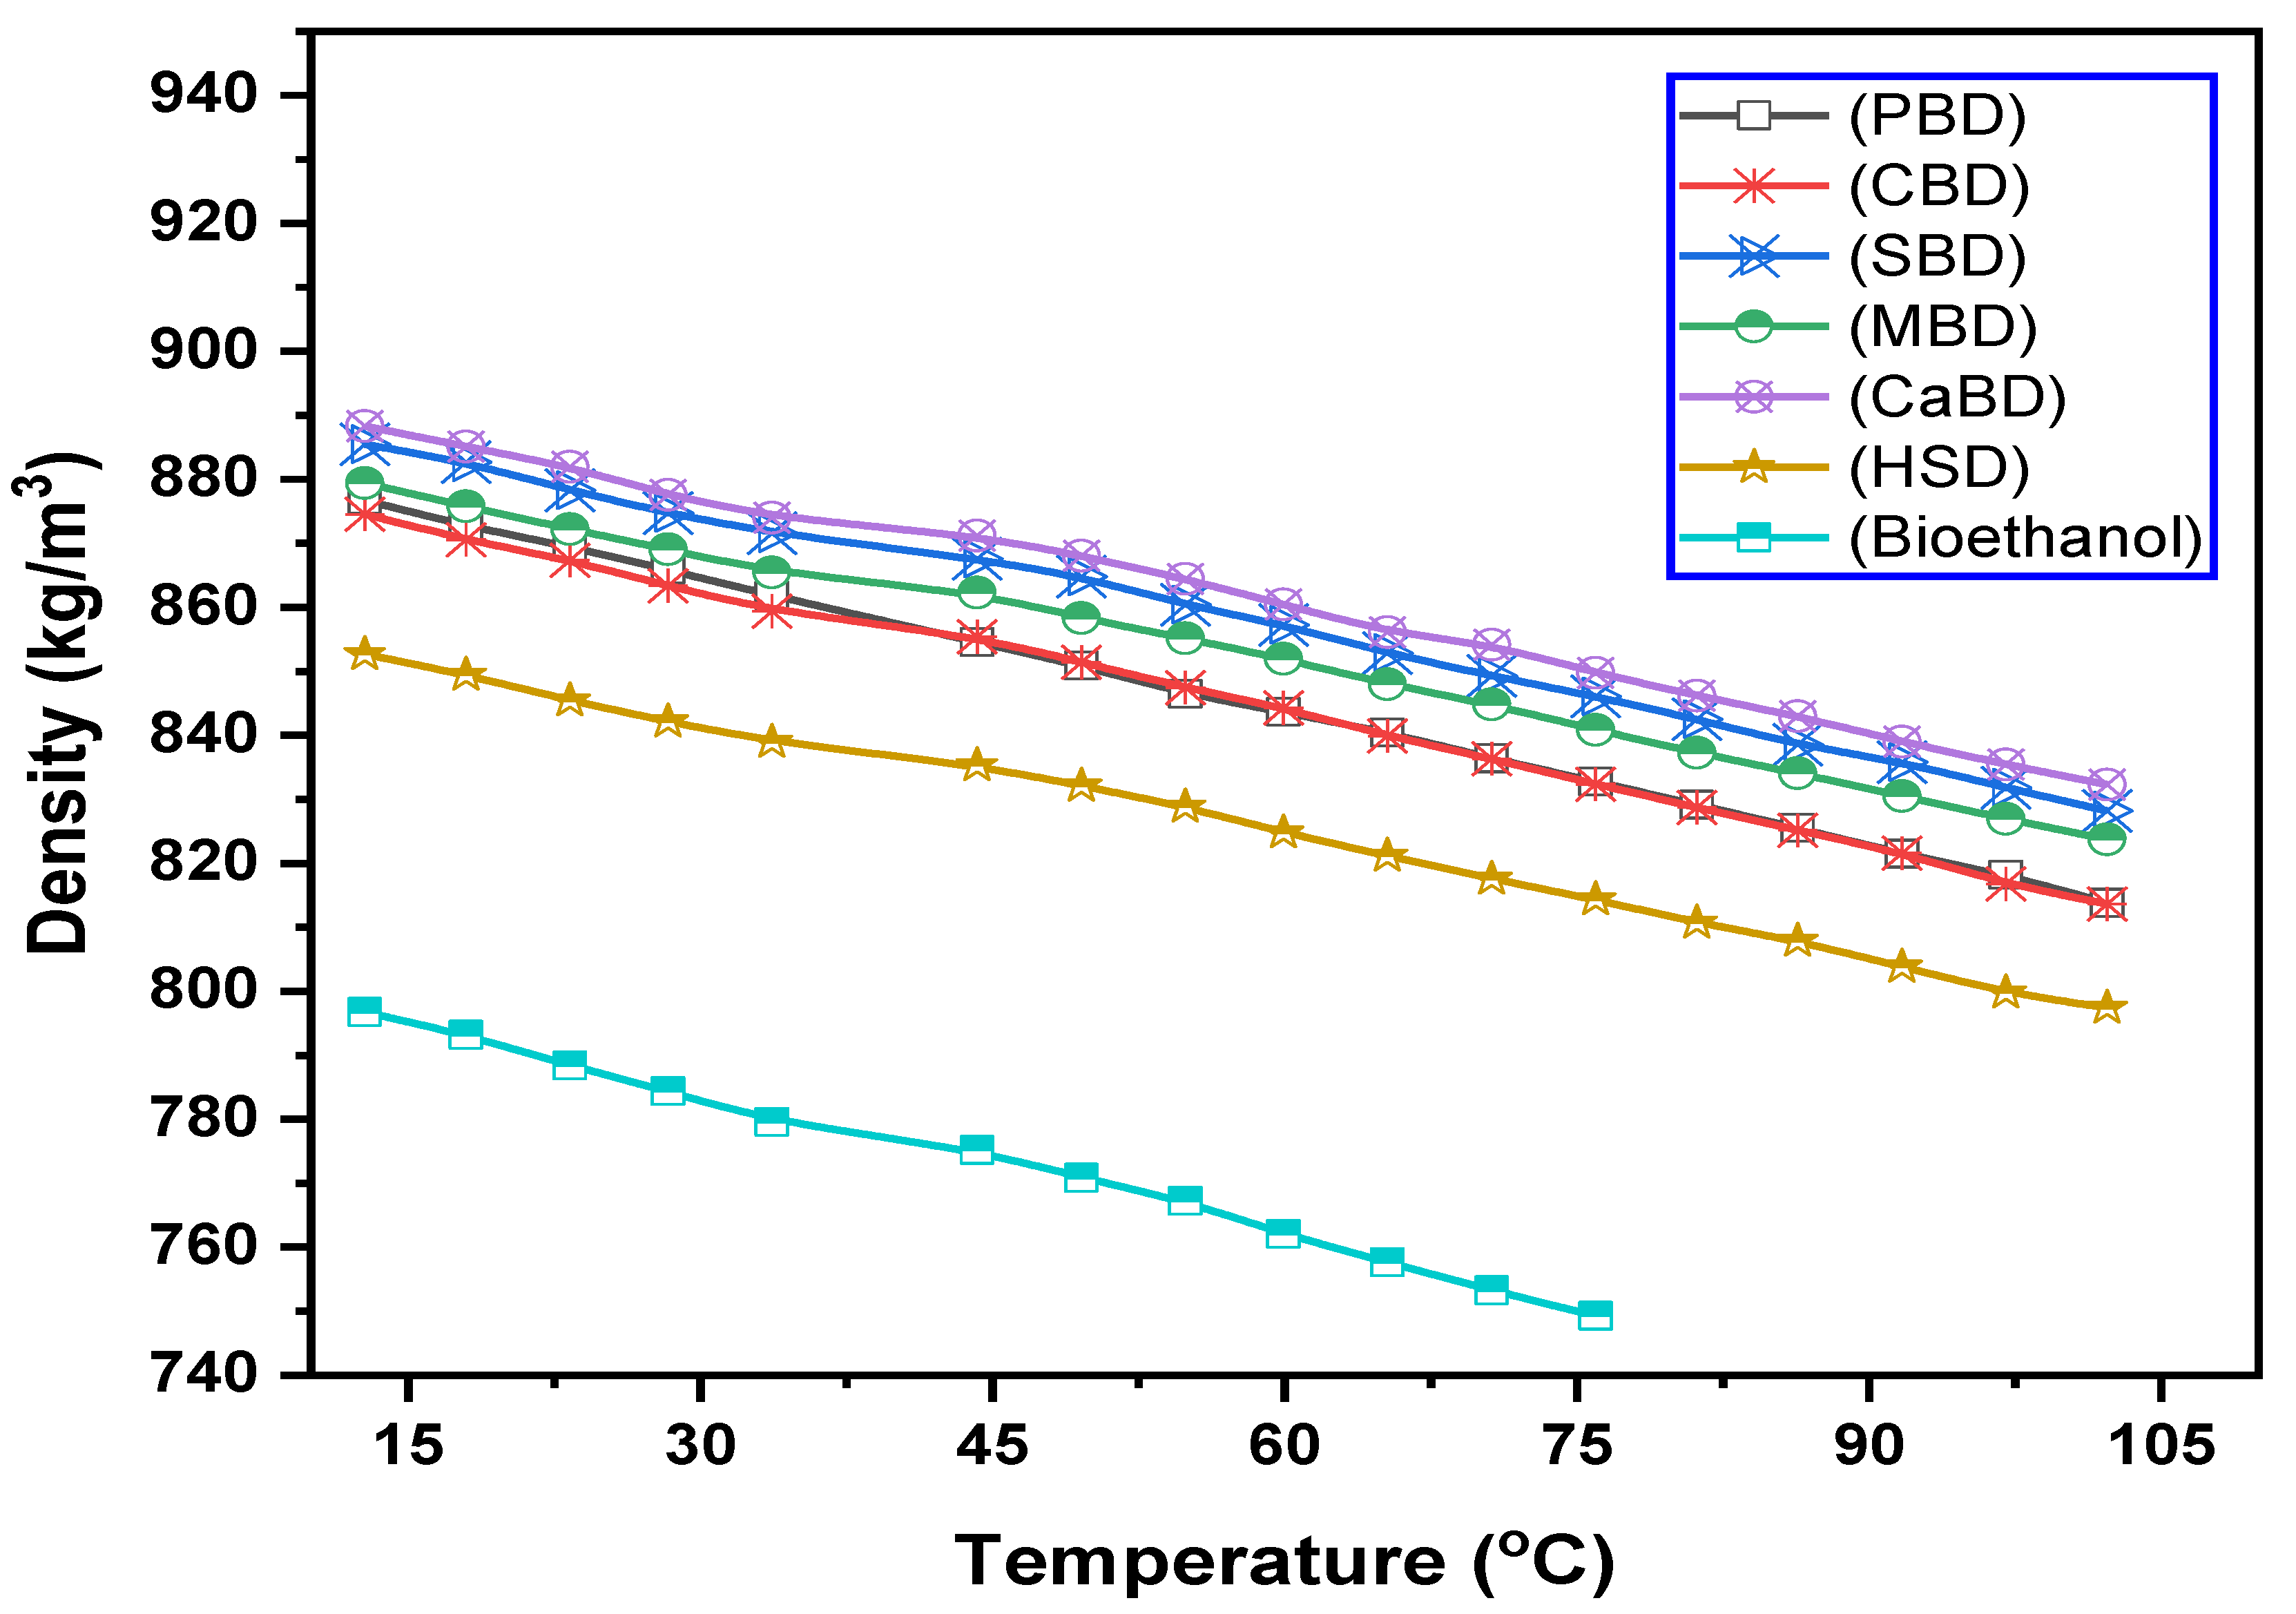
3.1. Effect of Temperature on the Density of Diesel, Ethanol, and Biodiesels

Temperature has been considered as an important factor to influence the density of the fuels; the variations in densities of biodiesels, HSD, and bioethanol with temperature are shown in Figure 1. The density of all biodiesels, diesel, and bioethanol decreased with the increase in temperature from 15 °С to 105 °С; at 15 °С, the density of HSD and bioethanol was observed to be 852 kg/m3 and 797 kg/m3, respectively. The maximum density at any temperature was observed for CaBD, which are found to be 890 kg/m3 at 15 °С and 847 kg/m3 at 105 °С. The density of CaBD is found to be 4.25% and 11.5% greater than HSD and bioethanol, respectively, while the density of CBD is found to be 2.7% and 9.8% higher than HSD and bioethanol, respectively.
A general Equation (11) was developed for calculating the densities of HSD, PBD, CBD, SBD, MBD, CaBD, and bioethanol, respectively, at varying temperature ranges from 15 °С to 105 °С. This equation has been used for calculating the densities of respective biodiesels, HSD, and bioethanol with great precision due to their higher coefficients of determinations.
ρ = f × T + Y
where, ρ represents the density, f is a regression parameter, and Y is constant value. The values of these parameters for biodiesels, HSD, and bioethanol are shown in Table 5.

3.2. Effect of Bioethanol on Density of the Binary Biodiesel Blends

The density of biodiesel blends is higher than HSD and it increases as the quantity of biodiesel in blends increases. When bioethanol is added in binary blends of biodiesel blends, it reduces the ultimate density of ternary blends. The concentration of ethanol in the ternary blends has been linked with the reduction of the density of the final blends [69]. Different concentrations of bioethanol 3%, 6%, 9%, 12%, and 15% by volume were added in binary biodiesel blends, and it was observed that density of ternary blends decreases slightly with increasing concentration of bioethanol. Figure 2a represents the variation in density of pure PBD and ternary biodiesel blends with changing concentrations of diesel, biodiesel, and bioethanol. The measured density of PBD is 876.4 kg/m3 at 15 °С, which is shown as a base line in Figure 2a, and the density of biodiesel blend varies from 849.7 kg/m3 to 852.4 kg/m3 with changing the concentrations of diesel, biodiesel, and bioethanol. The same trends have been shown for the KED model and density correlation developed for the calculations of density of ternary blends on both % volume and % mass bases. Figure 2b,c for CBD and SBD shows the same trends; the density of ternary blends decreases up to 30:15 and, after that, increases with the increasing concentration of biodiesel. Figure 2d shows a slight increase in density with the small addition of bioethanol in the MBD blend and then starts to decrease with the higher amount of ethanol, while Figure 2e represents totally opposite behavior where density of CaBD blends increases up to 30:15 and, after that, it starts to decrease with the addition of more biodiesel in CaBD blends by keeping the concentration of bioethanol constant.

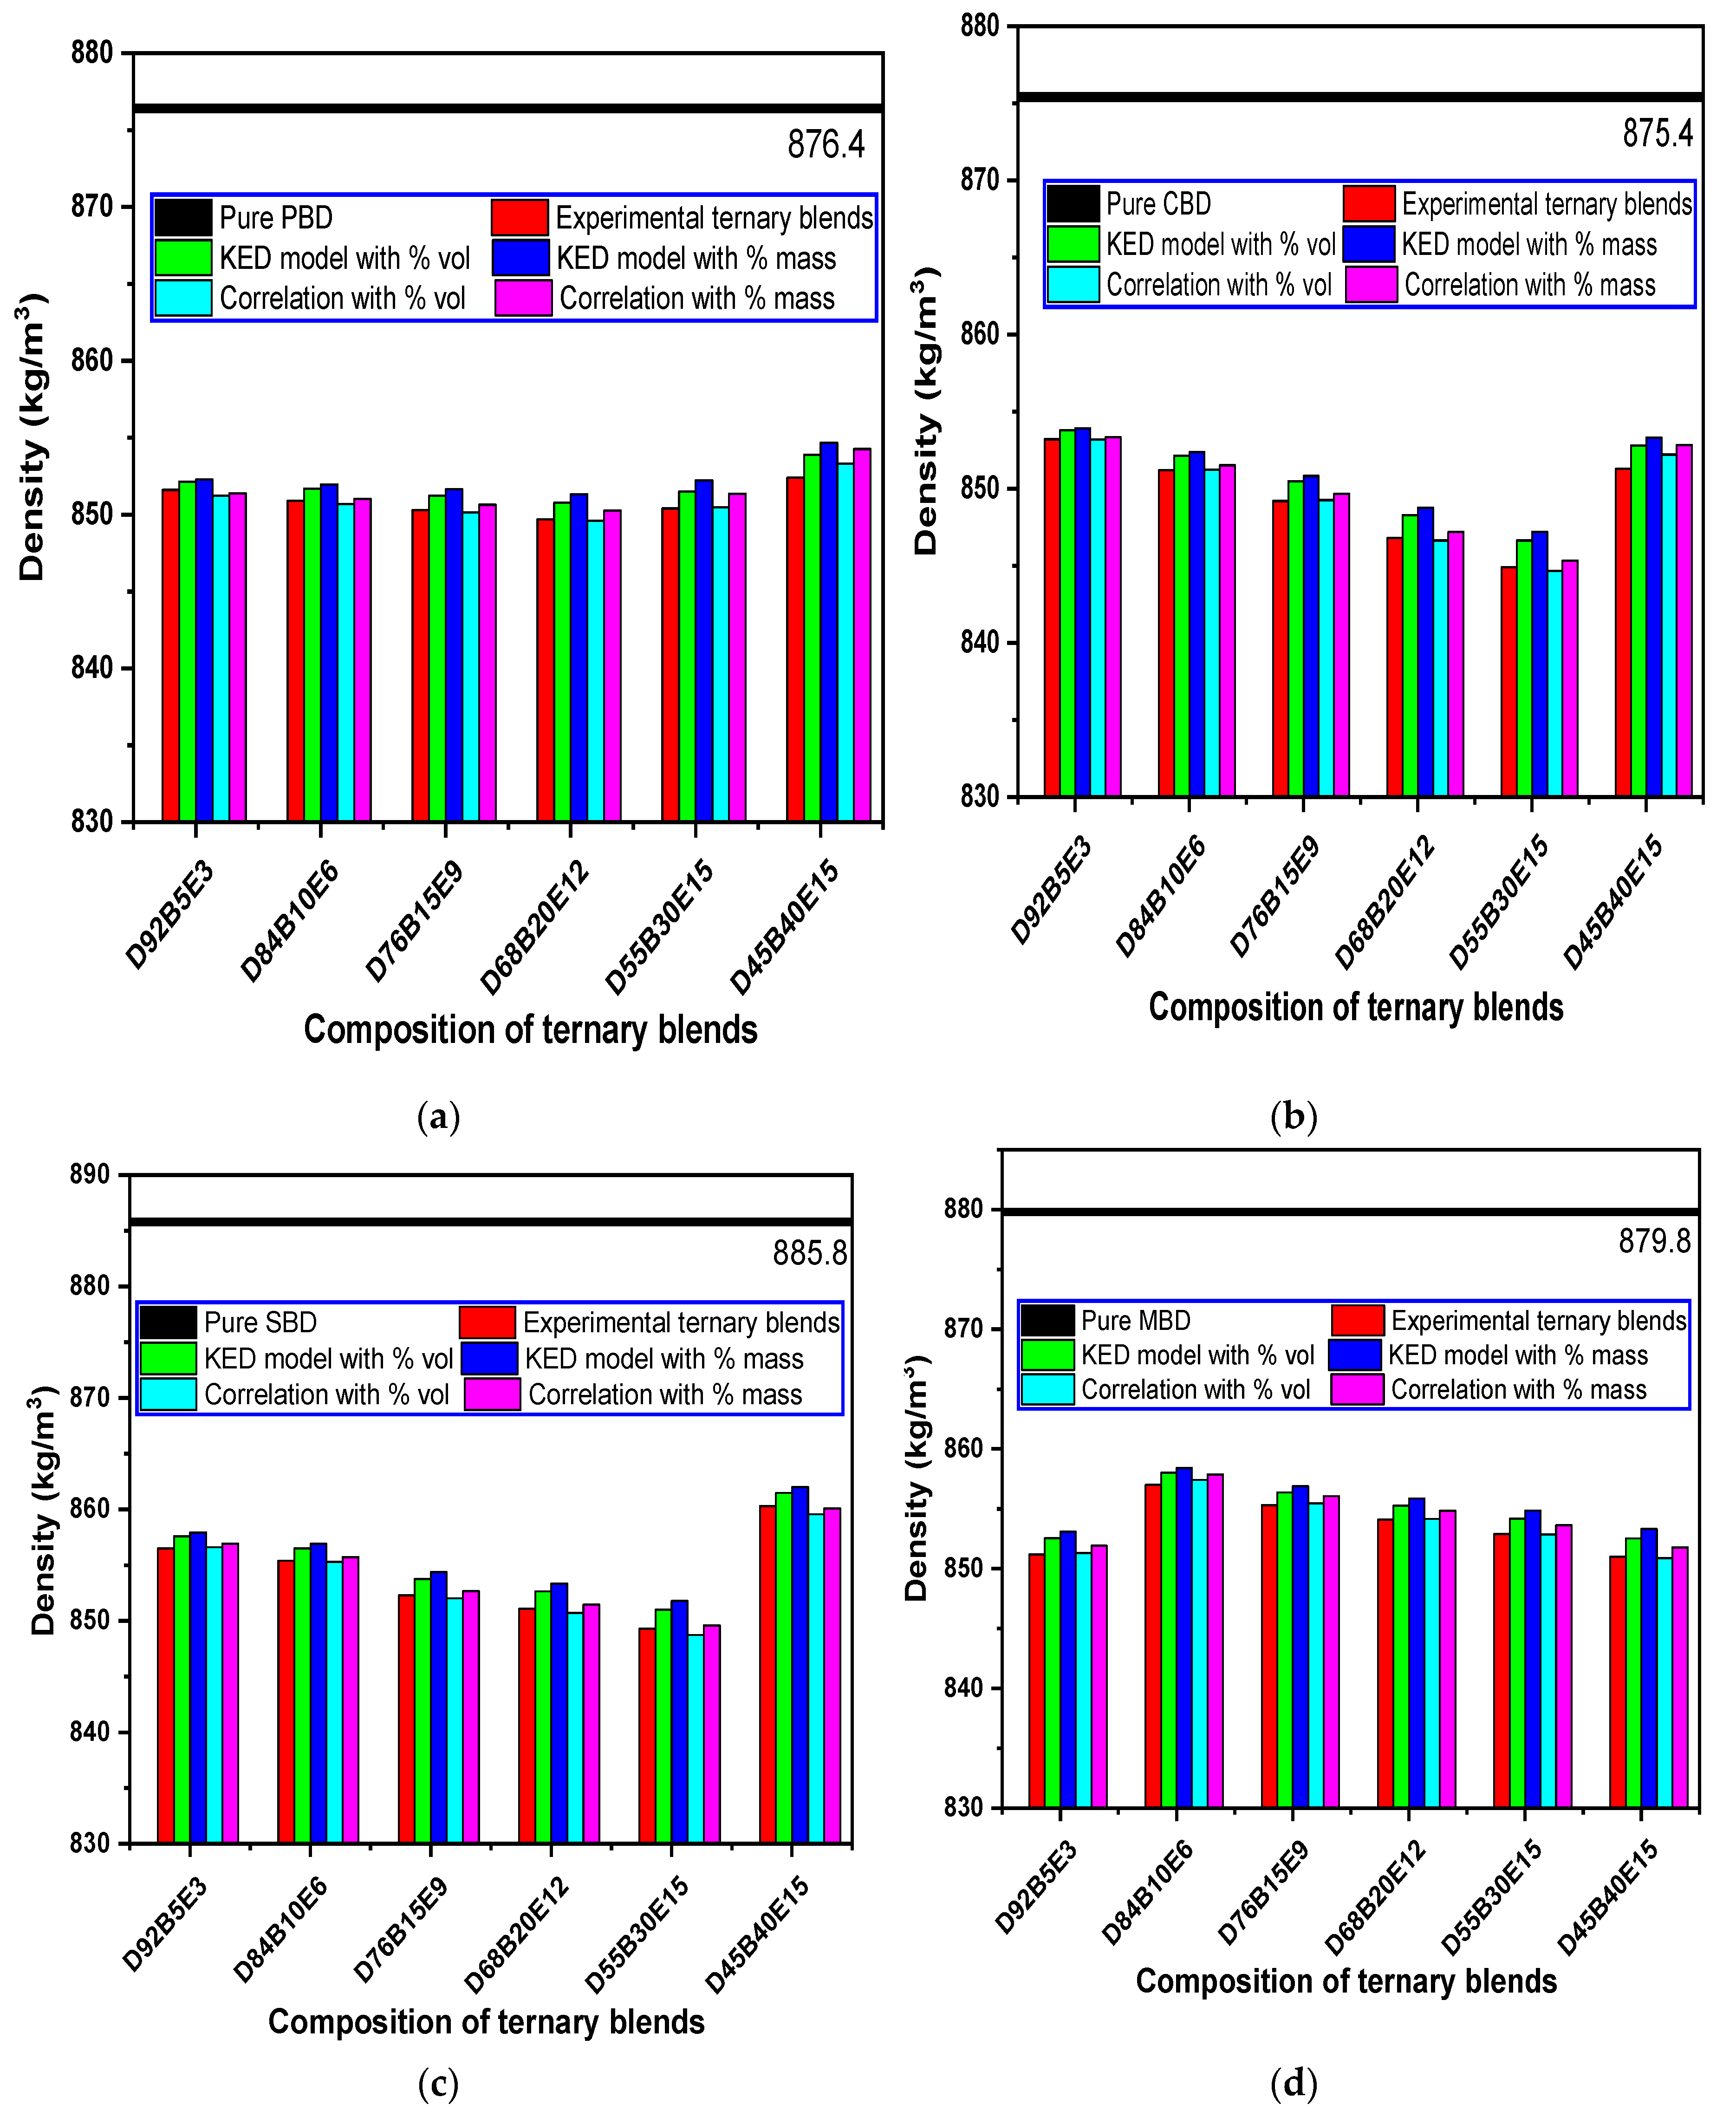
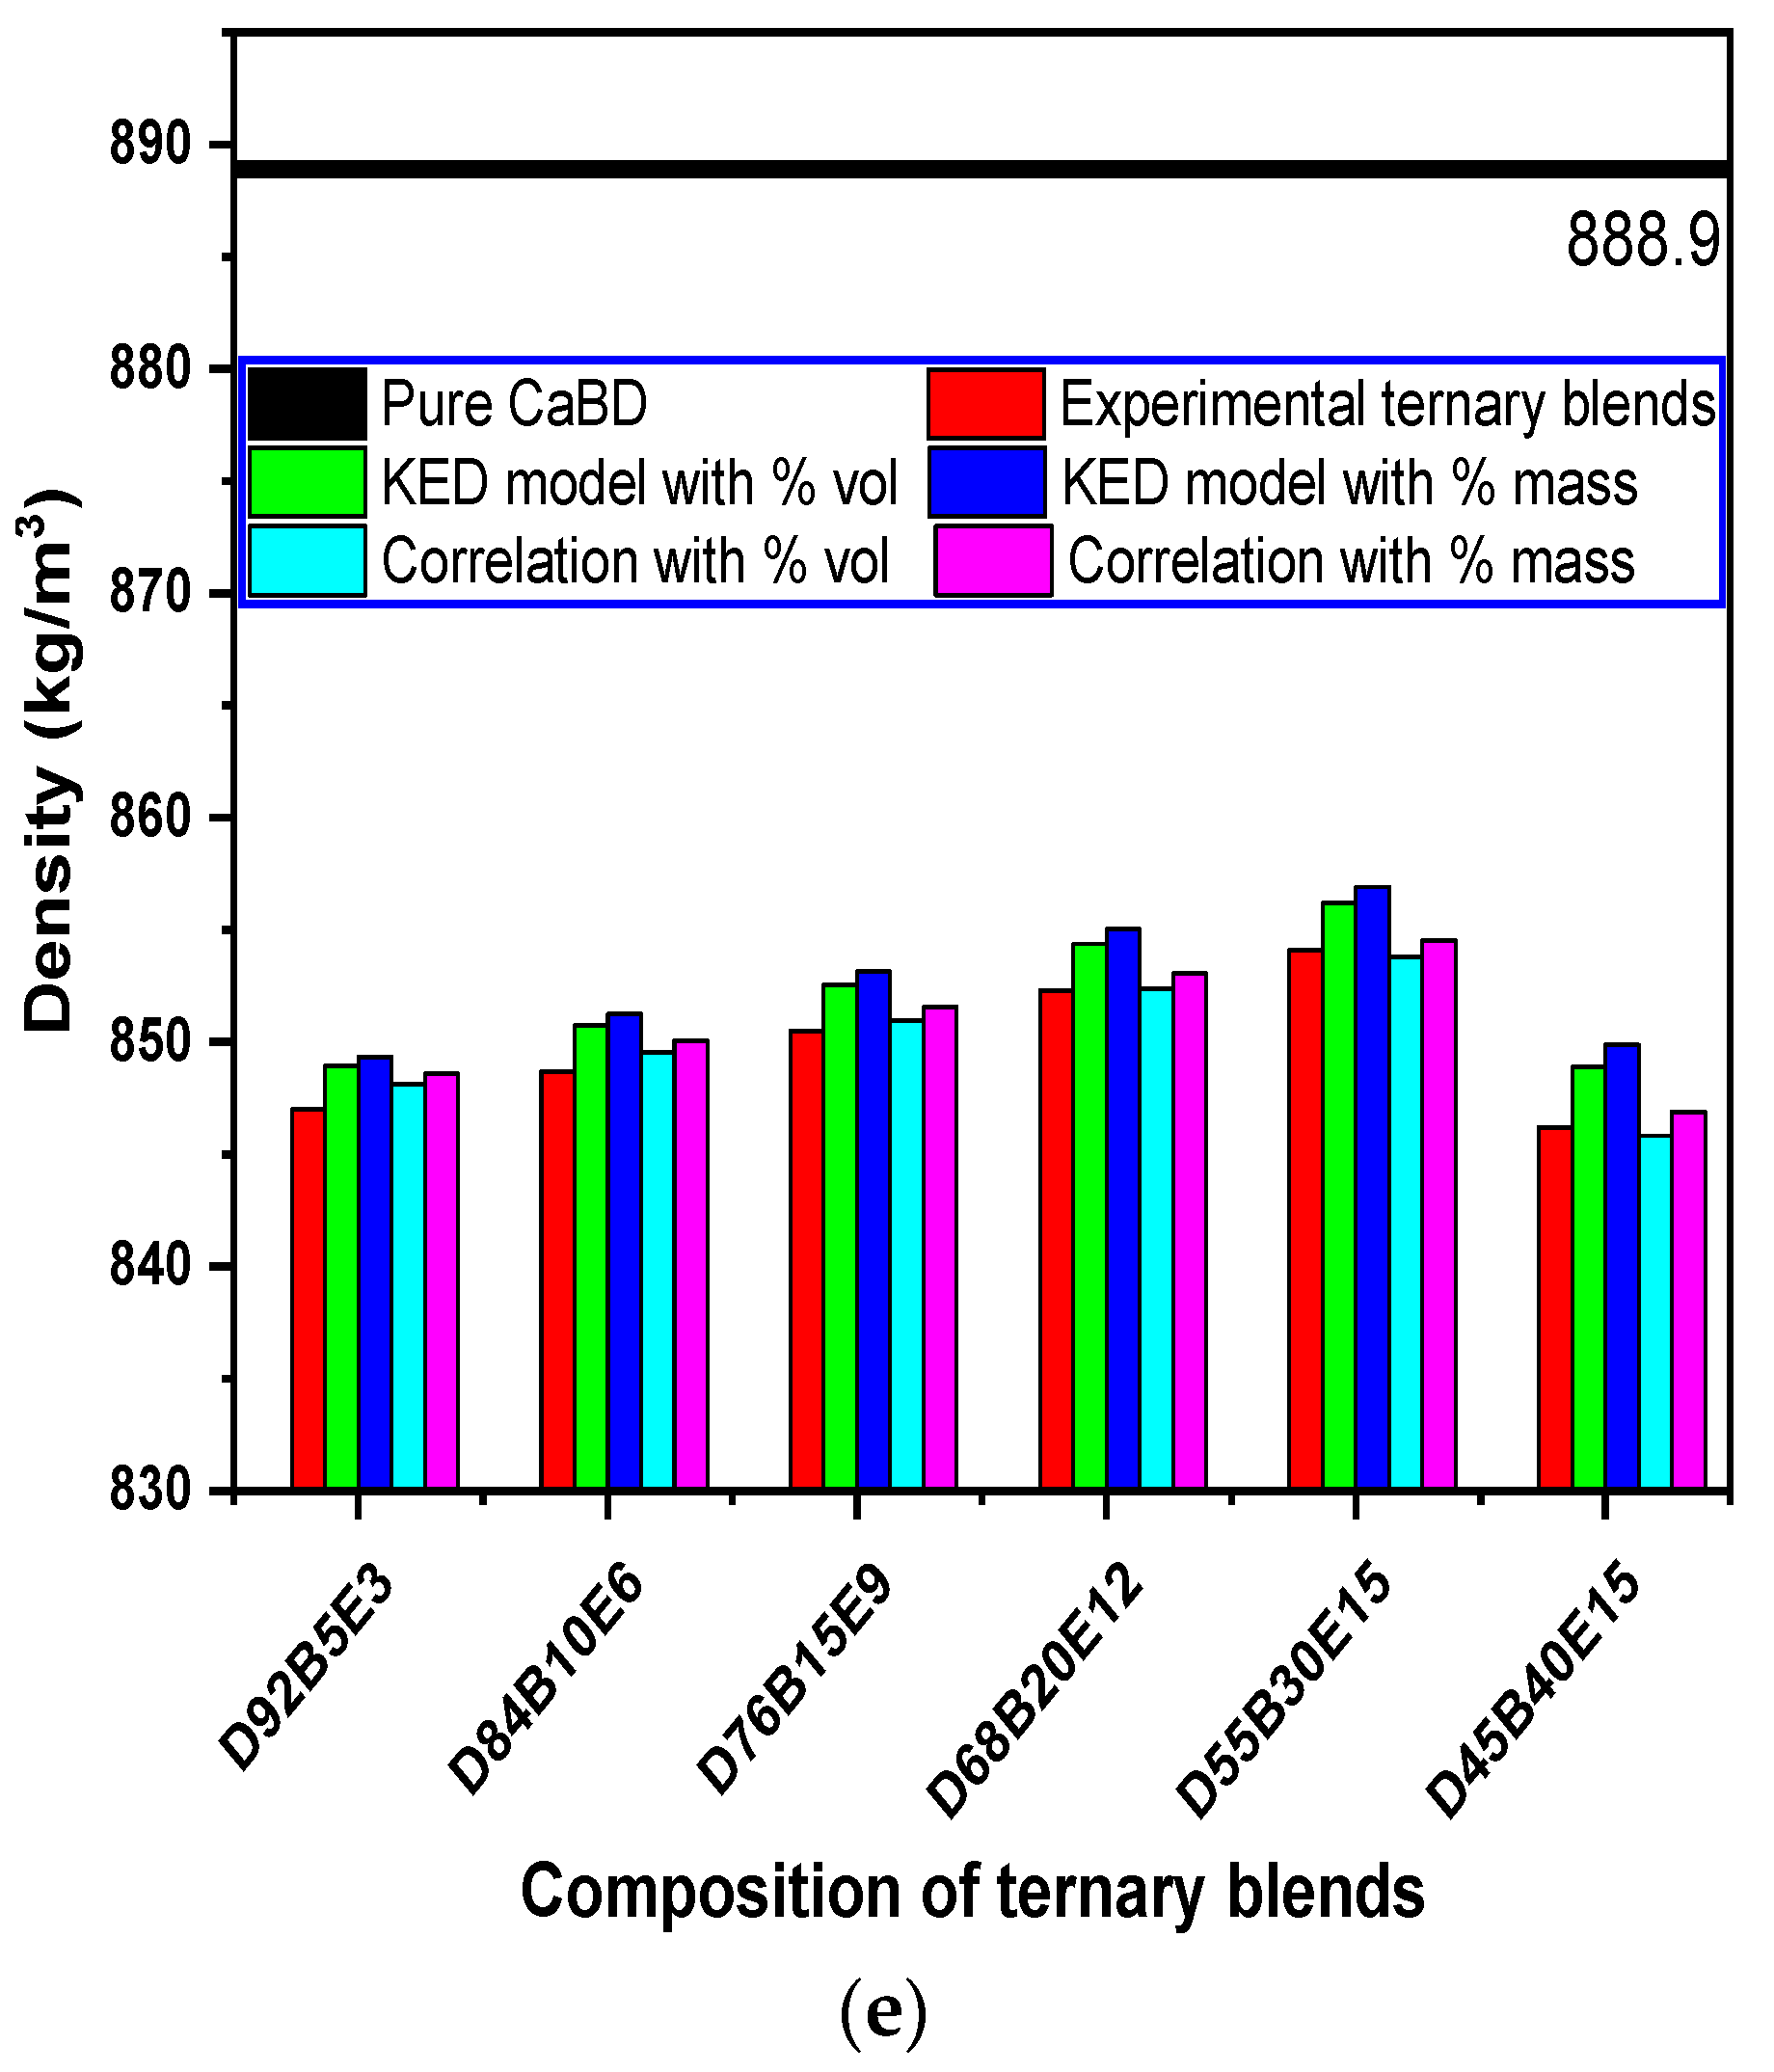
3.3. Evaluation of Density Models

Both KED and density model were tested using statistical tools such as % APE. The results of APE of all blends of five different types of biodiesels with % volume and % mass are shown in Figure 3. For the determination of the most suitable model of the density, the APEs were calculated for each value of KED and density model. Mean Absolute Percentage Error (MAPE) of 0.15% and 0.22% was observed for KED model using % volume and % mass fractions, respectively. On the divergent, using % volume and % mass in the newly developed density model gives MAPE of only 0.045% and 0.085%, respectively. Figure 3 shows the calculative precision of these two models; APEs for all types of biodiesels were calculated on both % volume and % mass bases. It was observed that, for both models using % volume, all biodiesel blends give smaller APE as compared to % mass. The proposed density model has been proved to be the best model for the determination of the densities of ternary blends. This density model shows some deviation with % mass, as the concentration of bioethanol and biodiesel increases in ternary blends; however, on the basis of % volume, this model is suitable for the determination of density of ternary blends containing 15% bioethanol with 30% and 40% biodiesel.

3.4. Effect of Temperature on the Viscosity of Diesel, Ethanol, and Biodiesels

Variation in kinematic viscosities of HSD, bioethanol, and five biodiesels with temperature are shown in Figure 4. MBD shows the maximum density at all temperature ranges from 15 °С to 105 °С as compared to other biodiesels, HSD, and bioethanol. The viscosity of all fuels starts to drop with the increase in temperature. The viscosity of SBD has been found to be nearest to the HSD viscosity (3.6576 mm2/s), which is 4.1775 mm2/s. At 15 °С, the viscosity difference of all fuels has been observed to be high, but with the increase in temperature this difference starts to reduce and at 105 °С, viscosities of all fuels seem to be same except bioethanol. At 78 °С, bioethanol starts to boil. The viscosity pattern of all fuels with the increasing temperature shows nonlinear behavior, unlike density pattern which is linear. To develop more precise viscosity models, the natural log of all viscosity values was determined. After that, Equation (12) was developed for the calculation of viscosity of HSD, all biodiesels, and bioethanol from 15 °С to 105 °С. The higher coefficients of determination specifies that these models are appropriate and best fit in the calculation of viscosity of all components of ternary blends.
log η = f × T + Y
where, T indicates the temperature (°C) and η indicates the kinematic viscosity (mm2/s), f is regression parameter and y is a constant value. Table 6 represents the corresponding values of regression parameters, constants, and R2 for biodiesels, HSD, and bioethanol.

3.5. Effect of Bioethanol on Viscosity of the Binary Biodiesel Blends

Kinematic viscosity of ternary biodiesel blends is influenced by changing the concentration of biodiesel and bioethanol [70]. Blends with higher concentrations of biodiesel have higher viscosity, and with the addition of bioethanol in binary blends, the kinematic viscosity starts to decrease. Figure 5a represents the kinematic viscosity of pure PBD and its ternary blends with different concentrations of diesel-biodiesel-bioethanol; the kinematic viscosities of PBD and ternary blend D92B5E3 measured with viscometer were observed to be 4.4844 mm2/s and 3.3298 mm2/s at 40 °С, respectively. Kinematic viscosity of these ternary blends was precisely calculated by the Grunberg model and by three newly developed models on the bases of % volume and % mass. The kinematic viscosity of D92B5E3 blend varies by 2.38%, 3.72%, and 5.39% on % volume bases and by 1.61%, 4.06%, and 5.67% on % mass bases for developed viscosity models 1, 2, and 3 as compared to the Grunberg model.
The kinematic viscosity of coconut biodiesel and its ternary blends is illustrated in Figure 5b; viscosity of CBD measured with viscometer was observed to be 2.7675 mm2/s. The viscosity of ternary blends calculated using Grunberg model increases for all blends; a sharp decrease in viscosity was observed for D55B30E15 for all three viscosity models. In Figure 5c, the kinematic viscosity of all ternary blends of SBD calculated by four proposed models shows decline up to D55B30E15 blend, and after with increasing concentration of biodiesel or bioethanol, it starts to increase. In Figure 5d, the viscosity of MBD blends calculated from all proposed models shows an increase in viscosity up to D84B10E6 blend and then starts to decease with the addition of bioethanol and biodiesel. MBD has maximum kinematic viscosity among all biodiesels. The viscosity of CaBD and its ternary blends is illustrated in Figure 5e; the measured viscosity of CaBD is 5.0296 mm2/s at 40 °С. All proposed viscosity models show a sharp decline in kinematic viscosity of biodiesel blends with the increase in concentration of biodiesel and bioethanol.

3.6. Evaluation of Viscosity Models

To validate the Grunberg model and three suggested viscosity models, each value obtained from these models was compared with the measured viscosity value using viscometer. Some statistical tools including % APE and % MAPE were also tested. Figure 6 shows APEs of all biodiesel blends on % volume and % mass bases. The MAPE obtained from three proposed viscosity models on the bases of volume fraction in percentage are 1.85, 1.41, and 3.48, respectively, while on the base of % mass fraction they are 2.27%, 1.85%, and 3.56%, respectively. For obtaining the viscosity of ternary blends with respect to volume fraction, viscosity model 2 with exponential regression analysis was considered to be the best one. The Grunberg model shows deviation for all biodiesel blends. The other three viscosity models are good enough for obtaining the viscosity of ternary blends. From Figure 6a–e, it was observed that viscosity model 2 gives the precise values of viscosity for PBD, CBD, SBD, and MBD blends, but it is not suitable for the CaBD blends. The best model for CaBD is viscosity model 1.

4. Conclusions

The viscosity and density of binary biodiesel blends decreases with the addition of bioethanol. In this work, two density and four viscosity models were used to predict the precise values of density and viscosity of diesel-biodiesel-bioethanol blends. These models can be helpful to determine the density and viscosity of ternary blends more accurately for temperatures ranging from 15 °С to 75 °С; outside this temperature range, the accuracy of these models will be dropped, as ethanol starts to evaporate at 78 °С. The accuracy of these models was evaluated using % APE and % MAPE statistical tools. Among density models, the newly developed density model gives more accurate results on % mass fraction, and viscosity model 2 gives the precise values of viscosity for PBD, CBD, SBD, and MBD blends, but it is not suitable for the CaBD blends. The best model for CaBD is viscosity model 1.

Author Contributions

Conceptualization, L.R., M.F. (Muhammad Farooq) and M.A.M.; methodology, M.A.K, M.F. (Muhammad Farooq); software, F.S., M.I.; validation, A.E.A, M.T.H. and M.E.M.S.; formal analysis, L.R. and M.F. (Muhammad Farooq); investigation, M.F. (Muhammad Farooq) and M.A.K.; resources, F.S. and M.I.; data curation, M.A.K.; writing—original draft preparation, L.R. and M.F. (Muhammad Farooq); writing—review and editing, M.F. (Muhammad Farhan), M.A.M.; visualization, A.E.A.; supervision, M.A.K. and M.F. (Muhammad Farhan); project administration, F.S. and M.A.K.; funding acquisition, M.A.K. and F.S. All authors have read and agreed to the published version of the manuscript.

Funding

The authors would like to thank the Faculty of Engineering at the University of Malaya, Malaysia for their support through the research grant no GPF018A-2019.

Conflicts of Interest

The authors declare no conflict of interest.

Nomenclature

PBDPalm biodiesel
CBDCoconut biodiesel
SBDSoybean biodiesel
MBDMustard biodiesel
CaBDCalophyllum biodiesel
HSDHigh-speed diesel
APEAbsolute percentage error (%)
MAPEMean absolute percentage error (%)
KEDKay’s mixing rule
η blend Kinematic viscosity of the ternary blend (mm2/s)
η υ Kinematic viscosity of the ternary blends (mm2/s)
δ i Mass or volume fraction of the individual components
ρ blend Density of the ternary blend (kg/m3)
ρ BD Density of biodiesel (kg/m3)
DPercentage mass or percentage volume portion of diesel in the ternary blend
BDPercentage mass or percentage volume portion of biodiesel in the ternary blend
EtOHPercentage mass or percentage volume portion of ethanol in the ternary blend
SDStandard deviation
R2Coefficients of determinations
XexptDensity and viscosity values obtained from experiments (kg/m3), (mm2/s)
XcalcDensity and viscosity values calculated using proposed models (kg/m3), (mm2/s)
x e x p t ¯ Average value of the measured densities and viscosities (kg/m3), (mm2/s)
NTotal number of observations

References

  1. Ağbulut, Ü.; Sarıdemir, S. A general view to converting fossil fuels to cleaner energy source by adding nanoparticles. Int. J. Ambient Energy 2018, 1–6. [Google Scholar] [CrossRef]
  2. Goga, G.; Chauhan, B.S.; Mahla, S.K.; Cho, H.M. Performance and emission characteristics of diesel engine fueled with rice bran biodiesel and n-butanol. Energy Rep. 2019, 5, 78–83. [Google Scholar] [CrossRef]
  3. Mansir, N.; Teo, S.H.; Rashid, U.; Saiman, M.I.; Tan, Y.P.; Alsultan, G.A.; Taufiq-Yap, Y.H. Modified waste egg shell derived bifunctional catalyst for biodiesel production from high FFA waste cooking oil. A review. Renew. Sustain. Energy Rev. 2018, 82, 3645–3655. [Google Scholar] [CrossRef]
  4. Yunus Khan, T.M.; Badruddin, I.A.; Ankalgi, R.F.; Badarudin, A.; Hungund, B.S.; Ankalgi, F.R. Biodiesel Production by Direct Transesterification Process via Sequential Use of Acid–Base Catalysis. Arab. J. Sci. Eng. 2018, 43, 5929–5936. [Google Scholar] [CrossRef]
  5. Sung, J.H.; Ryu, Y.; Seo, S.B. Utilizing Bivariate Climate Forecasts to Update the Probabilities of Ensemble Streamflow Prediction. Sustainability 2020, 12, 2905. [Google Scholar] [CrossRef] [Green Version]
  6. Perea-Moreno, M.A.; Manzano-Agugliaro, F.; Hernandez-Escobedo, Q.; Perea-Moreno, A.J. Sustainable thermal energy generation at universities by using loquat seeds as biofuel. Sustainability 2020, 12, 2093. [Google Scholar] [CrossRef] [Green Version]
  7. Tucki, K.; Orynycz, O.; Mruk, R.; Świć, A.; Botwińska, K. Modeling of biofuel’s emissivity for fuel choice management. Sustainability 2019, 11, 6842. [Google Scholar] [CrossRef] [Green Version]
  8. Wang, T.; Yu, W.; Liu, F.; Fang, M.; Farooq, M.; Luo, Z. Enhanced CO2 absorption and desorption by monoethanolamine (MEA)-based nanoparticle suspensions. Ind. Eng. Chem. Res. 2016, 55, 7830–7838. [Google Scholar] [CrossRef]
  9. Arslan, M.; Farooq, M.; Naqvi, M.; Sultan, U.; Tahir, Z.-R.; Nawaz, S.; Waheed, N.; Naqvi, S.R.; Ali, Q.; Tariq, M.S. Impact of Varying Load Conditions and Cooling Energy Comparison of a Double-Inlet Pulse Tube Refrigerator. Processes 2020, 8, 352. [Google Scholar] [CrossRef] [Green Version]
  10. Zhang, Z.; Lis, M. Modeling green energy development based on sustainable economic growth in China. Sustainability 2020, 12, 1368. [Google Scholar] [CrossRef] [Green Version]
  11. Farooq, M.; Hamayoun, A.; Naqvi, M.; Nawaz, S.; Usman, M.; Naqvi, S.R.; Imran, M.; Nadeem, R.; Razi, A.; Turan, A.; et al. Thermodynamic Performance Analysis of Hydrofluoroolefins (HFO) Refrigerants in Commercial Air-Conditioning Systems for Sustainable Environment. Processes 2020, 8, 187. [Google Scholar] [CrossRef] [Green Version]
  12. Uddin, G.M.; Niazi, S.G.; Arafat, S.M.; Kamran, M.S.; Farooq, M.; Hayat, N.; Malik, S.A.; Zeid, A.; Kamarthi, S.; Saqib, S.; et al. Neural networks assisted computational aero-acoustic analysis of an isolated tire. Proc. Inst. Mech. Eng. Part D J. Automob. Eng. 2020, 0954407020. [Google Scholar] [CrossRef]
  13. Okoro, O.V.; Sun, Z.; Birch, J. Techno-economic assessment of a scaled-up meat waste biorefinery system: A simulation study. Materials (Basel) 2019, 12, 1030. [Google Scholar] [CrossRef] [PubMed] [Green Version]
  14. Uddin, G.M.; Arafat, S.M.; Ashraf, W.M.; Asim, M.; Bhutta, M.M.A.; Jatoi, H.U.K.; Niazi, S.G.; Jamil, A.; Farooq, M.; Ghufran, M. Artificial Intelligence-Based Emission Reduction Strategy for Limestone Forced Oxidation Flue Gas Desulfurization System. J. Energy Resour. Technol. 2020, 142, 092103. [Google Scholar] [CrossRef]
  15. Kashif, M.; Awan, M.B.; Nawaz, S.; Amjad, M.; Talib, B.; Farooq, M.; Nizami, A.S.; Rehan, M. Untapped renewable energy potential of crop residues in Pakistan: Challenges and future directions. J. Environ. Manag. 2020, 256, 109924. [Google Scholar] [CrossRef]
  16. Almustapha, M.N.; Farooq, M.; Mohammed, M.L.; Farhan, M.; Imran, M.; Andresen, J.M. Modification of acidic and textural properties of a sulphated zirconia catalyst for efficient conversion of high-density polyethylene into liquid fuel. Environ. Sci. Pollut. Res. 2019, 27, 55–65. [Google Scholar] [CrossRef]
  17. Farooq, M.; Asim, M.; Imran, M.; Imran, S.; Ahmad, J.; Younis, M.R. Mapping past, current and future energy research trend in Pakistan: A scientometric assessment. Scientometrics 2018, 117, 1733–1753. [Google Scholar] [CrossRef]
  18. Syed, M.S.; Farooq, M.; Qamar, A. Modeling and Forecasting of Energy Scenario in Pakistan with Application of Decentralized Energy Planning. J. Fac. Eng. Technol. 2014, 21, 11–24. [Google Scholar]
  19. Lenzen, M. Current state of development of electricity-generating technologies: A literature review. Energies 2010, 3, 462. [Google Scholar] [CrossRef]
  20. Imran, S.; Emberson, D.R.; Hussain, A.; Ali, H.; Ihracska, B.; Korakianitis, T. Performance and specific emissions contours throughout the operating range of hydrogen-fueled compression ignition engine with diesel and RME pilot fuels. Alex. Eng. J. 2015, 54, 303–314. [Google Scholar] [CrossRef] [Green Version]
  21. Suresh, M.; Jawahar, C.P.; Richard, A. A review on biodiesel production, combustion, performance, and emission characteristics of non-edible oils in variable compression ratio diesel engine using biodiesel and its blends. Renew. Sustain. Energy Rev. 2018, 92, 38–49. [Google Scholar] [CrossRef]
  22. Farooq, M.; Saeed, M.A.; Imran, M.; Uddin, G.M.; Asim, M.; Bilal, H.; Younas, M.R.; Andresen, J.M. CO2 capture through electro-conductive adsorbent using physical adsorption system for sustainable development. Environ. Geochem. Health 2019, 1–9. [Google Scholar] [CrossRef] [PubMed]
  23. Glensor, K.; María Rosa Muñoz, B. Life-cycle assessment of Brazilian transport biofuel and electrification pathways. Sustainability 2019, 11, 6332. [Google Scholar] [CrossRef] [Green Version]
  24. Kumar, S.; Abdul Salam, P.; Shrestha, P.; Ackom, E.K. An assessment of thailand’s biofuel development. Sustainability 2013, 5, 1577. [Google Scholar] [CrossRef] [Green Version]
  25. Lorenzo-s, E.; Oliver-villanueva, J.; Coll-aliaga, E. Energy E ffi ciency and GHG Emissions Mapping of Buildings for Decision-Making Processes against Climate Change at the Local Level. Sustainability 2020, 12, 2982. [Google Scholar] [CrossRef] [Green Version]
  26. Liu, H.; Zhang, S.; Chen, G.; Gao, Q. Observed Characteristics and Modeled Emissions of Transit Buses on Ramps. Sustainability 2020, 12, 2770. [Google Scholar] [CrossRef] [Green Version]
  27. Bae, C.; Kim, J. Alternative fuels for internal combustion engines. Proc. Combust. Inst. 2017, 36, 3389–3413. [Google Scholar] [CrossRef]
  28. Usman, M.; Farooq, M.; Naqvi, M.; Saleem, M.W.; Hussain, J.; Naqvi, S.R.; Jahangir, S.; Usama, J.; Muhammad, H.; Idrees, S. Use of Gasoline, LPG and LPG-HHO Blend in SI Engine: A Comparative Performance for Emission Control and Sustainable Environment. Processes 2020, 8, 74. [Google Scholar] [CrossRef] [Green Version]
  29. Saeed, M.A.; Farooq, M.; Andrews, G.E.; Phylaktou, H.N.; Gibbs, B.M. Ignition sensitivity of different compositional wood pellets and particle size dependence. J. Environ. Manag. 2019, 232, 789–795. [Google Scholar] [CrossRef]
  30. Yıldızhan, Ş. Hydrogen addition to tea seed oil biodiesel: Performance and emission characteristics. Int. J. Hydrogen Energy 2018, 43, 18020–18027. [Google Scholar]
  31. Rizwanul Fattah, I.M.; Masjuki, H.H.; Kalam, M.A.; Mofijur, M.; Abedin, M.J. Effect of antioxidant on the performance and emission characteristics of a diesel engine fueled with palm biodiesel blends. Energy Convers. Manag. 2014, 79, 265–272. [Google Scholar] [CrossRef]
  32. Ramalingam, S.; Rajendran, S.; Ganesan, P. Performance improvement and exhaust emissions reduction in biodiesel operated diesel engine through the use of operating parameters and catalytic converter: A review. Renew. Sustain. Energy Rev. 2018, 81, 3215–3222. [Google Scholar] [CrossRef]
  33. Can, Ö.; Öztürk, E.; Solmaz, H.; Aksoy, F.; Çinar, C.; Yücesu, H.S. Combined effects of soybean biodiesel fuel addition and EGR application on the combustion and exhaust emissions in a diesel engine. Appl. Therm. Eng. 2016, 95, 115–124. [Google Scholar] [CrossRef]
  34. Musa, I.A. The effects of alcohol to oil molar ratios and the type of alcohol on biodiesel production using transesterification process. Egypt. J. Pet. 2016, 25, 21–31. [Google Scholar] [CrossRef] [Green Version]
  35. Development, R. Impacts of International Commodity Trade on Conventional Biofuels Production. Sustainability 2020, 12, 2626. [Google Scholar]
  36. Samios, D.; Pedrotti, F.; Nicolau, A.; Reiznautt, Q.B.; Martini, D.D.; Dalcin, F.M. A Transesterification Double Step Process — TDSP for biodiesel preparation from fatty acids triglycerides. Fuel Process. Technol. 2009, 90, 599–605. [Google Scholar] [CrossRef]
  37. Mostafaei, M.; Javadikia, H.; Naderloo, L. Modeling the effects of ultrasound power and reactor dimension on the biodiesel production yield: Comparison of prediction abilities between response surface methodology (RSM) and adaptive neuro-fuzzy inference system (ANFIS). Energy 2016, 115, 626–636. [Google Scholar] [CrossRef]
  38. Singh, D.; Sharma, D.; Soni, S.L.; Sharma, S.; Kumar Sharma, P.; Jhalani, A. A review on feedstocks, production processes, and yield for different generations of biodiesel. Fuel 2020, 262, 116553. [Google Scholar] [CrossRef]
  39. Hoang, A.T. Prediction of the density and viscosity of biodiesel and the influence of biodiesel properties on a diesel engine fuel supply system. J. Mar. Eng. Technol. 2018, 1–13. [Google Scholar] [CrossRef]
  40. Younis, M.R.; Farooq, M.; Imran, M.; Kazim, A.H.; Shabbir, A. Characterization of the viscosity of bio-oil produced by fast pyrolysis of the wheat straw. Energy Sources Part A Recover. Util. Environ. Eff. 2019, 1–16. [Google Scholar] [CrossRef]
  41. Jeevanantham, A.K.; Nanthagopal, K.; Ashok, B.; Al-Muhtaseb, A.H.; Thiyagarajan, S.; Geo, V.E.; Ong, H.C.; Samuel, K.J. Impact of addition of two ether additives with high speed diesel-Calophyllum Inophyllum biodiesel blends on NOx reduction in CI engine. Energy 2019, 185, 39–54. [Google Scholar] [CrossRef]
  42. Suh, H.K.; Lee, C.S. A review on atomization and exhaust emissions of a biodiesel-fueled compression ignition engine. Renew. Sustain. Energy Rev. 2016, 58, 1601–1620. [Google Scholar] [CrossRef]
  43. Barabás, I. Liquid densities and excess molar volumes of ethanol + biodiesel binary system between the temperatures 273.15 K and 333.15 K. J. Mol. Liq. 2015, 204, 95–99. [Google Scholar] [CrossRef]
  44. Reddy, S.M.; Sharma, N.; Gupta, N.; Agarwal, A.K. Effect of non-edible oil and its biodiesel on wear of fuel injection equipment components of a genset engine. Fuel 2018, 222, 841–851. [Google Scholar] [CrossRef]
  45. Kegl, B. Biodiesel usage at low temperature. Fuel 2008, 87, 1306–1317. [Google Scholar] [CrossRef]
  46. Lapuerta, M.; Rodríguez-Fernández, J.; Fernández-Rodríguez, D.; Patiño-Camino, R. Cold flow and filterability properties of n-butanol and ethanol blends with diesel and biodiesel fuels. Fuel 2018, 224, 552–559. [Google Scholar] [CrossRef]
  47. Caligiuri, C.; Renzi, M.; Bietresato, M.; Baratieri, M. Experimental investigation on the effects of bioethanol addition in diesel-biodiesel blends on emissions and performances of a micro-cogeneration system. Energy Convers. Manag. 2019, 185, 55–65. [Google Scholar] [CrossRef]
  48. Todoruț, A.; Molea, A.; Barabás, I. Predicting the temperature and composition—Dependent density and viscosity of diesel fuel—Ethanol blends. Period. Polytech. Chem. Eng. 2020, 64, 213–220. [Google Scholar] [CrossRef] [Green Version]
  49. Emiroğlu, A.O.; Şen, M. Combustion, performance and exhaust emission characterizations of a diesel engine operating with a ternary blend (alcohol-biodiesel-diesel fuel). Appl. Therm. Eng. 2018, 133, 371–380. [Google Scholar] [CrossRef]
  50. Verhelst, S.; Turner, J.W.; Sileghem, L.; Vancoillie, J. Methanol as a fuel for internal combustion engines. Prog. Energy Combust. Sci. 2019, 70, 43–88. [Google Scholar] [CrossRef] [Green Version]
  51. Fan, J.; Liu, Q.; Song, F.; Wang, X.; Zhang, L. Experimental investigations on the liquid thermal conductivity of five saturated fatty acid methyl esters components of biodiesel. J. Chem. Thermodyn. 2018, 125, 50–55. [Google Scholar] [CrossRef]
  52. Barabás, I.; Todoruţ, A.I. Key Fuel Properties of Biodiesel-Diesel Fuel-Ethanol Blends; SAE: Warrendale, PA, USA, 2009; Available online: https://www.sae.org/publications/technical-papers/content/2009-01-1810/ (accessed on 24 June 2020).
  53. Na, M.M.; Aziz, A.; Rashid, A.; Hagos, F.Y.; Noor, M.M.; Kadirgama, K.; Mamat, R.; Abdullah, A.A. The influence of formulation ratio and emulsifying settings on tri-fuel (Diesel–Ethanol–Biodiesel) emulsion properties. Energies 2019, 12, 1708. [Google Scholar] [CrossRef] [Green Version]
  54. Ramírez Verduzco, L.F. Density and viscosity of biodiesel as a function of temperature: Empirical models. Renew. Sustain. Energy Rev. 2013, 19, 652–665. [Google Scholar] [CrossRef]
  55. Dong, N.H.; Duong, N.H. An empirical approach for predicting biodiesel fuels dynamic viscosity from their fatty acid ester composition at various temperatures. Petrovietnal J. 2015, 6, 33–42. [Google Scholar]
  56. Niculescu, R.; Clenci, A.; Iorga-Siman, V. Review on the Use of Diesel–Biodiesel–Alcohol Blends in Compression Ignition Engines. Energies 2019, 12, 1194. [Google Scholar] [CrossRef] [Green Version]
  57. Lapuerta, M.; Rodríguez-Fernández, J.; Fernández-Rodríguez, D.; Patiño-Camino, R. Modeling viscosity of butanol and ethanol blends with diesel and biodiesel fuels. Fuel 2017, 199, 332–338. [Google Scholar] [CrossRef]
  58. Hurtado, B.; Posadillo, A.; Luna, D.; Bautista, F.M.; Hidalgo, J.M.; Luna, C.; Calero, J.; Romero, A.A.; Estevez, R. Synthesis, performance and emission quality assessment of ecodiesel from castor oil in diesel/biofuel/alcohol triple blends in a diesel engine. Catalysts 2019, 9, 40. [Google Scholar] [CrossRef] [Green Version]
  59. Barabás, I.; Todoruţ, I.-A. Predicting the temperature dependent viscosity of biodiesel–diesel–bioethanol blends. Energy Fuels 2011, 25, 5767–5774. [Google Scholar] [CrossRef]
  60. Barabás, I. Predicting the temperature dependent density of biodiesel–diesel–bioethanol blends. Fuel 2013, 109, 563–574. [Google Scholar] [CrossRef]
  61. Chavarria-Hernandez, J.C.; Pacheco-Catalán, D.E. Predicting the kinematic viscosity of FAMEs and biodiesel: Empirical models. Fuel 2014, 124, 212–220. [Google Scholar] [CrossRef]
  62. Allen, C.A.W.; Watts, K.C.; Ackman, R.G.; Pegg, M.J. Predicting the viscosity of biodiesel fuels from their fatty acid ester composition. Fuel 1999, 78, 1319–1326. [Google Scholar] [CrossRef]
  63. Pereira, E.; Meirelles, A.J.A.; Maximo, G.J. Predictive models for physical properties of fats, oils, and biodiesel fuels. Fluid Phase Equilib. 2020, 508, 112440. [Google Scholar] [CrossRef]
  64. Mallah, T.A.; Sahito, A.R. Optimization of castor and neem biodiesel blends and development of empirical models to predicts its characteristics. Fuel 2020, 262, 116341. [Google Scholar] [CrossRef]
  65. Atabani, A.E.; Shobana, S.; Mohammed, M.N.; Uğuz, G.; Kumar, G.; Arvindnarayan, S.; Aslam, M.; Al-Muhtaseb, A.H. Integrated valorization of waste cooking oil and spent coffee grounds for biodiesel production: Blending with higher alcohols, FT–IR, TGA, DSC and NMR characterizations. Fuel 2019, 244, 419–430. [Google Scholar] [CrossRef]
  66. Adu-Mensah, D.; Mei, D.; Zuo, L.; Zhang, Q.; Wang, J. A review on partial hydrogenation of biodiesel and its influence on fuel properties. Fuel 2019, 251, 660–668. [Google Scholar] [CrossRef]
  67. Silitonga, A.S.; Masjuki, H.H.; Ong, H.C.; Kusumo, F.; Mahlia, T.M.I.; Bahar, A.H. Pilot-scale production and the physicochemical properties of palm and Calophyllum inophyllum biodiesels and their blends. J. Clean. Prod. 2016, 126, 654–666. [Google Scholar] [CrossRef]
  68. Jiang, S.; Qi, J.; Hu, Y.; Ren, C.; Jiang, Y.; Zhao, Z. Predicting the Density and Viscosity of Biodiesels and Biodiesel Blends by the Regular-Solution Theory. Ind. Eng. Chem. Res. 2019, 58, 17038–17048. [Google Scholar] [CrossRef]
  69. Corral-Gómez, L.; Rubio-Gómez, G.; Martínez-Martínez, S.; Sánchez-Cruz, F.A. Effect of diesel-biodiesel-ethanol blends on the spray macroscopic parameters in a common-rail diesel injection system. Fuel 2019, 241, 876–883. [Google Scholar] [CrossRef]
  70. Saleh, H.E.; Selim, M.Y.E. Improving the performance and emission characteristics of a diesel engine fueled by jojoba methyl ester-diesel-ethanol ternary blends. Fuel 2017, 207, 690–701. [Google Scholar] [CrossRef]
Figure 1. Effect of temperature on the density of diesel, biodiesel, and bioethanol.
Sustainability 12 05186 g001
Figure 2. Density variation of (a) PBD, (b) CBD, (c) SBD, (d) MBD, (e) CaBD blends with diesel and bioethanol by experimental method, KED model, and density correlation.
Sustainability 12 05186 g002aSustainability 12 05186 g002b
Figure 3. APEs for KED and density model of ternary biodiesel blends (a) PBD, (b) CBD, (c) SBD, (d) MBD, (e) CaBD using % volume and % mass fraction.
Sustainability 12 05186 g003aSustainability 12 05186 g003b
Figure 4. Effect of temperature on the viscosity of diesel, biodiesels, and bioethanol.
Sustainability 12 05186 g004
Figure 5. Viscosity variation of (a) PBD, (b) CBD, (c) SBD, (d) MBD, (e) CaBD blends with diesel and bioethanol by experimental method, Grunberg model, and viscosity models on % volume and % mass bases.
Sustainability 12 05186 g005aSustainability 12 05186 g005b
Figure 6. APEs for Grunberg and viscosity models of ternary biodiesel blends (a) PBD, (b) CBD, (c) SBD, (d) MBD, (e) CaBD using % volume and % mass fraction.
Sustainability 12 05186 g006aSustainability 12 05186 g006b
Table 1. Composition of tertiary blends used in this study.
NameDiesel (%)Biodiesel (%)Ethanol (%)
D10010000
D92B5E39253
D84B10E684106
D76B15E976159
D68B20E12682012
D55B30E15553015
D45B40E15454015
Table 2. Physicochemical characteristics of HSD, biodiesels, and bioethanol.
5PropertiesTest StandardMeasurement UncertaintyDieselPBDCBDSBDMBDCaBDEthanol
1Density at 15 °С (kg/m3)ASTM
D4052
±0.1 kg/m3836859856866862872776
2Viscosity at 40 °С (mm2/s)ASTM
D7042
±0.30%3.704.52.794.455.925.251.14
3Calorific value (MJ/kg)ASTM
4809
±0.1%44.5440.9039.1039.8840.7139.9128.85
4Flash point (°С)ASTM
D93
±0.1 °С7818316715915017312.2
5Pour point (°С)ASTM
D97
±0.1 °С816−3.5−4−179−114
6Cloud point (°С)ASTM
D2500
±0.1 °С91223510-
7Oxygen stability (h)ASTM
D7462
±0.01 h59.13.928.14315.923.181.5
8Cetane indexASTM
D4737
486163.52517656.38
9Iodine value (g I/100 g)ASTM
D1959
-6115.76129.810282.1-
Table 3. Composition of different biodiesels.
Common NameStructurePBDCBDSBDMBDCaBD
Methyl CaproateC6:0 0.30.1
Methyl CaprylateC8:0 6.50.1
Methyl CaprateC10:0 60.1
Methyl LaurateC12:00.1442.10.1
Methyl MyristateC14:01.0517.40.1 0.1
Methyl PalmitateC16:038.8411.310.51.914.9
Methyl PalmitoleateC16:10.220.20.10.20.2
Methyl StearateC18:04.083.84.31.217.2
Methyl OleateC18:142.219.22512.738.2
Methyl LinoleateC18:212.81351.512.327.6
Methyl LinolenateC18:30.25<0.16.87.20.3
Methyl ArachidateC20:00.40.20.410.9
Methyl EicosenoateC20:1 <0.10.26.40.2
Methyl EicosadienoateC20:2 0.4
Methyl EicosatrienoateC20:3 0.1
Methyl BehenateC22:0 <0.10.40.90.3
Methyl ErucateC22:1 <0.10.153.7
Methyl DocosadienoateC22:2 0.8
Methyl LignocerateC24:0 <0.10.2 0.1
Methyl NervonateC24:1 1.3
Table 4. Constant values of regression parameters, SD, and R2 used in the proposed models.
EquationabcdeXSDR2
Equation (2)0.65540.93970.1180--682.8250.45350.9823
Equation (4)0.05210.04480.20600.13-0.74230.07380.9202
Equation (5)0.01710.01900.0469--0.67610.05890.9468
Equation (6)0.2460.06100.00060.326821.8024143.49530.1430.7207
Table 5. Values of regression parameters, constants, and R2 for biodiesels, HSD, and bioethanol.
DensityfYR2DensityfYR2
ρ D 100 0.697863.100.9999 ρ M B D 100 0.708890.130.9999
ρ P B D 100 0.729888.400.9999 ρ C a B D 100 0.720899.900.9999
ρ C B D 100 0.778888.120.9999 ρ E t O H 99.9 % 0.897812.100.9999
ρ S B D 100 0.731897.730.9999
Table 6. Values of regression parameters, constants, and R2 for biodiesels, HSD, and bioethanol.
ViscosityfYR2ViscosityfYR2
ln η D 100 0.0182.0920.9829 ln η M B D 100 0.0192.5740.9846
ln η P B D 100 0.0182.2800.9850 ln η C a B D 100 0.0192.4230.9843
ln η C B D 100 0.0171.7120.9863 ln η E t O H 99.9 % 0.0180.8090.9882
ln η S B D 100 0.0172.1740.9857

