Article

Factors Determining the Development of Small Farms in Central and Eastern Poland

1
Department of Economics and Organization of Enterprises, Institute of Economics and Finance, Warsaw University of Life Science-SGGW, Nowoursynowska 166, 02-787 Warsaw, Poland
2
Department of Economics, Faculty of Economics and Management, Czech University of Life Sciences Prague, Kamycka 129, 16500 Prague, Czech Republic
3
Department of Agrotechnology, Agricultural Production Management and Agribusiness, Faculty of Environmental Management and Agriculture, University of Warmia and Mazury in Olsztyn, Oczapowskiego 2, 10-719 Olsztyn, Poland
*
Author to whom correspondence should be addressed.
Sustainability 2020, 12(12), 5095; https://doi.org/10.3390/su12125095
Submission received: 11 May 2020 / Revised: 19 June 2020 / Accepted: 21 June 2020 / Published: 23 June 2020
(This article belongs to the Collection Sustainable Development of Rural Areas and Agriculture)

Abstract

:
The agrarian structure in Poland is dominated by small farms; the large share of these is a result of historical consequences. The economy has pushed small farms toward economic efficiency, which in farming often translates into increasing the scale of production. The primary objective of this research was to present the directions of the changes in the number of small farms in Central and Eastern Poland and to indicate the factors determining their functioning and development. The research was based on a random sample selection from rural municipalities, villages and small farms. The researchers collected 19 completed surveys from municipal agricultural officers, 75 surveys from village mayors and 116 surveys from small and active farms. The data from the farm surveys was analysed using k-mean cluster analyses and the Principal Component Analysis (PCA) to distinguish farms into homogenous groups. Three types of farms were identified: “hobby”, “two-occupation” and “professional” farms. The research shows that in the municipalities of Central and Eastern Poland, the number of landowners (over 1 ha of arable land) paying agricultural tax increased by 9% between 2005 and 2017. A significant gap was identified between the number of “official farmers” and “active” farmers. In the farm category surveyed, “active” farmers numbered only 33% of all farming entities. The surveys confirmed that the development of small farms is particularly influenced by external factors (EU funding; national benefits), rather than internal (entrepreneurial) factors. An in-depth survey of farmers, municipal agricultural officers and village mayors shows that “professional” farmers (Cluster 0) are expected to invest, develop and innovate. Farmers managing “hobby” and “two-occupation” farms have a reserved attitude towards investment and their objective is to maximise the benefits related to the arming status. In the authors’ opinions, “professional” farms have the highest probability of being economically viable, while others tend to focus on the provision of public goods related to financial support.

1. Introduction

Due to the biological and mass nature of the products produced by farmers, when they want to increase labour productivity, which is the basic indicator in a free market economy, they usually increase the scale of production [1,2]. This is attained by increasing the farmers’ land resources (owned or leased), using more efficient machinery and equipment, and changing production technologies [3,4,5]. Expanding farms in terms of production and/or utilised land becomes natural [6,7].
In 2017, there were over 1,358,000 farms in Poland operating on more than 16 million ha of agricultural land. The agrarian structure was dominated by small farms, the high share of which were the result of historical conditions. The current state originated from: (1) 123 years of partitions (no Polish state) and various organisational and legal systems implemented among the partitioners (1795–1918); (2) introduced after World War II (1945–1989), the socialist “order” initiated by the land reform in the 1950s introduced numerous sanctions against family farms and motivated the creation of “State Farms”, but the collectivisation was interrupted by local political changes and peasant farming remained present in Poland; (3) the 1990s with the profound economic reform from a socialist to a market system (1990–2004); (4) Poland’s accession to the European Community in 2004 with mixed results (some good and some less desirable) [8,9,10,11]. Between 2005 and 2017, the number of farms decreased in Poland. This is in line with the trend observed in all developed European countries [12,13]. The changes taking place in Polish agriculture were generational and were related to the pace of economic development of the country and the possibilities of financing structural transformations with public funds [14,15]. The agrarian structure underwent slight transformations, which went in two directions: (1) reducing the absolute number of farms and (2) size polarisation of utilised agricultural areas in terms of hectares [16]. Despite the agrarian changes and support for agriculture with public funds under the Common Agricultural Policy of the EU (CAP), Polish agriculture is invariably characterised by: (1) a relatively high level of employment; (2) low labour and land productivity; (3) a fragmented agrarian structure compared to most EU countries and relatively low income from agricultural activities [17]. In 2017, the number of farms in Poland from 1 to 15 ha of Utilised Agriculture Area (UAA) was over 1,184,000, which constituted 84.5% of all farms in the country, owning 42% of UAA [18]. Compared to 2005, their number decreased by 29%, while the average acreage increased by only 4%. The selected arguments show the validity of the research topic, as small farms are the blood in Polish agricultural veins. The main goal of the research is to present the directions of the development in the number of small farms in Central and Eastern Poland, to indicate the factors determining their functioning and their future path of development.
The paper is organised as follows: Section 2 identifies the problem of small farm definition. Section 3 aims to define the research methodology. Section 4 includes the results and discussion divided into two subsections. Section 4.1. identifies, based on processed k-mean cluster analyses, three different groups of small farms that actively conduct agricultural production in selected regions. Section 4.2 discusses the results obtained from the survey in rural municipalities, villages and farming entities. The results are concluded in Section 5.

2. Diverse Conclusions from Research on the Economic, Environmental and Social Assessment of Small Farms—A Literature Review

As part of the EU Common Agricultural Policy (CAP), interest in small farms is growing due to their significant share in the structure and the functions attributed to them [19]. Unfortunately, the conclusions drawn from the assessment of small farms are diverse [20,21,22] and this is due to the different definitions of these entities and the different perspectives of assessment (economic, environmental or social). Many authors emphasise that there is no single definition of a small farm [23,24,25,26]. In literature, many of the criteria used to identify small farms can be distinguished. Those most commonly used include the level of equipping farms with land resources (UAA). The economic size criterion defined by the European Union Farm Accountancy Data Network (hereafter as FADN) uses Standard Output (SO) as a measure of farm size. Standard output defines the average monetary value of the agricultural output at the farm-gate price per hectare or head of livestock. The SO value can then classify a farm into the size category. ‘Very small’ and ‘Small’ farms do not have an output higher than 8000 and 25,000 EUR, respectively. In Polish literature, the definition of small farms differs at the same time. The authors use the economic size, the utilised agricultural area (UAA) or a combination of both [27,28]. Sroka et al. state that taking into account the specificity of small farms in Poland, (with a two-occupation character), the upper limit separating a small farm should not exceed 8000 EUR of SO [29]. Zegar (2012) has a slightly different opinion and states that the upper area boundary defining a small farm differs for individual countries, regions and cities, and also changes over time. While in one country (e.g., Poland or Romania) 2 or 5 ha is classed as a small farm, for other countries (e.g., France, Great Britain) it can be 20 ha or even more [19]. A similar approach is also presented by Wilkin (2013), who notes that about 25 years ago in Poland, a farm with 5–7 ha was considered to be medium size. The upper limit of the farm size changes and increases over time. In the future, much larger farms will be considered small (15–20 ha), as is the case in some Western European countries [30]. An important argument indicating the need for adjustments in the Polish definitions of a small farm is that all Polish farms operate on the EU single market, characterised by the free flow of goods and similar legal regulations. This situation leads to the fact that Polish farms (including small ones) are characterised from the EU perspective. The authors of this article propose a slightly different definition of a small farm, considering the transnational dimension in a broader scope. This is discussed more in-depth in the methodology section (Section 3).
The discussion in literature does not conclude what is the role and what are the development directions of small farms in Poland. Michalska (2012) emphasises six basic non-productive functions of small farms in the development of agriculture and rural areas: (1) they are a buffer that protects the rural population from poverty; (2) they are the basis for the diversification and multifunctionality of farms; (3) they provide environmental benefits; (4) they have a positive impact on shaping the rural landscape; (5) they contribute to the transmission of intangible historical values; (6) they provide care for the youngest and oldest family members [31]. These are similar functions that are attributed to all small farms in the world [32,33]. Research conducted by Alexandri and Luca (2012) on the role of small farms in Romania showed that small farms tend to act as a protective umbrella, particularly for a poor rural population whose survival depends on the exploitation of a small plot under ownership right [34]. In turn, Wojewodzic (2017) points out that the mass nature of the occurrence of small farms in Poland significantly contributes to the development of the local labour market and the creation of demand, and the social functions performed by small farms largely result from the function of the traditional family model [27]. Sociologist Bukraba-Rylska [35] emphasises that small farms guarantee strong interpersonal relations and the cultural heritage (also found by [36]) of the Polish countryside must be recognised as an important capital of rural environments that enables economic development and through the diversification of activities, a reduction in unemployment [37].
When assessing small farms from the perspective of the environmental impact, it is noticeable that they contribute to the preservation of biodiversity [38] in the environment by maintaining waterholes, mid-field tree stands and a dense network of baulks. In general, small farms contribute to rural sustainability [21]. Production in small farms is generally carried out through the use of capital and energy-saving technologies, which reduces agricultural pressure on the environment. The presented positive functions of small farms are the most frequently presented arguments aimed at justifying the economic support of agriculture. Assessing the functioning of small farms in Poland, Wilkin notes that they are mostly of low productivity, have little interest in development and often waste agricultural resources [30]. Similarly, Halamska claims that these are farms that have little or no production for the market, which is not their primary source of income or a significant source of their supplementation [39]. Others indicate poor land use, a decrease in production intensity and the intensity of organisation in small farms [28,40]. The analyses conducted by Krasowicz et al. shows that in small farms there is a weakening of soil production potential, as a result of (1) unfavourable changes in the structure of agricultural production; (2) unfavourable crop structure; (3) minimal use of catch crops; (4) minimal mineral and organic fertilisation; (5) loss of soil liming [41]. Doubts about including the smallest farms in the agriculture sector are also expressed by Wąs, who states that while the smallest farms meet the formal criteria entitling their owners to obtain the farmer’s statute, their share in agricultural production is becoming more and more marginal [42]. The lack of clear conclusions from the literature review indicates the need for further research in this area.

3. Research Methodology and Data Sources

The primary goal of this contribution is to show the direction of small farm development in Central and Eastern Poland and to indicate the factors determining functioning and development. The authors’ first aim is to identify small farms, divide them into homogenous groups and then identify the directions of the changes revealed on the bases of surveys and data collection. As a reference period for development, 2005 was chosen, which was the first full year after EU accession.
To identify small farms in Central and Eastern Poland, the authors adopted two criteria, which had to be simultaneously fulfilled: (1) UAA from 1 to 15 ha and (2) economic size measured by a Farm Accountancy Data Network standard output of below 25,000 EUR. According to the standard results of the Polish FADN survey, characterising farms participating in the Polish FADN in 2017, farms between 8000 and 25,000 EUR SO had an average area of 15.4 ha of UAA [43]. According to statistical data presented by the Central Statistical Office for 2016, 95.5% of farms up to 15 ha of UAA had an economic size of less than 25,000 EUR [44]. Empirical research was conducted in Central and Eastern Poland—the regions of “Mazowsze and Podlasie” (voivodeships: Podlasie, Mazovia, Lubelskie and Łódź) as defined by the EU FADN system (region no. 795). The selection of the study area was motivated by the presence of a significant share of farms below 15 ha of UAA and similar natural conditions. According to the 2016 data from Statistics Poland, 598,124 farms existed in this region, which constituted over 42% of all Polish farms. According to Eurostat, farms with SO below 25,000 EUR represented 85% of all farms in Poland (83% in the region) and utilised 44% of UAA in Poland (50% in the region) [45]. The results are relevant for the selected and analysed region (three voivodeships in totals as Lodz voivodeship was not included—see text below). Due to the different climatic (mountains vs. lowland), economic (centre vs. periphery), historical (east vs. west; smaller vs. larger farms) and natural conditions, the results cannot be applied to the whole of Poland.
Surveys and direct interviews were used for data collection, and the answers were collected in the second half of 2018 and early 2019. The stratified sampling was conducted by random drawing. The research was divided into three different stages based on the top-down approach. All the selected entities were questioned and if incomplete information was provided (data in the structured surveys or interview missing) the questioned entity was excluded from further analyses. The stages of the survey process are as follows (see Table 1 for further information):
(1) The FADN region includes four voivodeships and nine random rural municipalities (gmina in Polish) were drawn from each. Officers in charge of farming were questioned in the selected municipalities. The survey questionnaire consisted of two parts: the first contained general information on the number of farms in the rural municipality at two time points (2005 and 2017) and opinions on the future development related to agricultural and non-agricultural activities. Most of the questions were closed. Out of 36 municipalities, 19 provided full answers. The Lodz voivodeship was excluded, as all the rural municipalities from the Lodz voivodeship did not provide complete data.
(2) From each qualified municipality (19 selected in the first stage), four random villages (wieś in Polish) were drawn. The questionnaire survey addressed to the village mayors (sołtys in Polish) contained questions about the village characteristics, the population and the farms engaged in agricultural activity in 2005 and 2017, and opinions on the future of farms in a given village. One mayor did not provide the data requested so the village was excluded from the third stage.
(3) Two farms with less than 15 hectares were drawn from each of the 75 qualified villages. Farm economic size was not known prior to random selection but confirmed at the farm. As a result, 150 farms were selected. The selection was influenced by local mayors who indicated which farms are active and only those farms were included for drawing. Out of 150 farms, 30 farms had SO higher than 25,000 EUR and 4 farms had quit active farming recently. In total, 116 farming entities (conducting crop or livestock production, paying agricultural tax) were entered in the research group. The survey addressed to the farmers contained questions regarding characterising and obtaining the most important economic and organisational information (see Table 2 for specification of collected variables) from the perspective of changes between 2005 and 2017. The opinions of farmers regarding the conditions for the development of farms and the opportunities and barriers to increasing farming efficiency were also sought.
The data obtained was combined with data from various public resources such as the Regional Statistical Database, the Polish Paying Agency—ARiMR (the number and structure of beneficiaries of direct payments), the Agricultural Social Insurance Fund (KRUS, number of insured and household members) and the Central Business Register (CEIDG, number of entities conducting business activity).
The data obtained from the small farms surveyed in Central and Eastern Poland confirmed common opinions about the diversity of these entities in terms of their property resources, production implemented and development directions. This prompted the authors to group the surveyed small farms into separate groups to identify factors determining their functioning and development. One of the multidimensional exploratory techniques was used for grouping—cluster analysis proposed by Tryon [46] and further developed by Cattell [47]. Cluster analysis is a set of multidimensional statistical analysis methods used to extract homogeneous subsets of objects of the studied population; the k-means clustering method is specifically used.
The main principle of the method is to divide the set of objects, which minimises the diversity between the objects in the same group while maximising the variance between the different groups. In this case, the typological procedure consists of finding k clusters (clusters), which then include individual objects with the smallest distances from the centre. A known characteristic of the k-means algorithm is that it is necessary to define the number of groups at the outset, although it is usually not known how many groups exist in the processed set [48,49].
The number of clusters can be conventionally determined based on the characteristics of the knowledge of the surveyed population or can be assisted by methods of identifying the optimal number of clusters. The elbow method was used, the results of which are shown in Figure 1. As it is difficult to choose the perfect bend using the elbow method (Figure 1) in the conducted survey, the selection of the appropriate number of clusters was based on expert knowledge and the knowledge of the examined population. The data was divided into three clusters.
To reduce the number of variables describing the phenomena in small farms and to determine the relationship between them, the Principal Component Analysis (PCA) was additionally used. This consists of determining the components that are a linear combination of the studied variables. An accurate analysis of the principal components allows indicating those initial variables that have a major impact on the appearance of individual principal components, i.e., those that form a homogeneous group [50,51]
The first component was influenced by factors such as total production, own work resources (FWU), direct payments and social income. The second component was influenced by factors such as total production, direct payments, possession of a successor, agricultural income and income from work outside the farm.
K-mean and PCA analyses were conducted in a specific programming environment based on the Python language using various data science libraries (SciPy, Numpy, Panel Data, Scikit-Learn).

4. Research Results and Discussion

4.1. Farm Sample and Groups Characterisations

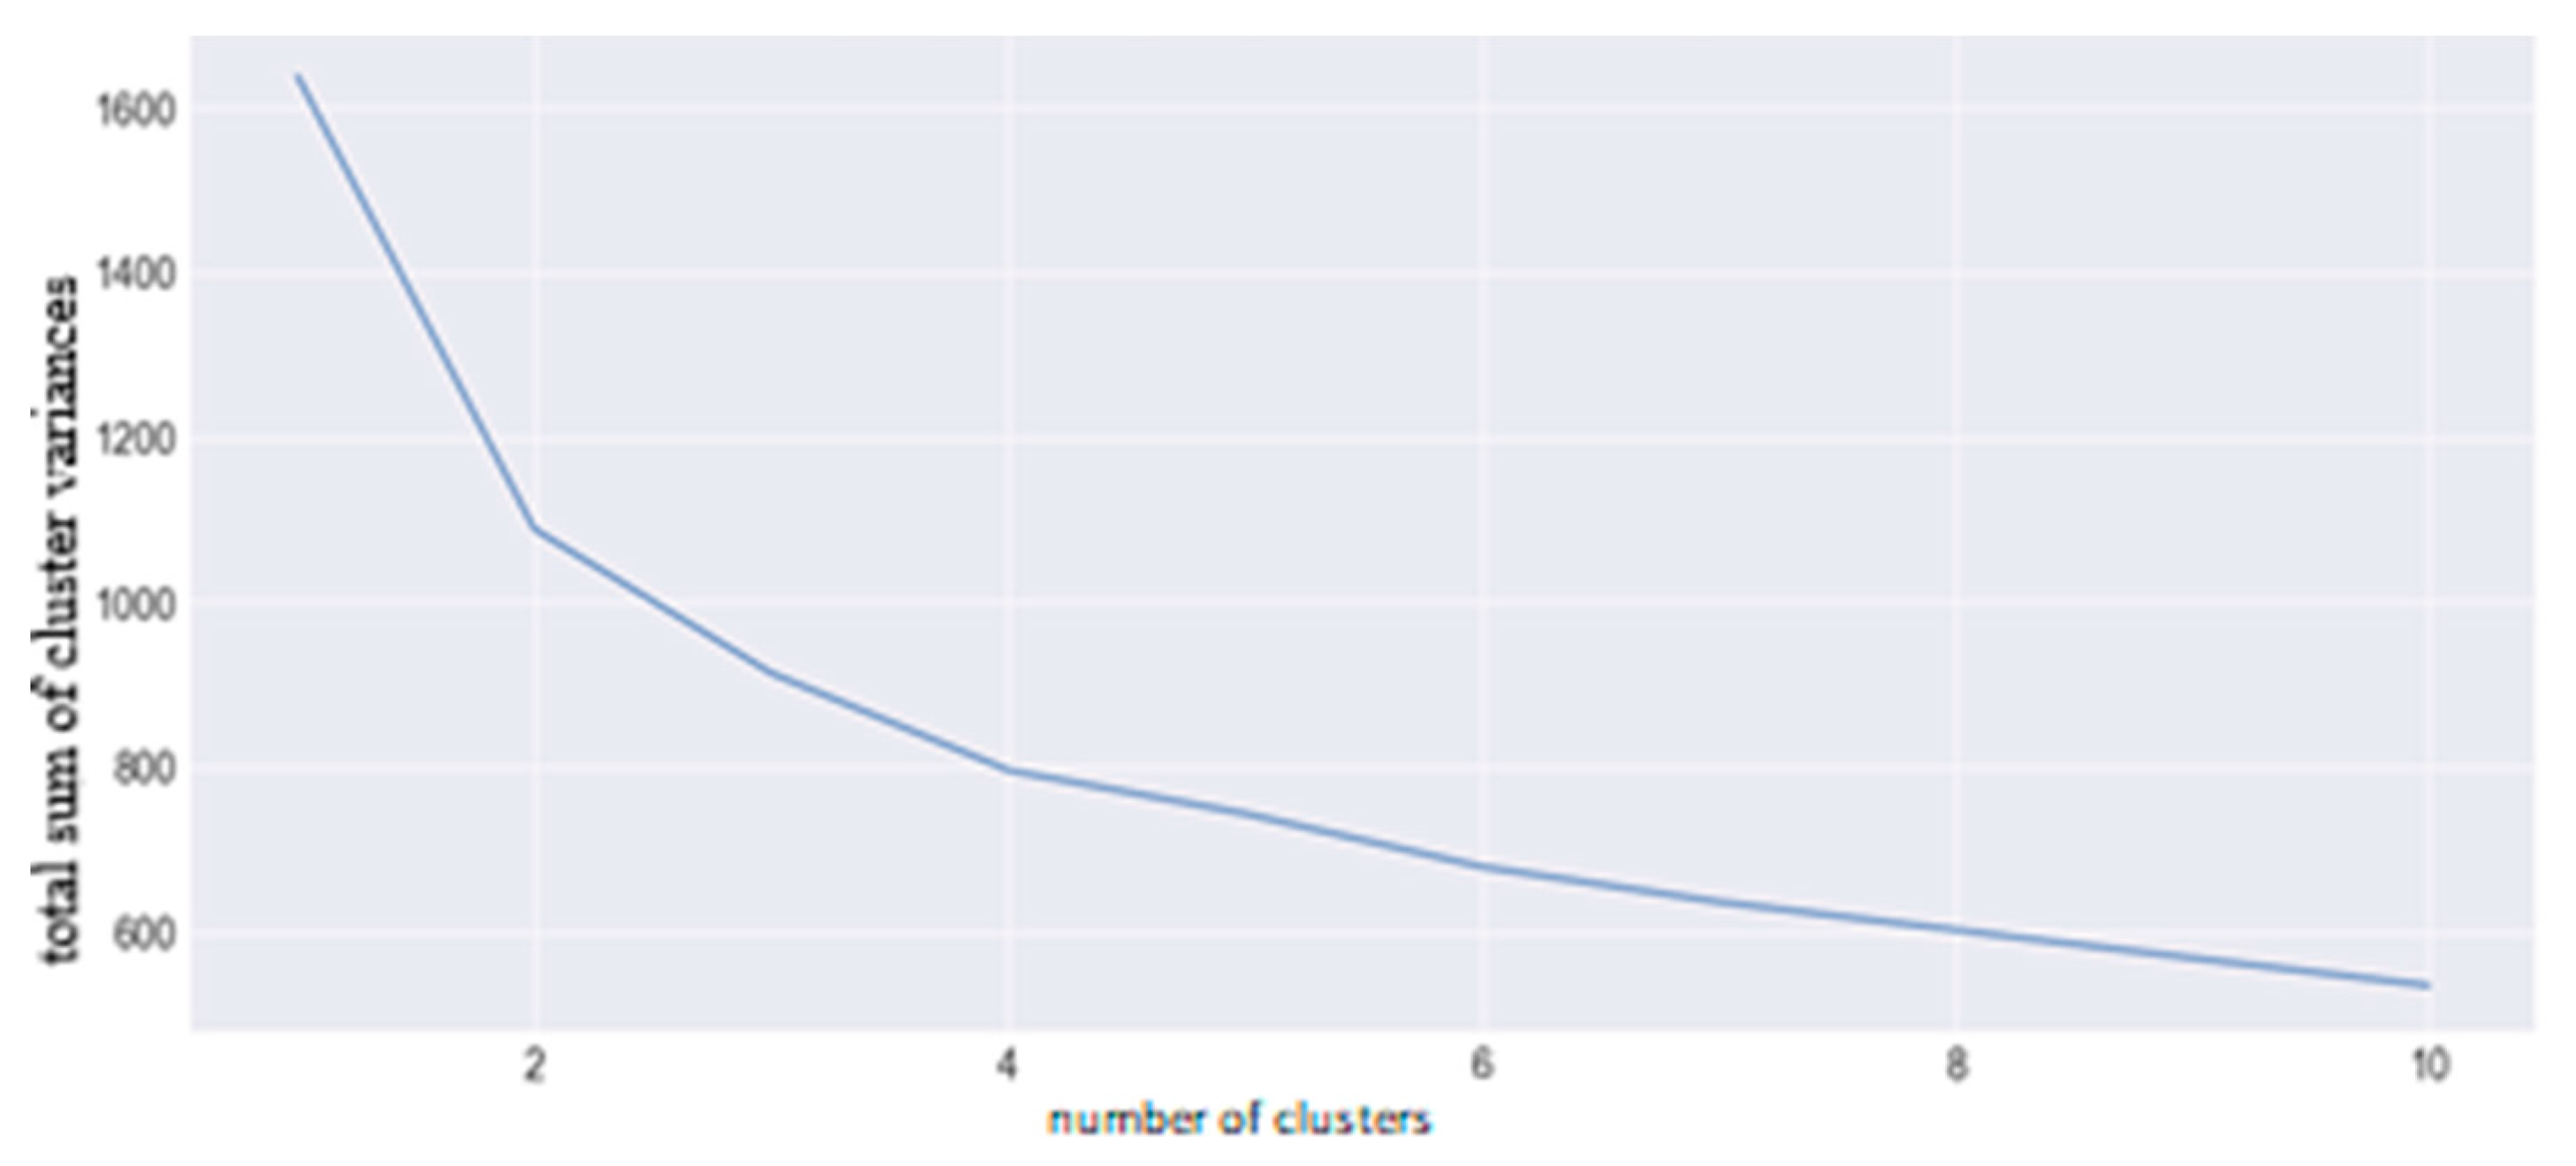
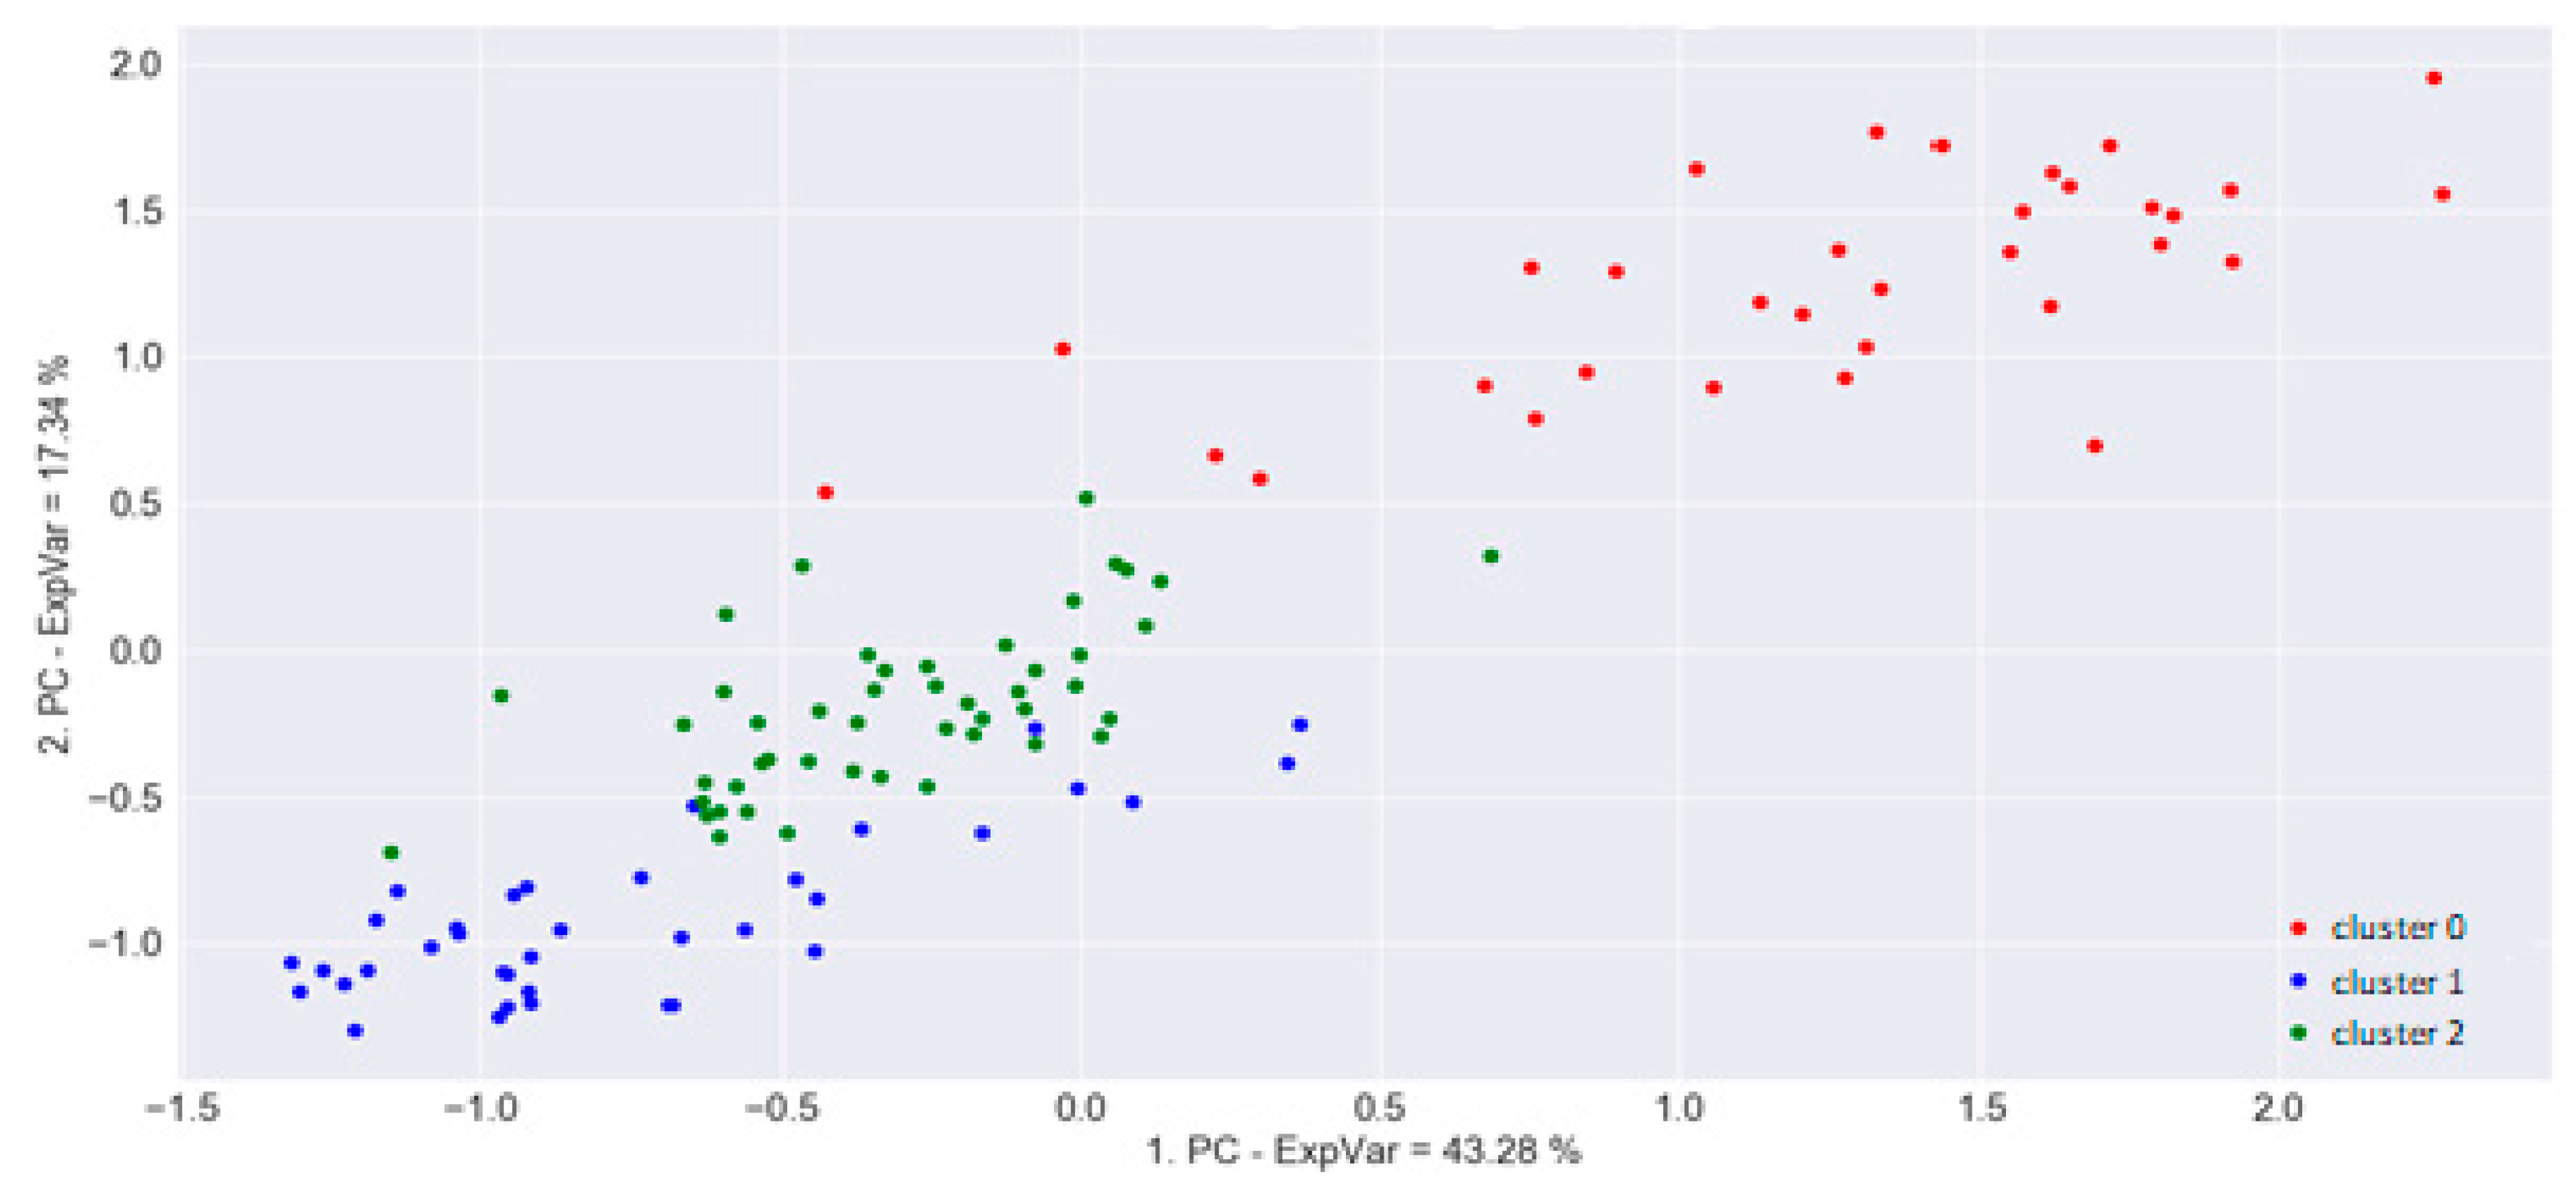
The collected research material obtained from the questioned small farms showed that the examined objects do not form a homogeneous population, hence different conditions will determine their condition and development directions. To examine the potential directions of changes in small farms in central and eastern Poland, it was necessary to divide the studied population into uniform groups of units with similar characteristics, and then to consider their directions of development. To assign the examined objects to similar groups, the k-means method was used while employing the principal component analysis (PCA). The clusters were identified (Figure 2) based on the PCA.
The cluster analysis made it possible to group the studied population of small farms into three clusters in which objects present similar features. The first cluster (Cluster 0) represents “professional” farmers, the second cluster (Custer 1) represents “hobby” farmers and the third cluster (Cluster 2) represents “two-occupation” farms. Details of the farm groups are provided below. Additional information about the nominal values of the variables related to each cluster is presented in Table 3.
The CLUSTER 0 contains 33 farms (29% of the sample) whose main source of income was agricultural activity (on average over 81% of total income) and engaged the largest labour resources for farm work. The average value of agricultural production exceeded 23,000 EUR and included farms producing milk and fruit with higher value added. Small farms included in this cluster can be called “professional” farms, where the main source of income comes from agricultural activity. The farmers are dependent on farming income, as farming is their only commercial activity. The share of direct payments in agricultural income is 28%. These farms utilise the largest amount of land with the highest value (better quality soils; 13,000 EUR/ha), have the highest fixed assets and their total income (i.e., agricultural income, income from work outside the farm and social income) was the highest, exceeding 20,000 EUR. Although these farmers are not the oldest, all farmers have successors. The average age is slightly above 50, which means that the farmers cannot be considered as being young farmers (up to 40 according to EU support), although they are still far away from retirement age. However, they already need to think about their successors. Household social income is the highest for cluster 0 farmers, including pensions and child support (programme Family 500+). The high value of fixed assets refers to ongoing investments and the willingness to develop. These farms are typical examples of farming entities that are willing to increase their agricultural production, plan to acquire new land (lease or buy) and consider potential innovation in their production. They use EU rural development funds to replace outdated machinery and invest in the reconstruction of buildings. They are typical examples of Cochrane sustainable farmers [52], who innovate to improve their incomes while others find themselves in a price squeeze and are forced to leave the farming business [53]. Government policy should target these farms because they are significant contributors to national agricultural production.
CLUSTER 1 contains 35 farms (30% of the sample). They have the lowest value of agricultural production (average 7000 EUR) and are entities whose main source of income is work outside the farm. Income from agricultural activity is only an additional income (21% of total income) and in a situation without receiving benefits or/and subsidies, no farming would be conducted. These entities conducted low labour-intensive production and can be referred to, due to their characteristics, as “hobby” farms. Farmers live on the farm. They are inhabitants of the village, own farms and land and work on them. The main source of their income is work outside the farm. They conducted agricultural activities that did not require a large involvement of labour, land (lowest value of land; 7500 EUR/ha) and a significantly low amount of fixed capital. “hobby” farms sparsely invest into fixed assets and their main income is generated outside the farm. Their total income was found to be 15,852 EUR. Agricultural activity on “hobby” farms is optimised by farmers in such a way to obtain the highest possible income from this activity (production and direct payments) with the minimum amount of work involved. This means the farms mainly focus on crop (corn) production. The share of direct payments in agricultural income was almost 60%. However, it must be stated that these farms usually have the youngest owners, with ownership mostly transposed within the Rural Development Program (RDP) measure aimed at young farmers below 40 years of age. Due to low agricultural education and stable income from non-farm activities, low capital resources, and sometimes outdated assets, these farms are expected to remain as hobby farms. Their farming activities will follow an income optimisation strategy, where farming activities will copy the most beneficial way of farming with respect to receiving benefits. It is questionable whether these farms will remain in operation after handover to the next generation. Calus et al. proved that lower total farm assets often result in farm discontinuation [54] and that farms with high value-added production increase the probability of intra-family transfer [55]. Based on the above-mentioned characteristics and the treadmill theory, it can be assumed that their share of agricultural income will further decline, and the farmers will cease their farming activities.
CLUSTER 2 consists of 48 farms (41% of the sample). These are “two-occupation” farms, where the farmers attain a more balanced proportion of agricultural income (34%) and income from work outside the farm (53%). The remainder of their income comes from social payments. The group of “professional” farms was dominated by mixed farms in which both plant and animal production were carried out. The average value of the total production of these farms was over 11,000 EUR. The age structure is comparable to Cluster 0, which means that the farmers are in their early 50s, they have proper agricultural education, reasonable land resources (the size is comparable with “professional” farms, while only the quality expressed by price differs by 8900 EUR/ha of land bookkeeping value) and a reasonable amount of fixed capital. Only a small portion of Cluster 2 farmers are willing to invest in their farms and further develop farming activities. However, family members are not involved in farming activities as much as they work outside of the farm. Agricultural income (almost 6000 EUR) is not sufficient to cover the personal needs of the farmers and their families so, therefore, they need to work outside the farm. Due to the demanding labour requirements, the farmers usually work only part-time. Concerning the farmers’ age, they will soon have to address the issue of succession. As mentioned in Table 3, succession is not a problem, as only a small proportion of farmers (about 10%) do not have any successors. However, as mentioned above, the land market is rather conservative and people not partaking in farming activities keep the land as an investment or a value keeping asset. Price increases in the last 15 years (see Bórawski et al. [56]) are strengthening their intentions to keep the land and speculate on further price increases. Although this behaviour tended to be confirmed by the older farmers, for younger farmers (“hobby” farms), the attachment to land and the farming tradition was less important. The question remains of how young farmers may view the perspective change as they get older.
For the available factors (see Table 3), the relationship between total agricultural production (variable 0) and other considered variables were identified by using linear regression. It can be stated that the main determinants conditioning the functioning of small farms are external factors. Among the total costs, the production of “professional” farms is mostly affected by the amount of land and direct payments. This confirms the generally accepted theory that agricultural activity is influenced by farm resources, in particular, land resources. From the remaining groups, the internal factors do not show any statistical significance. The production of “hobby” farms is affected by income obtained from farming activity. Among the “two-occupation” farms, the relationship with total costs is significant. The future of small farms in Central and Eastern Poland will depend mostly on external factors, such as the amount and type of direct payments, other financial support measures and other benefits obtained from being a farmer (insurance, social payments, etc.). In the coming years, a probable scenario for small farms in Central and Eastern Poland is the continuation of extensive agricultural activity, without explicit investments, and combining work on a farm with work outside it. Only a limited number of farms will develop and further invest in innovations. From a long-term perspective, further development (utilised land increase, assets renewal, income raise) of “professional” farms is expected.

4.2. Directions and Determinants of Small Farms Development

The starting point in the search for the determinants of the functioning and development of small farms in Poland was to determine their number after EU accession (2005) and in 2017. However, there are different values related to the number of farmers observed. Farmers could be considered all those who (1) pay agricultural tax (for UAA higher than 1 ha); (2) receive direct payments; (3) are registered in the Agricultural Social Insurance Fund (KRUS); (4) conduct commercial agricultural activity. It was necessary to collect this data from various sources (Polish Central Statistical Office; statistics collected at the level of the surveyed rural municipalities; data from the tax information system as agricultural landowners of more than 1 ha are obliged to pay agricultural tax).
In the examined municipalities of Central and Eastern Poland, in the structure of farms distinguished according to the criterion used for calculating agricultural tax, farms with 1 to 5 ha of UAA dominated and constituted 56.6% of all farms (Table 4). Altogether, there were 88.3% of farms with below 15 ha of UAA in the surveyed municipalities. Between 2005 and 2017, the number of farms paying agricultural tax in the analysed municipalities increased by 9% (from 25,268 to 27,541). The employees of the municipalities stated the main reason for the increase—the funds available from the Rural Development Program supporting Young Farmers and Early Retirement measures. Anybody who owns a minimum of 1 ha and pays agricultural tax was eligible for handover support of 50,000 PLN (approximately 12,000 EUR). This led to an “artificial” division of farms to their children to obtain the available funds. Such practices were observed mostly between 2005 and 2010, when 1 ha was the minimum amount of UAA required [57]. At first sight, the implemented policy has a relatively positive outcome as Poland is considered to be a country with a relatively high proportion of young farmers that outnumber the proportion of older farmers [58]. Unfortunately, European statistics do not distinguish “de jure” and “de facto” farmers.
The data presented in Table 4 also shows that the number of farms applying for direct payments was much lower than those of agricultural taxpayers (agricultural tax is paid for land used for agricultural purposes). Direct payment beneficiaries were 69% (2005) and 59% (2017) of agricultural taxpayers. Moreover, the data in Table 5 further shows the differences between individual data sources. Agricultural taxpayers are the most numerous while direct payment and KRUS beneficiaries lag behind. As proven below, the number of active farming entities is far lower than suggested by the official Polish farm statistics.
In-depth surveys at the level of selected villages with mayors (Table 5) confirmed that out of all agricultural taxpayers (all size categories), in 2017, only 39% actually (physically) carried out an agricultural activity (being “active farmers”), while the remaining were only paying agricultural tax but not conducting real agricultural production. The difference is because a significant number of agricultural taxpayers (landowners) use the benefits of having “farmer” status. These farmers can be called “administrative farmers”, as they pay agricultural tax. They do not carry out any agricultural activity. In some specific cases, they even collect subsidies in the form of direct payments while the land is unofficially leased to a farmer who conducts farming activity. The reasons for unofficial leasing is rooted in the individuals’ attitudes to CAP direct payments. Disposing of land means giving up this subsidy [59]. Owning land means maintaining the farmer’s status [60] for reasons of insurance and tax benefits provided to farmers by the Polish state under the so-called KRUS system. These “farms” are not included in the cluster analyses, as their owners were excluded from the research. Only 33% of taxpayers carried out an agricultural activity in the size group of between 1 and 15 ha of UAA classified as “active farmers”. In the size category of between 1 and 5 ha of UAA, only 17% of entities carried out agricultural activity while others could be considered only as “administrative farmers”. In the villages surveyed, 98% of agricultural taxpayers conducted agricultural activity on farms over 15 ha of UAA.
As the survey of village mayors shows, between 2005 and 2017, the number of active farms decreased by an average of 8%, while their average acreage increased by approximately 11%. In 2017, there were between 3 and 12 active farms in the surveyed villages (depending on the size and location of the village), which developed agricultural production, invested in technical equipment (tractors and machines), and in some cases, in the construction of new or the renovation of existing livestock buildings. The owners of these farms were interested in buying agricultural land and actively obtained EU funds for farm development. From the results obtained by cluster analyses, it can be stated that these farms belong to the “professional” or “two-occupation” entities. The remaining farmers did not show any economic activity related to farm development but showed an optimal adjustment of the profile to maximise the benefits obtained from the farm (“hobby” farms and part of the “two-occupation” farmers). They do not aim to develop farming but want to increase their income. In the near future, according to the opinions of the village mayors, a farm model will be based on work outside a farm with leased or extensively used land. In such a situation, low labour-intensive plant production will dominate. The mayors pointed out a particular trend that they observe in their villages—strong agricultural farms further develop agricultural production (cluster 0), while the remaining ones look for alternative sources of income outside the farm (clusters 1 and 2). The survey results from the villages show the actual direction of change. Similar to the results found by Zawisza et al. [61], in the sample, there was a small group of farmers who developed farms, invested in machines, tractors and increased UAA, mainly through leasing. The interviews were also expanded to identify the factors determining the development and the factors contributing to the liquidation of small farms. They were divided into two basic groups (Table 6): (1) internal factors resulting from their own farm resources; (2) external factors that are a consequence of the situation in the macroeconomic environment. The most frequently mentioned internal problem was inadequate payment for obtained agricultural products in relation to the work involved (80% of respondents). The second barrier indicated, partly connected to the first, was “Old and used fixed assets” (61% of responding farms). Technical progress in agriculture makes it possible to reduce working time and increase comfort, while its implementation requires the involvement of capital, which most small farm owners cannot afford. Among the external barriers, the respondents indicated “low profitability of agricultural production” related to the obtained price (85% of respondents), “high prices for agricultural inputs” (67% of respondents) and problems related to “product sales” (55% of respondents). The surveyed farmers indicated the “low profitability of agricultural production” as the most important external barrier, but according to other authors’ results [62,63], the economic performance of the farms also depends to a large extent on the quality of management, the quality of the machinery and correct agricultural practices. The barriers to development indicated above are mostly caused by the following factors: (1) farms are small and do not have significant negotiating power; (2) price is influenced by external factors [64]; (3) lack of cooperation among farmers. Some barriers could be mitigated by introducing economies of scale [65] through joint input purchases or by the cooperation of farmers for marketing activities. This could lead to higher farm-gate prices and lower input prices. However, this form of cooperation is not particularly popular among small farmers in Poland [66], mainly due to the lack of social capital [67], the provision of which was partially ruined during socialism [68]. Additionally, a large portion of the support provided by the EU was misused and did not result in the expected outcomes (creation of new producer organisations) [69].
The research showed that the main impulse encouraging the development of agricultural activity (Table 7) were direct payments and structural funds from the European Union. Attractive insurance conditions for farmers at KRUS (79% of respondents) were the second incentive to run a farm. A significant proportion of farmers or their co-residents work additionally outside the farm and benefit from available privileges (lower social security contributions for farmers than for those working outside agriculture). More than half of the respondents also indicated, quite paradoxically, that an important impulse to continue agricultural activity was “no alternative to another form of earning” (58% of respondents). The lack of job offers on the local market often forces farmers to continue their agricultural activity, even though the farmers assess the work performed to be inadequately remunerated. Freshwater states that the farmers do not have any idea how much their financial situation would change if an out of farm job was accepted. The lack of job opportunities is also related to the improper farming qualification for labour market demands. This situation is considered to be purely the result of the generous policy towards farms [70]. The importance of external support and other agriculture-related benefits further supports how agriculture is used by a large portion of the population for their own advantage by using public resources. On the other hand, EU resources contribute to the further development of farms, which could be positively reflected in their profitability and competitiveness. The pessimistic vision of farmers regarding farm development results from the small scale of production and the inability to support a family (household) solely by crop and livestock production. Only 26% of farmers expressed an optimistic opinion towards further farm development. They emphasised that, to a large extent, the direction in which they would develop their farms would depend on the type of support available under EU funds. The farmers were asked about the factors that determined their agricultural activity between 2005 and 2017 and about the reasons they continued farming (Table 8). Treating land resources as capital investment was the most frequently indicated factor (81% of respondents). The gradual increase in land prices means that the farmers are reluctant to sell this resource without a specific reason, such as buying a flat or dividing property among family members. Between 2005 and 2017, the average price of land for 1 ha of arable land in the studied region (in the farmers’ opinions) increased from around 11,000–12,000 PLN in 2005 to 28,000–32,000 PLN in 2017, while cumulative inflation was 25.3%. These values are still below the observations of Bórawski et al., who observed a seven-to-eightfold increase in prices between 2004 and 2016 [56] in Poland. Czech agricultural land price is also higher than it was in 2004 [71] and a similar trend has been observed in all new EU member states. According to Milczarek–Andrzejewska et al., CAP was one of the reasons for the price increase in the least urbanised regions. The high price implicitly hampered farmland turnover and led to economic conflicts between farmers [72]. The price of land is also fuelled by the growing demand on one hand (demanded by “professional” farmers for farming, but also by non-farmers for residential or commercial purposes), and the owners’ reluctance to sell either part or the whole of their land on the other [60]. An increase in land prices usually does not favour a decision to sell. Land sales are usually undertaken in specific situations (i.e., a large amount of money is needed) [73].
The second most frequently indicated factor conditioning agricultural activity was the possibility of obtaining additional income. Over half the respondents also considered the attachment to land to be an important factor. It should be noted that this factor was mainly indicated by older “40+” farmers. Land ownership presents the sentimental value of an asset, which has been passed down their families from generation to generation [60]. In addition, 38% of the farmers surveyed mentioned that owning a farm is associated with a sense of security in the event of unforeseen situations or global crises. In the event of job loss, the ownership of a farm was identified as the possibility of returning to agricultural production and maintaining their family with own food security. Of interest was a group of 26% of farmers for whom running a farm was their passion and was associated with active rest and relaxation. This is where we expect a connection with “hobby or two-occupation farms” where the farmers are also working outside the farm and farm work can be balanced with other (i.e., mental) activities. Agricultural income of only 33% of the surveyed farms enabled the modernisation of farm buildings (relates to cluster 0), and 20% of the surveyed farms were able to finance purchases of agricultural machinery. The results in Table 9 further support the cluster division. “Hobby” and “two-occupation” farms represent 71% of the surveyed entities, which reflect “low” and “far too low” income.
In the opinions of the rural municipal offices (Table 10), the main impulses affecting the reduction in the number of small farms between 2005 and 2017 was the “lack of profitability of agricultural production”. However, the indicated factor is relative, unclear and, according to the authors’ experience, could be interpreted differently. The profitability of agricultural production is a very subjective variable. It depends on one’s situation and is influenced by the situation of a neighbour or another farmer. However, taking in consideration the cluster analyses results (for the majority, farming is only additional income), the small size of the farms and the negative attitude to cooperation, then, logically, profitability has to lag behind. This is mainly implied for “hobby” farms as they perfectly fit the definition of Bryła, “…there are (too) many that sell nothing or almost nothing. … labour productivity is one of the lowest in the European Union” [74]. Other important impulses are the “lack of development prospects in the countryside”, “financial barrier” and “migration for education”. In the opinions of the mayors (Table 11) “no possibility to buy land”, “price of land” or “high capital needs” further limit farm development. High capital requirements are also one of the main reasons for “farm ageing”, together with the administrative burden, structural changes, low expected rates of return and higher off-farm career opportunities [75,76].
Problems related to limited farm development could lead to the further depopulation of rural areas [77], as observed in the examined villages. Depopulation of rural areas is one of the main problems [78] of the European countryside and despite many actions directed towards the renewal of rural areas [79], the process of depopulation is still ongoing, not only in selected areas but in Poland and other EU countries at large [80,81,82]. Lack of employment prospects in non-agricultural activities in the villages, particularly remote from larger urban centres, is mainly responsible for the depopulation of rural areas leading to a problem with farm sustainability and succession. However, there is evidence that a favourable labour market supports the abandonment of agriculture, although with scarce employment prospects meaning children are forced into farming activities, it does not lead to efficient evolution of agriculture [83].
Impulses encouraging the development of small farms from the municipality officers’ point of view are: (1) the possibility of obtaining European funds directed to rural areas and agriculture and (2) no alternative to non-agricultural activities (Table 12). In the opinions of the mayors (Table 11), from among the EU programmes, “Development of farm processing and direct sales” is viewed as an impulse for further development. However, processing is a labour-intensive activity and requires knowledge, capital and labour resources. In a situation where farmers have jobs outside their farms, it is difficult to imagine introducing an additional time-consuming activity. Therefore, this impulse is rather related to “professional” farms, while for “hobby” and “two-occupation” farms EU support is crucial. Agricultural policy targeted at rural areas has undoubtedly increased household budgets. In addition, under the EU structural funds, farmers could obtain financial support for investments, which can positively affect their economic performance [84,85,86,87]. However, the information concluded from cluster analyses and surveys states that only a limited number of farms invest and develop (even with EU support) and, therefore, the investment benefits again tend to be related to “professional” farms while “hobby” and “two-occupational” farms use funding without the need for co-financing (direct payments, agro-environmental payments, etc.)
Future factors influencing farm development will be both internal and external. However, external factors are more significant according to the surveyed sample of 19 municipality agricultural officers, 75 village mayors and 115 active farmers. The analysed farm groups operate under different aims with different strategies. This also influences their future development directions as expressed in Table 13. Based on the survey, “professional” farms plan to invest, innovate and diversify. These strategies not only generate ”…additional financial income and thereby helps the farm to stay economically viable, but it also spreads and mitigates the risks…” [88]. Increased income from their own operations will be detrimental to public support. From a long term perspective, farm development is expected. Increased income as noted by other authors [54,88] has a positive impact on farm succession. A “professional” farm will have to solve succession problems in 10–15 years (as farmers are close to their 50s). Therefore, the 2021–2027 budgetary framework of the EU will play an important role in development and innovation via investment-oriented funds.
The design and possibilities of the 2021–2027 framework will also influence the group of “two-occupation” farmers. As these are income-oriented, their activities will also be influenced by investment funding as well as the funding related to agricultural activities (for example, direct payments or their successors). As land-based income is significant, the amount of UAA will be kept or further increased. However, the division of time and mental power between two (unrelated) activities means lowered “drive” and innovation potential. “…The production capacity of the farm may have to be reduced, which increases the probability of farm closure…” also “…off-farm employment…might lead to the family’s emotional detachment …decreased willingness of the potential successor(s) to take over the farm” [88]. “Two-occupation” farms will solve the succession problem in 10–15 years, similarly to for “professional” farms, where we view succession probability as being medial. In the long-term perspective, the majority of farms will follow the “hobby” path.
It appears that a “Hobby farm” will be an example of an unsustainable farm (meaning that it lacks a long-term perspective, is financially unviable and is not successful). Investment and innovations are not expected. Land resources are about to be utilised extensively, while economies of scale are not present due to less UAA. However, even in such a situation, in the short and medium terms, farms may be viable because they follow a very rational strategy—attaining the highest income with the lowest possible labour input. This currently means there is unspecialised crop production (cereals). In the long term perspective, we expect these farms to follow the “administrative farm” model where land will be either let out (unofficially) or sold. “Hobby” farmers are the youngest farmers; therefore, succession is not currently an issue for these farmers. However, due to the conditions caused by a probable low offspring attachment to land, low income and asset obsolescence, the farms will run exactly in the direction where succession is least probable. Lower total farm assets often result in farm discontinuation because the total farm value approaches the value of liquidation [54]. However, an interesting issue can be observed in specific Polish conditions of farming and the distribution of political power at the local level in locations where local government followed agricultural interests, in that fewer exits from farming and a slower land consolidation process were observed [89].
Although the future of small farms appears to be clear, we cannot overlook the importance of EU support via the Common Agricultural Policy and the expected reform related to the commitment to become carbon neutral before 2050. Policy focus post 2021 will target environmental issues related to the Paris agreements and the Sustainable Development Goals of the United Nations. Public spending is about to be justified by the provision of public goods [90]. Changes oriented towards decreasing direct payments is expected to have important effects on farmers’ incomes [91]. After the introduction of policy reform, the importance of small farms will not be only evaluated from the “food” production perspective but their position will be viewed in the provision of public goods related to agriculture and the environment. As the income and optimisation strategies are applied, “hobby” and “two-occupation” farms will be very flexible in observing such rules, conditions and measures, which will result in the highest financial benefit.

5. Conclusions

Small farms make up a significant share of EU agriculture. The main goal of this research was to present the directions of development in the number of small farms in Central and Eastern Poland, to indicate the factors determining their functioning and the future path of their development.
The research based on cluster k-mean and PCA analyses showed that in the examined region, we can identify three types of small farm models present in the selected region. These are “professional”, “hobby” and “two-occupation” farms. By size, “professional” farms are the biggest, while “hobby” are the smallest and the most dependent on public support. Farmers from the last group are somewhere between the first two.
The empirical research based on the surveys conducted in Central and Eastern Poland among farmers, village mayors and municipality agricultural officers shows that between 2005 and 2017 the number of landowners paying agricultural tax increased by 9%. At the same time, the number of agricultural entities receiving direct payments decreased by around 7%. Using the knowledge of the village mayors who are aware of the real situation, we identified a significant gap between the number of “official farmers” and “active” farmers. The gap was explained by the generous public policy toward farmers, as sustaining the farmers’ status also makes it attractive to non-farming entities to become “administrative farmers”. Among the small farms, “administrative” farmers represent two-thirds of all subjects in the region.
The main impulses encouraging the maintenance or further development of small farms are: (1) the large possibilities of obtaining European funds directed to agriculture and rural areas and; (2) no alternative to agricultural activity. According to farmers running small farms in Central and Eastern Poland, the main barriers to developing agricultural activity are: (1) the low profitability of agricultural production and; (2) the large investment needs resulting in high demand for capital.
The dominant future income model of rural farms is expected to be based on combined off-farm income and income from agricultural production (“two-occupation” or “hobby” farms). In numbers, these types of entities will outperform those farmers who will conduct agricultural production as their main income-generating activity. These (“professional”) expressed a willingness to invest, develop and diversify production; they also possibly intend to introduce direct sales to the consumers. Taking into consideration the knowledge acquired from the surveys, literature and theory, we assume that “professional” farms are considered to be most economically viable in the long-term perspective, while “hobby” and “two-occupation” farms might encounter succession problems in the future. Their development and activities will be highly correlated to the public support available, as it contributes significantly to their income. With the proposed changes to EU agricultural policy, the business of small farms in Poland is expected, to a certain extent, to be based on the supply of public goods related to agriculture and the environment.

Author Contributions

Conceptualization: A.H. and A.P.; Methodology: A.H., A.P.; Validation T.K., P.B. and P.K.; Formal analysis T.K., P.K. and L.S., writing—original draft preparation: A.H., A.P.; Writing—review and editing, A.H., A.P., P.K., T.K., P.B., L.S.; Supervision: A.P. and L.S.; Project administration: A.H. and P.K. All authors have read and agreed to the published version of the manuscript.

Funding

This research was funded by National Science Centre Poland, PRELUDIUM grant number 2015/17/N/HS4/01550.

Conflicts of Interest

The authors declare no conflict of interest.

References

  1. Czyżewski, B. Treadmill Market in European Agriculture (Kierat Rynkowy w Europejskim Rolnictwie); PWN: Warsaw, Poland, 2017. [Google Scholar]
  2. Gołaś, Z. Efficiency and profitability of work in agriculture on the basis of economic accounts for agriculture. Probl. Agric. Econ. 2010, 3, 19–42. [Google Scholar]
  3. Hunt, R.C. Labor Productivity and Agricultural Development: Boserup Revisited. Hum. Ecol. 2000, 28, 251–277. [Google Scholar] [CrossRef]
  4. Rembisz, W. Mikro i Makroekonomiczne Podstawy Wzrostu w Sektorze Rolno-Spożywczym; Wydawnictwo Vizja Press & IT: Warsaw, Poland, 2008; pp. 1–342. [Google Scholar]
  5. Parzonko, A.; Hornowski, A. Economic and social assessment of the use of structural funds in the creation of the development of “small” farms in Poland. J. Agribus. Rural Dev. 2017, 44, 413–420. [Google Scholar] [CrossRef]
  6. Błażejczyk-Majka, L.; Kala, R.; Maciejewski, K. Productivity and efficiency of large and small field crop farms and mixed farms of the old and new EU regions. Agric. Econ. 2012, 58, 61–71. [Google Scholar] [CrossRef] [Green Version]
  7. Kowalczyk, S.; Sobiecki, R. Europejski model rolnictwa wobec wyzwań globalnych. Probl. Agric. Econ. 2011, 4, 35–58. [Google Scholar]
  8. Bański, J. Geography of Polish Agriculture; PWE: Warsaw, Poland, 2007. [Google Scholar]
  9. Poczta, W.; Pawlak, K.; Czubak, W. Production and income situation in polish agriculture after accession to the european union. [Produktions- und einkommenssituation im landwirtschaftlichen sektor polens nach dem beitritt zur Europäischen Union]. Ber. Uber Landwirtsch. 2012, 90, 133–158. [Google Scholar]
  10. Piskorz, W. The effect of European Union accession on Poland’s agricultural markets and budgetary expenditures. Agric. East-West Eur. Integr. 2017, 56, 85–106. [Google Scholar]
  11. Jürgenson, E.; Rasva, M. The Changing Structure and Concentration of Agricultural Land Holdings in Estonia and Possible Threat for Rural Areas. Land 2020, 9, 41. [Google Scholar] [CrossRef] [Green Version]
  12. Connolly, L. Overview of the changing structure of Irish agriculture monitored by the National Farm Survey. In Presentation Made to the the Agricultural Economics Society of Ireland; Teagasc Rural Economy Research Centre: Athenry, Ireland, 30 October 2007. [Google Scholar]
  13. Wojewodzic, T.; Sroka, W.; Kopyra, M.K. Departure from farming in Polish metropolitan areas–assessment of the scale and spatial differentiation. Optimum. Econ. Stud. 2020, 1, 174–186. [Google Scholar] [CrossRef] [Green Version]
  14. Józwiak, W.; Michna, W.; Mirkowska, Z. Procesy Zachodzące w Rolnictwie Polskim w Latach 1990–2010, Projekcje na Rok 2013 i Pożądana Wizja Rolnictwa w 2020 Roku- Zagadnienia Wybrane; Institute of Agricultural and Food Economics National Research Institute: Warsaw, Poland, 2011. [Google Scholar]
  15. Janus, J.; Markuszewska, I. Land consolidation–A great need to improve effectiveness. A case study from Poland. Land Use Policy 2017, 65, 143–153. [Google Scholar] [CrossRef]
  16. Zegar, J.S. Issues of land concentration in Polish private farming. Rocz. Nauk Rol. 2009, 96, 256–266. [Google Scholar]
  17. Wigier, M. The Model of Development of Polish Agriculture in the Light of the CAP Implementation. Probl. Agric. Econ. 2013, 1, 22–41. [Google Scholar] [CrossRef]
  18. Statistics Poland. Statistical Yearbook of Agriculture 2018; Statistics Poland: Warsaw, Poland, 2019. [Google Scholar]
  19. Zegar, J.S. The role of small farms in the process of socially sustainable rural development. Probl. Small Agric. Hold. 2012, 1, 129–148. [Google Scholar]
  20. Von Braun, J.; Mirzabaev, A. Small Farms: Changing Structures and Roles in Economic Development. ZEF-Discuss. Pap. Dev. Policy 2015, 204, 31. [Google Scholar] [CrossRef] [Green Version]
  21. Mark, D. Shucksmith, Katrina Rønningen The Uplands after neoliberalism?—The role of the small farm in rural sustainability. J. Rural Stud. 2011, 27, 3275–3287. [Google Scholar]
  22. D’Souza, G.; Ikerd, J. Small Farms and Sustainable Development: Is Small More Sustainable? J. Agric. Appl. Econ. 1996, 28, 73–83. [Google Scholar] [CrossRef] [Green Version]
  23. Carlin, T.A.; Crecink, J. Small Farm definition and Public Policy. Am. J. Agric. Econ. 1979, 61, 933–939. [Google Scholar] [CrossRef] [Green Version]
  24. Guiomar, N.; Godinho, S.; Pinto-Correia, T.; Almeida, M.; Bartolini, F.; Bezak, P.; Biro, M.; Bjørkhaug, H.; Bojnec, S.; Brunori, G.; et al. Typology and dis-tribution of small farms in Europe: Towards a better picture. Land Use Policy 2018, 75, 784–798. [Google Scholar]
  25. Davidova, S.; Thomson, K. Family farming in Europe: Challenges and prospects. In Directorate General for Internal Policies, Policy Department B: Structural and Cohesion Policies; European Parliament’s Committee on Agriculture and Rural Development: Brussels, Belgium, 2014. [Google Scholar]
  26. Hubbard, C. Small Farms in the EU: How Small is Small? In Proceedings of the 111th EAAE-IAAE Seminar, Canterbury, UK, 26–27 June 2009. [Google Scholar]
  27. Wojewodzic, T. Procesy Dywestycji i Dezagraryzacji na Obszarach o Rozdrobnionej Strukturze Agrarnej; Publisheing House of the University of Agriculture in Krakow: Krakow, Poland, 2017. [Google Scholar]
  28. Dzun, W. Small farms in Polish agriculture—Definition and characteristics. Village Agric. 2013, 2, 9–27. [Google Scholar]
  29. Sroka, W.; Dudek, M.; Wojewodzic, T.; Król, K. Generational Changes in Agriculture: The Influence of Farm Characteristics and Socio-Economic Factors. Agriculture 2019, 9, 264. [Google Scholar] [CrossRef] [Green Version]
  30. Wilkin, J. Aksjologia i prakseologia polityki wobec drobnych gospodarstw rolnych w Polsce i w Unii Europejskiej. Village Agric. 2013, 2, 43–54. [Google Scholar]
  31. Michalska, S. Społeczny wymiar funkcjonowania drobnych gospodarstw rolnych. Probl. Drob. Gospod. Rol. 2012, 1, 85–94. [Google Scholar]
  32. Davidova, S.; Bailey, A. Roles of Small and Semi-subsistence farms in the EU. EuroChoices 2014, 13, 10–14. [Google Scholar] [CrossRef] [Green Version]
  33. Berti, G.; Mulligan, C. Competitiveness of Small Farms and Innovative Food Supply Chains: The Role of Food Hubs in Creating Sustainable Regional and Local Food Systems. Sustainability 2016, 8, 616. [Google Scholar] [CrossRef] [Green Version]
  34. Alexandri, C.; Luca, L. The role of small farms in Romania and their future in the face of challenges of the CAP post 2013. Probl. Small Agric. Hold. 2012, 1, 13–30. [Google Scholar]
  35. Bukraba-Rylska, I. The role of small farms in creating capital and cultural heritage of the village. Probl. Small Agric. Hold. 2012, 1, 43–60. [Google Scholar]
  36. Daugstad, K.; Rønningen, K.; Skar, B. Agriculture as an upholder of cultural heritage? Conceptualizations and value judgements—A Norwegian perspective in international context. J. Rural Stud. 2006, 22, 67–81. [Google Scholar] [CrossRef]
  37. Kiryluk-Dryjska, E.; Beba, P. The Potential for Development of Non-Agricultural Activities in Rural Areas of Northwest Poland. J. Agribus. Rural Dev. 2018, 2, 137–142. [Google Scholar] [CrossRef]
  38. High Level Panel of Experts [HLPE]. Investing in Smallholder Agriculture for Food Security; HLPE Report 6; Committee on World Food Security FAO: Rome, Italy, 2013. [Google Scholar]
  39. Halamska, M. Quasi-chłopi w przestrzeni społecznej polskiej wsi. Village Agric. 2013, 2, 28–42. [Google Scholar]
  40. Czudec, A. Ekonomiczne, środowiskowe i społeczne funkcje drobnych gospodarstw rolnych. Village Agric. 2013, 159, 90–105. [Google Scholar]
  41. Krasowicz, S.; Oleszek, W.; Horabik, J.; Dębicki, R.; Jankowiak, J.; Stuczyński, T.; Jadczyszyn, J. Rational management of the Polish soil environment. Pol. J. Agron. 2011, 7, 43–58. [Google Scholar]
  42. Wąs, A. Development of small farms in process of structural changes of Polish agriculture. Rocz. Ekon. KPSW Bydg. 2015, 8, 364–382. [Google Scholar]
  43. FADN. Wyniki Standardowe 2017 Uzyskane Przez Gospodarstwa Rolne Uczestniczące w Polskim FADN. Available online: http://fadn.pl/wp-content/uploads/2018/12/SRwaz_2017.pdf (accessed on 8 February 2019).
  44. Statistics Poland. Characteristics of Agricultural Holdings; Statistics Poland: Warsaw, Poland, 2017; p. 294.
  45. Eurostat Database. Available online: https://appsso.eurostat.ec.europa.eu/nui/show.do?dataset=ef_m_farmang&lang=en (accessed on 20 May 2020).
  46. Tryon, R. Cluster Analysis; McGraw-Hill: New York, NY, USA, 1939. [Google Scholar]
  47. Cattell, R. A note on correlation clusters and cluster search methods. Psychometrica 1944, 9, 169–184. [Google Scholar] [CrossRef]
  48. Hartigan, J.A.; Wong, M.A. A K-Means Clustering Algorithm. Appl. Stat. 1979, 28, 100–108. [Google Scholar] [CrossRef]
  49. Nowak-Brzezińska, A. Analiza Skupień, Konspekt do Zajęć: Statystyczne Metody Analizy Danych. Available online: http://zsi.tech.us.edu.pl/~nowak/odzw/smad_lab11.pdf (accessed on 8 June 2019).
  50. Płaszczyca, M. Analiza Składowych Głównych (PCA). Available online: https://www.statystyka.az.pl/analiza-skladowych-glownych-pca.php (accessed on 8 June 2019).
  51. Dutkowski, J. Eksploracyjna Analiza Danych. Metody Rzutowania: Analiza Składowych Głównych Oraz Skalowanie Wielowymiarowe. Available online: https://www.mimuw.edu.pl/~aniag/SADM/pca (accessed on 8 June 2019).
  52. Cochrane, W.W. Farm Prices: Myth and Reality; U of Minnesota Press: Minneapolis, MN, USA, 1958. [Google Scholar]
  53. Levins, R.A.; Cochrane, W.W. The treadmill revisited. Land Econ. 1996, 72, 550–553. [Google Scholar] [CrossRef]
  54. Calus, M.; Van Huylenbroeck, G.; Van Lierde, D. The relationship between farm succession and farm assets on Belgian farms. Sociol. Rural. 2008, 48, 38–56. [Google Scholar] [CrossRef]
  55. Bertoni, D.; Cavicchioli, D. Farm succession, occupational choice and farm adaptation at the rural-urban interface: The case of Italian horticultural farms. Land Use Policy 2016, 57, 739–748. [Google Scholar] [CrossRef]
  56. Bórawski, P.; Bełdycka-Bórawska, A.; Szymańska, E.J.; Jankowski, K.J.; Dunn, J.W. Price volatility of agricultural land in Poland in the context of the European Union. Land Use Policy 2019, 82, 486–496. [Google Scholar] [CrossRef]
  57. Adamowicz, M.; Szepeluk, A. Support to young farmers as part of agricultural policy of the European Union. Probl. Agric. Econ. 2016, 3, 106–127. [Google Scholar]
  58. Zagata, L.; Hádková, Š.; Mikovcová, M. Basic Outline of the Problem of the “Ageing Population of Farmers” in the Czech Republic. AGRIS On-Line Pap. Econ. Inform. 2015, 7, 89–96. [Google Scholar] [CrossRef] [Green Version]
  59. Sikorska, A. Farmer to farmer leases The Market of Agricultural Land—State and Perspectives. Mark. Anal. IAFE 2006, 9, 18–20. [Google Scholar]
  60. Prus, P. Farmers’ opinions about the prospects of family farming development in Poland. In Rural Development and Entrepreneurship Production and Co-operation in Agriculture, Proceedings of the 20th International Scientific Conference Economic Science for Rural Development, Jelgava, Latvia, 9–11 May 2018; ESAF LLU: Jelgava, Latvia, 2018; pp. 268–275. [Google Scholar]
  61. Zawisza, S.; Prus, P.; Beben, S. Development of agricultural farms in terms of Common Agricultural Policy support in the opinion of farmers. In Rural Development and Entrepreneurship Production and Co-operation in Agriculture, Proceedings of the 20th International Scientific Conference Economic Science for Rural Development, Jelgava, Latvia, 9–11 May 2018; ESAF LLU: Jelgava, Latvia, 2018; pp. 264–271. [Google Scholar]
  62. Sulewski, P. Barriers and chances for farm development in farmers opinions. Sabaragamuwa Univ. J. 2008, 67, 67–77. [Google Scholar]
  63. Majewski, E. Jakość Zarządzania w Gospodarstwach Rolniczych w Polsce w świetle Badań; Warszaw University of Life Sciences Press: Warsaw, Poland, 2001. [Google Scholar]
  64. Čermák, M.; Malec, K.; Maitah, M. Price Volatility Modelling–Wheat: GARCH Model Application. AGRIS On-Line Pap. Econ. Inform. 2017, 9, 15–24. [Google Scholar] [CrossRef] [Green Version]
  65. Bomberski, A.; Prus, P.; Szczepanek, M. Stimulating Innovativeness in Rural Areas as Part of the” Cooperation” Measure with the Ancient Grain Operational Group-a Case Study. Ann. Pol. Assoc. Agric. Agribus. Econ. 2020, 22, 40–47. [Google Scholar] [CrossRef]
  66. Chlebicka, A.; Pietrzak, M. Size of membership and survival patterns of producers’ organizations in agriculture—Social aspects based on evidence from Poland. Sustainability 2018, 10, 2293. [Google Scholar] [CrossRef] [Green Version]
  67. Chloupkova, J.; Svendsen, G.L.H.; Svendsen, G.T. Building and destroying social capital: The case of cooperative movements in Denmark and Poland. Agric. Hum. Values 2013, 20, 241–252. [Google Scholar] [CrossRef]
  68. Svendsen, G.L.H.; Svendsen, G.T. The Creation and Destruction of Social Capital: Entrepreneurship, co-Operative Movements, and Institutions; Edward Elgar Publishing: Glos, UK, 2004. [Google Scholar]
  69. Kotyza, P. The Effects of Providing Support for the Creation of new Marketing Organisations in the Czech Republic, Slovakia, and Poland; National Museum of Agriculture: Prague, Czech Republic, 2017. [Google Scholar]
  70. Freshwater, D. The importance of improving incentives and employment opportunities for farm households in Poland. Wieś Rol. 2017, 176, 11–33. [Google Scholar]
  71. Gebeltová, Z.; Malec, K.; Maitah, M.; Smutka, L.; Appiah-Kubi, S.N.K.; Maitah, K.; Sirohi, J. The Impact of Crop Mix on Decreasing Soil Price and Soil Degradation: A Case Study of Selected Regions in Czechia (2002–2019). Sustainability 2020, 12, 444. [Google Scholar] [CrossRef] [Green Version]
  72. Milczarek-Andrzejewska, D.; Zawalińska, K.; Czarnecki, A. Land-use conflicts and the common agricultural policy: Evidence from Poland. Land Use Policy 2018, 73, 423–433. [Google Scholar] [CrossRef] [Green Version]
  73. Sikorska, A. Lease of agricultural land. Farmer to farmer leases. The Market of Agricultural Land—State and Perspectives. Mark. Anal. IAFE 2010, 13, 44–52. [Google Scholar]
  74. Bryła, P. Agricultural Enterprises in Poland. In Managing Agricultural Enterprises; Bryła, P., Ed.; Palgrave Macmillan: London, UK, 2018. [Google Scholar]
  75. Gale, F.H. Age-specific patters of exit and entry in U.S. farming, 1978–1997. Rev. Agric. Econ. 2003, 25, 168–186. [Google Scholar] [CrossRef]
  76. Šimpachová Pechrová, M.; Šimpach, O.; Medonos, T.; Spěšná, D.; Delín, M. What Are the Motivation and Barriers of Young Farmers to Enter the Sector? AGRIS On-Line Pap. Econ. Inform. 2018, 10, 79–87. [Google Scholar] [CrossRef] [Green Version]
  77. Hornowski, A. Investment activities of Polish farms profiting from structural UE funds in 2004–2013. Sci. Pap. SGGW Econ. Food Econ. Organ. 2015, 109, 55–70. [Google Scholar]
  78. Johnson, K.M.; Lichter, D.T. Rural depopulation: Growth and decline processes over the past century. Rural Sociol. 2019, 84, 3–27. [Google Scholar] [CrossRef] [Green Version]
  79. Kováts, K.; Kovács, A. Factors of population decline in rural areas and answers given in EU member states’ strategies. Stud. Agric. Econ. 2012, 114, 49–56. [Google Scholar] [CrossRef]
  80. Jakubowski, A.; Bronisz, U. Rural Demographic Problem Areas in Poland. Probl. World Agric. 2019, 19, 41–53. [Google Scholar] [CrossRef] [Green Version]
  81. Reynaud, C.; Miccoli, S. Depopulation and the aging population: The relationship in Italian municipalities. Sustainability 2018, 10, 1004. [Google Scholar] [CrossRef] [Green Version]
  82. Galluzzo, N. A non-parametric analysis of technical efficiency in Bulgarian farms using the FADN Dataset. Eur. Countrys. 2018, 10, 58–73. [Google Scholar] [CrossRef] [Green Version]
  83. Corsi, A. Family farm succession and specific knowledge in Italy. Riv. Econ. Agrar. 2009, 64, 13–30. [Google Scholar]
  84. Hlavsa, T.; Hruška, M.; Turková, E. The impact of investment support from the Rural Development Programme of the Czech Republic for 2007–2013 on the economic efficiency of farms. Stud. Agric. Econ. 2017, 119, 11–17. [Google Scholar] [CrossRef] [Green Version]
  85. Kirchweger, S.; Kantelhardt, J.; Leisch, F. Impacts of the government-supported investments on the economic farm performance in Austria. Agric. Econ. 2015, 61, 343–355. [Google Scholar] [CrossRef] [Green Version]
  86. Volkov, A.; Morkunas, M.; Balezentis, T.; Šapolaitė, V. Economic and Environmental Performance of the Agricultural Sectors of the Selected EU Countries. Sustainability 2020, 12, 1210. [Google Scholar] [CrossRef] [Green Version]
  87. Veveris, A.; Šapolaitė, V.; Giedrė Raišienė, A.; Bilan, Y. How Rural Development Programmes Serve for Viability of Small farms? Case of Latvia and Lithuania. AGRIS On-Line Pap. Econ. Inform. 2019, 11, 103–113. [Google Scholar] [CrossRef]
  88. Suess-Reyes, J.; Fuetsch, E. The future of family farming: A literature review on innovative, sustainable and succession-oriented strategies. J. Rural Stud. 2016, 47, 117–140. [Google Scholar] [CrossRef]
  89. Fałkowski, J. Promoting change or preserving the status quo? The consequences of dominating local politics by agricultural interests. Land Use Policy 2017, 68, 448–459. [Google Scholar] [CrossRef]
  90. Matthews, A.; Roederer-Rynning, C. Brexit Complicates the EU’s Efforts to Reform its Common Agricultural Policy. Available online: http://eprints.lse.ac.uk/104171/ (accessed on 8 June 2020).
  91. Stillitano, T.; Falcone, G.; Nicolò, B.F.; Di Girolamo, C.; Gulisano, G.; De Luca, A.I. Technical Efficiency Assessment of Intensive and Traditional Olive Farms in Southern Italy. AGRIS On-Line Pap. Econ. Inform. 2019, 2, 81–93. [Google Scholar] [CrossRef]
Figure 1. Identification of optimal number of clusters using elbow method. Source: Own data.
Sustainability 12 05095 g001
Figure 2. Classification by k-means method, first and second component. Source: Own results based on conducted data analyses.
Sustainability 12 05095 g002
Table 1. Structure of conducted survey.
Number of EntitiesNumber of Entities SurveyedNumber of Qualified EntitiesPercentage of Entities Qualified in Total Entities [%]
Rural municipalities60236193.2
In voivodeshipMasowian226952.2
Podlaskie78956.4
Lublin165995.5
Lodz133900.0
Villages in municipalities 512767514.6
Number of ‘active’ farmsN\A150116N\A
Table 2. Used variables for Principal Component Analysis component analyses.
NumberVariableNumberVariable
0Total production [PLN]7Farmer’s age [years]
1Own work resources [FWU]8Possession of a successor [yes/no]
2Own land + rented land [ha]9Farmer’s agricultural education
3Total costs [PLN]10Number of persons employed outside the agricultural holding
4Direct payments [PLN]11Agricultural income [PLN]
5Fixed assets [PLN]12Income from work outside the farm [PLN]
6Land value [PLN]13Social income [PLN]
Note: PLN—Polish currency (Zloty); FWU—Family Work Unit (fully employed unpaid workers).
Table 3. Average factors divided into separate groups.
VariablesCluster 0: Professional FarmsCluster 1: Hobby FarmsCluster 2: Two-Occupation Farms
Values ****R2 ***Values ****R2 ***Values ****R2 ***
0Total agricultural production [EUR]23,498-7077-11,009-
1Own work resources FWU2.5X0.70.1761.10.015
2Own land + rented land [ha]12.30.4257.4X12.5X
3Total costs [EUR]13,9380.66157030.73589130.794
4Direct payments [EUR]44090.4202016X3700X
5Fixed assets [EUR]160,9180.15555,384X111,806X
6Land bookkeeping value [EUR]78,693X43,345X72,390X
7Farmer’s age *3.1X1.9X3.2X
8Possession of a successor **1.00.0000.40.3150.9X
9Farmer’s agricultural education **0.8X0.60.1510.9X
10Number of family members working outside the farm0.3X2.0X1.9X
11Household agricultural income [EUR]15,8480.12133900.62259350.132
12Household income from work outside the farm [EUR]1655X10,6870.2619356X
13Household social income [EUR]2937X1775X2107X
* 1 <30 years, 2 <40 years, 3 <50 years, 4 >50 years of age; ** 1—yes, 0—no; *** R-square determining linear regression relationship between Total agricultural production (0) and other factors. X stands for statistical non-significant relationship; **** nominal value of a variable for reference purposes. Source: Own results based on conducted survey.
Table 4. The number and structure of farms in analysed regions in 2005 and 2017.
Specification20052017
Number%Number%
Agricultural tax payers in the examined municipalities with:25,26810027,541100
between 1 and 5 ha12,99851.415,58956.6
between 6 and 15 ha933036.9895232.5
between 16 and 20 ha15596.216666.0
between 21 and 50 ha12765.012004.4
between 51 and 100 ha900.41080.4
over 100 ha150.1260.1
Number of farmers applying for direct payments17,444-16,258-
Source: Own results based on conducted survey.
Table 5. The difference in farm numbers in surveyed municipalities and villages, 2017.
Number of Farms Municipality LevelVillage Level
all sizesall sizes1–4.99 ha5–15 ha
- paying agricultural tax27,541657542621691
- beneficiaries of direct payments16,258N/AN/AN/A
- insured in KRUS13,483N/AN/AN/A
- active farms *N/A25847291246
* based on information gained from village mayors. Source: Own results based on conducted survey.
Table 6. Farmers’ views on internal and external barriers to the development of “small” farms (% of farmers indicating specific problems).
Internal BarriersPercentage of IndicationsExternal BarriersPercentage of Indications
Poor farm equipment with machinery and equipment42%Low profitability of agricultural production85%
Old and used fixed assets (machines, buildings)61%Problems selling agricultural products55%
Small farmland area26%High prices for agricultural inputs67%
The income obtained is inadequate for the work involved80%Volatility of prices of agricultural products22%
No vision for the future35%Bureaucracy when applying for funding16%
Discouragement to work on a farm32%High land purchase prices in the area42%
No successor23%Increasing sanitary requirements13%
Source: Own results based on conducted survey.
Table 7. Main external impulses contributing to the development of farms in the opinion of their owners [%].
Percentage of indications *
EU programs and funds encourage the development or maintenance of agricultural activities95%
Development opportunities for non-agricultural activities42%
Attractive insurance conditions for farmers (KRUS)79%
Lifestyle and “attachment to the land26%
No alternative to other activities58%
* The surveyed farmers could indicate more than one answer. Source: Own results based on the conducted survey.
Table 8. Farmers’ reasons for maintaining and running a farm in the analysed period 2005–2017.
SpecificationPercentage of Indications *
Investment81%
Additional source of income68%
Patrimony (attachment to land)54%
Safety in the event of job loss38%
Economic benefits of the “farmer” status34%
Passion (hobby)26%
The main source of income for the family18%
* The surveyed farmers could indicate more than one answer. Source: Own results based on the conducted survey.
Table 9. Assessment of the level of farm income in the opinion of farmers [%].
SpecificationPercentage of Indications
Far too low43%
Low26%
Could be higher11%
Satisfying20%
Source: Own results based on the conducted survey.
Table 10. Impulses contributing to the abandonment of agricultural activities in the opinion of municipality agricultural officers.
SpecificationPercentage of Indications [%] *Total
1234
No development prospects in the village163242-89
Lack profitability of agricultural production5326-21100
Migration for work (to the city or abroad)---1616
Migration for education-32263289
The reluctance of young people to return to the countryside---3737
Investment expense that should be incurred to conduct agricultural production at a level ensuring fair income are too high1621421695
* respondents indicated impulses, sorting them from the most important (1) to least important (4), no limitation in number of selected/marked impulses. Source: Own results based on conducted survey.
Table 11. Impulses contributing to the development of agricultural activities in the view of mayors of the surveyed villages.
Impulses Contributing to The Development of Agricultural Activities
Development of farm processing and direct sales95%
EU programs encourage the establishment or continuation of agricultural activities81%
Life in the countryside is cheaper than in the city, so people will come to the countryside49%
Development of non-agricultural activities46%
Increased interest in agricultural production for one’s own needs (healthy lifestyle, healthy food)28%
The values of villages encourage new inhabitants16%
Impulses Contributing to the Abandonment of Agricultural Activities
High capital needed for development95%
No possibility to buy land95%
High land purchase price92%
High density of village buildings69%
Emigration for work (to the city or abroad)61%
The reluctance of young people to return to the countryside53%
Emigration for educational and scientific purposes49%
No development prospects in the village28%
Low profitability of agricultural production15%
Source: Own results based on conducted survey.
Table 12. Impulses contributing to the development of agricultural activities in the opinion of municipality agricultural officers.
SpecificationPercentage of Indications [%] *Total
1234
EU programs encourage farming532621-100
Opportunities to develop non-agricultural activities--261642
Attractive insurance conditions for farmers (KRUS)-5321147
Lifestyle and attachment to the land--425395
No alternative to other non-agricultural activities4242115100
* respondents indicated impulses, sorting them from the most important (1) to least important (4), no limitation in number of selected/marked impulses. Source: Own results based on conducted survey.
Table 13. Expectations related to small farm development.
ExpectationsProfessional FarmHobby FarmTwo-Occupation Farm
Investments, innovationsyesnodepends on investments support programmes
Land resources (UAA)increase (buy or lease)keep or sellkeep or increase
Economic viability strategiesinnovations, diversification, processingextensificationdepends on investments support programmes
Importance of public support in total agricultural incomedecreaseincreasedepends on support characteristics
Long term perspectivefurther developmenttransfer into “administrative farmfollowing “hobby farm” path
Succession probabilityhighlowmedium
Source: Developed by authors based on knowledge gained, surveys and own expectations.

