1. Introduction
Transport is a fundamental instrument for the movement of goods and the free movement of persons in a globalized society. In 2016, the transportation sector represented 5% (9% including households cars fuels) of the total gross value added (GVA) of the European Union (EU) economy [
1]. Logistics such as transport and storage account for 10–15% of the cost of a finished product for European companies [
2]. Transport amounts to 17.2 % (in 2016) of the EU’s total exports of services. In 2017, the transport sector alone was responsible for greenhouse gas emissions of 946 million tonnes of CO
2 equivalent, which corresponds to 27% of the total EU emissions [
3]. In 2016, the transport sector consumed a third of the total final energy consumed in the EU (i.e., 353 Mtoe; 1 toe = 4.1868 × 10
10 J) [
4]. Splitting up transportation into freight or passengers, inland freight transport in the EU-28 was estimated to be just over 2400 billion tonne-kilometres (tkm) in 2016; around three quarters of this total was transported by road [
5]. In passenger transport, cars accounted for 71% of the passenger-kilometres travelled in 2016, while air travel represented 10.5% of the distance travelled in the same year, followed by buses and coaches (8.1%), railways (6.6%), powered two-wheelers (1.9%), tram and metro (1.6%) and ship (0.4%) [
6]. In light of this, the EU is aiming to reduce its dependence on imported oil and, at the same time, cut transport carbon emissions by 60% by 2050 [
7].
Numerous authors have pointed to the transition to a 100% renewable economy as a means to achieve the double objective of guaranteeing energy security and tackling climate change [
8,
9,
10]. However, the economic overhaul required to make such a transformation raises legitimate doubts about whether it is possible while maintaining the services that the current system provides. García-Olivares [
11] argued that its feasibility would greatly depend on our capacity to reach a stationary industrial economy. Accordingly, in this article we explore what a sustainable European transport sector would look like in the framework of a stationary economy.
Gilbert and Pearl [
12] studied electric transportation systems for a post-carbon economy, but no cost estimation was provided. The Intergovernmental Panel on Climate Change [
13] suggested some transport systems for a future post-carbon economy, while Teske et al. [
14] showed that some transportation systems with low energy intensity are already available for a 100% renewable economy. King et al. [
15] proposed a set of promising new technologies to electrify land transport. The International Renewable Energy Agency [
16] studied different transition scenarios which suggest that a global sustainable transport is technologically feasible. Edelstein [
17] analysed a catenary system for trucks that at that time was being trialled in Sweden with promising results. Swenson [
18] proposed different new designs for a 100% renewable economy, including the
Solar Automated Nonstop Elevated (SANE) system for urban and metropolitan mobility. Thomas [
19] reviewed the feasibility of different renewable powertrains for land transport, including fuel cell, battery and biogas vehicles. Arbib and Seba [
20] proposed different ways to restructure the transport system, introducing the Transport as a Service concept, while Ram et al. [
10] studied the energy and capital cost of a 100% renewable transition in Europe for all sectors but considered only one transition scenario for transportation. García-Olivares [
11] and García-Olivares et al. [
21] pointed to the need to rationalize the transportation structure when shifting to renewable electricity in a global decarbonized economy.
In this study, we estimate the capital and energy costs of reconverting the EU transportation system, using current or prototyped technologies, to one powered exclusively by renewable energy sources. Data used for this study correspond to the transport system of 2016, since more recent data were still unavailable or incomplete. Such calculations consider the capital cost of the vehicles, vessels, aircraft and trains, as well as the cost of the basic infrastructures needed to keep the system operative. One relevant contribution of the present work is the estimation of the cost of the complete substitution of the current EU land transport system with a railroad system. Indeed, we show that the already large electrification of the EU railways makes this scenario economically feasible. We use conservative hypotheses for the energy intensity (joules per USD) of manufacturing these infrastructures, which correspond to the upper range predictions of some life-cycle assessments (LCA) discussed in
Section 2. Additionally, this work also refines the costs estimations of the world reconversion made by García-Olivares et al. [
21].
2. Materials and Methods
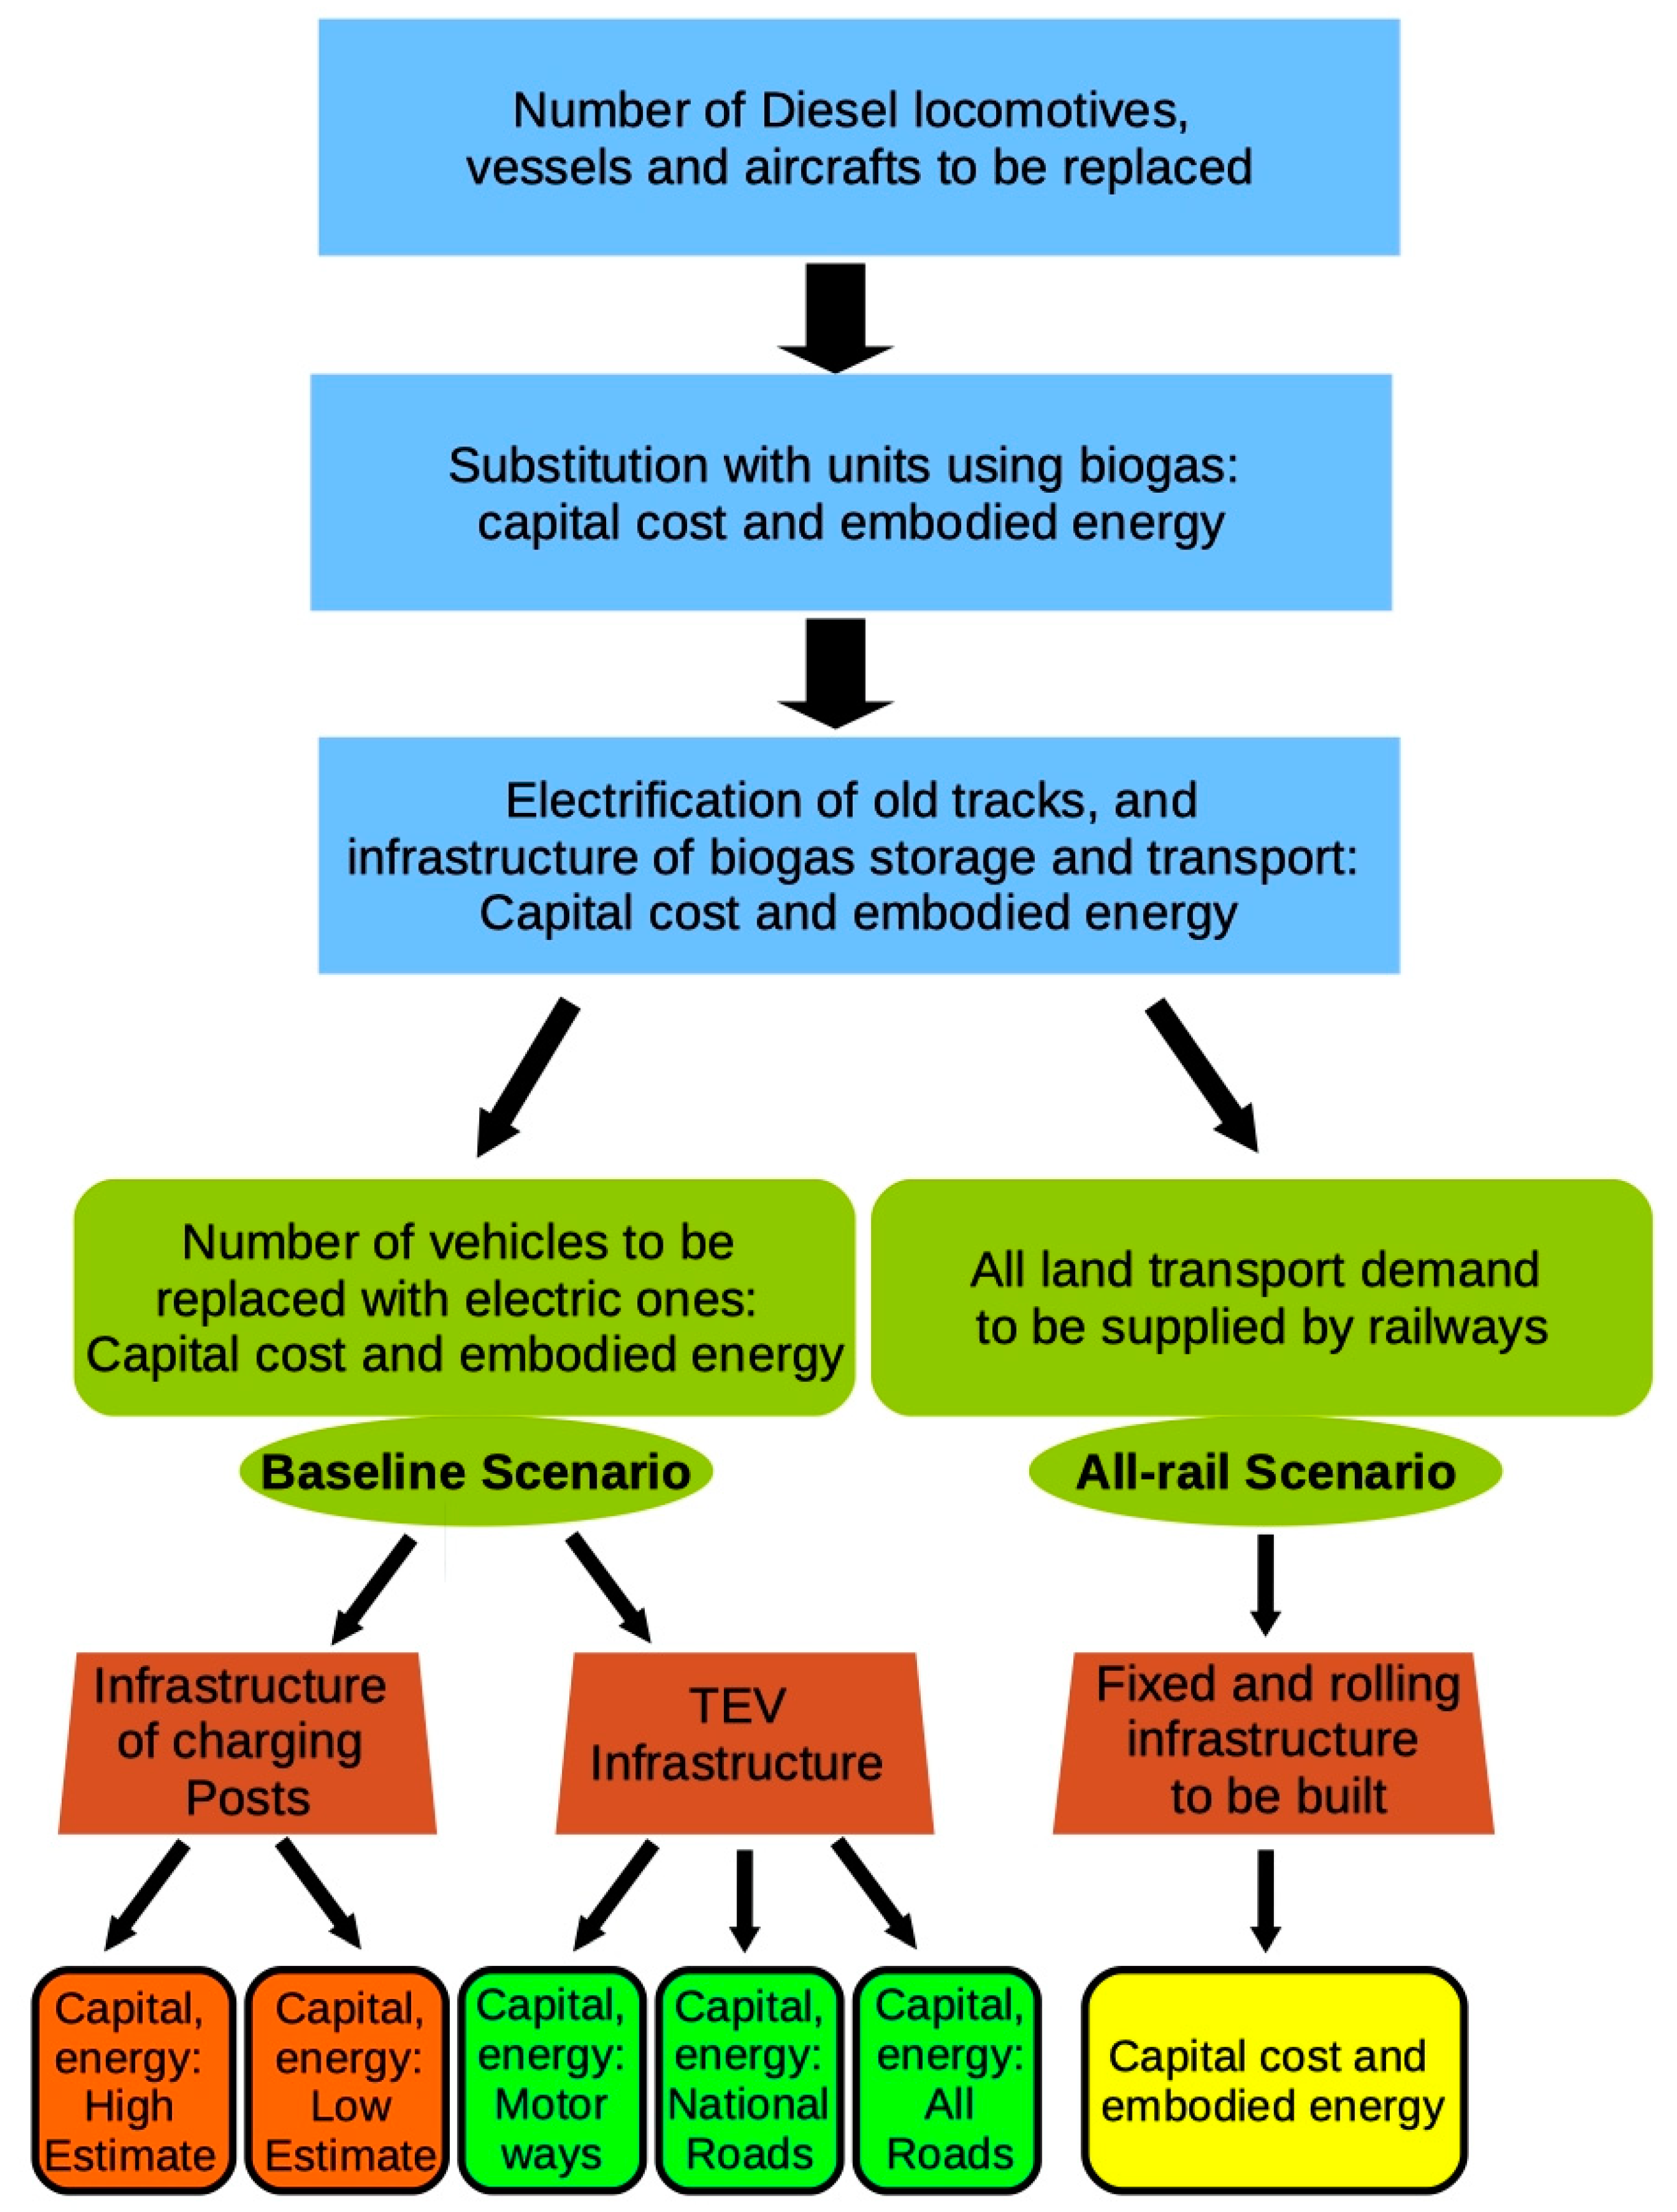
In this section, we introduce the calculation methodology and the scenarios and sub-scenarios used in this work. The calculation methodology is applied across all scenarios and sub-scenarios. The flow chart in
Figure 1 summarizes the calculations made in the two main scenarios studied. In
Section 4, we also consider mixed scenarios that combine the best qualities of the scenarios analysed here.
2.1. Scenarios
Baseline scenario. In this scenario the fleet of transport units (vehicles, trains, ships, and aircraft, respectively) of 2016 is assumed to be fully replaced with an equal number of transport units, powered by electricity or biomethane.
First, we estimate the gross investment in the manufacture of these fleets and their support infrastructures, and on that basis, the embodied energy in that capital.
This baseline scenario considers two sub-scenarios in which road transport is the differentiating factor. For the first sub-scenario charging posts are considered in the analysis while for the second sub-scenario Tracked Electric Vehicle (TEV) is studied as an alternative.
The analysis of this scenario leads to the proposal of some alternative decarbonized scenario.
The all-rail scenario considers the building of new infrastructure of electric locomotives and railways able to supply the same service as that provided by the whole land transport of 2016; for this, the statistics of passenger-km and tonnes-km transported in 2016 in the EU are used. This is an extreme scenario, but it will be a limit scenario of reference to discuss other intermediate possibilities (
Section 4).
In the final discussion, we try to overcome some of the issues and bottlenecks of the two main scenarios. For instance, we consider the potential use of hydrogen and jet biofuels (instead of liquid bio-methane) in future aircrafts, and the reduction of the size of the future aircraft fleet. We also discuss the combination of the scenarios shown in
Figure 1.
In the final discussion, we provide estimates for the transition expenditures and the fractions of GDP investment required to drive the transition towards the main scenarios considered.
2.2. Calculation Methodology
In each scenario, we estimate the cost in US dollars (USD) of the replacement of each transport sector by renewable alternatives, using the present market price of the main modes of transport. Then, we estimate the embodied energy associated to that capital, without considering the additional costs required for new electric vehicle maintenance, the expansion of the general electrical network, the renewable energy production infrastructure, or investments in associated research and development.
A precise calculation of the embodied energy in the new transport infrastructure would require a complete life-cycle assessment (LCA) of each class of transport unit using either a bottom-up or a top-down approach [
22]. A bottom-up LCA maps every process associated with a transport unit and associates energy inputs with each process. The analysis is very detailed, but it is usually time- and effort-intensive due to heavy data requirements, especially when the first, second, third, etc., supplier levels are included. The exclusion of some of these suppliers may lead to an underestimation of the embodied energy. Top-down LCA associates economic output from a sector (given in producer prices of steel manufactured, assembled car, etc.) with the respective associated energy. This results in an industry-wide assessment, but with a larger uncertainty in the real energy cost of the specific transport units. Both approaches require analysing, one by one, all the transport units and infrastructures involved in European transport, which is beyond the scope of this study. Instead, we make an estimation of the embodied energy in each transport unit or infrastructure using a simplified top-down estimation, which we explain below. The results are compared in
Section 3.7 with the annual energy consumed by the transport sectors in 2016 and in a future 100% renewable economy.
The production cost of a transport unit (e.g., a car) essentially includes the added value of the vehicle construction industry (with its characteristic energy intensity) plus the cost of direct energy and raw materials, which have different energy intensities because they have been produced by different economic sectors. García-Olivares et al. [
21] assumed that the energy intensity of producing one transport unit corresponded to its final product in the transport equipment sector, because it is there where the main part of the added value is generated. However, this simplification may underestimate the embodied energy because transport equipment manufacturing accounts for only 12% of the average energy intensity of the industrial sector [
23]. For instance, Volkswagen [
24] made a detailed LCA analysis, which was in accordance with ISO 14040/44 standards, for the Golf 1.6 TDI BMT vehicle, and concluded that the vehicle’s construction involved an embodied energy of 66 GJ. Given that its price was approximately 27,450 USD, its embodied energy is 2.4 × 10
6 J/USD. This figure matches the energy intensity of the German industry, which is the country where the vehicle and its components were produced.
Lewis [
25] compared two different LCAs of the Airbus A-320, A-330 and A-380 aircraft and observed that the estimated CO
2 impact and embodied energy of their construction vary by one order of magnitude depending on the chosen approach (process-based LCA or input-output LCA). His conclusion was that the upper bound estimation was more reasonable: 2.1 × 10
7 kg CO
2 eq (and 2.7 × 10
14 J), 5.1 × 10
7 kg oil eq (and about 6.4 × 10
14 J), 8.3 × 10
7 kg of CO
2 eq (and 10.3 × 10
14 J), respectively. Given that the prices of those three aircraft in 2017 were 99, 233.8 and 436.9 million USD, respectively [
26], their embodied energy per USD is estimated at 2.7 × 10
6, 2.8 × 10
6 and 2.4 × 10
6 J/USD. This corresponds, respectively, to 113%, 115% and 99% of the mean energy intensity of the industry of the countries where Airbus manufactures its aircraft.
Thus, to translate the production cost of new transport infrastructure into its embodied energy, we will be conservative and use the energy intensity of the industry of the country (or group of countries) where the infrastructure is built. One kilogram oil equivalent (koe) is equal to 41,868,000 joules. If it is the EU as a whole, the figure will be: 0.08 koe/
$USD2005 = 0.08 koe/(1.247
$USD2016) = 0.064 koe/USD [
27], where the dollar inflation rate between 2005 and 2016 (24.7%) has been used. From here onwards,
$USD2016 and USD refers to dollars at constant exchange rate, price and purchasing power parities in 2016.
To be consistent, the energy intensities used are multiplied by a factor of 0.93 in this study, as it is discussed in García-Olivares et al. [
21]. The reason is that a 100% electrified machinery industry will demand 87% of the energy required by a fossil-fuel-based machinery industry to provide the same service. This would decrease the energy intensity of the sector during the entire transition, which would have a mean value 93% of the initial value during the period. The industry energy intensity of different countries in 2016 is taken from Table B3 of Appendix B of García-Olivares et al. [
21].
Finally, we give estimates of the energy required for a fully renewable transport sector. These include the shifting from fuel oil and kerosene to liquid biogas in the shipping and air sectors, or to other biofuels in aircrafts, and the amount of electricity required for running the whole sector.
2.3. Evaluation of the Different Modes of Transport
2.3.1. Light-Duty Vehicles, Medium-Freight Trucks and Heavy-Freight Trucks
The number of passenger cars, motorcycles, and buses (and coaches) on EU-28 roads was 259.5 million, 33.8 million and 849,600, respectively in 2016 ([
1], p.88–91). The European Automobile Manufacturers Association [
28] reports 31.6 million light commercial vehicles, and 6.3 million medium and heavy commercial vehicles (over 3.5 tonnes), for 2016. According to the accumulated registrations from 2003 to 2017 in the EU ([
29], Figures 2–13, p. 22), trucks under 16 tonnes are approximately a third of the total, and trucks over 16 tonnes are approximately two-thirds of the total; for buses these percentages are approximately 50% each. In this work, we take these fractions as representative of the fraction of the corresponding vehicle class in relation to the total number of vehicles in use. Thus, the number of light (
nl), medium (
nm) and heavy (
nh) commercial vehicles are estimated in the following way:
nl = 31.6 × 10⁶
nm = (6.3 × 0.33 + 0.8496 × 0.5) × 106 = 2.5 × 10⁶
nh = (6.3 × 0.67 + 0.8496 × 0.5) × 106 = 4.6 × 10⁶
The number of commercial vehicles that will use fuel cells will depend on the fraction of long-distance freight that is transported by road (and not by train) [
21]. We assume that its number will only be 10% of the number of commercial vehicles. The rationale behind this assumption is the following: if that (or a larger) percentage were built on a global scale, then 59% (or more) of the platinum reserves would be required for manufacturing fuel cell anodes, thus jeopardising its use in other industry sectors [
21]. The substitution of the road fleet requires the manufacturing of 289 million light-duty vehicles powered by battery motors (or fuel cells), 33 million electric motorcycles, 2.45 million medium-freight trucks and 4.6 million high freight trucks with fuel cell or battery.
The expression used to estimate the total cost in USD for the new fleet (
cv) is the following:
where
nl, n2, nmd and
nhd are the number of light vehicles, two- and three- wheelers, medium-duty trucks and heavy-duty trucks; and
pl, p2, pmd, phd are some typical market prices of these kinds of electric vehicles in 2017.
The 25 best-selling light vehicles in the EU [
30] have their factories in the EU, except the Ford Focus, which is produced in China, and a small proportion of the Dacia Sandero, which comes from outside the EU. On the other hand, the heavy trucks market is dominated by European brands such as Scania, Volvo and Renault [
31]. Thus, we calculate the embodied energy using the energy intensity of the EU industry as a whole.
2.3.2. Water Transportation
As discussed in García-Olivares et al. [
21], a biogas economy would require fewer changes than a hydrogen economy in the shipping and aviation sectors and would have lower security concerns. In the shipping sector, biogas could be used in combustion engines or as a source of hydrogen for a fuel cell. Thus, it will be our fuel of reference for these two sectors in all the scenarios.
The fraction of global shipping that corresponds to the EU-28 can be defined in different ways (looking at the owners of the ships, the ships that exchange goods in European ports, etc.) We have chosen to assign to EU-28 the same distribution of ship types that sail the world, but in a fraction equal to that existing among shipping bunkers in EU ports with respect to world shipping bunkers. This fraction is 0.22 according to IEA Sankey diagram [
32] and Eurostat [
33]. The cost of the whole vessel fleet (
ccb) for the EU is estimated as follows:
where
ppa, pch, pco, pca and
pbu is the aggregated price of the world fleet of passenger, chemical, container, cargo and bulk carrier, respectively; and
bf is the fraction of shipping bunkers in the EU-28 in relation to the world shipping bunkers (0.22). The cost of fishing vessels is calculated separately in a similar form. The number of ships for the main sub-categories of each of the aforementioned classes, and their prices, are discussed in García-Olivares et al. [
21].
We assume that oil tankers will no longer be necessary in a 100% renewable economy, and that they will progressively be decommissioned as a global decarbonized system takes over. For this reason, they have not been considered in these calculations. Biogas production is assumed to be essentially regional (from fermentation and electricity), and it is assumed to be transported by road or pipes [
21]. Olefins, which are the essential components of the petrochemical industry, will probably continue to be produced from petroleum during the transition, but in the long term they will have to be produced from biogas and charcoal in a fully sustainable economy [
11]. Both materials are supposed to be produced in nearby locations and transported by land. The maritime coal trade was 26% of the dry bulk trade in 2004, according to Thien [
34]. Assuming that this share was approximately the same in 2016, 26% of present bulk carriers would no longer be necessary in a future 100% renewable economy, since we assume that charcoal for mineral reduction will be transported from nearby locations [
11].
We use the energy intensities of the industry of the 14 main vessel-producing countries (see [
21]) to estimate the embodied energy associated with this cost.
2.3.3. Electrification of railways
The length of EU-28 railway lines and tracks in 2016 was 227,383 and 349,276 km, respectively ([
35], Figure 63). Assuming that lines with more than two tracks are very infrequent in comparison with single and double-track lines, we obtain that 46.4% of the lines were single-track and 53.6% double-track. In 2016, 54% of the total railway length was already electrified ([
1], Section 2.5), thus we calculate the cost of electrifying the remaining 46%. According to ECMT ([
1], Section 2.5), the length of high-speed lines was 8,434 km, 7.2% of the length of the electrified lines in 2016. We assume that this proportion of high-speed lines, as well as the present proportions of single- and double-track lines, will remain stable in the future. All lines other than high-speed ones are assumed to be medium-speed.
In Spain, the cost of the electrification of high-speed (350 km/h) double-track railways was about one million EUR per km; with a speed of around 160 km/h (medium-speed), the cost of double-track lines is about 0.40 × 10
6 EUR per km [
36]. However, Gattuso and Restuccia [
37] report 0.7–1.2 million EUR for double-track lines, and 0.5–0.9 million EUR for the single-track ones. We consider 0.5 × 10
6, 0.7 × 10
6 and 1.2 × 10
6 EUR as median values for medium-speed single- and double-track lines, and high-speed double-track lines electrification, respectively.
The cost of the electrification of the EU railways (
cer) is estimated as:
where
l is the present length of lines in the EU;
f1 is the fraction of single-track lines; and
c1,
c2 and
c3 are the mean costs of single-track, double-track and high-speed double-track line electrification, respectively.
The number of tonnes-km and passenger-km “units” transported in the EU in 2016 was 450.1 × 10
9 and 403.6 × 10
9, respectively, resulting in a total of 853.7 × 10
9 units [
6,
38]. From [
39] and Chapter 2.6 of [
1] we estimate the number of diesel locomotives (
ndl) and diesel railcars (
ndr) in the EU-28 at approximately 16,629 and 13,478, respectively, and the total number of locomotives and railcars at 33,432 and 34,307, respectively. When the information was not available for 2016 for any country, we used the figure of the last year available; when no information was available, we assumed that the number of diesel locomotives (or railcars) was 46% of the total number. The number of passenger coaches and freight wagons in 2016 can also be estimated, from the same sources, at about 61,950 and 437,453, respectively.
We assume that diesel locomotives and diesel railcars will be fully replaced by new electric locomotives or electric railcars. The price of one electric locomotive (in M€) is about
W/3 +1 [
40] where
W is the output power (MW). Taking
W as 5.5 MW for an average locomotive, the result is 3.7 × 10
6 EUR (after inflation 2001–2016). For the cost of a typical electric railcar we take 2.7 × 10
6 EUR, the mean value between the price of a Stadler Regio-Shuttle RS1 (about 2.1 million EUR) and the price of an Alstom Minuetto (3.3 million EUR according to [
37]).
The manufacturing cost of the new rolling infrastructure (
cri) is estimated according to:
where
d is the EUR to USD conversion factor in 2016.
2.3.4. Air Transport
García-Olivares et al. [
21] estimated that the world aircraft fleet for 2033 would consist of 63,220 aircraft, divided into seven classes: 3,918 would be regional, with less than 100 seats; 45,055 “narrow-bodies” with 100–210 seats; 10,685 intermediate “wide-bodies”; 3,562 large wide-bodies; 600 small freighters; 1300 medium-freighters; and 1000 large freighters. We estimate the size of the EU-28 aircraft fleet assuming that the number of aircraft of a given class in the EU-28 is 26% of the number of the corresponding class in the world. This percentage corresponds to the size of the air bunkers of the EU-28 in comparison with the world air bunkers [
32,
33]. We estimate the cost of the EU-28 aircraft infrastructure assuming that 100% and 50% of all the projected demand for aircraft will be maintained in a future renewable transport system as in García-Olivares et al. [
21].
The embodied energy in the new aircraft fleet (
eca) is estimated as:
where
j is an index (from 1 to 7) specifying the type of aircraft,
nj is the number of aircrafts of class
j,
pj is the mean price of the aircraft of class
j, and
ij is the mean energy intensity of the industry in the countries where the class
j of aircraft is built.
2.3.5. Infrastructure for Gas Storage and Transport
We assume that the energy demand of the air and shipping sectors of the EU-28 in 2016 (see
Table 1) will have to be supplied as biogas in the future economy. Then, we apply the methodology of García-Olivares et al. [
21] to estimate the embodied energy in storage and gas infrastructure for a system of electric-trucks-based transportation at storage points with an average distance of 300 km and a storage time of seven days.
2.3.6. Electrical Charging System (Baseline Scenario)
To estimate the cost of the charging system for the vehicle fleet batteries, we consider two sub-scenarios: (i) a system of electric charging posts located on the town streets and main roads, and (ii) the deployment of a Tracked Electrical Vehicles (TEV) system [
41] of continuous power and charging on European roads.
- (i)
System of charging posts on streets and roads
In this sub-section, we introduce the methodology to calculate the costs of the posts required by (a) passenger vehicles, and (b) commercial vehicles.
- (a)
Posts for passenger vehicles
The mean distance travelled by car in towns and metropolitan regions in the EU (
cm) was about 12,000 km per person [
42], compared with 16,700 km in the USA [
43] and 3800 km per person as a world average in 2012 [
44]. A mid-range electric vehicle may have an autonomy of 125 km, consume about 15 kWh per 100 km [
45] and have a battery charging time of 1 hour with a medium power (22 kW) charger. However, making a conservative estimation, we take
a = 80 km per hour of charging, given that lower power chargers are also frequent for other kind of vehicles. Taking
of = 1.5 passengers per car as a typical “low occupation” figure [
46], we find that in the EU, the service demanded by one person would require a mean of 100 hours of charge per year.
A functional (efficient/practical) system with a small fraction
f of unoccupied posts would have to be accompanied by a mobile application that would indicate to the user the nearest empty recharging posts. The number of posts (
Np) needed for a municipality of
N people may be estimated as:
where 8760 is the number of hours per year. As an example, taking
f = 0.33 and with the EU average car mobility, the city of Barcelona (
N = 1.6
× 10
6 people; 102 km
2 of surface) would need 268 recharging posts per km
2. The average building block in the Eixample district of Barcelona, with the associated road lanes included, is 133.3 × 133.3 m. Thus, five posts per block would be required.
This is a conservative estimation that assumes that all the charge would be supplied by posts on the streets. In fact, Engel et al. [
47] report that currently in the EU-28, 75% of the charge of electric vehicles is made at home, and they project that home charging will be about 28–40% of the total after 2030, with 47–59% of the charge being made in public stations on the street, 9% at work places, and 4% at highway facilities during long-distance travels. Thus, the number of charging posts calculated by Equation (6) would probably be spatially distributed in a similar way, thus alleviating the occupation of the streets.
The price of a Wallbox [
48] recharging post of 22 kW is 1207 EUR per connection. Thus, the total cost of installing posts to satisfy the entire mobility demand (
cp1) is:
where
p is the EU’s population in 2016,
d is the conversion factor from EUR to USD,
hc is the number of hours of charging required by a typical driver of a car with low occupancy (1.5 persons per car), which is calculated as
hc = 12,000/(
a × 1.5), where
a is the autonomy per hour of charging and 12,000 corresponds to the number of kilometres travelled by car per capita in the EU.
- (b)
Posts for commercial vehicles
The number and energy consumption of commercial vehicles in the world is obtained from IEA [
49,
50] and Table 1 of García-Olivares et al. [
21]. The energy consumed per year for one vehicle of a given class (
ea1 to
ea4) can be obtained by dividing the corresponding values in column 2 and 3 of that table, and the results are 6.4 GJ (three-wheeler), 62.4 GJ (light vehicle), 231.5 GJ (medium-freight truck) and 619.2 GJ (high-freight truck). The power (
pp1 to
pp4) of the charging stations used by the four vehicle types is assumed to be 22 kW, 55 kW and 100 kW for three-wheelers and light vehicles, medium trucks and heavy trucks, respectively. The yearly accumulated charging time of each kind of vehicle (
tai) is calculated as:
where
i (1 to 4) represents the four types of vehicle,
cf is a factor to convert joules to kWh, and the other symbols are defined above.
Long charging times would probably affect the logistics of road transport, but it is difficult to predict if they would result in needing to add more vehicles to the fleet. In this study, we have assumed that transport logistics will be adapted so that commercial vehicles can be charged during the drivers’ sleep, rest and mealtimes.
The cost
cp2 of the recharging posts for commercial vehicles is calculated as:
where
f is the fraction of unoccupied charging posts (assumed to be 0.33), 8760 is the number of hours per year,
p is the average price of a single post,
ni is the number of vehicles of the kind
i, and
tai is calculated by Equation (8). The price
p is assumed to be that of the Modo-4 Raption Trio model of Wallbox [
48], 37,200 USD.
- (ii)
Cost of electrifying a road with the TEV system
Here we estimate the cost of electrifying a (dual carriageway) road with the TEV system on the EU roads. A system like this would have a set of advantages: (a) it would allow to reduce the number of long-range vehicles (probably powered by fuel cells); thus, fuel cells could be reserved for off-road vehicles; and (b) it would allow a decrease in vehicle battery size, saving on mineral utilization.
The length of motorways, national roads and total roads (including regional and secondary roads and highways and motorways) in the EU-28 is estimated at 74,341, 287,227 and 4,852,242 km, respectively [
51]. To estimate the building cost of one kilometre of this system we assume that the work is done on already existing roads. Thus, the cost should be similar to that of the electrification of a double-track railway of 150 km/h, i.e., 0.38 × 10
6 EUR of 2011 (459,000 USD of 2016) per km (
Section 3.4). Thus, the total cost of deploying the TEV system across the EU-28 (
ctev) can be estimated with the expression:
ctev = 459,000 ·
lr where
lr is the length of EU-28 roads.
2.3.7. Railways for the Entire Inland Transport System (All-Rail Scenario)
The number of units (passenger-km) transported in the EU-28 in 2016 by buses and coaches and passenger cars is taken as 552 and 4829.3 billion (10
9), respectively [
6]. The number of units of freight (tonnes-km) transported in the EU-28 in 2016 by road was 1852.3 billion [
38]. In total,
u2 = 7234 × 10
9 units should be transported, in addition to the units that will be transported by the currently non-electrified lines.
The new railway line length (
l2) required to supply such a service is estimated according to:
where
l is the present-day length of EU-28 railroads;
u2 and
u are the number of units transported by road and train in 2016, respectively; and 0.5 is the mean used capacity in 2016 of the EU-28 network. Here we assume that: (i) the present and future railway network will be able to allocate twice the number of units it transported in 2016 in a future high demand scenario, thus,
u must be subtracted from the units to be transported by new lines; and (ii) the remaining demand will be allocated to new railway infrastructure, whose length will expand proportionally to that demand. The factor 0.5 is based on Rotoli et al. [
52]. This reference shows that more than 90% of the EU network segments used less than 60% of their practical capacity, even with a conservative definition of practical capacity. In reality, most of the segments that seem to be saturated (mostly in Belgium) are not so when analysed on a small scale, or can reduce their used capacities to under 60% with minor investments. We consider a mean used capacity of 50% as a conservative estimation for the whole EU.
The cost of building new railway lines from scratch includes not only electrification (as considered before) but also platforms, rails and signalling and safety. A mean value for rails is 1.3 × 10
6 €/km [
36]. For signalling and safety, we take the upper range values reported by Gattuso and Restuccia [
37]: 0.5 × 10
6 and 1.0 × 10
6 €/km for single- and double-track, respectively. However, platform costs are very variable—from 4 to 20 million EUR depending on the terrain orography [
36]—because they include ground levelling, tunnels and viaducts. Estimating the fraction of the length
l2 that would pass through flat, intermediate and rugged terrain would involve a country-by-country engineering analysis which is beyond the scope of this study. Here we make a rough estimate. The EU-28 countries have been classified as “flat”, “intermediate” and “rugged” depending on their predominant orography. We consider as flat Sweden, Hungary, Poland, the Netherlands, Finland, Estonia, Latvia, Lithuania, Malta, Belgium, Luxembourg, Ireland, Denmark and the United Kingdom; we consider as intermediate France, Germany, Portugal, Cyprus, Romania, the Czech Republic and Slovakia; we consider as rugged Austria, Bulgaria, Slovenia, Spain, Croatia, Italy and Greece.
The rail track length in 2016 for flat, intermediate and rugged countries can be estimated from Figure 64 in [
35] as 36.5%, 43.4% and 20% of the total, respectively. We assume that these figures will be the future proportions of rails passing through flat, intermediate and rugged terrain. We take the cost of building platforms for double-track lines in these three kinds of terrains as 4, 10 and 20 million €/km (EUR of 2011), respectively. These values correspond to the two extreme values of the range reported by Ferropedia [
36] and to a median value of the range. For single-tracks, platforms are expected to cost 75% of the stated values [
37].
Thus, adding to it the cost of electrification, rails and signalling and safety, the mean cost of single-track lines is estimated (for the three kinds of terrain) at 5.6, 11 and 20 million USD; double-track lines is estimated at 8.8, 16.1 and 28.2 million USD, respectively. Ferropedia [
36] suggests cost values for high-speed in the three kinds of terrain: 13.8 M€/km (EUR of 2007), 19 M€/km (EUR of 2010) and 33.3 M€/km (EUR of 2007), which is equivalent to 18.1, 23.4, and 43.7 million USD, respectively.
Assuming that the customary and largest stations are already built, we consider that one small stop (or repair facility) is built every 10 km throughout the length of new double-track lines. Single-track lines are assumed to be used mainly for freight (long-distance) transport, and high-speed lines are intended to connect only large stations, both of them with no small stops. A mean cost for a small stop is 4 × 10
6 EUR [
37].
The total building cost (
cbr) of the railway lines is then estimated as:
where
cer is the cost of the electrification of the EU’s non-electrified railways, calculated by Equation (3);
l2 is the length of unbuilt lines;
wa, wb, wc are the fractions of flat, intermediate and rugged terrain, respectively;
caj, cbj, ccj is the building cost (USD per km) of lines of kind
j (
j = 1: single-track;
j = 2: double-track and speed 120–150 km/h;
j = 3: double-track and high-speed) on terrain of kind
a (flat),
b (intermediate) and
c (rugged), respectively.
The cost of locomotives, railcars, passenger coaches and freight wagons necessary to supply such service is calculated with the following expression:
where
cri is the cost of the electrification of the present diesel locomotives and railcars (calculated by Equation (4);
d is a conversion factor from EUR to USD;
u, u2 refer to the number of units transported by train and road, respectively, in 2016;
nl,
nrc, npc, nfw are the numbers (in 2016) of locomotives, railcars, passenger coaches and freight wagons, respectively;
cl, crc, cpc, cfw are the respective prices of these elements. Here we assume a doubling of the train utilization rate.
2.4. Energy Required to Run a 100% Renewable Transport System (Both Scenarios)
Here we estimate the annual energy that a 100% renewable transport system in the EU-28 would use and compare it with the energy used by the sector in 2016, using the same methodology as García-Olivares et al. [
21]. We use Table 1 of the aforementioned reference for the efficiencies of different motors and the efficiency of the electricity-to-methane process that are considered in the calculations.
The expression used to estimate the energy demand of rail transport is:
where
et is the energy required in 2016 by the railway transport sector of the EU-28;
ηele and
ηd are the efficiencies of electric (with overhead line) and diesel motors, respectively; and 0.54 and 0.46 are the fractions of electrified and non-electrified railways in the EU-28 (considered to be also the fractions of electric and non-electric locomotives).
An estimation was also made for the energy consumed by a rail transport system able to supply the whole land transport demand of the EU-28. The expression used is:
where
etr2 is the energy (J) consumed each year by the new renewable railway sector;
up, uw are the number of units (passenger-km or tonnes-km) of passengers or freight to be transported, respectively (estimated as 5.9 × 10
12 from [
6] and 2.3 × 10
12 from [
38]); and
εp, εw is the energy (J) consumed by an electric train per passenger or tonne transported, respectively (taken as 0.3 MJ/passenger-km and 0.45 MJ/tonnes-km, respectively, from [
16]).
For air transport, the EU is taking a comprehensive approach to reduce GHG emissions, pollution and noise. It is taking action in three areas: (i) funding research and development for the “greening of air transport” with the aim of reducing CO
2 emissions by 50% per passenger-km and NO
x by 80% within the Horizon 2020 programme; (ii) deployment of a more efficient air traffic management system in Europe with one of the objectives being to reduce emissions by 10% per flight; (iii) measures to adopt sustainable alternative fuels, which are formulated in terms of the standardized process by an international fuel specification committee [
53]. These alternative fuels follow along three general lines [
54]: (1) fuels from vegetable oils and animal fats, (2) Fischer–Tropsch fuels (biomass-to-liquid, BTL), (3) synthetic Isoparaffin fuels from the conversion of sugars. However, the majority of these processes require quality crops, which account for GHG emissions themselves and might compete with food production. In addition, the production of jet biofuels consumes a large amount of electricity (
Table 1). For these reasons, we consider the use of liquid biomethane the preferred option. We contemplate the production of jet fuels only as an auxiliary and temporary measure to alleviate the transition to a carbon-free economy.
4. Discussion and Conclusions
In this work we analysed the energy costs required to transform the fossil-fuel-based EU transportation system to a new one based on renewable energy sources. The baseline scenario considers the substitution of the current road, railway, air and ship fleets. Together with the fleet substitution, we consider the cost of the basic infrastructures needed to keep the system operative. In the baseline scenario with recharging posts, the (primary) embodied energy required for the new transport system is 25,907 PJ in the best case, 84% for vehicles, 7.7% for airplanes, 3.5% for ships, 2.6% for electrification of railways, 2.2% for recharging posts, and 0.2% for gas storage. This primary energy is approximately 50% of the final energy consumed in 2016 by all sectors [
33] and 164% of the final energy used by the transport sector in 2016. If the transition took place in 30 years, the annual energy that should be invested would be around 1.7% of the annual final energy (5.6% the annual energy required by the transport sector). In the baseline scenario with TEV system for all EU roads, these figures would be 61% of the final energy of 2016 and an investment of 2% of final energy of 2016 per year.
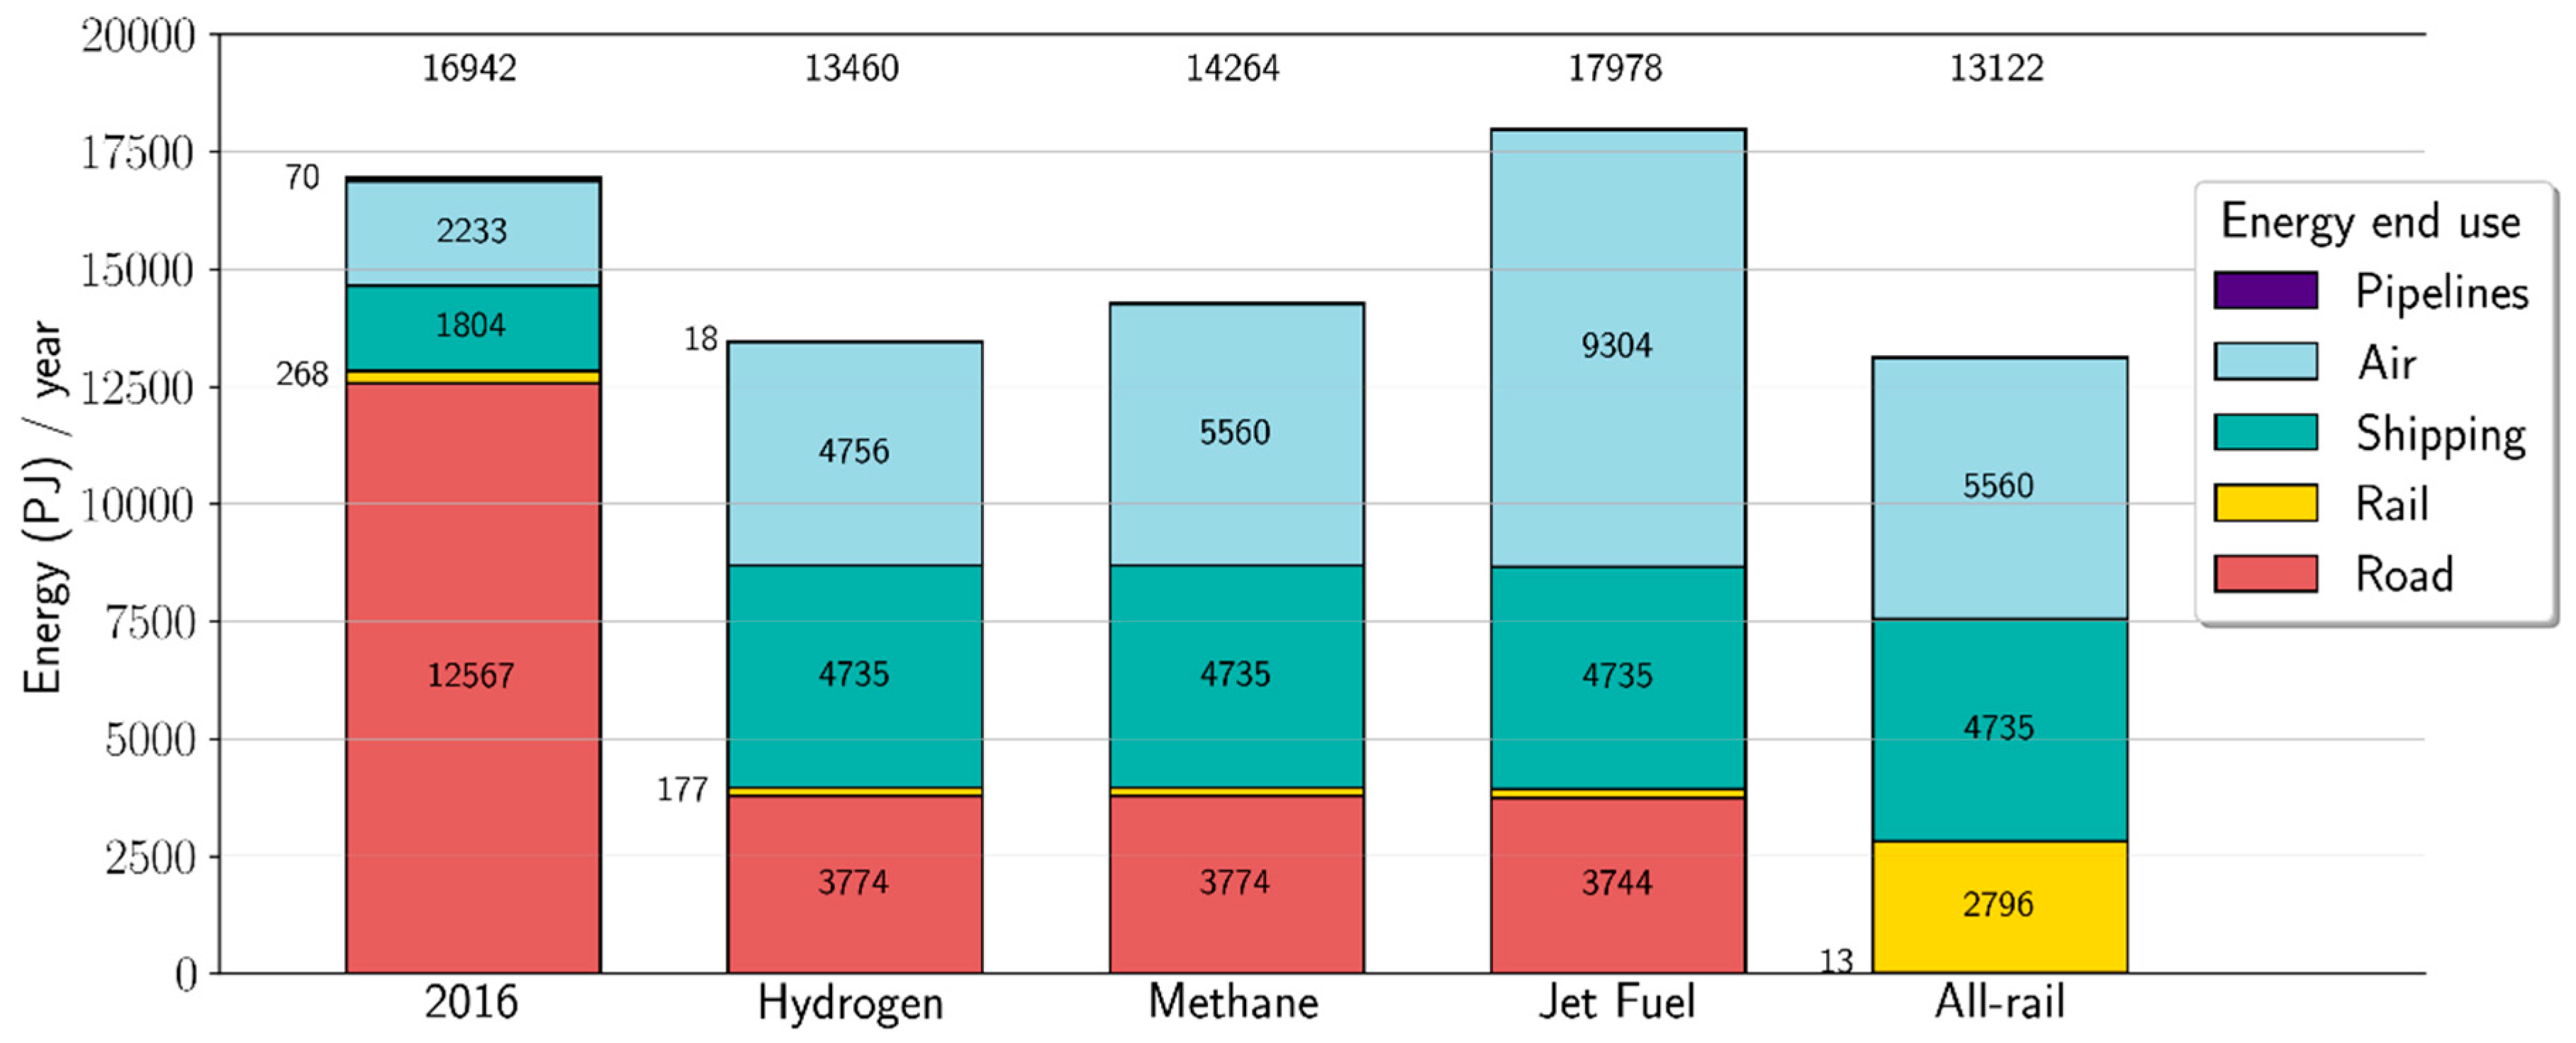
Table 1 shows that the energy demanded for road, rail and fuel transport are lower in the renewable economy, but increases more than two times for shipping and air transport. The energy cost of the whole transportation system depends strongly on the fuel used for aircraft, revealing the importance of the strategy taken for the air transport sector as a way to achieve sustainability. The figures in
Table 1 show how the energy consumed for all transport modes (except air and ship transport) would save energy after conversion to electricity that can be used to supply the costs for infrastructure changes.
As
Table 1 shows, a 100% renewable transport system providing the same service as EU transport in 2016 would consume around 16% less energy. This saving is achieved by the transformation of road transport (70%), due to the higher efficiency of battery motors in relation to combustion engines, and to a scant number of fuel cell vehicles (assumed to be only 10% of commercial vehicles). The total consumption of land transport would be 3951.4 PJ. However, if train transport and two- and three-wheelers were encouraged to supply the entire land transportation demand, this figure would be 2808.6 PJ (12.6 PJ of these being consumed by electric two- and three-wheelers). This would supply the same service with 71% of the energy consumption and with no need to maintain a massive traffic system.
Taking as a reference the EU-28 GDP of 14,800 billion USD (USD of 2016) in 2016 [
55], in the baseline scenario with charging posts (
Table 2), the required new infrastructure would cost 68–71% of the GDP of the EU-28 in 2016. Over a period of 30 years, the rate of investment should be 2.3–2.4% of the GDP per year if the infrastructure replacement were homogeneous. In reality, the replacement would not be uniform over time, but would increase in the moments when important fractions of the current infrastructure ended their useful life. The total annual investment would be 333 billion USD in the scenario with charging posts, and 400 billion USD per year in the scenario with electrification of all roads. This range is similar to the one estimated by Ram et al. [
10] for their scenario of transport transition in Europe: 300–350 billion EUR (342–399 billion USD) per year during the transition. These costs might not all be government investments. Private and corporate spending might be part of this investment effort within a shared transition plan.
Regarding land transport, if a TEV system were implemented for all the national roads in the EU-28, the investment would be 132 billion USD, which is 57% of the charging station systems’ minimum cost. However, if all the roads in the EU-28 had to be electrified, its capital investment would be 2228 billion USD, which is 3–10 times the cost of charging stations. In this case, the total investment for the transport system would be 12,071 billion USD and the investment rate would amount to 2.7% of the GDP per year. Taking into account the fact that EU capital formation was 19.7% of GDP in 2016 [
56], such an investment seems achievable, although it needs to be linked to a similar investment in renewable production infrastructure.
In 2016, the EU and five cooperating countries (33 countries) invested 116 billion USD in transport infrastructure [
57]. Compared to this figure, the investment in gas infrastructure plus charging posts would amount to 7–19%, and the investment in gas infrastructure plus a TEV system for all EU-28 roads would cost 65% of that figure. Electrification of the whole road network seems to be a feasible option and would avoid the issue of a possible increase in scarce minerals used in batteries (which may be a bottleneck for the option of battery vehicles plus charging posts). A combination of charging posts and a TEV system for selected roads only is also possible. These two options can be combined with car sharing, which has the potential to reduce the fleet size to 7% of the present one [
58] and would avoid problems for the middle class in buying electric vehicles, which are relatively expensive.
If we consider the all-rail scenario (substituting road transport with electrified trains) a complete substitution of the non-electrified land passenger and freight transport in the EU-28 would cost 13,909 billion USD (with an energy investment of 34,744 PJ). Thus, this transport fully based on trains would cost (both in monetary units and energy units) 1.5–1.6 times the cost of a future fleet of road vehicles of the same size as the present one, in addition to its electric recharging system (1.3 times the cost of that fleet with a TEV system for all of the EU-28 roads). To implement it, the rate of investment should be 3.4% of the GDP of the EU-28 for 30 years. The required investment in railways, in USD per year, would be four times the investment in transport infrastructure of 2016, for 30 years. Although it would require economic effort, the scenario seems feasible with the present (moderate) percentage of high-speed lines, and then the re-structuring of land transport would reduce accidents, pollution, congestion in cities and the poor quality of life that the current traffic system generates.
It should be noted that a global fleet of vehicles as large as the present one would require a system of charging posts in towns which would not eliminate car congestion in our cities; moreover, that large fleet would cause a high price increase in nickel and lithium minerals, as 33% and 48% of the present reserves of Li and Ni, respectively, would be used in the vehicles’ batteries [
21]. A great saving in scarce materials would be achieved if future EU roads had a ground-level (or overhead) line for power supply in both directions. A major substitution of long-distance truck commercial transport with railway transport would also solve the aforementioned problems, albeit at a higher investment cost.
Consistent with our analysis, a type of energy-efficient and quality land transport should ideally be based on electric trains for freight and passenger transport between cities, fleets of two- and three-wheeled electric vehicles as a minor complement to public transportation in municipalities, and electric vehicles for short-distance transport between cities and villages without trains. In this ideal scenario, traffic would greatly reduce and a modest infrastructure of charging posts would be sufficient. To implement it, the investment in transport infrastructure should be increased by a factor of 4 compared to the value of 2016, for a period of 30 years.
In the baseline scenario, the shipping and air sectors would greatly increase their energy demand: by 162% and 149%, respectively (
Table 1). This is because of the need to produce liquid natural gas to power the engines of planes and vessels. In a 100% RES, this would be made from electrolytic hydrogen (and CO
2) or from urban and crop waste biodigestion.
These results, as well as other estimates [
12], suggest large price increases and, in consequence, a decrease in maritime and air transport, which may lead to the relocation of some economic activities.
Energy cost is about 12% of the production cost of air transportation [
59,
60]. The ratio
β between future and present cost can be estimated from the corresponding ratio between the last two columns of
Table 1, and then a ratio between future and present final price can be obtained (
Appendix A). If LNG were the fuel used,
β = 2.49 and
P’/P would be 1.18. If jet biofuel were the fuel used,
β = 4.17 and
P’/P would be 1.38.
If we assume that the elasticity of demand for leisure flights is similar in EU-28 than in the US, about −1.6 [
61], we can expect a drop in demand by 29% (LNG) to 61% (jet biofuel) owing to purely economic reasons only.
To obtain an upper bound estimate of the embodied energy in a world transport transition, we repeated the calculations made in García-Olivares et al. [
21] but with the embodied energy per USD used in this study. The results are displayed in
Table A1 of
Appendix B.
The embodied energy of a substitution of the whole world transport would amount to 149–158 EJ for the scenario with charging points, and 257 EJ for the scenario with a TEV system on all roads in the world. Even with our pessimistic hypothesis, a 30-year transition for the world baseline scenario would require only 4.8% of the energy demanded per year for the transport sector [
32], which seems to be an achievable goal.
The assumptions made in this analysis do not consider major changes in the markets for raw materials on the demand side, which would also (likely) exceed current production capacity by a considerable margin and result in price increases. However, it may lead to a lowering of prices as production capacity has been ramped up and made more efficient, and cheaper alternatives to costly raw materials have been developed. This will affect the capital and energy required for the transition. It should also be mentioned that such changes in price will strongly depend on the policies applied by governments, which will allow them to regulate the pace of the transition, as well as the consumption rate of raw materials in the EU and also in the world as a whole. Detailed analysis of such factors and their implications is out of the scope of our study, and it would require the use of modelling tools to account, for instance, for the non-linear links between market fluctuation, raw material production and the pace of the transition.
This study could be expanded to analyse the costs that would be required for the renewable conversion of the vehicles, ships and aircrafts of the EU army. This transition would be very different for different geopolitical scenarios that we can imagine for a future renewable European economy integrated into the global economy. Thus, we prefer to leave that analysis for a future article.
One last conclusion of this study is that (both for the EU and the world) the substitution of land transport would save a greater amount of fossil energy (and therefore, CO2) per unit of investment and should be addressed initially, while air and ship transport system substitution could be the last steps of the transition.


