Do Personal Norms Predict Citizens’ Acceptance of Green Transport Policies in China


Abstract
:1. Introduction
2. Literature Review and Hypotheses Development
2.1. Green Transport Policies
2.2. Value Belief Norm Theory
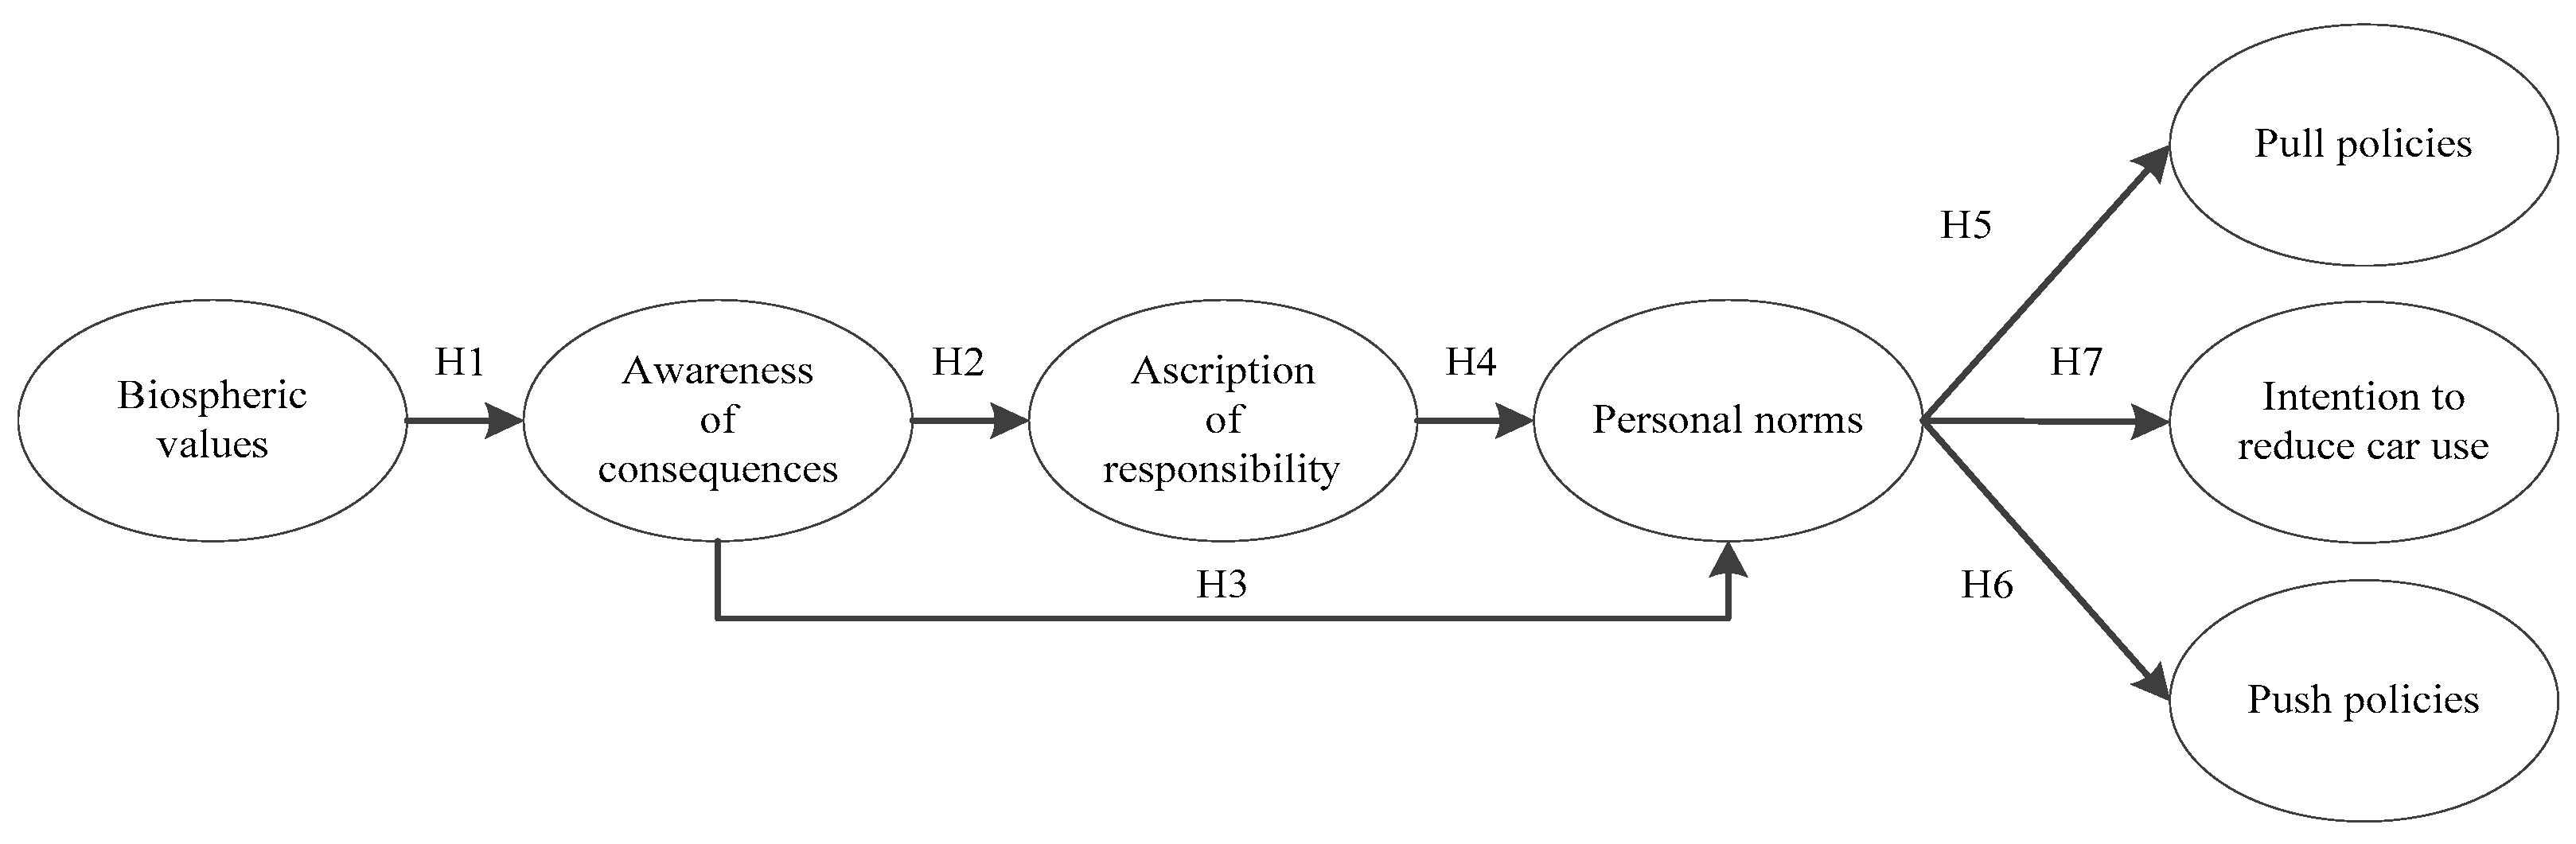
2.3. Framework and Hypotheses
3. Methodology
3.1. Data Collection
3.2. Structural Equation Model
3.3. Measurement Model Design
4. Data Analysis
4.1. Measurement Model Analysis
4.2. Common Method Variance
4.3. Hypotheses Testing
5. Discussion and Conclusions
5.1. Discussion of Findings
5.2. Conclusions
5.3. Implications and Future Research
Author Contributions
Funding
Conflicts of Interest
Ethical Standard
Appendix A

| Constructs | Items | References |
|---|---|---|
| Biospheric values (BV) | BV1: Preventing pollution. BV2: Respecting the earth (living in harmony with other species). BV3: Unity with nature (fitting into nature). BV4: Protecting the environment (preserving nature). | Stern et al. [43] |
| Awareness of consequences (AC) | AC1: Emissions from motor vehicles can lead to air pollution. AC2: The exhaustion of fossil fuels is a social problem. AC3: Global warming is a social problem. | Steg et al. [12] |
| Ascription of responsibility (AR) | AR1: I feel jointly responsible for the traffic congestion. AR2: I feel jointly responsible for reducing air pollution. AR3: I feel jointly responsible for the energy problems. AR4: I feel jointly responsible for the global warming. | Steg et al. [12] |
| Personal norms (PN) | PN1: I feel morally obliged to use green transport instead of a car. PN2: If I would buy a new car, I would feel morally obliged to buy an energy-saving one. PN3: People like me should do everything they can to reduce car use. PN4: I feel obliged to bear the environment and nature in mind in my daily behavior. PN5: I would be a better person if I protected our environment. | Keizer et al. [22]; Ünal et al. [32] |
| Pull policies (PL) | PL1: Do you support government to subside for encouraging citizens to use public transport? PL2: Do you support government to advocate green public buses? PL3: Do you support government to promote new energy vehicles with monetary and nonmonetary incentive measures? PL4: Do you support government to give public bus priority to use the bus lane? PL5: Do you support government to improve public transport facilities? PL6: Do you support government to campaign for green transport? | Wicki et al. [25] |
| Push policies (PS) | PS1: Do you support government taxes on fossil fuel? PS2: Do you support government taxes on purchasing motor vehicles? PS3: Do you support government road toll charges? PS4: Do you support restrictions on car use in the city downtown? PS5: Do you support restrictions on new car license? PS6: Do you support the increase of parking fees in the city downtown? | Nordfjærn and Rundmo, [8] |
| Intention to reduce car use (IN) | IN1: It is possible for me to reduce car use in the next year. IN2: I could reduce car use in the next year. IN3: I intend to use green transport more frequently. IN4: I will encourage people around me to choose green transport as much as possible. | Abrahamse et al., [44]; Kang et al. [45] |
References
- Ministry of Public Security of the People’s Republic of China. The Number of Car Ownership in China had Exceeded 200 Million for the First Time in 2018. Available online: https://www.mps.gov.cn/ (accessed on 12 January 2019).
- Statistics Bureau of Hangzhou. Hangzhou Statistical Yearbook 2019. Available online: http://www.hangzhou.gov.cn/ (accessed on 23 October 2019).
- Statistics Bureau of Hangzhou. Hangzhou Municipal Statistical Bulletin on National Economic and Social Development 2009. Available online: http://www.hangzhou.gov.cn/ (accessed on 1 February 2010).
- Jansson, J.; Rezvani, Z. Public responses to an environmental transport policy in Sweden: Differentiating between acceptance and support for conventional and alternative fuel vehicles. Energy Res. Soc. Sci. 2019, 48, 13–21. [Google Scholar] [CrossRef]
- Wu, J.W.; Liao, H.; Wang, J.W.; Chen, T.Q. The role of environmental concern in the public acceptance of autonomous electric vehicles: A survey from China. Transp. Res. Part F Traffic Psychol. Behav. 2019, 60, 37–46. [Google Scholar] [CrossRef]
- Xu, Y.L.; Zhang, W.Y.; Bao, H.J.; Zhang, S.; Xiang, Y. A SEM-neural network approach to predict customers’ intention to purchase battery electric vehicles in China’s Zhejiang province. Sustainability 2019, 11, 3164. [Google Scholar] [CrossRef] [Green Version]
- Brand, C.; Anable, J.; Tran, M. Accelerating the transformation to a low carbon passenger transport system: The role of car purchase taxes, feebates, road taxes and scrappage incentives in the UK. Transp. Res. Part A Policy Pract. 2013, 49, 132–148. [Google Scholar] [CrossRef]
- Nordfjærn, T.; Rundmo, T. Environmental norms, transport priorities and resistance to change associated with acceptance of push measures in transport. Transp. Policy 2015, 44, 1–8. [Google Scholar] [CrossRef]
- Mei, Z.Y.; Lou, Q.F.; Zhang, W.; Zhang, L.H.; Shi, F. Modelling the effects of parking charge and supply policy using system dynamics method. J. Adv. Transp. 2017. [Google Scholar] [CrossRef] [Green Version]
- Pu, Y.C.; Yang, C.; Liu, H.B.; Chen, Z.; Chen, A. Impact of license plate restriction policy on emission reduction in Hangzhou using a bottom-up approach. Transp. Res. Part D Trans. Environ. 2015, 34, 281–292. [Google Scholar] [CrossRef]
- Stern, P.C. New environmental theories: Toward a coherent theory of environmentally significant behavior. J. Soc. Issues 2000, 56, 407–424. [Google Scholar] [CrossRef]
- Steg, L.; Dreijerink, L.; Abrahamse, W. Factors influencing the acceptability of energy policies: A test of VBN theory. J. Environ. Psychol. 2005, 25, 415–425. [Google Scholar] [CrossRef]
- Fornara, F.; Pattitoni, P.; Mura, M.; Strazzera, E. Predicting intention to improve household energy efficiency: The role of value-belief-norm theory, normative and informational influence, and specific attitude. J. Environ. Psychol. 2016, 45, 1–10. [Google Scholar] [CrossRef]
- Gärling, T.; Schuitema, G. Travel demand management targeting reduced private car use: Effectiveness, public acceptability and political feasibility. J. Soc. Issues 2007, 63, 139–153. [Google Scholar] [CrossRef]
- Schmitz, S.; Becker, S.; Weiand, L.; Niehoff, N.; Schwartzbach, F.; Schneidemesser, E. Determinants of public acceptance for traffic-reducing policies to improve urban air quality. Sustainability 2019, 11, 3991. [Google Scholar] [CrossRef] [Green Version]
- Sugiarto, S.; Miwa, T.; Morikawa, T. The tendency of public’s attitudes to evaluate urban congestion charging policy in Asian megacity perspective: Case a study in Jakarta, Indonesia. Case Stud. Transp. Policy 2020, 8, 143–152. [Google Scholar] [CrossRef]
- Soto, J.J.; Cantillo, V.; Arellana, J. Incentivizing alternative fuel vehicles: The influence of transport policies, attitudes and perceptions. Transportation 2018, 45, 1721–1753. [Google Scholar] [CrossRef]
- Agrawal, A.W.; Dill, J.; Nixon, H. Green transportation taxes and fees: A survey of public preferences in California. Transp. Res. Part D Transp. Environ. 2010, 15, 189–196. [Google Scholar] [CrossRef]
- Domenico, G.; Carla, C.G.; Margherita, M. Integrated urban regeneration policy and soft mobility planning for transport energy-saving. Instrum. Mes. Metrol. 2018, 17, 527–547. [Google Scholar]
- Nocera, S.; Cavallaro, F. Policy effectiveness for containing CO2 emissions in transportation. Procedia Soc. Behav. Sci. 2011, 20, 703–713. [Google Scholar] [CrossRef] [Green Version]
- Letnik, T.; Marksel, M.; Luppino, G.; Bardi, A.; Božičnik, S. Review of policies and measures for sustainable and energy efficient urban transport. Energy 2018, 163, 245–257. [Google Scholar] [CrossRef]
- Keizer, M.; Sargisson, R.J.; Zomeren, M.; Steg, L. When personal norms predict the acceptability of push and pull car-reduction policies: Testing the ABC model and low-cost hypothesis. Transp. Res. Part F Traffic Psychol. Behav. 2019, 64, 413–423. [Google Scholar] [CrossRef]
- Wang, S.; Wang, J.; Yang, F. From willingness to action: Do push-pull-mooring factors matter for shifting to green transportation? Transp. Res. Part D Transp. Environ. 2020, 79, 102242. [Google Scholar] [CrossRef]
- Groot, J.I.M.D.; Schuitema, G. How to make the unpopular popular? Policy characteristics, social norms and the acceptability of environmental policies. Environ. Sci. Policy 2012, 19, 100–107. [Google Scholar] [CrossRef]
- Wicki, M.; Fesenfeld, L.; Bernauer, T. In search of politically feasible policy-packages for sustainable passenger transport: Insights from choice experiments in China, Germany, and the USA. Environ. Res. Lett. 2019, 14, 084048. [Google Scholar] [CrossRef]
- Schwartz, S.H. Normative influences on altruism. Adv. Exp. Soc. Psychol. 1977, 10, 221–279. [Google Scholar]
- Shin, Y.H.; Im, J.; Jung, S.E.; Severt, K. The theory of planned behavior and the norm activation model approach to consumer behavior regarding organic menus. Int. J. Hosp. Manag. 2018, 69, 21–29. [Google Scholar] [CrossRef]
- Gkargkavouzi, A.; Halkos, G.; Matsiori, S. Environmental behavior in a private-sphere context: Integrating theories of planned behavior and value belief norm, self-identity and habit. Resour. Conserv. Recycl. 2019, 148, 145–156. [Google Scholar] [CrossRef]
- Youn, H.; Yin, R.; Kim, J.; Li, J.J. Examining traditional restaurant diners’ intention: An application of the VBN theory. Int. J. Hosp. Manag. 2020, 85, 102360. [Google Scholar] [CrossRef]
- Onel, N.; Mukherjee, A. Why do consumers recycle? A holistic perspective encompassing moral considerations, affective responses, and self-interest motives. Psychol. Mark. 2017, 34, 956–971. [Google Scholar] [CrossRef]
- Eriksson, L.; Garvill, J.; Nordlund, A.M. Acceptability of travel demand management measures: The importance of problem awareness, personal norm, freedom, and fairness. J. Environ. Psychol. 2006, 26, 15–26. [Google Scholar] [CrossRef]
- Ünal, A.B.; Steg, L.; Granskaya, J. “To support or not to support, that is the question”. Testing the VBN theory in predicting support for car use reduction policies in Russia. Transp. Res. Part A Policy Pract. 2019, 119, 73–81. [Google Scholar] [CrossRef]
- Hair, J.F.; Sarstedt, M.; Pieper, T.M.; Ringle, C.M. The use of partial least squares structural equation modeling in strategic management research: A review of past practices and recommendations for future applications. Long Range Plan. 2012, 45, 320–340. [Google Scholar] [CrossRef]
- Zhang, L.B.; Fan, Y.L.; Zhang, W.Y.; Zhang, S. Extending the theory of planned behavior to explain the effects of cognitive factors across different kinds of green products. Sustainability 2019, 11, 4222. [Google Scholar] [CrossRef] [Green Version]
- Sapra, R.L. Power and sample size estimation for interim analysis using PASS. Curr. Med. Res. Pract. 2017, 7, 24–28. [Google Scholar] [CrossRef]
- Hahn, G.J.; Meeker, W.Q. Statistical Intervals: A Guide for Practitioners; John Wiley and Sons, Inc.: New York, NY, USA, 1991. [Google Scholar]
- Lomax, R.G.; Schumacker, R.E. A Beginner’s Guide to Structural Equation Modeling; Lawrence Erlbaum Associates Publishers: Mahwah, NJ, USA, 2004. [Google Scholar]
- Hair, J.F.; Hult, G.T.M.; Ringle, C.; Sarstedt, M. A Primer on Partial Least Squares Structural Equation Modeling (PLS-SEM); Sage Publications Limited Inc: London, UK, 2017. [Google Scholar]
- Palos-Sanchez, P.; Saura, J.R.; Martin-Velicia, F. A study of the effects of programmatic advertising on users’ concerns about privacy overtime. J. Bus. Res. 2019, 96, 61–72. [Google Scholar] [CrossRef]
- Thatcher, J.B.; Perrewé, P.L. An empirical examination of individual traits as antecedents to computer anxiety and computer self-efficacy. MIS Quart. 2002, 26, 381–396. [Google Scholar] [CrossRef] [Green Version]
- Wold, H. Soft modelling by latent variables: The non-linear iterative partial least squares (NIPALS) approach. J. Appl. Probab. 1975, 12, 117–142. [Google Scholar] [CrossRef]
- Burke, J.C.; Mackenzie, S.B.; Podsakoff, P.M. A critical review of construct indicators and measurement model misspecification in marketing and consumer research. J. Consum. Res. 2003, 30, 199–218. [Google Scholar]
- Stern, P.C.; Thomas, D.; Guagnano, G.A. A brief inventory of values. Educ. Psychol. Meas. 1998, 58, 984–1001. [Google Scholar] [CrossRef]
- Abrahamse, W.; Steg, L.; Gifford, R.; Vlek, C. Factors influencing car use for commuting and the intention to reduce it: A question of self-interest or morality? Transp. Res. Part F Traffic Psychol. Behav. 2009, 12, 317–324. [Google Scholar] [CrossRef]
- Kang, A.S.; Jayaraman, K.; Soh, K.; Wong, W.P. Convenience, flexible service, and commute impedance as the predictors of drivers’ intention to switch and behavioral readiness to use public transport. Transp. Res. Part F Traffic Psychol. Behav. 2019, 62, 505–519. [Google Scholar] [CrossRef]
- Hair, J.F.; Black, W.C.; Babin, B.J.; Anderson, R.E.; Tatham, R.L. Multivariate Data Analysis; Pearson University Press: Upper Saddle River, NJ, USA, 2006. [Google Scholar]
- Cronbach, L. Coefficient alpha and the internal structure of tests. Psychometrika 1951, 16, 297–334. [Google Scholar] [CrossRef] [Green Version]
- Hair, J.F.; Risher, J.J.; Sarstedt, M.; Ringle, C.M. When to use and how to report the results of PLS-SEM. Eur. Bus. Rev. 2019, 31, 2–24. [Google Scholar] [CrossRef]
- Fornell, C.; Larcker, D.F. Evaluating structural equation models with unobservable variables and measurement error. J. Mark. Res. 1981, 18, 39–50. [Google Scholar] [CrossRef]
- Henseler, J.; Ringle, C.M.; Sarstedt, M. A new criterion for assessing discriminant validity in variance-based structural equation modeling. J. Acad. Mark. Sci. 2014, 43, 115–135. [Google Scholar] [CrossRef] [Green Version]
- Podsakoff, P.M.; MacKenzie, S.B.; Lee, J.Y.; Podsakoff, N.P. Common method biases in behavioral research: A critical review of the literature and recommended remedies. J. Appl. Psychol. 2003, 88, 879–903. [Google Scholar] [CrossRef] [PubMed]
- Liang, H.G.; Saraf, N.; Hu, Q.; Xue, Y.J. Assimilation of enterprise systems: The effect of institutional pressures and the mediating role of top management. MIS Quart. 2007, 31, 59–87. [Google Scholar] [CrossRef]
- Guagnano, G.A.; Stern, P.C.; Dietz, T. Influences on attitude-behavior relationships: A natural experiment with curbside recycling. Environ. Behav. 1995, 27, 699–718. [Google Scholar] [CrossRef]
- Diekmann, A.; Preisendörfer, P. Green and greenback: The behavioral effects of environmental attitudes in low-cost and high-cost situations. Ration. Soc. 2003, 15, 441–472. [Google Scholar] [CrossRef]
- Hoy, K.N.; Solecka, K.; Szarata, A. The application of the multiple criteria decision aid to assess transport policy measures focusing on innovation. Sustainability 2019, 11, 1472. [Google Scholar]
- Huber, R.A.; Wicki, M.L.; Bernauer, T. Public support for environmental policy depends on beliefs concerning effectiveness, intrusiveness, and fairness. Environ. Politics 2019. [Google Scholar] [CrossRef]
- Wang, R. Shaping urban transport policies in China: Will copying foreign policies work? Transp. Policy 2010, 17, 147–152. [Google Scholar] [CrossRef]
| Participants’ Characteristics | Categories | Quantity (n = 315) | Percentage (%) |
|---|---|---|---|
| Gender | Male Female | 131 184 | 41.59 58.41 |
| Age | Under 18 18–29 30–44 45–59 60 and above | 5 113 150 38 9 | 1.59 35.87 47.62 12.06 2.86 |
| Family size | 1 people 2 people 3 people 4 people 5 people | 8 35 103 70 99 | 2.54 11.11 32.70 22.22 31.43 |
| Education level | Junior school or below High school College Master Doctor | 6 43 155 99 12 | 1.90 13.65 49.21 31.43 3.81 |
| Annual family income | Under CNY100,000 CNY100,000–299,999 CNY300,000–499,999 CNY500,000–699,999 CNY700,000 and above | 69 137 72 20 17 | 21.90 43.49 22.86 6.34 5.40 |
| Items | Questions |
|---|---|
| PL1 | Do you support government to subside for encouraging citizens to use public transport? |
| PL2 | Do you support government to advocate green public buses? |
| PL3 | Do you support government to promote new energy vehicles with monetary and nonmonetary incentive measures? |
| PL4 | Do you support government to give public bus priority to use the bus lane? |
| PL5 | Do you support government to improve public transport facilities? |
| PL6 | Do you support government to campaign for green transport? |
| PS1 | Do you support government taxes on fossil fuel? |
| PS2 | Do you support government taxes on purchasing motor vehicles? |
| PS3 | Do you support government road toll charges? |
| PS4 | Do you support restrictions on car use in the city downtown? |
| PS5 | Do you support restrictions on new car license? |
| PS6 | Do you support the increase of parking fees in the city downtown? |
| Constructs | Factor Loadings | Cronbach’s α | CR | AVE |
|---|---|---|---|---|
| Biospheric values (BV) | 0.876–0.917 | 0.918 | 0.942 | 0.803 |
| Awareness of consequences (AC) | 0.854–0.895 | 0.841 | 0.904 | 0.759 |
| Ascription of responsibility (AR) | 0.761–0.922 | 0.894 | 0.927 | 0.761 |
| Personal norms (PN) | 0.788–0.846 | 0.865 | 0.902 | 0.649 |
| Pull policies (PL) | 0.733–0.883 | 0.895 | 0.920 | 0.658 |
| Push policies (PS) | 0.780–0.845 | 0.906 | 0.926 | 0.677 |
| Intention to reduce car use (IN) | 0.828–0.907 | 0.899 | 0.929 | 0.765 |
| Constructs | AC | AR | BV | IN | PL | PN | PS |
|---|---|---|---|---|---|---|---|
| Awareness of consequences (AC) | 0.871 | ||||||
| Ascription of responsibility (AR) | 0.445 | 0.872 | |||||
| Biospheric values (BV) | 0.492 | 0.479 | 0.896 | ||||
| Intention to reduce car use (IN) | 0.440 | 0.412 | 0.380 | 0.874 | |||
| Pull policies (PL) | 0.540 | 0.476 | 0.555 | 0.610 | 0.811 | ||
| Personal norms (PN) | 0.578 | 0.586 | 0.539 | 0.637 | 0.661 | 0.806 | |
| Push policies (PS) | 0.438 | 0.355 | 0.262 | 0.503 | 0.330 | 0.428 | 0.823 |
| Constructs | Items | Substantive Factor Loading(R1) | R12 | Method Factor Loading(R2) | R22 |
|---|---|---|---|---|---|
| Awareness of consequences (AC) | AC1 | 0.8600 *** | 0.7396 | 0.1060 | 0.0112 |
| AC2 | 0.8990 *** | 0.8082 | 0.0050 | 0.0000 | |
| AC3 | 0.8540 *** | 0.7293 | 0.0410 | 0.0017 | |
| Ascription of responsibility (AR) | AR1 | 0.7740 *** | 0.5991 | 0.0640 | 0.0041 |
| AR2 | 0.8710 *** | 0.7586 | −0.0200 | 0.0004 | |
| AR3 | 0.9190 *** | 0.8446 | 0.0030 | 0.0000 | |
| AR4 | 0.9190 *** | 0.8446 | −0.0830 | 0.0069 | |
| Biospheric values (BV) | BV1 | 0.8800 *** | 0.7744 | 0.0300 | 0.0009 |
| BV2 | 0.9080 *** | 0.8245 | 0.0840 | 0.0071 | |
| BV3 | 0.8770 *** | 0.7691 | −0.0070 | 0.0000 | |
| BV4 | 0.9200 *** | 0.8464 | 0.0360 | 0.0013 | |
| Intention to reduce car use (IN) | IN1 | 0.8510 *** | 0.7242 | −0.0160 | 0.0003 |
| IN2 | 0.9010 *** | 0.8118 | 0.2440 | 0.0595 | |
| IN3 | 0.8980 *** | 0.8064 | −0.0340 | 0.0012 | |
| IN4 | 0.8520 *** | 0.7259 | −0.3440 ** | 0.1183 | |
| Pull policies (PL) | PL1 | 0.8190 *** | 0.6708 | 0.0890 | 0.0079 |
| PL2 | 0.8780 *** | 0.7709 | 0.0080 | 0.0001 | |
| PL3 | 0.7280 *** | 0.5300 | 0.0420 ** | 0.0018 | |
| PL4 | 0.8130 *** | 0.6610 | −0.1890 | 0.0357 | |
| PL5 | 0.7510 *** | 0.5640 | 0.1590 *** | 0.0253 | |
| PL6 | 0.8700 *** | 0.7569 | 0.0600 | 0.0036 | |
| Personal norms (PN) | PN1 | 0.8420 *** | 0.7090 | −0.0750 | 0.0056 |
| PN2 | 0.8090 *** | 0.6545 | −0.0320 | 0.0010 | |
| PN3 | 0.7870 *** | 0.6194 | −0.1540 | 0.0237 | |
| PN4 | 0.7960 *** | 0.6336 | −0.1530 | 0.0234 | |
| PN5 | 0.7930 *** | 0.6288 | 0.2170 | 0.0471 | |
| Push policies (PS) | PS1 | 0.8550 *** | 0.7310 | −0.0560 | 0.0031 |
| PS2 | 0.8450 *** | 0.7140 | 0.0400 | 0.0016 | |
| PS3 | 0.8450 *** | 0.7140 | −0.0450 *** | 0.0020 | |
| PS4 | 0.7870 *** | 0.6194 | 0.0060 | 0.0000 | |
| PS5 | 0.8160 *** | 0.6659 | −0.1160 | 0.0135 | |
| PS6 | 0.8010 *** | 0.6416 | 0.0530 | 0.0028 | |
| Average | 0.8443 | 0.7154 | −0.0012 | 0.0128 |
| Paths | Sample Mean | Standard Deviation | T Statistics | p Values |
|---|---|---|---|---|
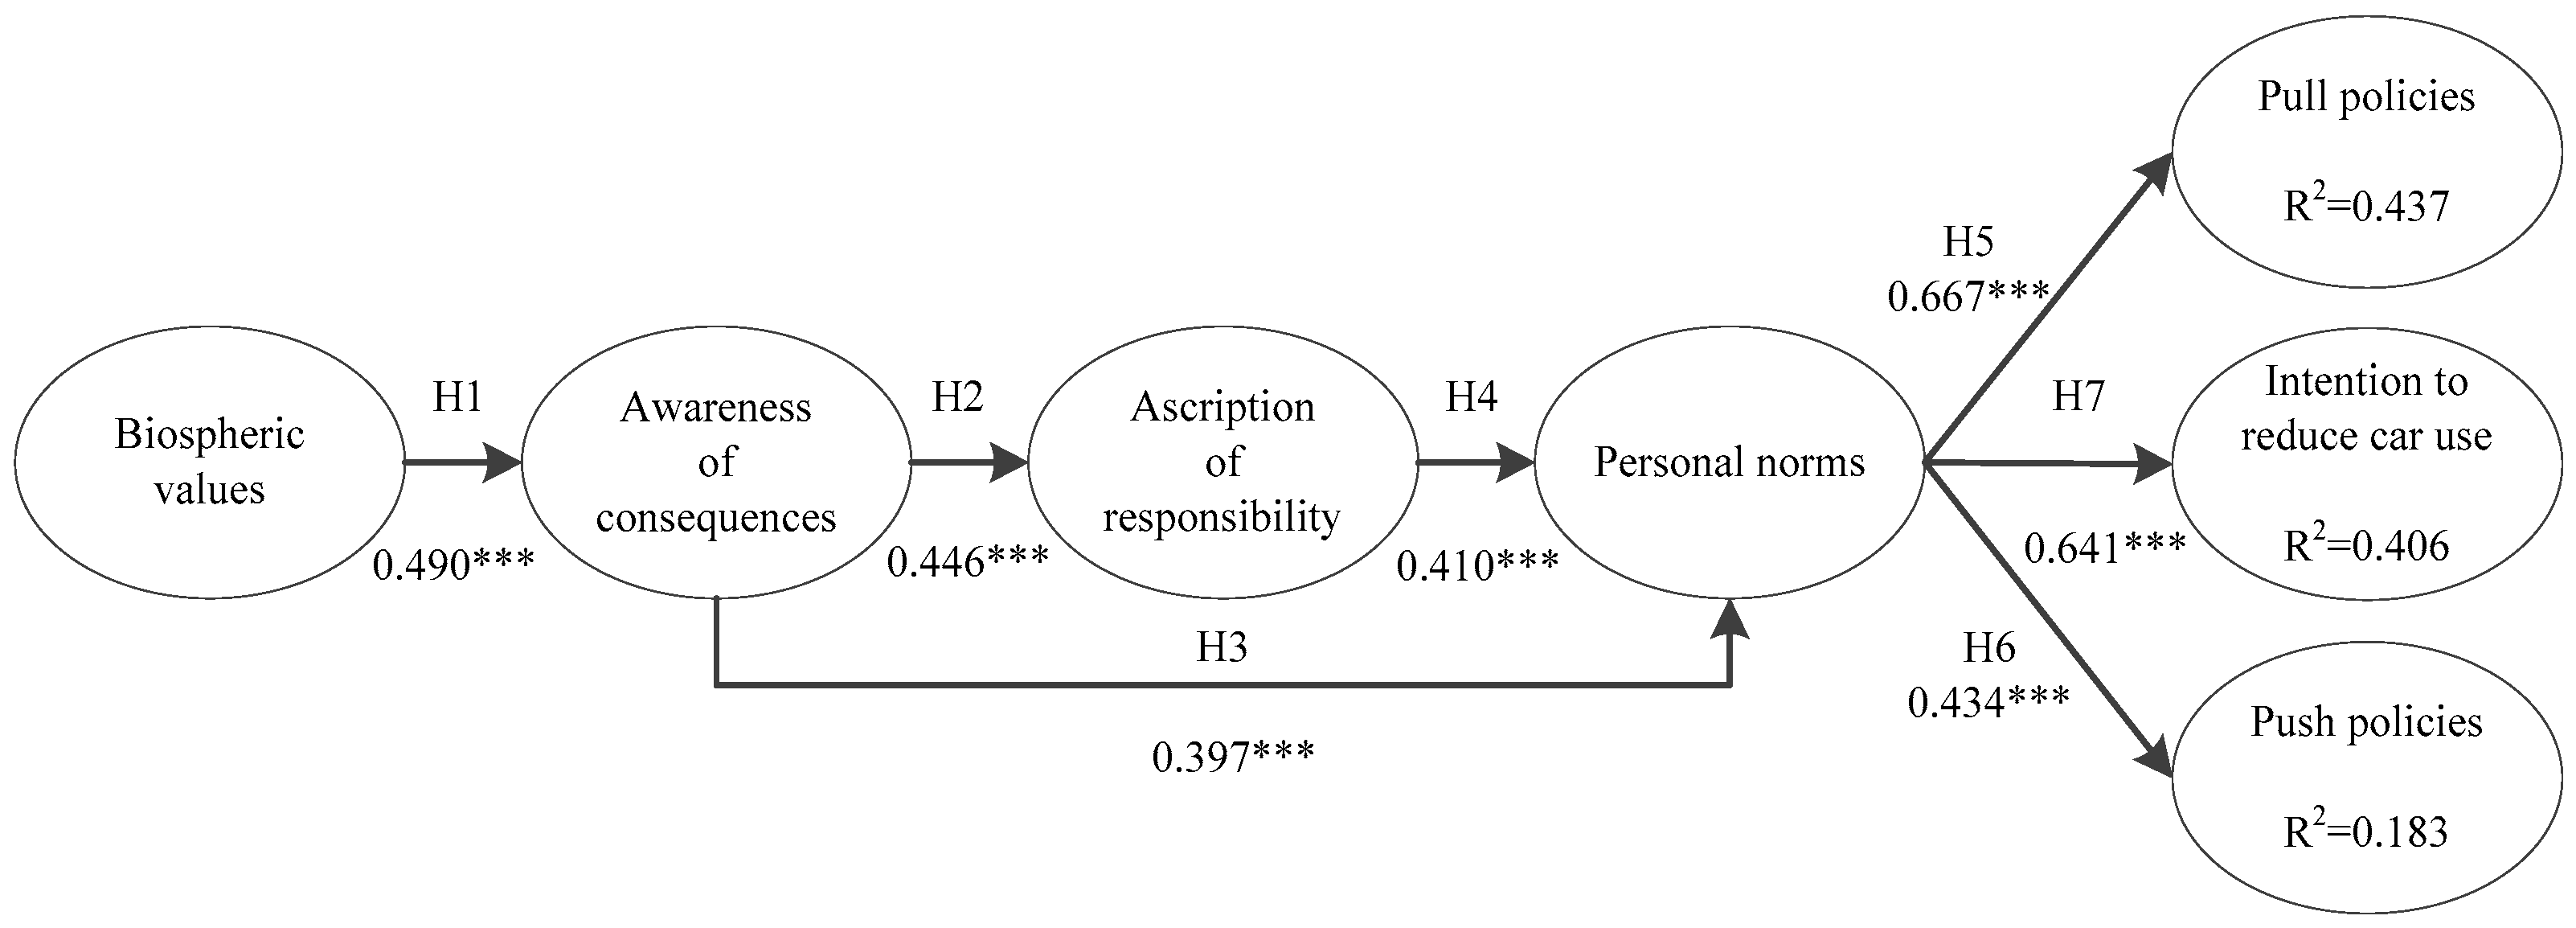
| H1: BV -> AC | 0.490 | 0.064 | 7.733 | 0.000 |
| H2: AC -> AR | 0.446 | 0.064 | 6.928 | 0.000 |
| H3: AC -> PN | 0.397 | 0.058 | 6.859 | 0.000 |
| H4: AR -> PN | 0.410 | 0.057 | 7.225 | 0.000 |
| H5: PN -> PL | 0.667 | 0.049 | 13.607 | 0.000 |
| H6: PN -> PS | 0.434 | 0.053 | 8.051 | 0.000 |
| H7: PN -> IN | 0.641 | 0.053 | 11.941 | 0.000 |
© 2020 by the authors. Licensee MDPI, Basel, Switzerland. This article is an open access article distributed under the terms and conditions of the Creative Commons Attribution (CC BY) license (http://creativecommons.org/licenses/by/4.0/).
Share and Cite
Zhang, L.; Sheng, L.; Zhang, W.; Zhang, S. Do Personal Norms Predict Citizens’ Acceptance of Green Transport Policies in China. Sustainability 2020, 12, 5090. https://doi.org/10.3390/su12125090
Zhang L, Sheng L, Zhang W, Zhang S. Do Personal Norms Predict Citizens’ Acceptance of Green Transport Policies in China. Sustainability. 2020; 12(12):5090. https://doi.org/10.3390/su12125090
Chicago/Turabian StyleZhang, Leibao, Liming Sheng, Wenyu Zhang, and Shuai Zhang. 2020. "Do Personal Norms Predict Citizens’ Acceptance of Green Transport Policies in China" Sustainability 12, no. 12: 5090. https://doi.org/10.3390/su12125090
APA StyleZhang, L., Sheng, L., Zhang, W., & Zhang, S. (2020). Do Personal Norms Predict Citizens’ Acceptance of Green Transport Policies in China. Sustainability, 12(12), 5090. https://doi.org/10.3390/su12125090