Article

Decision-Making Process in the Case of Insufficient Rail Capacity

Faculty of Operation and Economics of Transport and Communications, University of Zilina, 010 26 Žilina, Slovakia
*
Author to whom correspondence should be addressed.
Sustainability 2020, 12(12), 5023; https://doi.org/10.3390/su12125023
Submission received: 27 May 2020 / Revised: 14 June 2020 / Accepted: 16 June 2020 / Published: 19 June 2020
(This article belongs to the Special Issue Sustainable Railway System)

Abstract

:
One of the main priorities of transport policy in the EU is to take measures to support railway transport as an environmentally friendly transport mode. An interesting challenge for a railway transport operation is represented with cost items for its operation. This problem is exacerbated if transport flows are routed through a congested railway infrastructure. If some or all transport takes place on congested rail infrastructure, the carrier’s costs increase, which may ultimately lead to withdrawal from the market. The article deals with the impact of insufficient capacity on the rail carrier’s costs. We used a pre-cost calculation methodology to calculate the rail carrier’s additional costs due to the insufficient railway network capacity based on detailed calculation of train costs and proposed a methodology for carrier decision-making in case of insufficient rail infrastructure capacity. The case study showed that the use of a diversion track in case of insufficient planned rail line capacity may not be advantageous for carriers, even with a longer waiting time for capacity to be released. One of the ways to eliminate the negative effects of congested railway infrastructure is investment in the increase of its capacity.

1. Introduction

Accessible, efficient, safe, and green transport is imperative to economic growth, social development, and the environment [1]. Generally, the development process of the railway transport system is determined by the market pull effects initiated by the economy and society and the market push effects induced by technological progress [2]. Railways are expected to have a greater role in the future to meet the growing demand for transport infrastructure services [3].
An efficient and sustainable railway system depends on providing quality transport services. If there is a problem with the rail service quality, rail transport performance can be reduced [4]. The quality and efficiency of a rail carrier’s services are affected by internal and external factor. While the carriers completely affect internal factors, they cannot influence external factors, and these can also have a significant impact on quality of services and profit. One of these factors is the rail infrastructure’s capacity. Insufficient capacity normally occurs due to an accident caused by a vehicle [5,6], infrastructures (such as an overhead conductor system [7]), accidents between highway users and trains [8], or bad weather. Insufficient or congested capacity increases costs and simultaneously reduces the quality of services provided, especially in terms of delivery time to the customer.
In the Directive 2012/34/EU insufficient capacity is defined as follows: “Where, after coordination of the requested train paths and consultation with applicants, it is not possible to satisfy requests for infrastructure capacity adequately, the infrastructure manager will immediately declare that the infrastructure section on which this has occurred is congested. This will also be done for infrastructure which can be expected to suffer from insufficient capacity in the near future” [9].
Independent Regulator’s Group (IRG)-Rail’s survey of congested infrastructure state that “declaration of congestion appears to have different meanings in different countries. The occurrence and implications of declaring congestion will be very different depending on a number of factors:
  • It has been interpreted how the provision that capacity requests should be adequately met.
  • To what extent the reasonable limits to modifying requests are defined and limit infrastructure manager’s freedom to allocate capacity.
  • How sections of congested infrastructure are delimited in time and space.
  • Whether congestion is declared in cases where temporary capacity restrictions are the cause of the capacity conflict owing to infrastructure works” [10].
There are many articles regarding congestion on urban rail transit where authors deal with different models to describe congestion, e.g., the Epidemiological Dynamics Model [11], Susceptible, Infected, Recovered (SIR) Epidemic Model [12], and Hazard-Based Model [13]. There are only a few papers which deal with congestion on suburban, regional, or other rail infrastructure. Some authors researched rail congested infrastructure from the congested charges point of view [14,15]. Stojadinovic et al. proposed the algorithm for decentralized capacity allocation as the result of a multidimensional approach, which encompasses setting new relations between train operators and the infrastructure manager and train timetable drafting and resolving conflicting requests [16]. Mlinaric and Pirnar researched the reduction of the influence of slow runs and line closures to ensure a sufficient number of rail routes for customers [17]. Therefore, in this paper, we will take into account insufficient rail capacity, whereby we not only mean congested rail capacity but any insufficient capacity (e.g., due to bad weather, accidents, etc.).
Railway capacity is extremely dependent on infrastructure, traffic, and operating parameters [18]. The problem of rail infrastructure capacity was researched from several points of view. The authors most often deal with optimizing railway infrastructure capacity [19,20,21] or investments in railway infrastructure [22,23]. Authors defined rail line capacity as the maximum number of trains which can run on the track within a given time period [24,25,26]. However, a specific unit (trains/hour or trains/day) does not reflect the heterogeneity of train types [27], and real rail line capacity utilization can be lower. Lizbetin et al. researched the operation characteristic of rail freight corridors and their capacity consumption by the common rail operation—passenger and freight [28]. Masek et al. dealt with the transport capacity of the train and railway track based on types of wagons used [29]. By using mathematical models in creating a timetable and planning other processes in rail transport, the optimization of the railway capacity under heterogeneous traffic conditions can be achieved [30,31]. Train timetabling is the basis for track allocation, train routing (at stations), rolling stock scheduling, and crew scheduling problems hence the extremely high importance and significance of optimizing the train timetables [32].
Rail capacity utilization affects rail infrastructure maintenance costs and therefore also infrastructure access charges and rail carrier costs. Many authors deal with this problem from different points of view. Odolinsky and Boysen estimated cost elasticities with respect to traffic that may capture potential differences in maintenance costs with respect to line capacity utilization [33]. The electrification of equipment can increase the rail capacity and simultaneously decrease energy consumption and energy costs [34]. Sternad et al. calculate marginal maintenance costs for regional rail lines using an econometric cost function model [35]. Abramovic deals with systems for calculating infrastructure charges [36]. Authors mainly researched the change of marginal maintenance costs for rail infrastructure due to traffic, e.g., [37,38,39,40].
We identified the research gap to estimate the cost of rail carriers with regard to rail infrastructure capacity utilization. There are a few studies on the costs of road congestion, e.g., [41,42,43,44] and road network costs [45,46,47]. Some authors deal with rail carrier costs more or less in detail, e.g., [48,49,50,51], but nobody occupied themselves with the impact of insufficient rail capacity on carrier costs.
The aim of this paper is to estimate rail carrier costs related to insufficient rail infrastructure capacity. We only took those costs into account that change with respect to insufficient capacity, e.g., costs which depend directly or indirectly on transport time. Rail carriers very often make a decision on whether to use the diversion track or wait for the capacity to be released. We proposed a methodology to make this decision with respect to costs that change as a result of this decision. Our proposed methodology was applied in Slovak Republic conditions for passenger and freight rail transport. We chose two different planned rail lines, the first (for passenger transport) is the corridor track in the first category, and the second (for freight transport) is the regional track. Both tracks have a capacity utilization higher than 75% in some section, which can be considered insufficient infrastructure capacity.

2. Materials and Methods

The study uses quantitative research based on the statistics of insufficient rail infrastructure capacity in the selected countries and a pre-cost calculation methodology to calculate additional rail carrier costs that are due to insufficient railway network capacity. The aim of analysis in this section is to show that the issue of insufficient rail capacity exists in multiple countries, to a lesser or greater extent, and that it is meaningful to address it.
In accordance with Directive 2012/34/EU, European countries usually described information regarding congested rail capacity (such as definition, capacity analysis, priority criteria, process of allocation in this capacity, etc.) in chapter 4 of the Network Statement. Rail infrastructure managers can introduce higher access charges for congested infrastructure such as supplementary fees, fixed charges, or other fees. In practice, some countries use higher access charges for congested infrastructure (e.g., Austria—ÖBB-Infrastruktur AG, Czech Republic—Správa železnic), and some do not (e.g., Slovak Republic—Železnice Slovenskej republiky, Hungary—MAV Magyar Államvasutak Zártkörűen Működő Részvénytársaság).
The methodology for the calculation of additional costs of railway carriers with respect to insufficient capacity is based on these fundamental premises:
  • Carriers utilize locomotives and wagons effectively.
  • The roster of train drivers and train crews are managed effectively, along with minimization of idle times [52].
  • There exists an option for a short lease of locomotives and wagons.
  • In case of insufficient railway infrastructure capacity, the decision-making process is based on minimization of transportation costs.
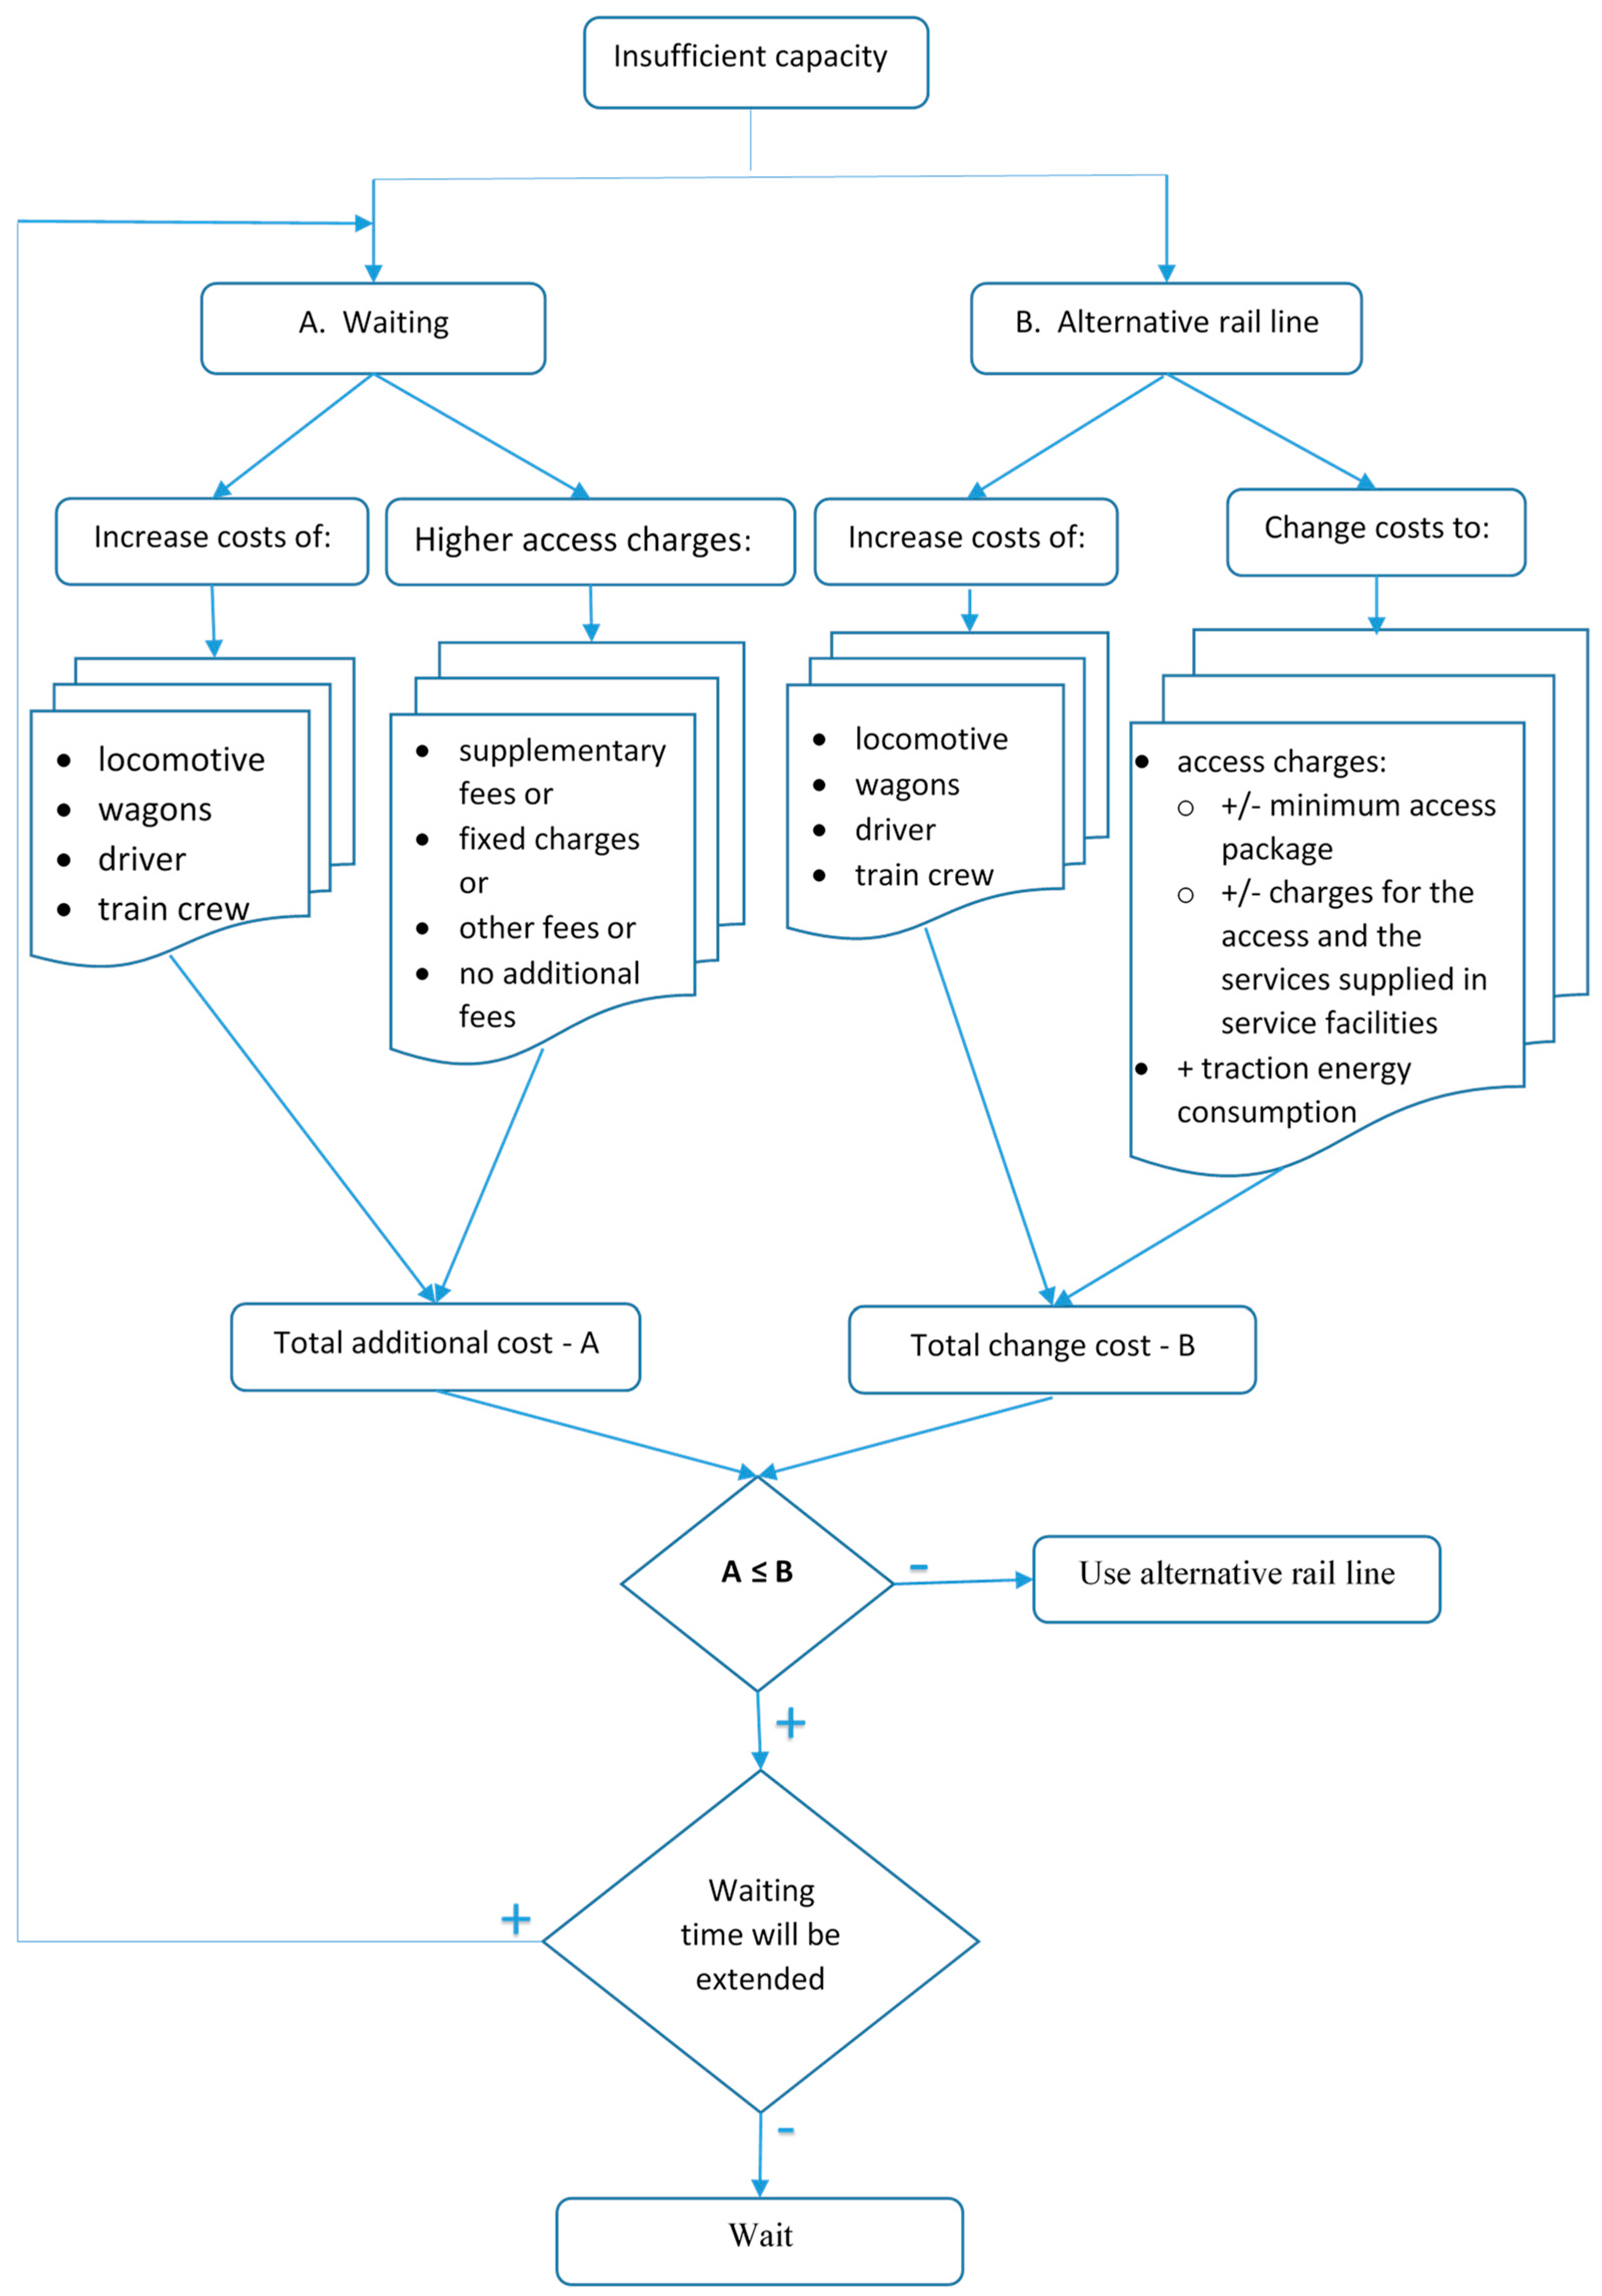
The carriers have two possibilities with respect to insufficient capacity: wait for sufficient capacity (A) or use an alternative railway line if operating conditions allow it (B). Both options mean higher shipping cost and reduced profit. Figure 1 describes the simple scheme regarding the decision-making process based on the carrier’s additional costs associated with insufficient capacity.
As seen in Figure 1, the decision-making process in the case of insufficient rail capacity depends on waiting time (we assume that the planned route (rail line) is cost-optimal). It changed the variable and fixed costs.
These additional costs are incurred in the case of waiting for sufficient capacity (A) and are as follows:
  • Variable costs:
    driver and train crew labor costs (in the case of recurring insufficient capacity this can result in more drivers and train crews),
    rail access charges in some countries (in the case of rail infrastructure managers declaring congested rail capacity on the rail line).
  • Fixed costs:
    regular repair and maintenance costs of locomotives and wagons, which is dependent on time,
    capital costs of locomotives and wagons (if the run of the locomotives and wagons is extended, there is less efficient use and the need for more locomotives and wagons),
    other fixed costs that cannot be allocated directly to the train.
If carriers use the alternative rail line these costs can change (B) as follows:
  • Variable costs:
    driver and train crew labor costs (since the alternative rail line is usually longer or transport takes longer, these costs are higher),
    additional regular repair and maintenance costs of locomotive and wagons, which depend on transport performances,
    rail access charges of which there may be two cases: the rail infrastructure manager determines the alternative rail line (if the carrier uses a lower category rail line, the costs are lower or unchanged) or the carrier requires an alternative line due to their own technological needs (in which case, the costs can be higher or lower),
    traction energy consumption costs, which are usually higher since the technical parameters of alternative rail lines can be worse, e.g., climb of the track, frequent change of line speed, more frequent train stops, etc.
  • Fixed costs:
    regular repair and maintenance costs of locomotives and wagons, which depends on time (taking into account that an alternative line often means a longer time of transport),
    capital costs of locomotives and wagons (the same as in case A),
    other fixed costs that cannot be allocated directly to the train.
The use of an alternative rail line depends on many technical and technological factors such as electrification, maximum length of train, weight normative, axle load, etc.
It is necessary to know transport costs for every technological process in detail to make a good decision in the case of insufficient rail capacity. Cost calculation by type calculation method is not enough, carriers must know the costs for every part of the transport technological process. Figure 2 describes the locomotive and wagon costs calculation method and gives a detailed cost calculation for a train.
A calculation method for cost calculation in rail freight transport as well as calculating variable costs depends on multiplication performed transport output (transport performances), and rate of transport unit is described in our previous study [53]. In general, we can summarize rail vehicle costs by using the following equation:
C R V = i = 1 n j = 1 m T r i D j ( 1 + γ ) R R V k m
where:
  • CRV: rail vehicle costs.
  • Tri: train i.
  • Dj: distance j.
  • γ: coefficient taking rail vehicles’ additional performance into account (e.g., drive to/from engine house, engine shouting, wagons loading, etc.).
  • RRVkm: rail vehicle kilometer rate.
  • I: number of trains per time (usually one year).
  • j: number of relations per time (usually one year).
The rail vehicle kilometer rate is the ratio between rail vehicle costs and transport performances. Rail vehicle costs must take all rail vehicle costs into account (maintenance and services costs, depreciation costs, rail vehicle certification cost, etc.).
Costs using the rail infrastructure (rail infrastructure charges) cannot be generalized. Despite the fact that every rail infrastructure manager uses the same basic fee principle for the minimum access package (based on train km and gross ton km), many differences in the fee calculating method exist, as well as in additional and ancillary services and others. Furthermore, some rail infrastructure managers change the fees annually, and the system of charges or some part of charges also change. The principles regarding allocation and charging for rail infrastructure are available in the document “Network Statement”, which every rail infrastructure manager must publish on their website. The rail carriers have to update every change in their calculation system. Below, we show the rail access charges for the minimum access package in the Slovak republic and Austria as an example.
In Austria, the calculation method for track access charges within the minimum access package per market segment is [54]:
T A C H = t r k m t r + g t k m g t k ± r e d u c t i o n / s u p p l e m e n t s
where:
  • TACH: track access charges.
  • trkm: train kilometers.
  • tr: train-kilometer component per market segment.
  • gtkm: gross-ton kilometers.
  • gtk: gross-ton kilometer component per market segment.
In the Slovak Republic, we write the method for track access charges within the minimum access package by [55]:
T A C H = i = 1 5 L i U 1 i + i = 1 5 L i U 2 i + i = 1 5 L i Q U 3 i k e 10 3 + i = 1 5 L i Q U 4 10 3
where:
  • TACH: track access charges.
  • Li: total track length of the competent category between single transport points in kilometers.
  • U1i: maximum charges for ordering and allocating infrastructure capacity.
  • U2i: maximum charges for traffic management and organization.
  • U3i: maximum charges for ensuring railway infrastructure serviceability.
  • U4: maximum charge for use of the electrical supply equipment for supply of traction current.
  • Q: total gross weight of the train.
  • ke: an index reflecting a train run with a motive power unit of engine traction on electrified lines in the respective category. In case a train includes motive power unit engine traction on electrified lines, the index is 1.2; in other cases, the index is 1.0.
Other items of variable cost (such as labor costs, traction fuel and energy costs, rail vehicle cost) are described in detail in our previous study [56].
Fixed costs calculation for the product (in our case a train) can be done using different methods, from the simplest (e.g., absorbing costing or cost calculation by dividing) to the most complex method (e.g., Activity Based Costing). The application of Activity Based Costing (ABC) methods is different in every undertaking, and it must particularly take the undertaking’s process management into account [56].
In the case of insufficient rail capacity, we can assume that they will only change fixed costs that are directly related to the train running or waiting for rail capacity release, as described in Figure 1. The rail vehicle’s fixed costs can be calculated directly to the train (time of shipping), taking them into account in the rate. The calculation rate for locomotives is:
R L t = D A + i = 1 n n i     P s + j = 1 m n j     P m + C c + C o L l s T
where:
  • RL: track access charges.
  • t: locomotive type.
  • DA: locomotive’s annual depreciation.
  • ni: number of regular services during the locomotive’s life span.
  • Ps: average price of regular locomotive service.
  • nj: number of regular maintenances during a locomotive’s life span.
  • Pm: average price of regular locomotive maintenance.
  • Cc: locomotive certification costs.
  • Co: other locomotive costs.
  • Lls: locomotive life span in years.
  • T: total annual working time.
By analogy, the rate per wagon can be calculated. Taking labor costs into account (driver and train crew) can be done very easily as a ratio between total labor costs and total annual time.
The carrier must have a very good calculation and statistical system for using detailed cost calculation for a train. Beside detailed cost monitoring, they have to log out every transport performance for used wagons and locomotives, driver and train crew performance time, etc. per train in detail.

3. Congested Rail Network Capacity Analysis in the Selected Countries

We analyzed congested rail network capacity in the V4 countries: Germany, Austria, and Slovenia. We selected these countries for comparison of the Slovak Republic with neighboring countries, including a country that has approximately the same population density (Slovenia) and a country that is one of the most developed in the EU (Germany).

3.1. Germany

DB Netz AG detects congested railway lines or railway lines that can be expected to suffer from insufficient capacity in the near future pursuant to the administrative guideline by the Federal Railway Authority and the Federal Network Agency on “congested railway lines”. The administrative guideline is provided by the Federal Network Agency [57].
Within the six months following a congestion declaration, DB Netz AG carries out a capacity analysis in accordance with Section 58 Railway Regulation Act(ERegG) for lines declared congested. Following this, DB Netz AG produces a draft plan for increasing capacity within a further three months, with said plan to be submitted to the Federal Railway Authority and the Federal Network Agency after consultation with the users pursuant to Section 59 ERegG. Congested rail lines are documented in Table 1 [57].

3.2. Austria

In Austria, only one route section has been declared as congested in accordance with § 65c, Section 1 EisbG: Mödling–Wien Meidling [54]. The Austrian rail infrastructure manager uses supplementary fees for congested infrastructure which are described in the chapter 6.1.1 of the Network Statement.

3.3. Slovenia

The Slovenian rail infrastructure manager declared Line 62 Prešnica branch—Koper to be congested. Analysis of the available capacities on line section Divača–Koper are shown in Table 2 [58].

3.4. Hungary

The Hungarian rail infrastructure manager—MAV Magyar Államvasutak Zártkörűen Működő Részvénytársaság—declared in the Network Statement, “There is no congested track section on the open access railway network!” [59].

3.5. Poland

PKP Polskie Linie Kolejowe, the Polish rail infrastructure manager lists, in annex 5.3 of the Network Statement List, lines with no available capacity or with limited capacity due to the time of total break or restriction capacity. This lack of available capacity is related to the modernization of the line or regular rail network maintenance. Table 3 shows some selected sections [60].

3.6. Czech Republic

The Czech rail infrastructure manager Správa Železnic did not declare any track as congested, but it published the planned temporary capacity limitation on their website. The insufficient rail capacity can be observed in the main rail corridor, mainly in the section Pardubice–Praha and Bohumín–Ostrava.

3.7. Slovakia

ŽSR, the Slovak rail infrastructure manager did not declare any rail track as congested, but insufficient capacity is considered to be a line with capacity utilization of more than 75%. Table 4 shows tracks where the carrying capacity is higher than 70% [61].
IRG-Rail realized a survey with concern to congested rail capacity in European countries. Table 5 shows the number of declarations of congested infrastructure in selected countries as reported by the regulatory bodies in the IRG-Rail’s questionnaire [10].
Congested infrastructure declared by Directive 2012/34/EU in European countries does not reflect insufficient capacity, which is much higher regarding the number of operational situations that occur in practice. Therefore, we researched how insufficient rail capacity affects transport costs in Slovak Republic conditions.

4. Results—Case Study in Slovakia

Insufficient capacity means additional costs for carriers. We modelled and calculated changed costs for two situations in Slovakia. The first situation is for rail passenger transport (the planned rail line is the rail corridor), and the second is for rail freight transport (the planned rail line is in the regional rail track).
The methodology presented in Chapter 2 can be applied to other countries too. Unfortunately, a relevant comparison of additional costs associated with the insufficient railway capacity among countries is not possible with regard to different railway networks, different railway infrastructure access charges, nor other costs (e.g., expenditures on wagons, locomotives, train drivers, etc.).

4.1. Rail Passenger Transport

We took the regular Express train (R 602) on the route Košice–Bratislava as an example. The problem with insufficient capacity (as can be seen in the previous chapter) is in the track section Trnava–Bratislava. In the case of insufficient capacity, the best rail track for a diversion rail line is the Leopoldov–Galanta track. Figure 3 shows the planned and diversion rail lines on the scheme.
We calculated changed costs for planned train sequencing. Table 6 shows the input parameters for the express train [62].
We only calculated costs that changed when carriers change rail track or are waiting for sufficient capacity (described in chapter 2). We modelled cost rates according to available information regarding leasing wagons and locomotion of incumbent rail passenger operators in the Slovak Republic and information from the rail infrastructure manager’s annual report. All cost rates (with the exception of rail infrastructure charges and energy costs) were recalculated for a minute to better the cost calculation due to shipping time. We used €1.123/min. for locomotion, €0.15/min. for wagons, €0.333/min. for drivers, and €0.283/min. for train crews. These rates were calculated using the principle described in method 1 and 4. Energy consumption costs were calculated as multiplication specific traction energy consumption, the price of the train’s traction energy, and gross ton kilometers (grtkm). The Railways of the Slovak Republic (ZSR) rail infrastructure manager states the specific traction energy consumption for passenger and rail trains in a document outlining the operating rules of the distribution system operator by quarter, type of train, and type of electrification [63]. We used average specific traction energy consumption 26.075 kWh per thousand grtkm and price €0.097/kWh recalculated by [64].
The maximum track access charges within a minimum access package is determined according to Table 7 on the basis of the relevant line category, processed according to Decree no. 2/2018 on determining the charges for access to railway infrastructure [65].
We used MS Excel for calculation change costs. In practice, software tools can be used (using the principle and methods described in chapter 2), but for small businesses MS Excel is sufficient. Table 8 shows the calculation of changed costs for the planned rail line (track Leopoldov–Bratislava) and diversion rail line (Leopoldov–Galanta diversion rail line, 88.229 km) [66]. Both tracks have a double electrified track (AC 25 kV 50 Hz) and are category 1 for access charges [55]. We used real time transport for the planned rail line by timetable (43 min) and modelled transport time for the diversion rail line. This meant that we modelled the Leopoldov–Galanta rail line by express freight train because express passenger trains are not in the actual timetable and Galanta–Bratislava by express passenger trains. The total time of transport for the diversion rail line is 73 min.
The difference in cost between using planned rail lines and diversion rail lines is approximately €199.4, excluding VAT, i.e., costs on the diversion rail line are higher by approximately 52.4%.
In practice, carriers must most often make a decision about using a diversion rail line in the case of an accident on a planned rail line or delays of previous trains. In this case, the rail infrastructure manager charges fees for the planned rail line. The decision depends on waiting time (see Figure 1). We calculated changed cost due to the waiting time and energy consumption. Table 9 and Figure 4 show the results for our modelled situation.
Energy consumption costs and track access charge costs are the same as in Table 8 for all waiting times.
As seen in Figure 4, if the waiting time is higher than 40 min. it is better for carriers to use a diversion rail line. The advantage of using the diversion rail line even with a short waiting time is due to the short distance of the diversion rail line (the difference is only 24.7 km) and the diversion rail line’s technical parameter is an electrified double track. The situation is completely different in the case of regional lines, as seen in the next chapter.

4.2. Rail Freight Transport

For rail freight transport, we choose the section Dunajská Streda–Vajnory. The average capacity utilization is 64%, but the problem is a section of this track, Bratislava-Nové Mesto–Bratislava-Vajnory, where the capacity utilization is almost 80%, and the other track section is problem at peak time where the capacity is not enough for rail passenger transport either. Track Komárno–Dunajská Streda–Bratislava-Nové Mesto is a single non-electrified track. The track Bratislava-Nové Mesto–Bratislava-Vajnory is part of the Bratislava rail junction and electrified (AC 25 kV, 50 Hz). As seen in Figure 5, in the case of insufficient capacity, carriers can use diversion rail line Dunajská Streda–Komárno–Nové Zámky–Bratislava-Vajnory.
Table 10 shows the technical parameter and track category for access charges of the individual track section in the planned and diversion rail lines [66].
We took a freight train with 22 wagons (type: Sggrss 80’) and locomotive (type: Siemens ER 20) in this case study. The technical parameters of a Sggrss 80´ wagon are [67]:
  • wagon length over buffers: 26.39 m,
  • loading length: 2 × 12.22 m,
  • wagon tare: 28.5 t,
  • max. weight of loaded wagon: 106.5 t,
  • max. axle load: 22.5 t.
The locomotive weight is 80.5 tons, and the length over buffers is 19.975 m. We considered 40 ton loaded containers on the wagon (by study Vel Wagon) As a consequence it follows that the train’s total length is 600.555 m, and gross tonnage is 1587.5 tons. The transport time was modelled by the running speed of the Nex freight train on the relevant line section. Total time of transport on the planned rail line is 58 min. and 127 min. on the diversion rail line.
We modelled cost rates analogous to rail passenger transport. We used €0.533/min. for locomotion, €0.014/min. for wagons, €0.333/min. for drivers and €0.283/min. for train crews. Track access charges are described in Table 7, whereas with electrified tracks we have increased U3i by using coefficient ke at an index of 1.2 according to the Network Statement of ZSR. For calculation of energy consumption cost we used specific energy consumption (0.6 L/thousand grtkm) and diesel price (€1.025/L) (average annual price in the year 2019 excluding VAT) [68]. Table 11 shows the calculation results.
As seen in Table 11, cost differences between a planned rail line and a diversion rail line are very high despite the fact that a large part of the diversion rail line is of a higher category. This is caused by a much higher diversion rail line distance. The biggest difference is in the access charges costs—€350.104—which is more than 64% of the total cost change. Therefore, we researched how to change the costs due to waiting for released rail capacity analogically to rail passenger transport, e.g., costs of access charges in the diversion rail line are unchanged. Table 12 and Figure 6 present the comparison of the changed costs related to waiting time.
We took the same access charge costs (€137.39) and energy consumption costs (€48.86) into account by using Table 11 for all waiting times.
The limit waiting time with regard to costs in this case is 129.5 min. If the waiting time is higher, it is better for carriers to use a diversion line in this modelled situation. The waiting time depends on the type of locomotive used, wagons, and driver costs.

5. Discussion and Conclusions

In terms of the EU’s strategy, rail transport is a key transport sector for achieving sustainable mobility. In support of this aim, the European Commission has adopted reform measures in the form of four railway packages aimed at increasing rail transport competitiveness in comparison with other transport modes. The main objective of the measures is gradually opening the rail transport market to the private sector. However, with new operators entering the market for rail freight and passenger transport (open access services), parts of the railway infrastructure (especially on the main European railway corridors) become congested on the railway network. Due to creating the train schedule and the priority of rail passenger transport, there are significantly limited possibilities for providing a route in the train schedule according to the needs of rail freight operators. Therefore, freight trains have to wait until the railway infrastructure capacity is freed or use another route, which, however, is usually insufficient in terms of weight norms and normative length. In such cases, carriers incur higher costs, which may in turn reduce rail freight competitiveness.
Throughout our research, the exact cost and waiting time have not been calculated, but show how insufficient capacity affects carrier costs and can lead to a reduction in rail transport competitiveness compared to other transport modes. Furthermore, our suggested methodology can be a very useful management tool for effective decision-making in the case of insufficient rail network capacity that can occur at any time, e.g., in the event of an accident on a planned rail track, unplanned track maintenance, etc. The practical application of our proposed methodology requires a very good calculation and statistical system that allows detailed cost calculation for a train.
This study is limited by premises introduced in Section 2. In fact, problems may arise with a short lease of the fleet and with a lack of staff qualified in railway transport (train drivers and train crews). These facts impact the carriers’ costs and increase an ineffective utilization of the rolling stock significantly. Thus, future research will be focused on analyzing the insufficient railway infrastructure capacity in other countries too and on studying the impact of increasing the railway infrastructure capacity on increasing the performance of railway freight transport and open access services in railway passenger transport as well as on studying the impact on the competitiveness of railway transport when compared to other transport modes. Another object of the research may be the study of efficiency of investments in congested railway infrastructure in light of social costs.
Currently, there is no problem with the rail infrastructure capacity in view of the coronavirus pandemic (COVID-19). On the contrary, rail transport performances are declining. However, after the pandemic, along with economy growth, transport performance will also grow. It is important that transport demands are met by environmentally friendly transport modes. Rail transport is considered to be the most environmentally friendly transport mode in the case of using electric traction, but carriers (especially in the mode of open access services in passenger transport and services in freight transport) will provide their services only if they are competitive with other transport modes. The productivity of rail carriers and railway systems as a whole is constrained by the existing rail infrastructure [69]. Therefore, it is necessary to invest in railway infrastructure. New investments will not only increase rail transport competitiveness but will also contribute to the European Green Deal.

Author Contributions

Conceptualization, A.D., V.Z., and L.C.; methodology, A.D.; data curation, V.Z. and L.C.; investigation, A.D. and V.Z.; formal analysis, V.Z. and L.C.; writing—original draft preparation, A.D., V.Z., and L.C.; visualization, A.D. and L.C.; project administration and funding acquisition, A.D. All authors have read and agreed to the published version of the manuscript.

Funding

This paper is a partial output of the grant project VEGA 1/0379/20: Socio-economic aspects of rail transport market services deregulation in the context of EU legal frameworks and sustainable mobility.

Conflicts of Interest

The authors declare no conflict of interest.

References

  1. Thompson, B.; Obika, B. Advancing Applied Research in High Volume Transport in Low-Income Countries in Africa and South Asia. Sustainability 2020, 12, 4088. [Google Scholar] [CrossRef]
  2. Wangai, A.W.; Rohacs, D.; Boros, A. Supporting the Sustainable Development of Railway Transport in Developing Countries. Sustainability 2020, 12, 3572. [Google Scholar] [CrossRef]
  3. Quium, A.S.M. Transport Corridors for Wider Socio–Economic Development. Sustainability 2019, 11, 5248. [Google Scholar] [CrossRef] [Green Version]
  4. Jomnonkwao, S.; Champahom, T.; Ratanavaraha, V. Methodologies for Determining the Service Quality of the Intercity Rail Service Based on Users’ Perceptions and Expectations in Thailand. Sustainability 2020, 12, 4259. [Google Scholar] [CrossRef]
  5. Iwnicki, S.; Spiryagin, M.; Cole, C.; McSweeney, T. Handbook of Railway Vehicle Dynamics, 2nd ed.; CRC Press, Taylor & Francis Group: London, UK, 2019. [Google Scholar]
  6. Pasha, J.; Dulebenets, M.A.; Abioye, O.F.; Kavoosi, M.; Moses, R.; Sobanjo, J.; Ozguven, E.E. A Comprehensive Assessment of the Existing Accident and Hazard Prediction Models for the Highway-Rail Grade Crossings in the State of Florida. Sustainability 2020, 12, 4291. [Google Scholar] [CrossRef]
  7. Song, Y.; Ronnquist, A.; Navik, P.; Liu, Z. Contact Wire Irregularity Stochastics and Effect on High-speed Railway Pantograph-Catenary Interactions. IEEE Trans. Instrum. Meas. 2020. [Google Scholar] [CrossRef]
  8. Kavoosi, M.; Dulebenets, M.A.; Pasha, J.; Abioye, O.F.; Moses, R.; Sobanjo, J.; Ozguven, E.E. Development of Algorithms for Effective Resource Allocation among Highway–Rail Grade Crossings: A Case Study for the State of Florida. Energies 2020, 13, 1419. [Google Scholar] [CrossRef] [Green Version]
  9. Directive 2012/34/EU of the European Parliament and of the Council of 21 November 2012 Establishing a Single European Railway Area. Available online: https://eur-lex.europa.eu/legal-content/EN/TXT/PDF/?uri=CELEX:32012L0034&from=en (accessed on 30 March 2020).
  10. IRG-Rail. A Survey of Congested Infrastructure, Priority Criteria and Capacity Charges in Europe. Available online: https://www.irg-rail.eu/irg/documents/position-papers/166,2019.html (accessed on 15 April 2020).
  11. Shi, Z.; Zhang, N.; Zhu, L. Understanding the Propagation and Control Strategies of Congestion in Urban Rail Transit Based on Epidemiological Dynamics Model. Information 2019, 10, 258. [Google Scholar] [CrossRef] [Green Version]
  12. Zeng, Z.; Li, T.X. Analyzing Congestion Propagation on Urban Rail Transit Oversaturated Conditions: A Framework Based on SIR Epidemic Model. Urb. Rail Transit 2018, 4, 130–140. [Google Scholar] [CrossRef]
  13. Shi, Z.; Zhang, N.; Zhang, Y. Hazard-Based Model for Estimation of Congestion Duration in Urban Rail Transit Considering Loss Minimization. Transp. Res. Rec. 2016, 2595, 78–87. [Google Scholar] [CrossRef]
  14. Nash, C.; Crozet, Y.; Heike, L.; Nilson, J.E.; Smith, A. Track Access Charges: Reconciling Conflicting Objectives; Project Report CERRE; Centre on Regulation in Europe: Brussels, Belgium, 2018; Available online: https://cerre.eu/publications/track-access-charges-reconciling-conflicting-objectives (accessed on 17 April 2020).
  15. Nilsson, J.E. Towards a welfare enhancing process to manage railway infrastructure access. Transp. Res. Part A 2002, 36, 419–436. [Google Scholar] [CrossRef]
  16. Stojadinovic, N.; Boskovic, B.; Bugarinovic, M. Bridging the gap between infrastructure capacity allocation and market-oriented railway: An algorithmic approach. Transport 2019, 34, 708–721. [Google Scholar] [CrossRef] [Green Version]
  17. Mlinaric, T.J.; Pirnar, M. Optimizing track infrastructure availability. Promet-Traffic Transp. 2009, 21, 113–121. [Google Scholar] [CrossRef]
  18. Abril, M.; Barber, F.; Ingolotti, L.; Salido, M.A.; Tormos, P.; Lova, A. An assessment of railway capacity. Transp. Res. Part E Logist. Transp. Rev. 2008, 44, 774–806. [Google Scholar] [CrossRef] [Green Version]
  19. Meško, P.; Gašparík, J.; Lalinská, J. Railway capacity issues on slovak international corridors. In Transport Means: Proceedings of the International Scientific Conference, Kaunas University of Technology: Juodkrante, Lithuania, 2017; pp. 436–441. Available online: https://www.scopus.com/record/display.uri?eid=2-s2.0-85045257522&origin=resultslist&sort=plf-f&src=s&st1=Railway+capacity+issues+on+slovak+international+corridors&st2=&sid=785c747af6e7094c7791ad823c97b4ed&sot=b&sdt=b&sl=72&s=TITLE-ABS-KEY%28Railway+capacity+issues+on+slovak+international+corridors%29&relpos=0&citeCnt=1&searchTerm= (accessed on 18 June 2020).
  20. Shen, Y.; Zhao, J. Capacity constrained accessibility of high-speed rail. Transportation 2017, 44, 395–422. [Google Scholar] [CrossRef] [Green Version]
  21. Zhao, L.; Zhao, Y.; Hu, Q.; Li, H.; Stoeter, J. Evaluation of consolidation center cargo capacity and locations for China railway express. Transp. Res. Part E Logist. Transp. Rev. 2018, 117, 58–81. [Google Scholar] [CrossRef]
  22. Reinhardt, L.B.; Pisinger, D.; Lusby, R. Railway capacity and expansion analysis using time discretized paths. Flex. Serv. Manuf. J. 2018, 30, 712–739. [Google Scholar] [CrossRef] [Green Version]
  23. Potti, P.; Marinov, M.; Sweeney, E. A Simulation Study on the Potential of Moving Urban Freight by a Cross-City Railway Line. Sustainability 2019, 11, 6088. [Google Scholar] [CrossRef] [Green Version]
  24. Kozan, E.; Burdett, R.L. Techniques for absolute capacity determination in railways. Transp. Res. Part B Methodol. 2006, 40, 616–632. [Google Scholar]
  25. Gasparik, J.; Abramovic, B.; Halas, M. New graphical approach to railway infrastructure capacity analysis. Promet-Traffic Transp. 2015, 27, 283–290. [Google Scholar] [CrossRef] [Green Version]
  26. Sun, Y.; Ji, L.; Zang, G.B. Analysis of carrying capacity on double track line and its interrelated effects. J. China Railw. Soc. 2010, 23, 90–95. [Google Scholar]
  27. Lai, Y.-C.; Liu, Y.-H.; Lin, Y.-J. Standardization of capacity unit for headway-based rail capacity analysis. Transp. Res. Part C Emerg. Technol. 2015, 57, 68–84. [Google Scholar] [CrossRef]
  28. Lizbetin, J.; Ponicky, J.; Zitricky, V. The Throughput Capacity of Rail Freight Corridors on the Particular Railways Network. Nase More 2016, 63, 161–169. [Google Scholar]
  29. Masek, J.; Kendra, M. Camaj, J. Model of the Transport Capacity of the Train and Railway Track Based on Used Types of Wagon. Transp. Means 2016, 2016, 584–588. [Google Scholar]
  30. Azadi, M.A.A.; Jolai, F.; Nasiri, M.M. A multi-commodity network flow model for railway capacity optimization in case of line blockage. Int. J. Rail Transp. 2019, 7, 297–320. [Google Scholar] [CrossRef]
  31. Caballini, C.; Fioribello, S.; Sacone, S.; Siri, S. An MILP optimization problem for sizing port rail networks and planning shunting operations in container terminals. IEEE Trans. Autom. Sci. Eng. 2016, 13, 1492–1503. [Google Scholar] [CrossRef]
  32. Li, X.; Yamamoto, T.; Yan, T.; Lu, L.; Ye, X. First Train Timetabling for Urban Rail Transit Networks with Maximum Passenger Transfer Satisfaction. Sustainability 2020, 12, 4166. [Google Scholar] [CrossRef]
  33. Odollinsky, K.; Boysen, H. Railway line capacity utilisation and its impact on maintenance costs. J. Rail Transp. Plan. Manag. 2019, 9, 22–33. [Google Scholar] [CrossRef]
  34. Iris, Ç.; Lam, J.S.L. A review of energy efficiency in ports: Operational strategies, technologies and energy management systems. Renew. Sustain. Energy Rev. 2019, 112, 170–182. [Google Scholar] [CrossRef]
  35. Sternad, M.; Jagric, T.; Rosi, B. Railway usage charges based on marginal maintenance costs. Proc. Inst. Civ. Eng. Transp. 2018, 171, 3–10. [Google Scholar] [CrossRef]
  36. Abramovic, B. Infrastructure Access Charges. In Sustainable Rail Transport. Lecture Notes in Mobility; Marinov, M., Ed.; Springer: Cham, Switzerland, 2018; pp. 45–58. [Google Scholar]
  37. Johanson, P.; Nilson, J.E. An economic analysis of track maintenance costs. Transp. Policy 2004, 11, 277–286. [Google Scholar] [CrossRef]
  38. Odolinsky, K.; Nilsson, J.-E. Estimating the marginal maintenance cost of rail infrastructure usage in Sweden; does more data make a difference? Econ. Transp. 2017, 10, 8–17. [Google Scholar] [CrossRef] [Green Version]
  39. Anderson, M.; Bjorklund, G.; Haraldsson, M. Marginal railway track renewal costs: A survival data approach. Transp. Res. Part A-Policy Pract. 2016, 87, 68–77. [Google Scholar] [CrossRef] [Green Version]
  40. Calvo, F.; de Ona, J.; Lopez, G.; Garach, L.; de Ona, R. Rail track costs management for efficient railway charges. Proc. Inst. Civ. Eng. Transp. 2013, 166, 325–335. [Google Scholar] [CrossRef] [Green Version]
  41. Zhang, J.; Pourazarm, S.; Cassandras, C.G.; Paschalidis, I.C. The price of anarchy in transportation networks by estimating user cost functions from actual traffic data. In Proceedings of the IEEE 55th Conference on Decision and Control (CDC), Las Vegas, NV, USA, 12–14 December 2016; pp. 789–794. [Google Scholar]
  42. Christidis, P.; Rivas, J.N.I. Measuring Road Congestion. JRC Scientific and Policy Reports. European Commission. Joint Research Centre. Institute for Perspective Technological Studies. 2012. Available online: https://publications.jrc.ec.europa.eu/repository/bitstream/JRC69961/congestion%20report%20final.pdf (accessed on 8 June 2020).
  43. Verhoef, E.T.; Koh, A.; Shepherd, S. Pricing, capacity and long-run cost functions for first-best and second-best network problems. Transp. Res. Series B Methodol. 2010, 44, 870–885. [Google Scholar] [CrossRef] [Green Version]
  44. Gillen, D. Efficient Use and Provision of Transportation Infrastructure with Imperfect Pricing: Second Best Rules. In The Full Costs and Benefits of Transportation Contributions to Theory, Method and Measurement; Greene, D.L., Jones, D.W., Delucchi, M.A., Eds.; Springer: Berlin/Heidelberg, Germany, 1997; pp. 193–218. [Google Scholar]
  45. Xia, C.Y. Construction and application of multivariate linear regression model on road cost. Appl. Mech. Mater. 2014, 556, 807–811. [Google Scholar] [CrossRef]
  46. Shi, F.; Wang, Y.-Z.; Xu, G.-M.; Li, M.-S. Traffic network equilibrium analysis considering bi-directional flow effect on local road. China J. Highw. Transp. 2013, 26, 137–142. [Google Scholar]
  47. Sodikov, J. Road cost models for prefeasibility studies in developing countries. J. Infrastruct. Syst. 2009, 15, 278–289. [Google Scholar] [CrossRef]
  48. Baumgartner, J.P. Prices and Costs in the Railway Sector; LITEP (Laboratoire d’Intermodalitè des Transports Et de Planification), Ecole Politechnique Federale de Lausanne: Lausanne, Switzerland, 2001. [Google Scholar]
  49. Grosso, M. Intermodal Transport: A tool for the calculation of the cost function. In Proceedings of the 12th SIET (Società Italiana degli Economisti dei Trasporti) National Conference, Rome, Italy, 17–18 June 2010. [Google Scholar]
  50. Komsta, H.; Rybicka, I.; Bukova, B.; Brumercikova, E. The case study of the cargobeamer system use in rail transport in Slovakia. Transp. Probl. 2018, 13, 143–149. [Google Scholar] [CrossRef] [Green Version]
  51. Lupi, M.; Pratelli, A.; Conte, D.; Farina, A. Railway Lines across the Alps: Analysis of Their Usage through a New Railway Link Cost Function. Appl. Sci. 2020, 10, 3120. [Google Scholar] [CrossRef]
  52. Rezanova, N.J.; Ryan, D.M. The train driver recovery problem—A set partitioning based model and solution method. Comput. Oper. Res. 2010, 37, 845–856. [Google Scholar] [CrossRef] [Green Version]
  53. Dolinayova, A.; Loch, M.; Kanis, J. Modelling the influence of wagon technical parameters on variable costs in rail freight transport. Res. Transp. Econ. 2015, 54, 33–40. [Google Scholar] [CrossRef]
  54. Network Statement of ӦBB-Infrastruktur AG inl. Minimum Access Package and Additional Services. 2020. Available online: https://infrastruktur.oebb.at/en/partners/rail-network/network-statement/network-statement-2020/network-statement-2020.pdf (accessed on 17 April 2020).
  55. Network Statement ŽSR for Timetable 2019/2020. Available online: https://www.zsr.sk/files/dopravcovia/zeleznicna-infrastruktura/podmienky-pouzivania-zel-infrastruktury/network-statement-2020/networkstatement_2019-2020_amendment_1.pdf (accessed on 20 April 2020).
  56. Dolinayova, A. Possibilities to quantify fixed costs for long-distance and regional railway passenger transport. In Proceedings of the International Conference on Traffic and Transport Engineering (ICTTE), Belgrade, Serbia, 27–28 September 2018; pp. 954–959. [Google Scholar]
  57. DB Netz AG Network Statement 2020. Available online: https://fahrweg.dbnetze.com/resource/blob/3589414/7294e7ffe9a26a7b1ebece4fdb47feca/snb_2020-data.pdf (accessed on 21 April 2020).
  58. Slovenske Železnice. SŽ-Infrastruktura. Network Statement 2020. Available online: https://www.slozeleznice.si/images/infrastruktura/Network_statement/2020/NS_2020_2.pdf (accessed on 21 April 2020).
  59. Network Statement 2019–2020. VPE-Rail Capacity Allocation Office. Available online: https://www2.vpe.hu/eng/network-statement (accessed on 20 April 2020).
  60. Network Statement 2019/2020 PKP. Annex 5.3 List of Lines with No Available Capacity or with Limited Capacity. Available online: https://en.plksa.pl/files/public/user_upload/pdf/Reg_przydzielania_tras/Regulamin_sieci_2019_2020/09.01.2020/zal_5_3_Reg19_20_v15_POL-ANG.pdf (accessed on 20 April 2020).
  61. Network Statement ZSR 2020. Annex 4.3.A. Infrastructure Capacity. Available online: https://www.zsr.sk/files/dopravcovia/zeleznicna-infrastruktura/podmienky-pouzivania-zel-infrastruktury/network-statement-2020/annex_4_3_a-capacity2020.pdf (accessed on 22 April 2020).
  62. Planned Rail Train. Train Sequencing 2020. Available online: https://www.vagonweb.cz/razeni/vlak.php?zeme=ZSSK&kategorie=R&cislo=602&nazev=%C4%8Cingov&rok=2020#v11560 (accessed on 26 April 2020).
  63. Operating Rules of the Distribution System Operator of the Company Železnice Slovenskej Republiky, Bratislava. 2018. Available online: https://www.zsr.sk/files/ze/rok2018/00172018e.pdf (accessed on 28 April 2020).
  64. Annual Report 2018. Železnice Slovenskej Republiky. Available online: https://www.zsr.sk/files/o-nas/vyrocne-spravy/annualreport2018.pdf (accessed on 4 May 2020).
  65. Decree, no. 2/2018 of the Transport Authority of 17 September 2018 Determining the Payment for Access to Railway Infrastructure and Service Facilities. Available online: https://www.zsr.sk/files/dopravcovia/zeleznicna-infrastruktura/podmienky-pouzivania-zel-infrastruktury/networkstatement2020/priloha6_3_1_opatrenie-2_2018_du.pdf (accessed on 4 May 2020).
  66. Track Condition Table. Železnice Slovenskej Republiky. Available online: https://www.zsr.sk/dopravcovia/infrastruktura/tabulky-tratovych-pomerov/ (accessed on 30 April 2020).
  67. Sggrss 80’. Wagon for Transportation of 20’ and 40’ Containers. Tatravagónka Poprad. Available online: https://tatravagonka.sk/wpcontent/uploads/2019/05/tv_produkt_list_inter_modal_sggrss80_aj_nj_sj_rj_0415_n.pdf?jWvb_vagonka=99 (accessed on 4 May 2020).
  68. Average Fuel Prices. Statistical Office of the Slovak Republic. Available online: http://statdat.statistics.sk/cognosext/cgibin/cognos.cgi?b_action=xts.run&m=portal/cc.xts&gohome= (accessed on 4 May 2020).
  69. Marinov, M.; Sahin, I.; Ricci, S.; Vasic-Franklin, G. Railway operations, time-tabling and control. Res. Transp. Econ. 2013, 41, 59–75. [Google Scholar] [CrossRef] [Green Version]
Figure 1. Decision-making process in the case of insufficient rail capacity.
Sustainability 12 05023 g001
Figure 2. Possibilities of calculating rail vehicle costs.
Sustainability 12 05023 g002
Figure 3. Planned and diversion rail lines Leopoldov–Bratislava.
Sustainability 12 05023 g003
Figure 4. Changed costs due waiting time—rail passenger transport.
Sustainability 12 05023 g004
Figure 5. Planned and diversion rail line Dunajská Streda–Bratislava-Vajnory.
Sustainability 12 05023 g005
Figure 6. Cost changes due to waiting time—rail freight transport.
Sustainability 12 05023 g006
Table 1. Congested rail lines, DB Netz AG.
No. LineSection
2200Hamburg-Harburg – Hamburg Hbf
6100Hamburg Hbf – Hamburg Rainweg
6107Berlin Hbf (tief) – Berlin-Spandau Ost,
6132Berlin Südkreuz – Großbeeren Süd,
6134Berlin Hbf (tief) – Berlin Südkreuz,
6170Berlin-Wedding Abzw. – Berlin-Gesundbrunnen
6171Berlin-Wedding Abzw. – Berlin Südkreuz
2550Aachen Hbf – Aachen West
2600Stolberg Hbf – Aachen Hbf
Table 2. Available capacity on line section Divača–Koper.
LineSectionUtilised Capacity of Line (%)
20 Ljubljana–JeseniceLjubljana–Kranj 74
Kranj–Jesenice 91
60 Divača–Branching PrešnicaDivača–Branching Prešnica100
62 Branching Prešnica–Koper (Rail Freight Corridor (RFC) 5 RFC 6)Branching Prešnica–Koper100
Table 3. Lines with no available capacity or with limited capacity—Poland.
No.Line No.SectionTotal Break [Suspended Traffic]Restriction of Capacity [Single-Track Traffic]
53Warszawa Gołąbki–Ożarów Mazowiecki to 30 April 2020
168Dobieszyn–Radom12 January 2020–11 March 2020
2015Łódź Kaliska–Zgierz 12 February 2020–3 December 2020
2116Zgierz–Łęczycafrom 1 July 2020
2635Ostrołęka–Chorzelefrom 16 March 2020
3391Kraków Główny–Kraków Płaszówcomplete timetable
4194Kraków Bonarka–Kraków Płaszówto 17 September 2020
55143Wrocław Nadodrze–Wrocław Mikołajów complete timetable
62249Gdańsk Główny–Gdańsk Zaspa Towarowafrom 1 June 2020
68351Wronki–Krzyż complete timetable
69351Krzyż–Dolice complete timetable
70351Kolin–Szczecin Dąbie complete timetable
76722Gdańsk Zaspa Towarowa–Gdańsk Wiślanyfrom 1 June 2020
Table 4. Carrying capacity in the selected track–Slovak Republic.
TrackConstraint SectionTrack No.Carrying Capacity Utilisation
Even DirectionOdd Direction
Humenné–MichaľanyHumenné Strážske19175%
(Košice) Kysak–PlavečKysak–Prešov18870.70%
Poprad Tatry–Starý SmokovecTEŽ18377.80%
Starý Smokovec–Štrbské PlesoTEŽ18376.30%
Žilina–Rajec 12690%
Červená Skala–Banská BystricaBrezno–Banská Bystrica17274%
Zvolen–B. Bystrica–VrútkyZvolen–B. Bystrica17074.30%
Zvolen–Šahy 15372.70%
Zvolen–Palárikovo (Bratislava)Hronská Dúbrava–Levice15080.70%
Levice–Úľany nad Žitavou15083%
Bratislava–D. Streda–KomárnoBratislava hl. st.–Bratislava N. Mesto13186.30%
Bratislava–KútyBratislava hl. st.–Devínska N. Ves11076.80%72.94%
Zohor–Kúty11068.30%72.08%
Bratislava Petržalka–Kittsee AT 13775.30%
Žilina–BratislavaTrnava–Bratislava Rača12078.30%73.90%
Table 5. Congested rail infrastructure in selected European countries.
Country201420152016201720182019
Austria111111
Czech Republic000000
Germany111110
Hungary000010
Italy00000314 1
Lithuania000024
Netherlands401483
Norway533455
Poland100000
Romania445668
Slovakia000000
Sweden56461912
United Kingdom222222
1 In Italy, there had been no declaration of congestion until the regulatory body introduced a regulation on how to calculate the degree of congestion of each major section and defined thresholds that when exceeded must lead to a declaration of congestion, resulting in 314 macro-sections (not lines) being declared congested for the timetable of 2019 [10].
Table 6. Input parameters for Express train.
Train SequencingWagon/Locomotion Tare in TonsCapacity in Seats
Locomotive383–Vectron85-
WagonWagon type Number
Ampeer14854
Aeer14850
WRRmeer14848
Bdghmeer14347
Bpeer14364
Bmpeer24876
Bmz35066
Table 7. Access charges (minimum access package in the Slovak Republic).
Track CategoryMaximum Charges for Ordering and Allocating of Infrastructure CapacityMaximum Charges for Traffic Management and OrganizationMaximum Charges for Ensuring Serviceability of Railway InfrastructureMaximum Charge for the Use of Electrical Supply Equipment for Supply of Traction Current
U1i in €/Train Kilometers without DPHU2i in €/Train Kilometers without DPHU3i in €/Thousands of Gross Ton Kilometers without DPHU4 in €/Thousands of Gross Ton Kilometers without DPH
Train by TimetableAd-Hoc Train
1.0.06910.18900.9571.1020.228
2.0.05660.15750.9271.0480.228
3.0.04870.12070.8840.9450.228
4.0.03190.11120.7740.7790.228
5.0.02720.09810.5880.6700.228
Table 8. Comparison of costs on planned and diversion rail lines for passenger transport.
Costs ItemCosts in € Excluding VAT
Planned Rail Line Diversion Rail Line
Access chargesU14.3906.097
U263.33687.964
U342.56459.115
U48.80612.231
Energy97.692135.678
Driver 14.31924.309
Train crew36.50761.977
Locomotion 48.28981.979
Wagons64.500109.500
Total380.403579.850
Table 9. Costs for a planned rail line in the case of waiting for track release—rail passenger transport.
Waiting Time [min]Changed Cost in € Excluding VAT
DriverTrain CrewLocomotionWagons
1017.64944.99759.51979.5
2020.97953.48770.74994.5
3024.30961.97781.979109.5
4027.63970.46793.209124.5
5030.96978.957104.439139.5
6034.29987.447115.669154.5
7037.62995.937126.899169.5
8040.959104.427138.129184.5
9044.289112.917149.359199.5
10047.619121.407160.589214.5
Table 10. Track parameter.
Track SectionDistance [km]ElectrifiedMax. Length of Freight Train [m]Track Category
Planned trackDunajská Streda–Bratislava-Nové Mesto40.567Non6252
Bratislava-Nové Mesto–Bratislava-Vajnory9.475AC 25 kV 50 Hz6901
Diversion trackDunajská Streda–Komárno53.073Non6252
Komárno–Nové Zámky28.266AC 25 kV 50 Hz6201
Nové Zámky–Bratislava-Vajnory81.353AC 25 kV 50 Hz7001
Table 11. Cost comparison on planned and diversion rail line—freight transport.
Costs ItemCosts in € Excluding VAT
Planned Rail LineDiversion Rail Line
Access chargesU110.6557.575
U122.2963.004
U219.447109.290
U2237.60649.199
U3119.891230.124
U3267.49188.298
Energy48.857158.838
Driver19.31442.291
Locomotion30.74067.31
Wagons17.86439.116
Total254.160795.044
Table 12. Costs for a planned rail line in the case of waiting for track release—rail freight transport.
Waiting Time [min.]Changed Cost in € Excluding VAT
DriverLocomotionWagons
2025.97441.3424.024
4032.63451.9430.184
6039.29462.5436.344
8045.95473.1442.504
10052.61483.7448.664
12059.27494.3454.824
14065.934104.9460.984
16072.594115.5467.144
18079.254126.1473.304
20085.914136.7479.464
22092.574147.3485.624
24099.234157.9491.784
260105.894168.5497.944
280112.554179.14104.104
300119.214189.74110.264

