Article

Facilitating Physical Activity through On-Site Quantified-Self Data Sharing

1
Department of Industrial Design, Eindhoven University of Technology, 5612 AZ Eindhoven, The Netherlands
2
Obesity Center, Catharina Hospital, 5623 EJ Eindhoven, The Netherlands
3
Department of Electronic Engineering, Fudan University, Shanghai 200433, China
*
Author to whom correspondence should be addressed.
Sustainability 2020, 12(12), 4904; https://doi.org/10.3390/su12124904
Submission received: 21 May 2020 / Revised: 15 June 2020 / Accepted: 15 June 2020 / Published: 16 June 2020
(This article belongs to the Section Health, Well-Being and Sustainability)

Abstract

:
With the development of sensing technology and the popularization of quantified-self devices, there are increasing types of health-related data that can be sensed, visualized and presented to the user. However, most existing quantified-self applications are designed to support self-management and self-reflection; only a few studies so far have investigated the social aspect of quantified-self data. In this study, we investigated the social role of quantified-self data by introducing the design and evaluation of SocialBike—a digitally augmented bicycle that aims to increase the user’s intrinsic motivation in physical activity through on-site quantified-self data sharing. We conducted a controlled experiment on a cycling simulation system. Two forms of SocialBike’s on-bike display were evaluated with 36 participants. We used the Intrinsic Motivation Inventory to collect quantitative data about users’ intrinsic motivation in physical activity; the cycling simulation system recorded quantitative data about user behavior. Qualitative data was collected through semi-structured interviews. We conducted paired sample t-test to analyze both types of quantitative data; qualitative data were analyzed by the method of thematic analysis. The results show that SocialBike’s front display significantly increased users’ intrinsic motivation in physical activity. A total of nine themes were identified from the qualitative analysis, providing supplementary explanations for the quantitative results and additional insights into the overall design.

1. Introduction

Quantified-self application is widely used in sports and health management. Ubiquitous and wearable health-tracking devices can continuously record the user’s physiological and behavioral data. Through statistical analysis and visual presentation of quantified-self data, these applications can help users understand their health status, develop exercise plans, or manage their sleep. In addition to supporting users at the individual level, some applications also provide built-in social features, such as data sharing between friends and ranking of performance within a specific group. Even when using quantified-self applications without social features, some users will spontaneously share their tracking records to third-party social networks. The shared record can be a screenshot of the GPS track of jogging, the number of steps or distances the user has travelled, or the user’s continuous performance over a period of time. These phenomena indicate that quantified-self data has potential social attributes that can influence the interaction between people. However, the above-mentioned quantified-self data sharing are carried out in remote and off-site forms. When a set of data is shared, the activity that generated this data (running, walking, cycling, etc.) is no longer continuous. The data sharers and their audiences could also be in different spaces and physiological states. When the audience sees data or charts shared by others, it is difficult for them to experience the sharer’s actual feelings when performing the activity. Therefore, in the remote off-site data sharing, the gap in time and space has become a potential obstacle to building empathy between the sharers and their audience. In regular face-to-face communication, the gap in time and space does not exist; both verbal and non-verbal cues [1,2] can be used by the communicators. However, there is a lack of channels to share real-time digital information, such as quantified-self data in face-to-face social interaction.
In the background described above, we are committed to providing a channel for on-site sharing of quantified-self data. Therefore, in this article, we present the design and evaluation of SocialBike. This digitally augmented bicycle aims to increase the user’s intrinsic motivation in physical activity through on-site quantified-self data sharing. We chose bicycles as the carrier of our concept because cycling is not only a sustainable way of travelling but also a common physical activity with potential application scenarios of quantified-self data. Through the analysis of experimental data, we presented both quantitative and qualitative results regarding the main hypotheses that SocialBike increases user’s intrinsic motivation in physical activity and reduces the effect of the time/space gap obstacle. Based on the implementation process and experimental results, we discussed the relationship between motivation and competition, the influence of scenarios, as well as the advantages and limitations of on-site quantified-self data sharing.

2. Related Works

The novelty of this study lies in the on-site sharing of quantified-self data. Therefore, we reviewed two categories of related work. The studies in the first category investigated the application of quantified-self data in social scenarios, and they are relevant to this study in terms of the choice of data types and the mechanism of data sharing. The studies in the second category used digital technology to enhance on-site social interactions, and they are relevant to this study in terms of the innovation in media forms of on-site data sharing.

2.1. Quantified-Self Data in Social Scenarios

Although most existing quantified-self applications are dedicated to providing personal level support, there are some studies that investigated quantified-self data in social scenarios. Ivanov et al. [3] investigated the impact of four factors on patients’ sharing of self-tracked information, including health motivation (HM), perceived health status (PHS), the severity of health, and age. Epstein et al. [4] presented a sharing dimension framework that supports socially sharing of personal informatics data. They developed and discussed six sharing dimensions of personal informatics data, including Data Domain, Pre-processing, Sharing Trigger, Persistence, Post Content and Audience. Colley et al. [5] investigated the wearable presentation of tracked wellness data, and people’s perceptions and motivations for sharing it through a wearable display.
In innovative research at the application level, heart rate is a highly used data type. Hassib et al. [6] presented HeartChat as a mobile messaging application that integrates heart rate as a cue to increase the user’s awareness and empathy. Curmi et al. [7] designed HeartLink as an application that wirelessly shares biometric data online and receives feedback from the online community in real-time. Sonne et al. [8] developed a mobile application to enable competition based on users’ real-time heart rate data in the gym. In order to support social exertion experience, Walmink et al. [9] embedded a real-time heart rate display on the bicycle helmet. Mauriello et al. [10] presented “Social Fabric Fitness” as a wearable application to support group running. They used a dynamic e-textile on the back of runners’ shirts to display heart rate and pace.

2.2. Digitally Enhanced On-Site Social Interactions

Some researchers have used innovative media forms in face-to-face communication. Although quantified-self data is not the primary data source in these type of studies, the use of other information and digital forms in on-site social interaction is also related to our current study. Most research in this category is based on wearable products. Epp et al. [11] discussed the role of wearables as an extension of the body and a media of self-expression in a social context. Walmink et al. [12] presented an interactive helmet with LED display fuelled by sensor data to explore interaction techniques around wearable safety gear. Dierk et al. [13] presented AlterWear as an architecture for battery-free wearable displays supporting opportunistic interactions. They demonstrated new wearables enabled through the architecture with dynamic, fashion-forward, and expressive displays across several form factors. Among all the innovative media forms, glow effect is the most commonly used, especially in the design of e-textile [14,15,16] and wearable devices [17,18,19,20].
In addition to digitalizing everyday objects, some research expanded the expressive feature of existing forms of electronic devices, including smartwatches [21] laptops [22] and wristbands [23,24]. The original private display on these devices was converted into public interfaces to explore the social role of the devices.

3. Design and Simulation System

3.1. Design of SocialBike

SocialBike is a digitally augmented bicycle which aims to increase the user’s intrinsic motivation in physical activity through on-site quantified-self data sharing. It visualizes users’ real-time calorie consumption rate and enables them to compare their data with other users nearby. Each SocialBike has a front display and a rear display (Figure 1).
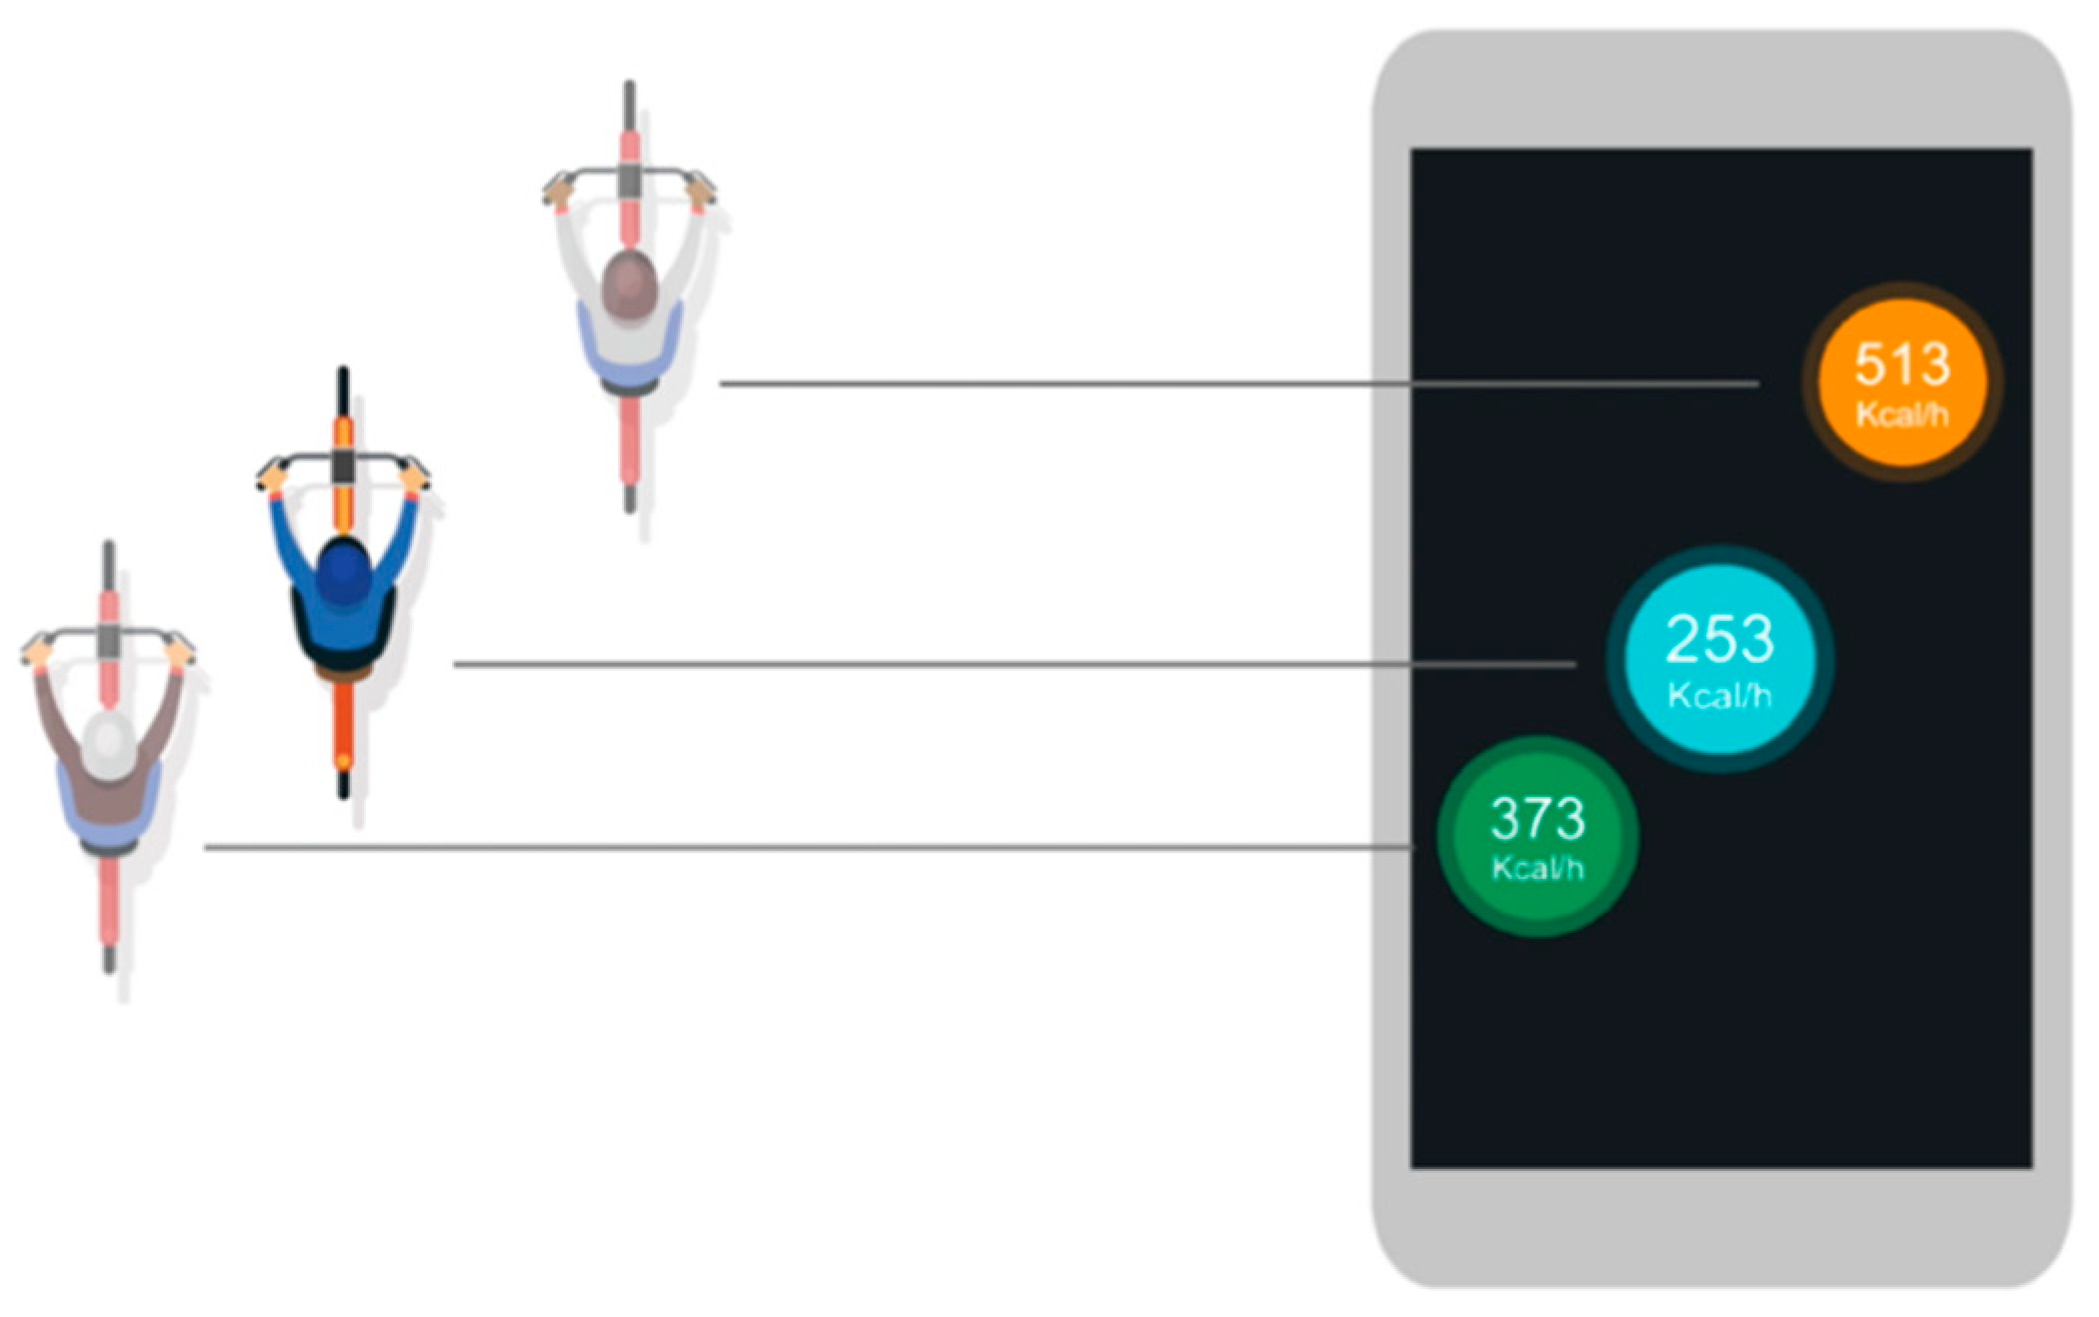
In the center of the front display, there is a circle showing the user’s calorie consumption per hour at the current riding speed. The color of the circle will change with the value; warm colors represent higher values, and cool colors represent lower values (Figure 2).
In addition, there is a breathing animation on the circle’s outer edge, and the animation speed also matches the value of the number. When there are other SocialBike users nearby, their circles will also appear on the user’s front display. The positional relationship between the circles corresponds to the real-time position of the cyclists on the road (Figure 3). The visible area of the front display represents a rectangular area in reality, which is eight meters wide and fourteen meters long. The rear display shares the same color coding and breathing animation rules as the front display, but only shows the user’s own calorie consumption rate. Users can turn on or off their rear display at any time by tapping the center circle on their front display.

3.2. Cycling Simulation System

To evaluate the design of SocialBike through rigorous controlled experiments, we built a cycling simulation system to simulate a realistic riding experience when using SocialBike. This system can simulate the user’s ordinary cycling experience, as well as the experience of riding on a SocialBike.

3.2.1. Simulating Ordinary Cycling Experience

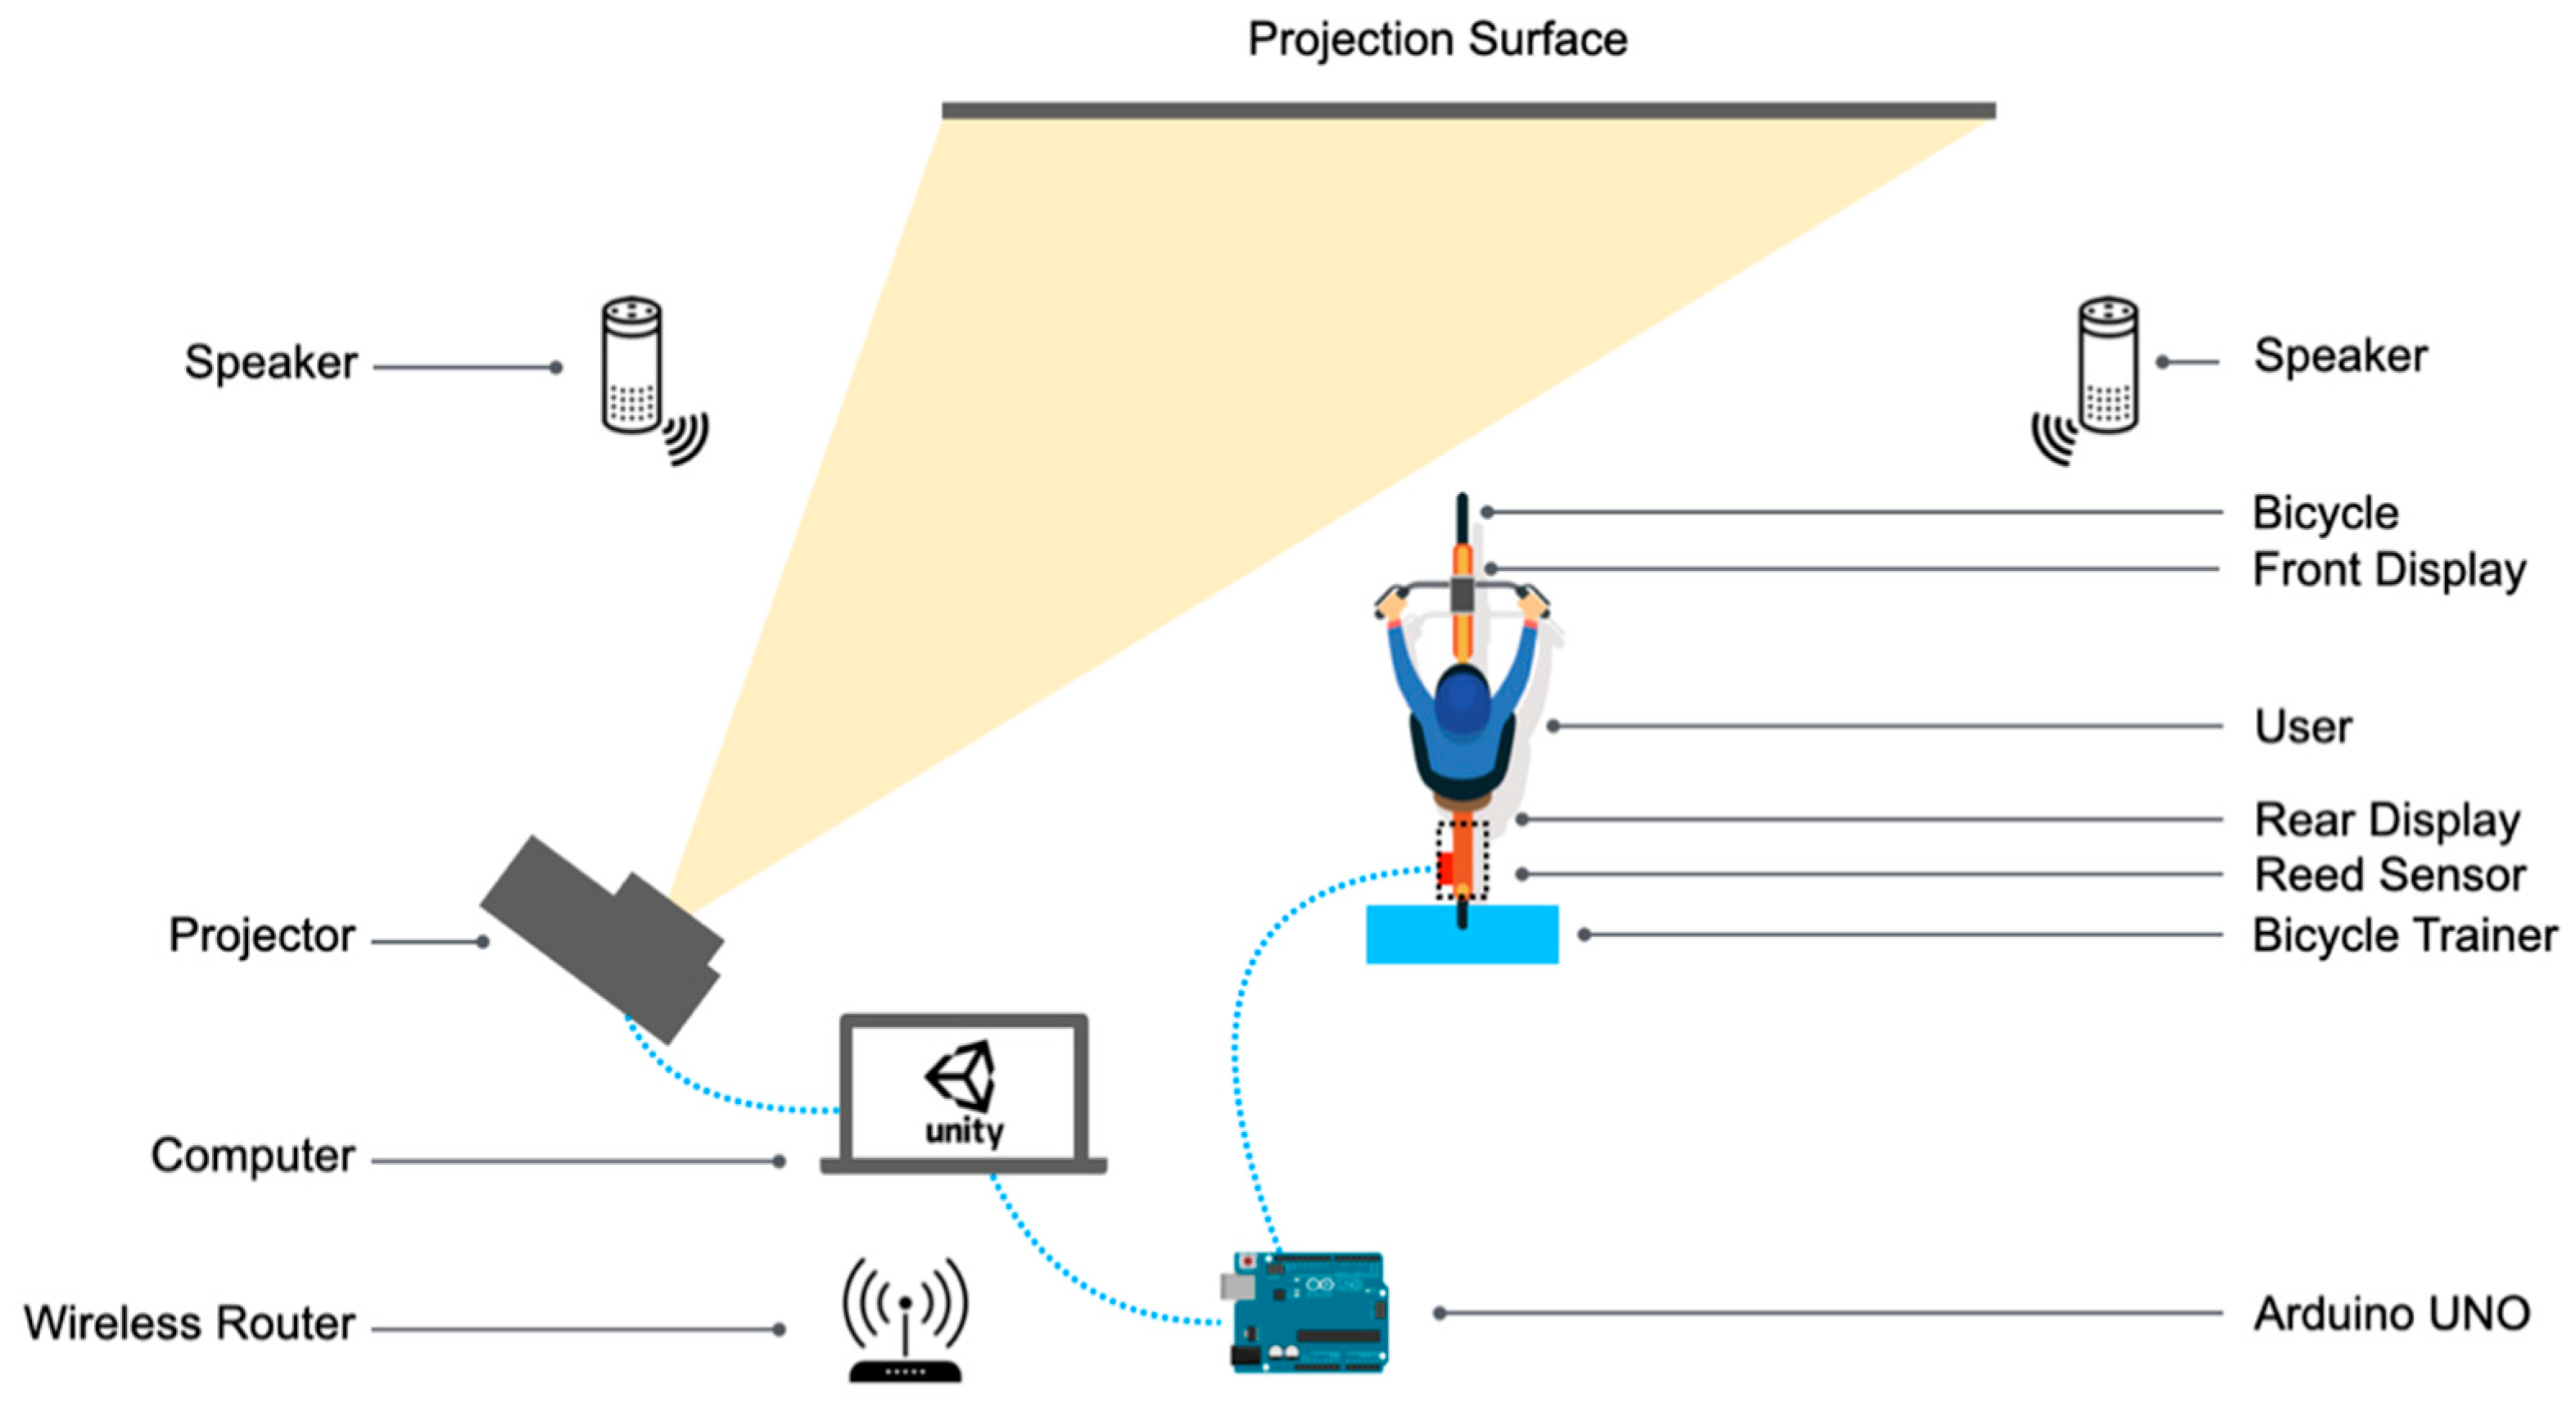
The simulation system mainly consists of a bicycle with a Reed switch and a simulation program projected in front of it (Figure 4).
The Reed switch was mounted on the bike frame near the rear wheel, and a magnet was clamped to the spokes of the rear wheel (Figure 5a). Each time the rear wheel turns 360 degrees, the reed switch sends a signal to the Arduino Uno board. Based on the interval between the received signals, we calculated the rotational speed of the rear wheels through an Arduino program. When the system is running, this speed value is continuously transmitted to the computer through a serial port.
In addition, a bike trainer is used to simulate the friction of the bike wheel rolling on the real ground (Figure 5b). Wireless speakers are placed on both sides of the bicycle to simulate ambient sound effects (Figure 4).
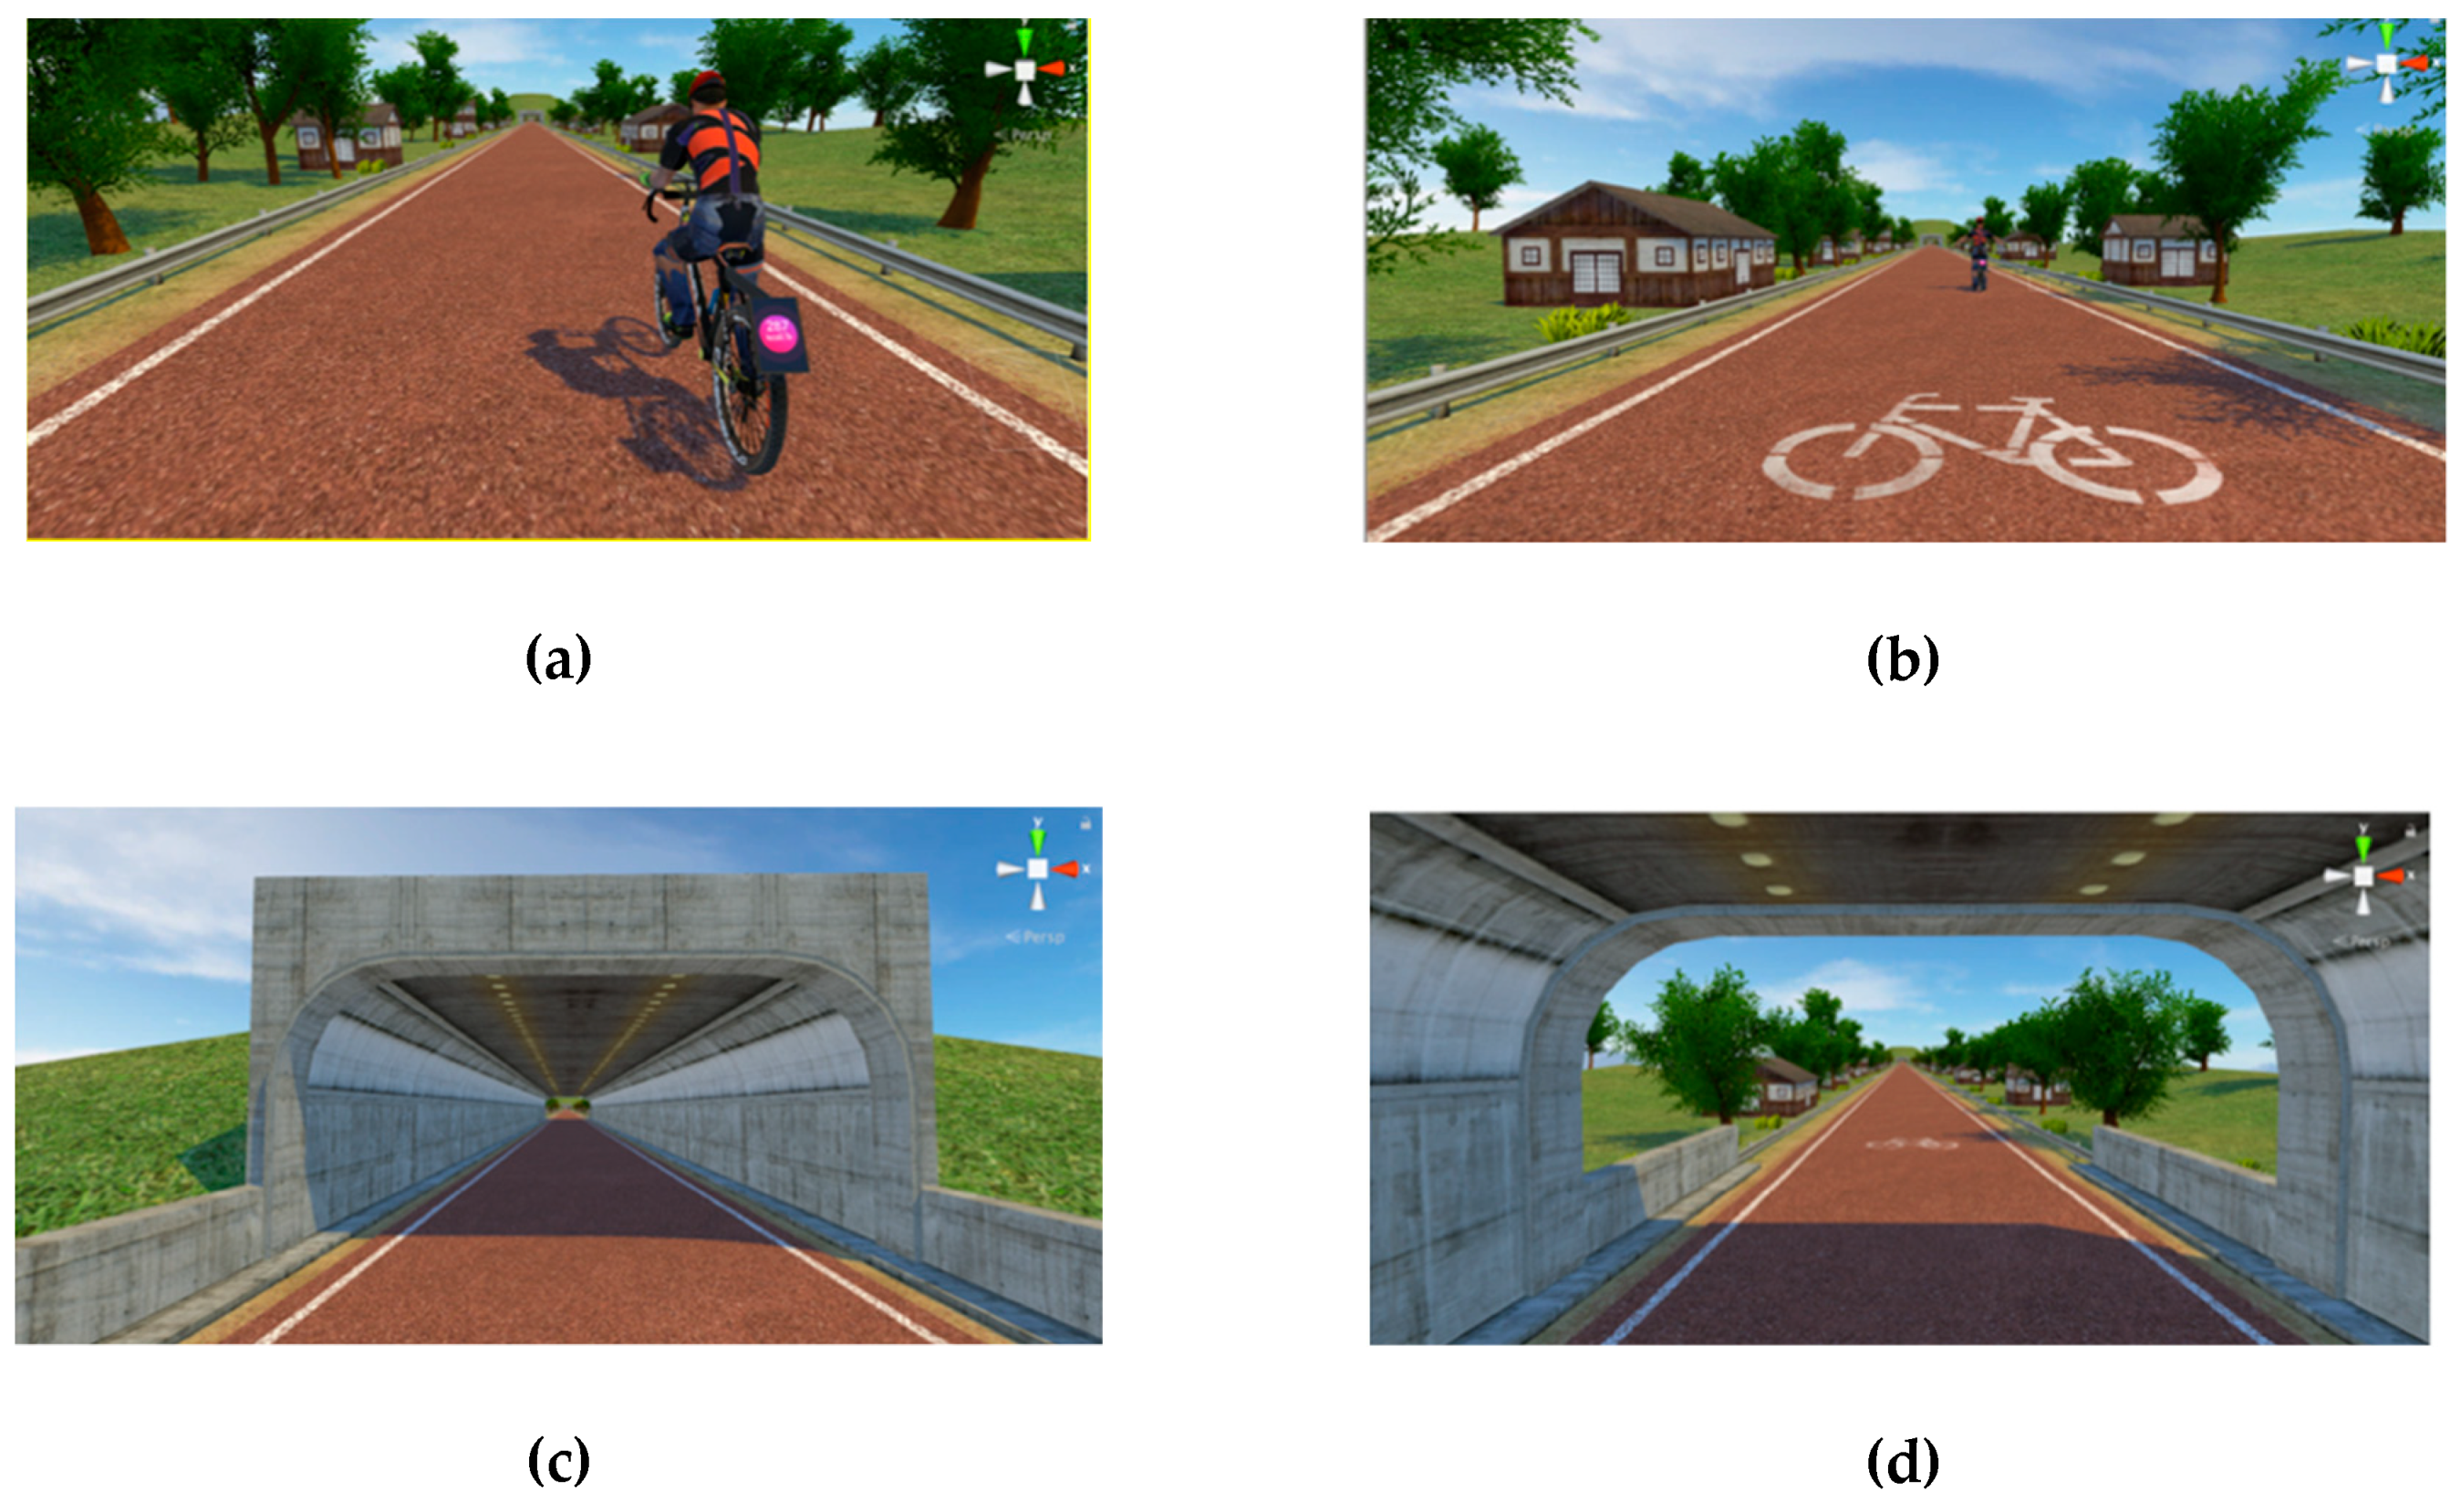
The simulated scene of the system was built with Unity 3D and running on a computer. The scene is projected on a large surface in front of the bike. When the computer receives the rational speed value from a serial port, the simulation program will convert it to line speed based on the diameter of the bicycle wheel. When the system is running, the user’s viewpoint in the simulation program is moving according to the line speed (Figure 6).
When designing the visual style of the simulated scene, the influence of the location factor was taken into account. This experiment was conducted in the Netherlands, and all the participants we recruited were living in the Netherlands. Therefore, we used the visual elements of the typical Dutch bicycle lanes in the simulated scene to make it as close as possible to the local appearance (Figure 7).

3.2.2. Simulating the Concept of Social Bike

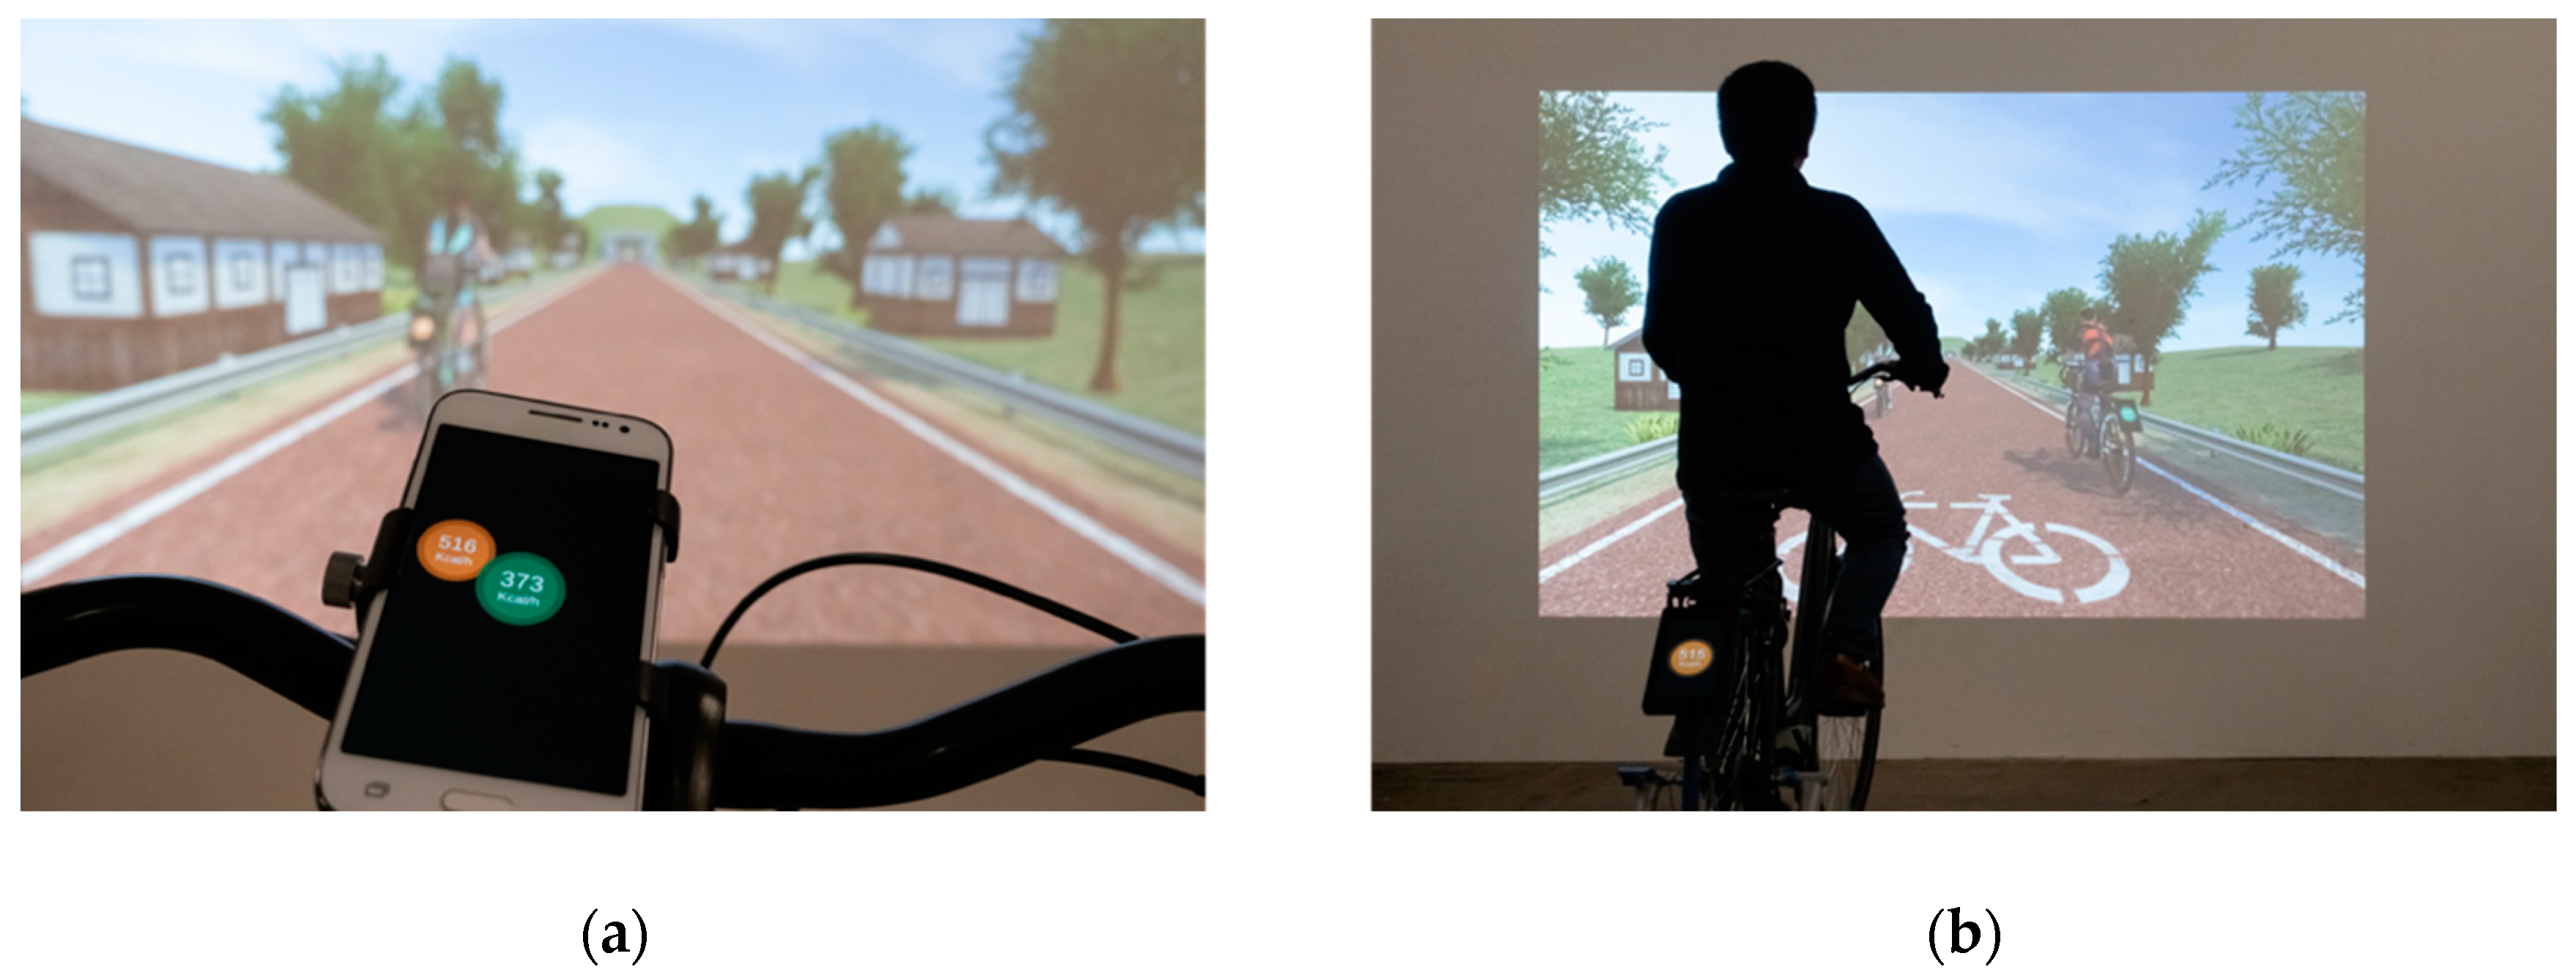
SocialBike’s front and rear displays are realized through mobile devices running Android programs. These programs are also built with Unity and can be connected to the simulation program running on the computer through a wireless router. When users are riding on the simulation system, their riding behavior is synchronized with the projected scene and the on-bike displays (Figure 8). The calorie consumption rate displayed on the interface is calculated by the following equations.
C a l o r i e   C o n s u m p t i o n   R a t e ( K a c l / h o u r ) = B M R × M E T s 24
B M R ( m a l e ) = 10 W + 6.25 H 5 A + 5
B M R ( f e m a l e ) = 10 W + 6.25 H 5 A 161
The two key parameters in Equation (1) are BMR (Basal Metabolic Rate) and MET (Metabolic Equivalent of Task) values. Equations (2) and (3) show the BMR calculation method for male and female. In Equations (2) and (3), W represents body weight (kg), H represents body height (cm), and A represents age [25]. MET values are used to calculate calorie consumption in specific physical activities. The MET values we used in this study were provided by the “2011 Compendium of Physical Activities” [26] and are related to users’ cycling speed (mph). We programmed the simulation system based on Equations (1)–(3). Before each experiment, we customized the system according to the participant’s gender, weight, height and age. Therefore, participants can see their real-time calorie consumption in the experiment.
Users will meet virtual cyclists riding their own SocialBike in the simulated scene, and the virtual rear displays also change in real-time according to the virtual cyclists’ riding behavior. In the meantime, the virtual cyclists’ data and distance relationship will also be synchronized to the user’s front display. As a result, users can seamlessly experience all the features of SocialBike in the simulation system.

3.2.3. Record Experimental Data

The cycling simulation system we built is not only a prototype of the design concept but also an experimental device. Therefore, we added a log function to the system. Before the start of each test, we can enter the basic information of the participants in the start interface (Figure 9). During the test, the system will record the participant’s real-time position, speed, and distance to other cyclists. After each test, a log file containing all the details of the user’s riding behavior will be generated [27]. This log function makes it easier to organize and analyze the experimental data.

4. Evaluation

4.1. Subjects

Thirty-six participants (22 males, 14 females, age range: 20–42 years) were recruited to participate in this study. All participants have experience riding regular bicycles in their daily lives. Each participant received a reward of 10 euros after the experiment.

4.2. Independent Variable

SocialBike’s rear display has been evaluated in the previous study [28,29]. Therefore, the purpose of this experiment is to evaluate the front display.
The independent variable in this experiment is the status of the SocialBike’s front display. The front display has three versions for its status in the experiment (Figure 10). Display A (Figure 10a) is used in the control group, showing a blank screen. Display B (Figure 10b) is a “personal data display” that presents the participants’ real-time calorie consumption rate. Display C (Figure 10c) is a “social data display” showing the real-time calorie consumption rate of the participants and other simulated cyclists nearby. The positions of the circles in Display C correspond to the real-time positions of the cyclists on the road.

4.3. Measurements

4.3.1. Quantitative Measurements

In this experiment, we collected two types of quantitative data. Quantitative data about users’ intrinsic motivation for physical activity was measured by the IMI (Intrinsic Motivation Inventory) questionnaire [30]; quantitative data about user cycling behavior was recorded by the log function of the cycling simulation system.
The IMI questionnaire has seven subscales, including Interest/Enjoyment, Perceived Competence, Effort/Importance, Pressure/Tension, Perceived Choice, Value/Usefulness, and Relatedness. The first sub-scale (Interest/Enjoyment) is considered the self-report measure of intrinsic motivation, which is the primary measurement in this experiment [30].
Two indicators were extracted from the participants’ cycling behavior data, which are the participants’ average speed in each test (Overall Average Speed) and the average speed when there are other cyclists within ten meters on the Y-axis (Social Average Speed). We set a range of ten meters for the “Social Average Speed” because the participants can clearly see other cyclists in this distance from the simulated scene. We conducted paired sample t-tests on both types of quantitative data to evaluate the effect of the SocialBike’s front displays.

4.3.2. Qualitative Measurement

Qualitative data was collected through semi-structured interviews to gain additional insights into the influence independent variable and the overall design of SocialBike. Qualitative data was analyzed by the method of thematic analysis [31,32].

4.4. Setup

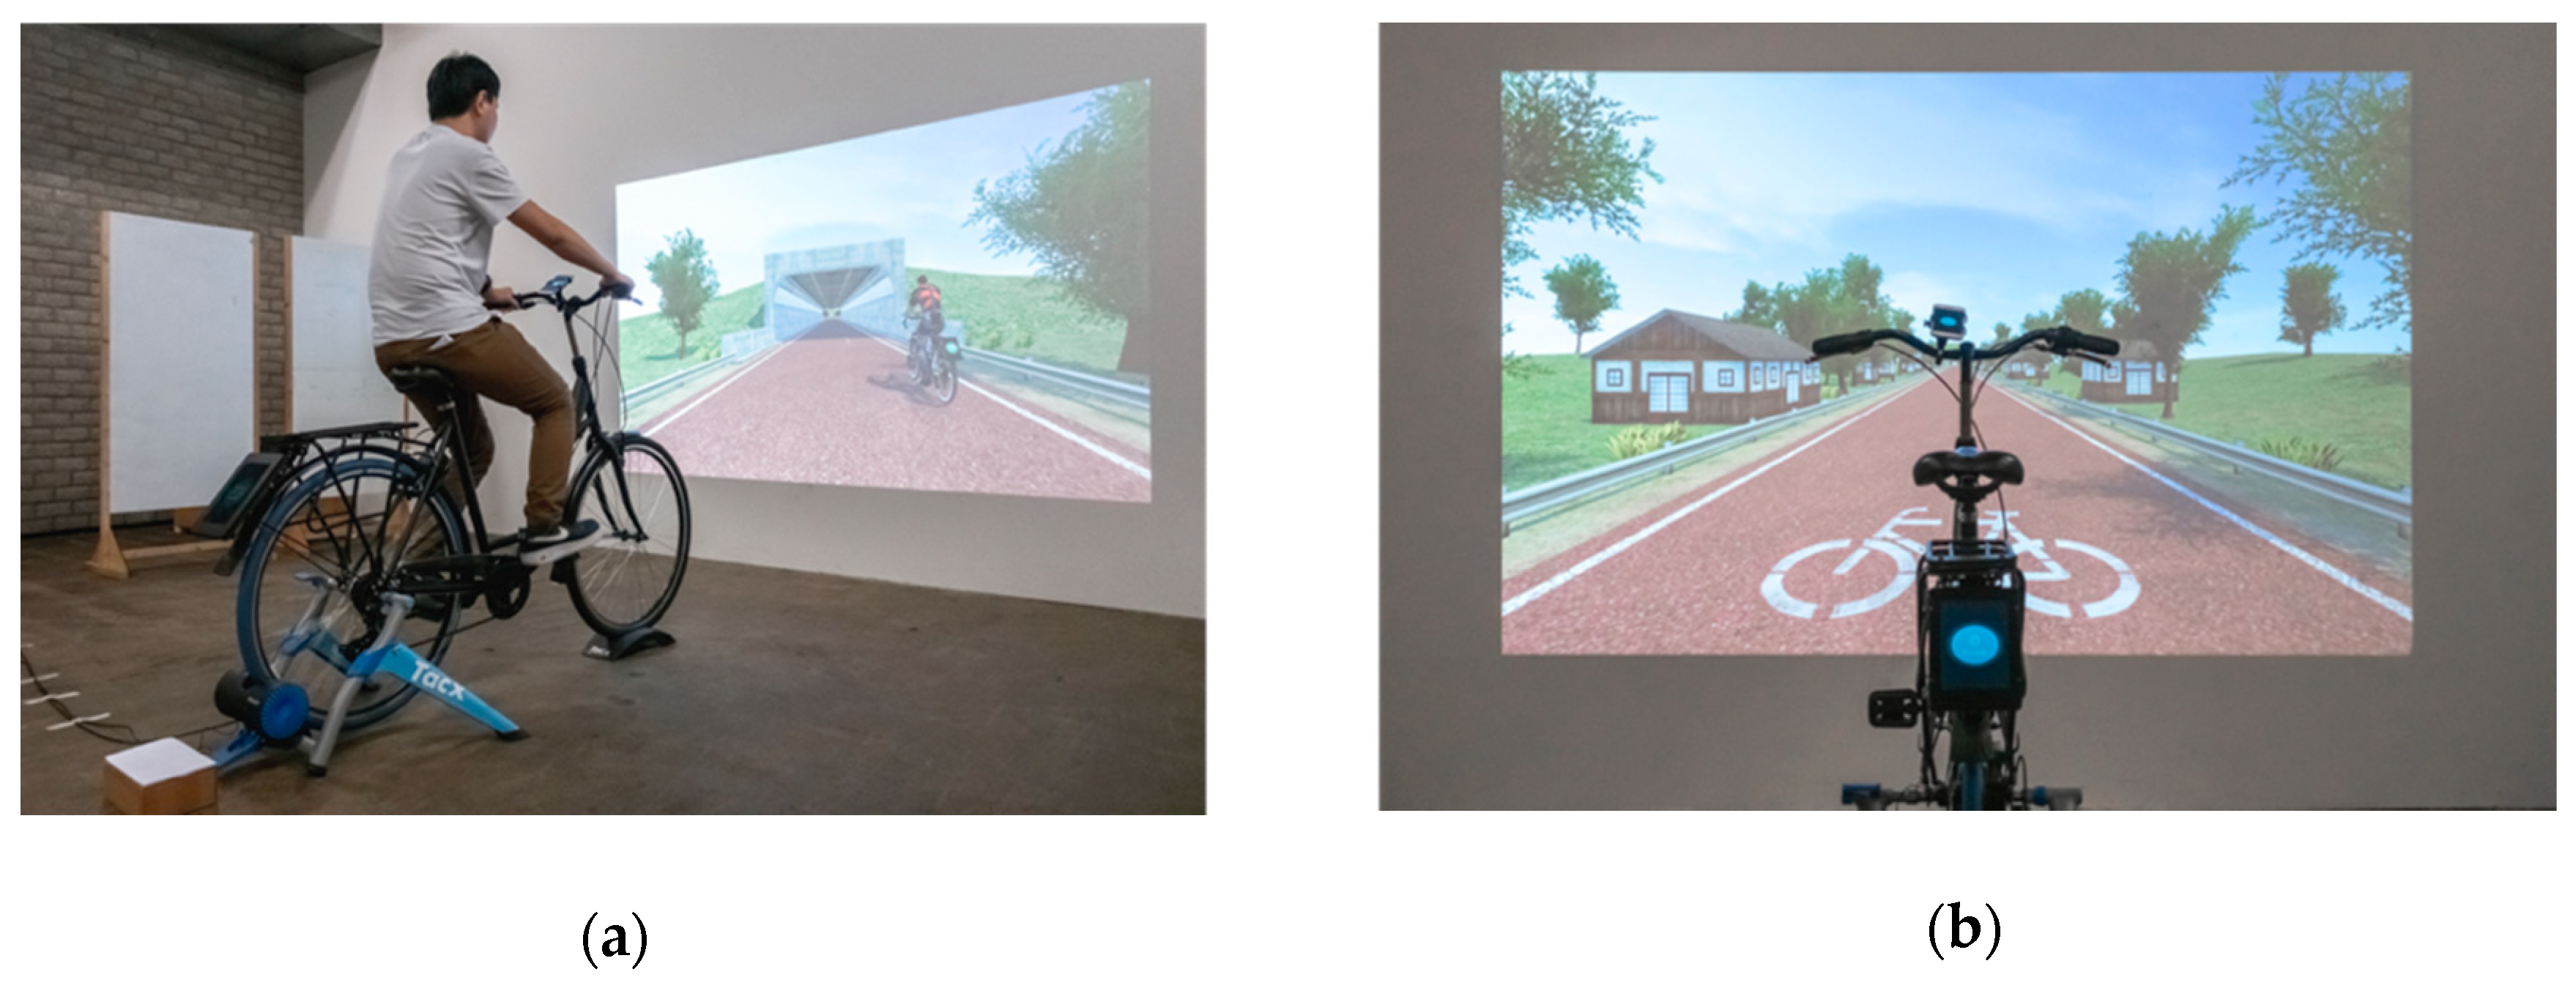
The cycling simulation system we introduced in Section 3.2 (Figure 4) was set up in a laboratory (Figure 6). The front display is mounted on the bicycle’s handlebar. We projected the simulated scenario on a white surface in front of the bicycle. To improve the fidelity of the simulation system, we calibrated the size of the projection area and the position of the bicycle based on the simulated scene. Most experimental devices were placed outside the user’s field of vision, except for the bicycle, the front display, and the projection surface.

4.5. Procedure

Participants were asked to read and sign a consent form before the formal experiment. After that, each participant had two minutes to try the simulation system with an empty scene.
A within-subjects design was used in this experiment. Therefore, in the formal experiment, each participant experienced the SocialBike with three different versions of the front display status (Figure 10) in three sessions. In each session, participants were asked to ride five minutes in the simulated scenario and complete an IMI questionnaire. Between sessions, participants had 15 min to rest and complete the questionnaire.
To eliminate the possible carry-over effects of the session order, we randomly divided the participants into six groups and conducted the three sessions in six different orders.
A semi-structured interview was conducted at the end of each experiment. The average length of the interview was 13 min. The interviews were recorded by audio and transcribed by the researcher.

5. Results

5.1. Quantitative Results

5.1.1. Results of the Intrinsic Motivation Inventory

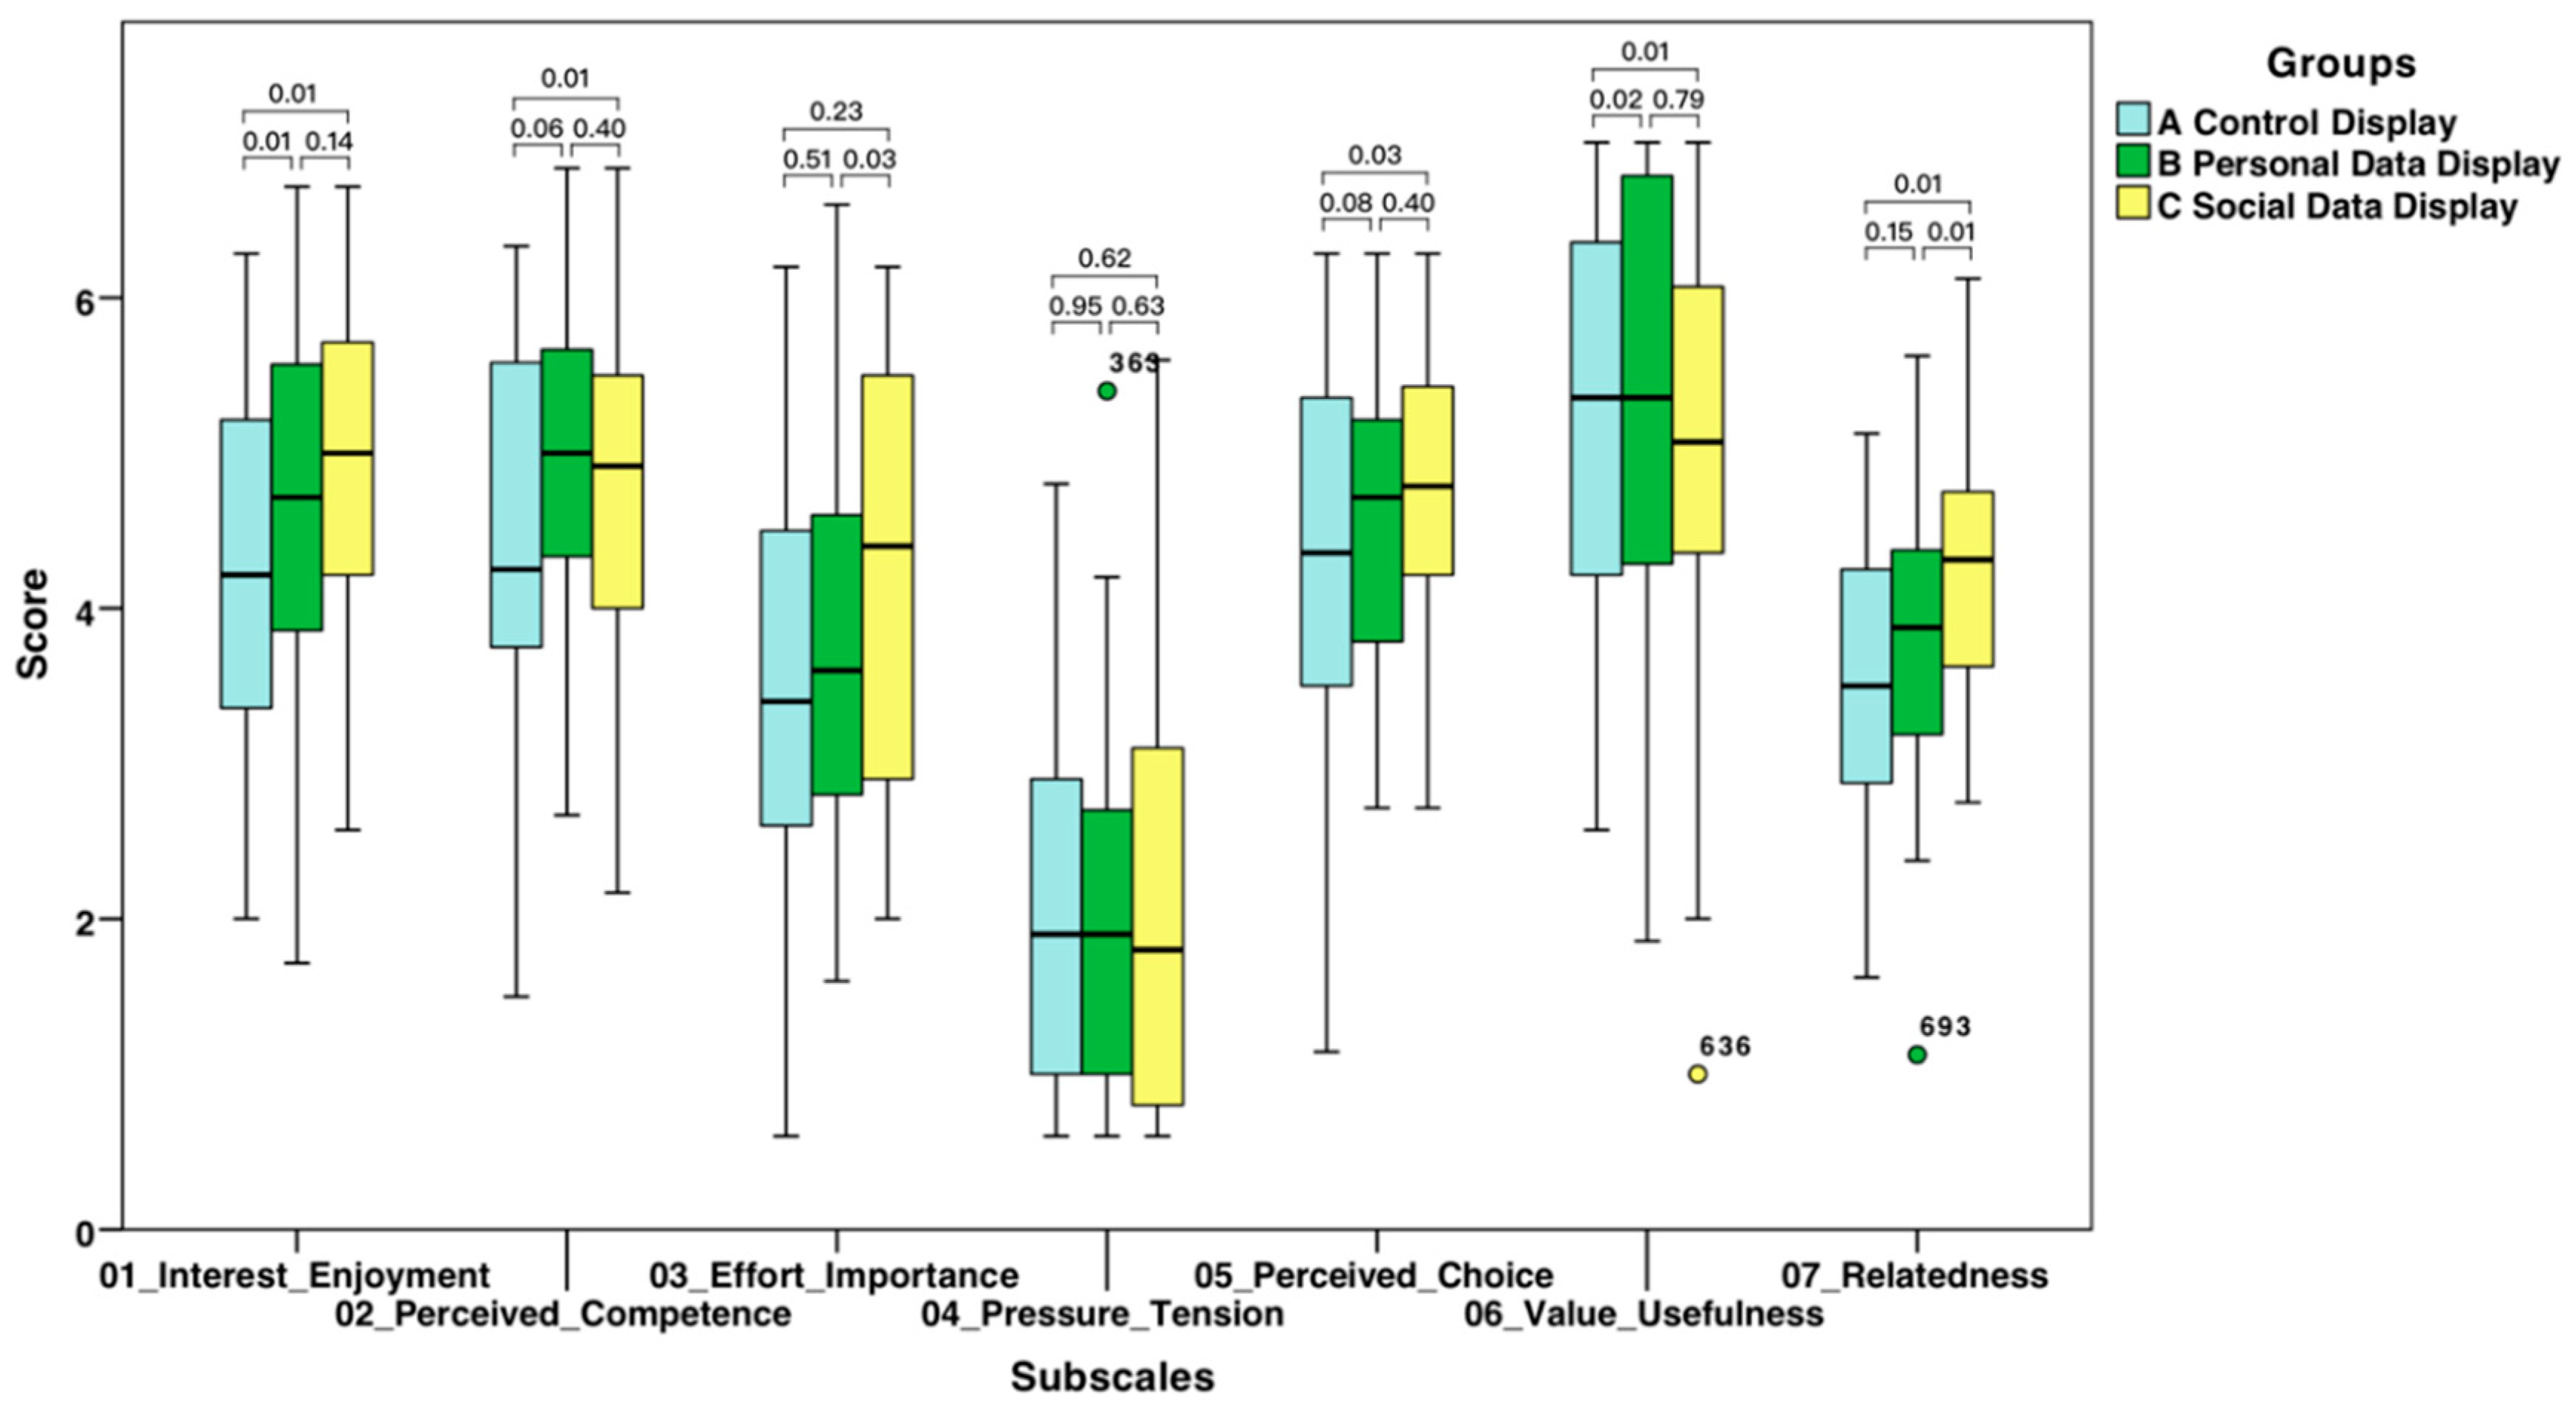
Three paired-sample t-tests were conducted in the comparison of Group A (Control Group), Group B (Personal Data Display), and Group C (Social Data Display) (Figure 10). The results are summarized in Table 1 and Figure 11.
In the comparison of Group B and Group A, the score of Group B is significantly higher than Group A on two subscales, which are “Interest/Enjoyment” (p = 0.0127) and “Value/Usefulness” (p = 0.0165). There were no significant differences between the two groups on other subscales.
In the comparison of Group C and Group A, the score of Group C is significantly higher than Group A on five subscales, which are “Interest/Enjoyment” (p = 0.0027), “Effort/Importance” (p = 0.0029), “Perceived Choice” (p = 0.0267), “Value/Usefulness” (p = 0.0074) and “Relatedness” (p = 0.0001). There were no significant differences between the two groups on other subscales.
In the comparison of Group C and Group B, the score of Group C is significantly higher than Group B on two subscales, which are “Effort/Importance” (p = 0.0328) and “Relatedness” (p = 0.0002). There were no significant differences between the two groups on other subscales.

5.1.2. Results of Users’ Cycling Behavior

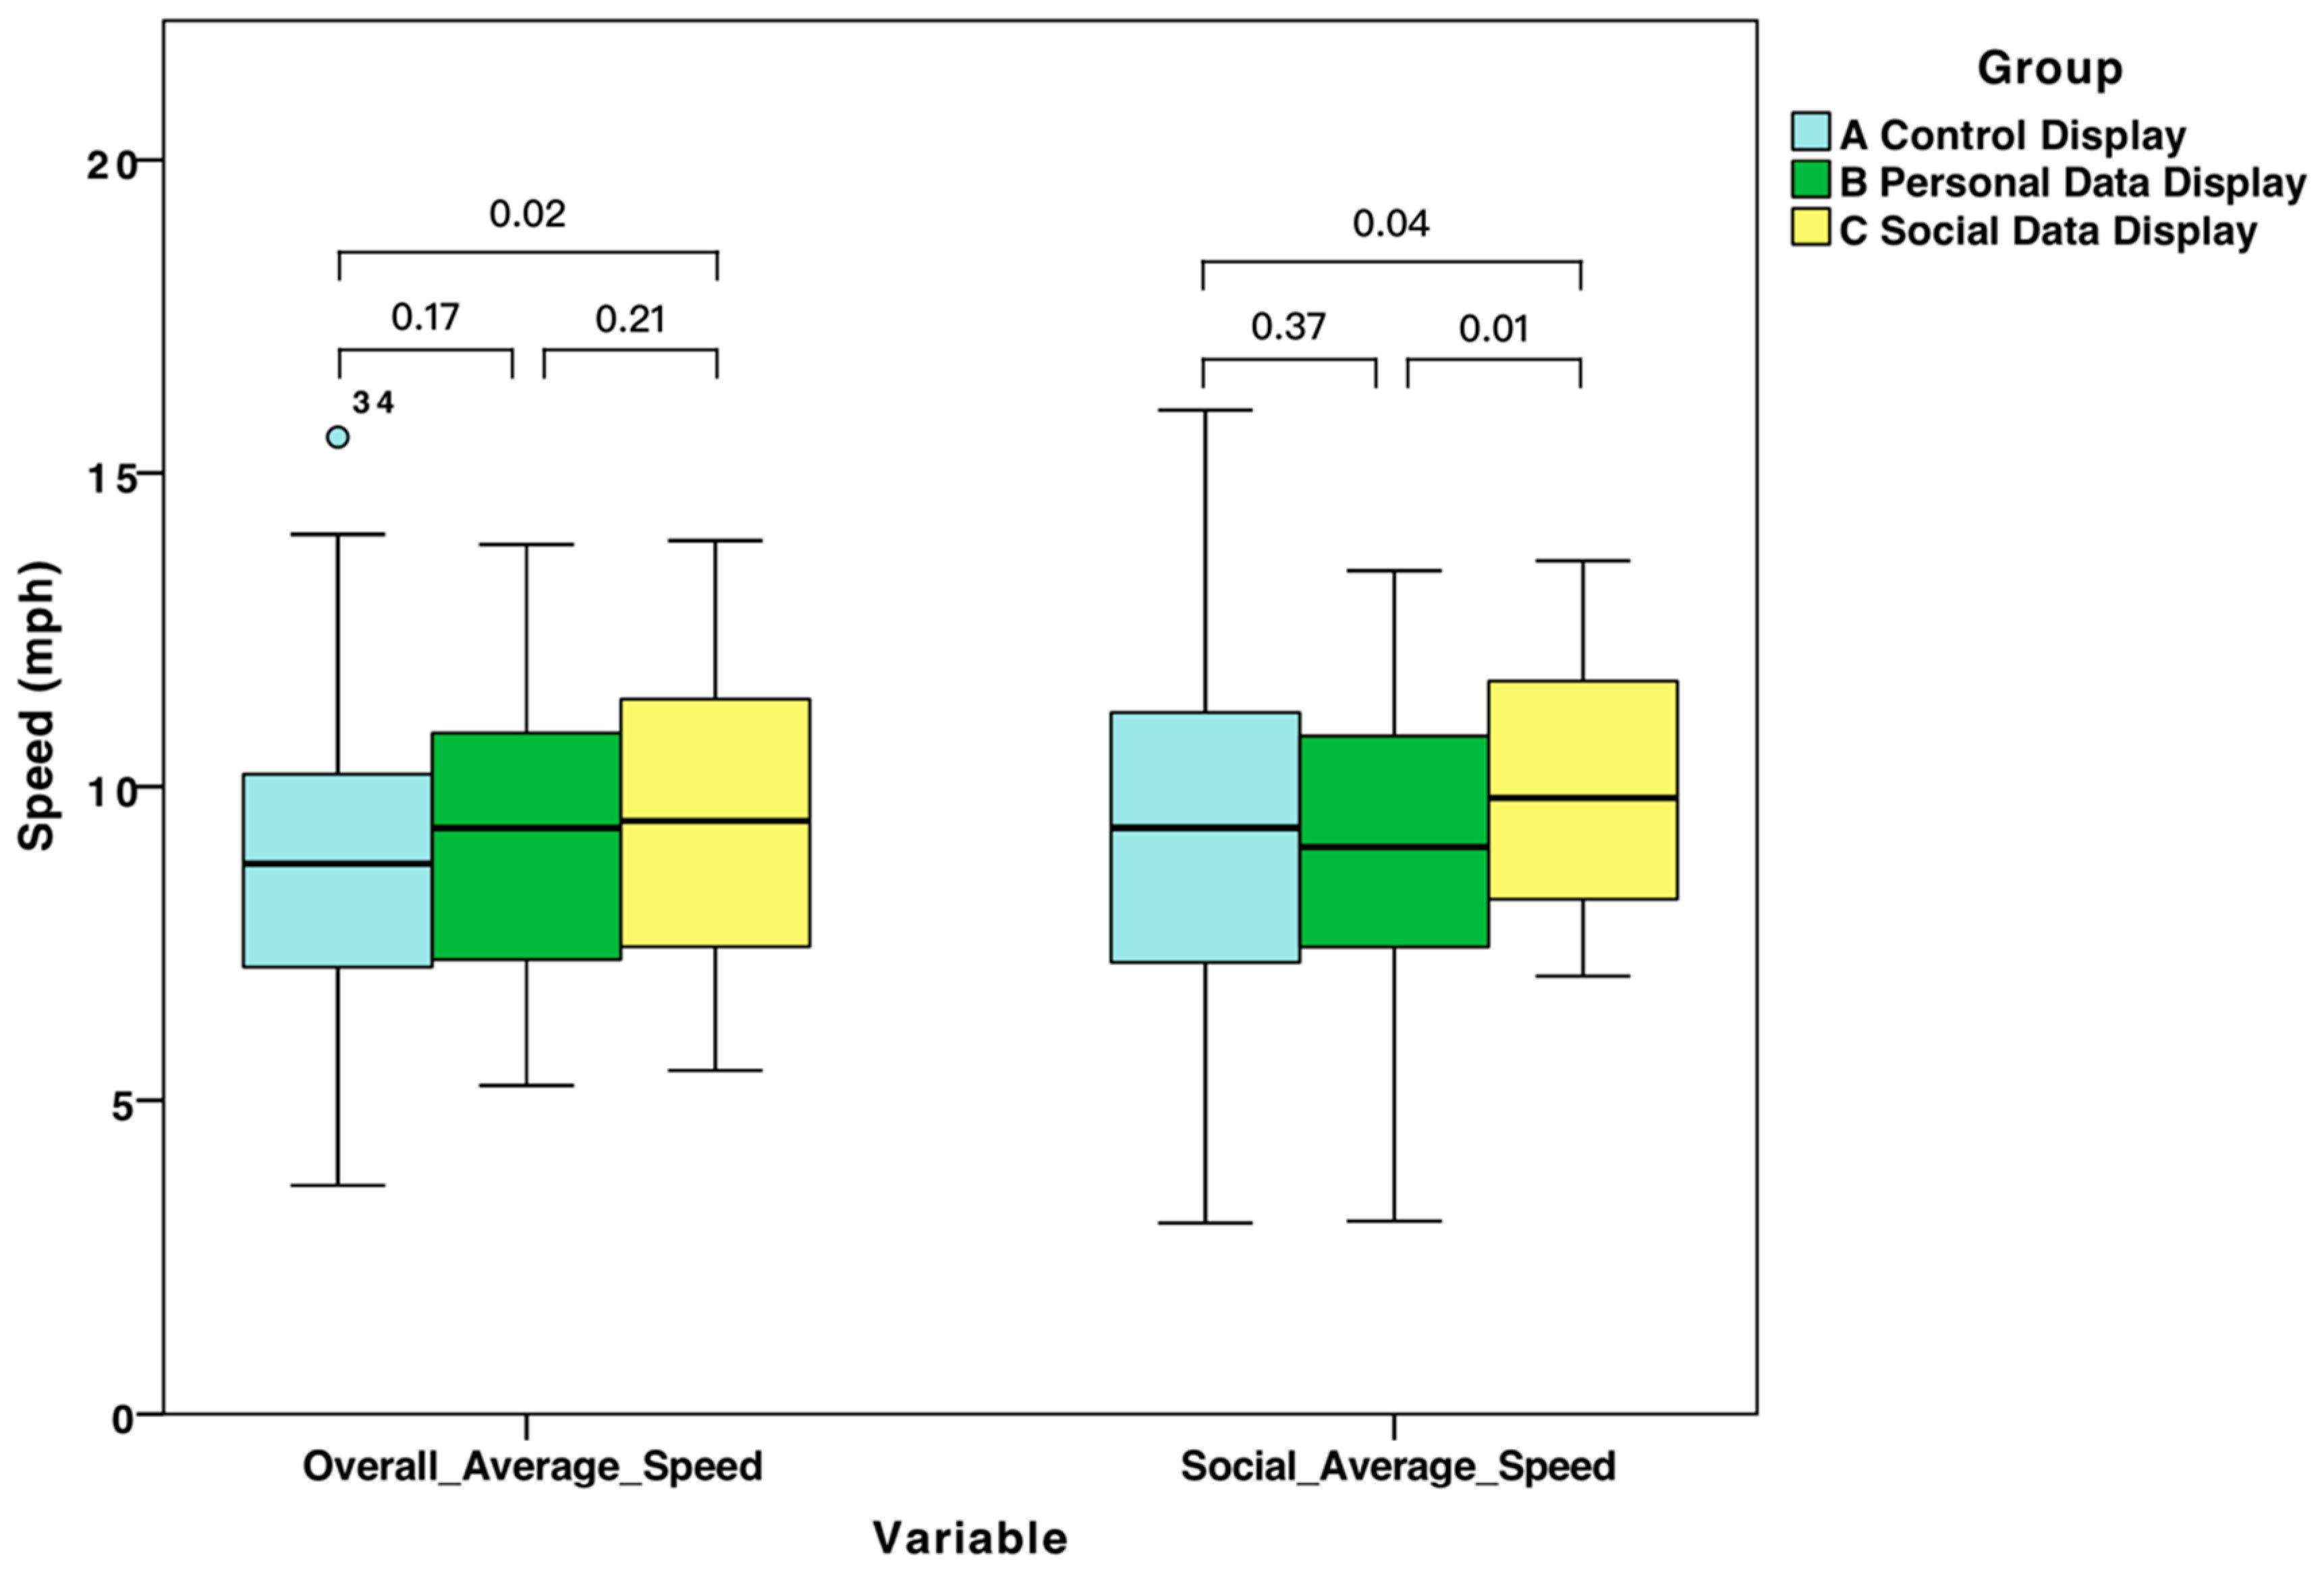
Three paired-sample t-tests were conducted in the comparison of Group A (Control Group), B (Personal Data Display) and C (Social Data Display) (Figure 10). The results are summarized in Table 2 and Figure 12.
In the comparison of Group B and Group A, there were no significant differences between the two groups on both “Overall Average Speed” (p = 0.1708) and “Social Average Speed” (p = 0.3726).
In the comparison of Group C and Group A, the value of Group C is significantly higher than Group A on both “Overall Average Speed” (p = 0.0184) and “Social Average Speed” (p = 0.0432).
In the comparison of Group C and Group B, the value of Group C is significantly higher than Group B on “Social Average Speed” (p = 0.0022). However, there is no significant difference between the two groups on “Overall Average Speed” (p = 0.2087).

5.2. Qualitative Results

Nine themes were identified from the thematic analysis of qualitative data including “Preference for Front Display Types”, “Source of Motivation”, “Influence of Performance Gap”, “Influence of Use Scenarios”, “Influence on Social Behavior”, “On-site Sharing versus Off-site sharing”, “Data Visualization”, “Rear Display and Privacy Concerns” and “Opportunity for Further Development”. Table 3 shows an overview of the qualitative results. We explain each theme in detail in the following sub-sections.

5.2.1. Preference for Front Display Types

In this study, each participant experienced three different front displays of the SocialBike, including a “blank display (A)”, a “personal data display (B)” and a “social data display (C)” (Figure 10). Twenty-nine (80.56%) participants expressed their preference for Display C. The main reason is that Display C provides more information about other cyclists nearby and gives participants the opportunity to compare their performance with others: “I can already tell who was going to overtake me, and how fast he was riding (P24).” “It’s more interesting, and you can see what speed they are coming. Also, how much energy I was consuming compared to others. It gives me some motivation to keep the same speed as them (P33).” One of the twenty-nine participants stated that he used other cyclist’s data in Display C as a reference for his own rides: “If I see others that are passing through me, I can put my goal into the faster one, so I can ride faster (P22).”
Seven (19.44%) participants preferred Display B, which only showed their own calorie consumption rate, without information about others around them. Three of the seven participants stated that they were more interested in their own cycling data than others’ data: “I only care about how many calories I burned, I don’t care about other people’s data (P34).” Three participants preferred Display B because they felt that Display C brought too much competition or pressure to them: “It (Display C) becomes a competition for me. I put a lot of effort into this part. I see a girl passing by me. I tried to chase her but can’t make it. So, I kind of disappointed myself (P10).” “This (Display C) gives me pressure, so I don’t like it, but I know my performance is better (P25).” The remaining participant (P7) stated that she would prefer Display C when the people around her were her friends. Otherwise, she would prefer Display B.

5.2.2. Source of Motivation

Competition is the most mentioned source of motivation. Twenty-two (61.11%) participants stated that they experienced the existence of competitive elements during the experiment (Test C): “I feel more competent when doing this thing because I can see others’ data (P32).” “She was going faster than me, so I began to compete with her (P28).” The competition had also led to changes compared to participants’ regular cycling behavior: “With this, I want to compete with others, so I speed up; otherwise, I will keep at an easy speed (P4).” “I can compare with others. It allows me to improve a bit from my comfort pace (P19).” “Without this app, I would not compare with others… Now the numbers are shown. It motivated me to make some changes in riding (P17).”
Regarding Test B, “Curiosity” was mentioned by five (13.89%) participants. Four of them believe their riding behavior was influenced by their curiosity about other cyclists’ data: “Their data made me curious. I know the person in front of me was fast. I want to see how fast she is… I think curiosity gives me more motivation than performance (P2).” The other participant explored the color change effect on the front display by changing her riding speed: “I am curious about the color. I want to see what is the ‘fastest’ color (P12).”

5.2.3. Influence of Performance Gap

Although participants were motivated by competition, the level of performance also affects their riding behaviors in competition. Twelve (33.33%) participants stated that they experienced a performance gap with other cyclists nearby: “I tried to catch up with her, but later I found that she was too fast, so I slowed down, and ride with the slow one (P6).” “I have tested what it feels like from 200 (Cal/h) to 1000 (Cal/h). The one on the left has been around 500 (Cal/h), and I can imagine that I can’t keep up to that speed (P2).” “I do like some kind of competition, but I don’t like this competition, because she is really fast (P36).” Three of the twelve participants said they preferred to ride with people with similar performance: “I will ride with people who perform similarly to me… we could become competitive partners in this sport (P19).” “It will be interesting when everyone’s performance is similar. We can catch up with each other. This will keep me investing in this activity (P16).”
Two of the twelve participants mentioned that they were concerned about the health risks associated with excessive exertion in the competition: “If my heart situation is not as good as hers, it might be risky for me… I tried, but I start to get tired, so I stop chasing her (P8).”

5.2.4. Influence of Use Scenarios

In this experiment, we simulated a relaxing cycling scenario. However, users may use SocialBike in different scenarios in their daily lives. Five (13.89%) participants mentioned the potential impact of use scenarios on their cycling motivation and performance: “It depends. If I have a class, I’ll want to keep it a little bit slower. Not be drowned in sweat… If I have a more suitable clothes, I will perform better. Sometimes I really want to catch up with the fast rider (P23).”
Two of the five participants stated that a clear commuting purpose might reduce their motivation for exercise: “If I have a clear purpose, it will have less impact on me (P21).” “If I just have some tasks to complete, then there won’t be that much motivation (P18).” One of the five participants expressed his consideration of traffic conditions: “If the traffic was too busy, I might worry about safety. It would be better if I was riding in the countryside (P4).”

5.2.5. Influence on Social Behavior

The influence of SocialBike on participants’ social behavior can be divided into two situations: riding with strangers and riding with acquaintances. Six (16.67%) participants mentioned that SocialBike could be a trigger for social interaction with strangers: “It kind of gives you a reason to establish a connection… gives you something to start off. Even they are not my friends (P24).” “This is an opportunity to open a conversation. It could be embarrassing to talk with strangers, but if you are using the same system at the same time, it is easier to start (P15).” Two of the six participants were interested in the same stranger they met multiple times using SocialBike: “I want to know how many times I have met him. If I meet him several times, I will be more familiar with him and more willing to interact with him (P16).”
Seven (19.44%) participants believed that SocialBike would have a more significant impact on their interactions with acquaintances. Two of them emphasized the competitive relationship when they ride with friends: “Riding with friends will be more competitive. They will always want to overtake you. The competition is more continuous (P28).” “It will impact a lot, especially riding this with my friends. It’s going to be more engaging, like ‘I am beating your score!’… It is more relaxing, and there is no pressure at all (P36).” Others emphasized the supportive relationship with friends: “If I am faster, my data will help him to keep along with me. If he is faster, his data will help me to keep along with him (P32).” “If I can interact with friends next to me when doing exercise, it will help me a lot. It will reduce my pain, let me not only focus on exercise (P7).”

5.2.6. On-Site Sharing versus Off-Site Sharing

SocialBike provides users with the opportunity to share their real-time data on-site. This means that changes in users’ riding behavior are instantly reflected in the data they are sharing. Meanwhile, off-site sharing of health-related data is also widespread in the existing social networks. Therefore, in the interview, we asked participants about the forms of health data sharing they have seen in their daily lives, and we let them compare these sharing forms with SocialBike.
Twenty-three (63.89%) participants stated that they had seen some form of health-related data shared by their friends on social networks, including screenshots from tracking applications for jogging, walking, marathons, photos in the gym, etc. However, most (86.96%) of them said they were not attracted or influenced by these posts they saw: “I saw this and knew that he did some exercise, but I didn’t care about the details, I wouldn’t compare myself with them (P20).” “My friend and cousin are doing this, but it never influenced me (P36).“ Three (13.04%) of them showed a positive attitude towards this form of sharing: “I feel happy for them. I feel motivated to do that (marathon), but I have never done that (P25).” “I have seen people sharing on Facebook; if they are my friends, I want to do the same thing (P32).”
When comparing SocialBike with the above off-site data sharing forms, two advantages, and one disadvantage of SocialBike were mentioned by the participants. Seventeen of the twenty-three (73.91%) participants believed that SocialBike had an advantage in improving their motivation for exercise: “This one is encouraging me more than just posting it on Facebook afterwards, it encourages me to use the bike to work out (P21).” “On the social network, its influence happens only in the next session of my exercise. Here (SocialBike) it is already showing data alive; I can myself make it better immediately when I am doing the exercises (P31).” “Sharing data when I was doing this activity will have more impact on the activity (P14).“ Five of the twenty-three (21.74%) participants stated that the on-site data sharing through SocialBike could make them feel more connected to other cyclists: “I can not only see the data but also to see the real person. Like a role model. If he is fit and I want to lose weight, I will ride with him (P4).” “The feeling of the moment can’t be taken home… because you are doing the same thing with me, so I pay more attention to the data you shared. If you are at home, our connection is weak (P16).”
Three of the twenty-three (13.04%) participants expressed their concerns about the real-time data shared through SocialBike. They stated that real-time data might not fully reflect the cyclist’s efforts over a period of time: “If I have been riding for a long time, I feel tired, and then I slow down, but the person just saw me might think I’m not riding hard (P10).”

5.2.7. Data Visualization

On each display of SocialBike, there are three indicators of the user’s calorie consumption rate, including a changing number, color change of the inner circle, and a breathing animation effect of the outer circle (Figure 10). Twenty-eight (77.78%) participants stated that the color change was more attractive to them, mainly because it was more intuitive and obvious than the other two indicators: “Color is more intuitive. If there are many people on the road, you can tell who is with me based on the color. I will ride closer to them if their color is similar to mine (P2).” “If I were the only one, I might focus on the number, but now there are other people, so I focused more on the color (P18).” “Color was first drawn to my attention and I observed the numbers when the colors were similar (P35).”
Eight (22.23%) participants paid more attention to the changes in the numbers: “I focused on numbers first, it was something that really controlled by my speed. Color can be a side message (P17).” Fourteen (28.89%) participants noticed the existence of the breathing animation of the outer circle. However, only three of them realized that the speed of the animation was also mapped to their calorie consumption rate. The main reason is that the animation was too subtle and took more attention to be noticed: “I can see the change in color even if I am not staring at the screen. For the animation, I need to look at it for two or three seconds (P25).”

5.2.8. Rear Display and Privacy Concerns

The rear display (Figure 1) in this experiment is not an independent variable, and it has consistently shown the rider’s calorie consumption rate in all the three tests. In order to gain more insights into the complete design of SocialBike, we also asked the participants about their thoughts on the rear display.
Due to the presence of the front display, the rear display did not attract much attention from the participants. Five (13.89%) participants expressed their interests in the rear display of others: “It attracts me to go closer to other people and interact with them (P15).” One of them stated that he was actually trying to reproduce the relationship presented in Display C (Figure 10) using other people’s rear displays in Test B: “I was trying to develop a relationship like this (Display C) from other people’s displays (P35).“ However, when Display C was provided, he no longer cared about the rear display of others. Only one of the five participants expressed a clear preference for other cyclists’ rear display compared to her own front display: “I like the back display for the others, on their bike, but not on my phone. From the back, it was more connected to them; this is interesting (P9).”
Most participants (80.56%) do not worry about the privacy issue of their own rear display. They believe that this data does not reveal much personal information. Four participants said they were willing to share their data because other cyclists nearby were using the same application (SocialBike): “Because I can also see other people’s data, everyone is sharing… It is not a shameful number (P17).” “When I am showing mine, others are showing theirs; so it is okay (P25).”
Five (13.89%) participants stated that they would only share their real-time data on the rear display. If the data is historical data over a period of time, they will keep it for themselves: “I want to know more about my own riding information, such as distance… But I only want to share the real-time data. Historical data has some privacy issues (P5).”
Two (5.56%) participants wanted to turn off their rear display for privacy and security reasons: “Maybe I will turn it off; I don’t want to be trackable (P27).” “During the day I have no concern. In the night, I will worry about my safety if somebody can see it; the criminal might follow me (P29).”

5.2.9. Opportunity for Further Development

Through the interviews, we also gained several insights on the current design and potential directions for further research. Regarding the information presented in Display C (Figure 10), three participants wanted to know the presence of other cyclists even if their circles are out of the screen: “When they go beyond the screen, I can’t see them anymore, I hope there is still some information, like some dots on the edge of the screen (P4).” “The interface could be zoomed out, so I can see other people out of the screen. I can see how far they have gone (P8).” Two participants (P1 and P3) stated that they want to see more visual effects on the interface when their circles meet with others.
Regarding the color-changing effect, two participants (P15 and P19) said that the red and yellow colors reminded them of the color of traffic lights, so it may not match the actual semantics. Therefore, in future design, the hue of red, yellow, and green will be adjusted to avoid potentially misleading.
In addition to the original design purpose, the form of SocialBike also inspired participants to imagine other potential applications, including transmitting traffic information through the rear display, playing augmented reality games on the front display, and sharing additional information for self-expression purpose.

6. Discussion

6.1. Motivation and Competition

Both qualitative and quantitative results indicated that SocialBike’s front display can improve users’ motivation in physical activity. From the qualitative results, we also found that the primary source of motivation is the competitive elements in the design of the SocialBike. Although the speed of the other “cyclists” was the same in all the three tests, most participants perceived more competitive elements in Test C (with the Social Data Display) (Figure 10) than in the other two tests. This shows that the design of Display C has strengthened the competition in the existing cycling relationship. However, in the quantitative results, the average score of Display C in the “Perceived Competence” subscale is lower than Display. This means that users are not motivated by their perceived competence level, but by the possibility of participating in the competition. Other qualitative results also show that users prefer to compete with people who have similar performance as them, and an excessive performance gap may reduce users’ desire to participate in the competition.
Therefore, when designing competitive elements to increase users’ motivation, it is essential to make users perceive the existence of competition and encourage them to stay in the competition continuously. To achieve this, we can help users with similar performance to find each other or design appropriate competition mechanisms to avoid an excessive performance gap. In this study, we used color coding (Figure 2) to help users identify the performance range of themselves and other cyclists nearby.

6.2. Impact of Scenarios

Since we conducted a controlled experiment in this study, we can only simulate one common cycling scenario for participants to eliminate the impact of unrelated factors. However, the users’ actual outdoor riding behavior can be diverse in different scenarios. From the qualitative results, we have summarized three types of additional factors that affect users’ riding behavior on SocialBike, including the purpose of riding, the traffic environment, and the social environment.
People may ride bicycles for commuting, relaxation, exercise, and many other purposes. The boundaries between these purposes may be blurred. SocialBike can play a proper role when users ride for exercise or relaxation. Since SocialBike is not a tool application for commuting purposes, when users have clear commuting tasks, their attention on SocialBike will be distracted by the need for navigation. However, this distraction mainly occurs in urgent and temporary commuting tasks. For daily fixed-route commuting tasks, many users see it as an opportunity to relax or exercise, and their use of SocialBike will not be significantly affected in this scenario.
In this study, we simulated a relatively smooth traffic environment. Each participant has the opportunity to interact with two other cyclists without encountering traffic jams. However, when the user meets busy traffic conditions in the actual environment, a large amount of information in the front interface could be confusing to them. Therefore, in further development, a filtering mechanism could be established in the interface design when the traffic is heavy; not only to optimize the interface display but also to ensure the user’s riding safety.
Since SocialBike is an application for sharing quantified-self data, different social environments will also have an impact on users’ behavior. The users’ relationship with other cyclists nearby is an essential factor. Riding with acquaintances will increase users’ desire to share information and encourage each other. Although a few participants stated that they would also talk to strangers around them, most participants believed that their interaction with strangers would be non-verbal communication such as gestures, overtaking, and following.

6.3. Digitally Enhanced On-Site Interaction

In this study, we added a digital dimension to the users’ existing cycling scenarios. Different from the health-related data sharing on the social network, the data sharing on SocialBike is synchronized with the user’s current activity and occurs in the same physical space as this activity. Users can adjust their riding behavior in real-time based on the information on SocialBike, and these changes will be reflected in the interface immediately. Compared with off-site data sharing afterwards, users may experience a stronger sense of participation in on-site data sharing and are more likely to be motivated by the shared data. Therefore, the digital dimension introduced by SocialBike not only provides richer information for users but also becomes an additional reference for them to interact with each other on-site.
In order to facilitate specific activity through on-site data sharing, the type of shared data should be relevant to the activity. The primary purpose of this study is to enhance the users’ motivation in physical activity. Therefore, a data type related to real-time calorie consumption rate is presented in the interface. During the interview, some participants suggested that the form of SocialBike can help them obtain practical information such as traffic and weather. Although this information is also convenient for the user’s riding, it does not change according to the user’s riding behavior. Therefore, its effect on facilitating physical activity is limited.
On-site data sharing also has its limitations. Users can post a screenshot with a lot of details on social networks. However, it is difficult for users to process a large amount of data while carrying out other activities. Therefore, only a small amount of data can be shared at once. In the meantime, proper strategies of data visualization are also crucial in reducing the user’s cognitive burden in on-site data sharing.

6.4. Privacy and User Autonomy

Privacy is a significant factor for an application that involves quantified-self data sharing. In the original concept of SocialBike, users can activate or deactivate the data sharing function at any time through the front interface. Although we did not test this function in this controlled experiment, we received some feedback related to privacy and user autonomy from the interviews. From the results of user interviews, we identified three design insights that can improve user autonomy and strengthen the protection of user privacy.
Firstly, we found that some users are willing to use SocialBike with family members or friends, but they do not want to share their data with strangers. A "Contacts" feature can be provided in future designs to address this issue, allowing users to set their data sharing audience in advance. With this feature, the data sharing functions will only be active when the user rides with their selected contacts. Secondly, some users are affected by the performance gap, and they prefer to share their data with other users at similar performance levels. In response to this demand, a matching mechanism based on performance can be involved in future designs. Under this mechanism, the sharing function will only be activated between people at similar performance levels. Thirdly, although we used real-time calorie consumption data in this experiment, we found that some users have more privacy concerns about sharing historical data over time than sharing real-time data. Historical data contains more information about personal behavior and habit, which is more likely to cause privacy problems than real-time data. Therefore, when introducing other data types in future designs, we need to use historical data more carefully and give users greater autonomy to ensure privacy protection.

7. Conclusions

In this study, we introduced the design and evaluation of SocialBike—a digitally augmented bicycle that aims to increase the user’s intrinsic motivation in physical activity. Two forms of Social-Bike’s front display (Personal Data Display and Social Data Display) were evaluated on a cycling simulation system with 36 participants. Two types of quantitative data and one type of qualitative data were collected. Quantitative data about users’ intrinsic motivation for physical activity was collected by the IMI questionnaire; quantitative data about user cycling behavior was recorded by the log function of the cycling simulation system. Qualitative data was collected through semi-structured interviews.
The results of the quantitative analysis indicated that the Personal Data Display (Display B) significantly improved two variables, including “Intrinsic Motivation” and “Value/Usefulness”. The Social Data Display (Display C) significantly improved seven variables, including “Intrinsic Motivation”, “Effort/Importance”, “Perceived Choice”, “Value/Usefulness”, “Relatedness”, “Overall Average Speed” and “Social Average Speed”.
A total of nine themes were identified from the qualitative analysis. Some of the themes provide supplementary explanations for quantitative results, such as “Preference for Front Display Types” and “Source of Motivation”. Other themes offer additional insight into the overall concept of SocialBike, including “Influence of Performance Gap” “Influence of Use Scenarios”, “Influence on Social Behavior”, “On-site Sharing versus Off-site sharing”, “Data Visualization”, “Rear Display and Privacy Concerns” and “Opportunity for Further Development”.
Based on the implementation process and experimental results, we discussed the relationship between motivation and competition, the influence of scenarios, privacy issues and user autonomy, as well as the advantages and limitations of on-site quantified-self data sharing.

Author Contributions

Conceptualization, N.Y., G.v.H., L.F. and J.H.; methodology, N.Y, L.F. and J.H.; software, N.Y.; validation, N.Y.; formal analysis, N.Y.; investigation, N.Y.; resources, N.Y, G.v.H., L.F., W.C. and J.H.; data curation, N.Y.; writing—original draft preparation, N.Y.; writing—review and editing, N.Y., L.F. and J.H.; visualization, N.Y.; supervision, G.v.H., L.F., W.C. and J.H.; project administration, N.Y., G.v.H., L.F. and J.H.; funding acquisition, N.Y. and J.H. All authors have read and agreed to the published version of the manuscript.

Funding

This research was funded by China Scholarship Council (grant number 201406790034).

Conflicts of Interest

The authors declare no conflict of interest.

References

  1. Guerrero, L.K.; Floyd, K. Nonverbal Communication in Close Relationships; Routledge: Abingdon, UK, 2016. [Google Scholar]
  2. Hall, J.A.; Horgan, T.G.; Murphy, N.A. Nonverbal communication. Annu. Rev. Psychol. 2019, 70, 271–294. [Google Scholar] [CrossRef] [PubMed] [Green Version]
  3. Ivanov, A.; Sharman, R.; Rao, R.H. Exploring factors impacting sharing health-tracking records. Health Policy Technol. 2015, 4, 263–276. [Google Scholar] [CrossRef] [Green Version]
  4. Epstein, D.A.; Jacobson, B.H.; Bales, E.; McDonald, D.W.; Munson, S.A. From nobody cares to way to go: A Design Framework for Social Sharing in Personal Informatics. In Proceedings of the 18th ACM Conference on Computer Supported Cooperative Work & Social Computing, Vancouver, BC, Canada, 1–3 March 2015; pp. 1622–1636. [Google Scholar]
  5. Colley, A.; Pfleging, B.; Alt, F.; Häkkilä, J. Exploring public wearable display of wellness tracker data. Int. J. Hum. Comput. Stud. 2020, 138, 102408. [Google Scholar] [CrossRef] [Green Version]
  6. Hassib, M.; Buschek, D.; Wozniak, P.W.; Alt, F. HeartChat: Heart rate augmented mobile chat to support empathy and awareness. In Proceedings of the 2017 CHI Conference on Human Factors in Computing Systems, Danver, CO, USA, 6–11 May 2017; pp. 2239–2251. [Google Scholar]
  7. Curmi, F.; Ferrario, M.A.; Whittle, J. Biometric data sharing in the wild: Investigating the effects on online sports spectators. Int. J. Hum. Comput. Stud. 2017, 105, 56–67. [Google Scholar] [CrossRef] [Green Version]
  8. Sonne, T.; Jensen, M.M. Race By Hearts. In International Conference on Entertainment Computing; Springer: Berlin, Germany/Heidelberg, 2014; pp. 125–132. [Google Scholar]
  9. Walmink, W.; Wilde, D.; Mueller, F.F. Displaying heart rate data on a bicycle helmet to support social exertion experiences. In Proceedings of the 8th International Conference on Tangible, Embedded and Embodied Interaction, Munich, Germany, 16–19 February 2014; pp. 97–104. [Google Scholar]
  10. Mauriello, M.; Gubbels, M.; Froehlich, J.E. Social fabric fitness: The design and evaluation of wearable E-textile displays to support group running. In Proceedings of the SIGCHI Conference on Human Factors in Computing Systems, Toronto, Canada, 26 April–1 May 2014; pp. 2833–2842. [Google Scholar]
  11. Epp, F.A. Expressive Wearables: Practices-Oriented Codesign for New Forms of Social Mobile Technology. Int. J. Mob. Hum. Comput. Int. 2019, 11, 1–15. [Google Scholar] [CrossRef] [Green Version]
  12. Dierk, C.; Nicholas, M.J.P.; Paulos, E. AlterWear: Battery-free wearable displays for opportunistic interactions. In Proceedings of the 2018 CHI Conference on Human Factors in Computing Systems, Montréal, QC, Canada, 21–26 April 2018; pp. 1–11. [Google Scholar]
  13. Walmink, W.; Chatham, A.; Mueller, F. Interaction opportunities around helmet design. In Proceedings of the CHI’14 Extended Abstracts on Human Factors in Computing Systems, Toronto, ON, Canada, 26 April–1 May 2014; pp. 367–370. [Google Scholar]
  14. Ikeda, K.; Koizumi, N.; Naemura, T. FunCushion: Fabricating functional cushion interfaces with fluorescent-pattern displays. In International Conference on Advances in Computer Entertainment; Springer: Cham, Switzerland, 2017; pp. 470–487. [Google Scholar]
  15. Kan, V.; Fujii, K.; Amores, J.; Jin, Z.L.C.; Maes, P.; Ishii, H. Social textiles: Social affordances and icebreaking interactions through wearable social messaging. In Proceedings of the Ninth International Conference on Tangible, Embedded, and Embodied Interaction, ACM, Standford, CA, USA, 15–19 January 2015; pp. 619–624. [Google Scholar]
  16. Genç, Ç.; Erkaya, M.; Balci, F.; Özcan, O. Exploring Dynamic Expressions on Soft Wearables for Physical Exercises. In Proceedings of the DIS 2018 Companion Publication of the 2018 Designing Interactive Systems Conference, Hong Kong, China, 9–13 June 2018; pp. 147–152. [Google Scholar]
  17. Liu, X.; Vega, K.; Qian, J.; Paradiso, J.; Maes, P. Fluxa: Body movements as a social display. In Proceedings of the 29th Annual Symposium on User Interface Software and Technology, Tokyo, Japan, 16–19 October 2016; pp. 155–157. [Google Scholar]
  18. Harjuniemi, E.; Colley, A.; Rytilahti, P.; Li, H.; Forest, J.; Häkkilä, J. Idle stripes shirt: Ambient wearable display for activity tracking. In Proceedings of the 2018 ACM International Symposium on Wearable Computers, Singapore, 8–12 October 2018; pp. 254–259. [Google Scholar]
  19. Yang, N.; van Hout, G.; Feijs, L.M.; Chen, W.; Hu, J. i-Ribbon: Social Expression Through Wearables to Support Weight-Loss Efforts. In Intelligent Environments; IOS Press: Amsterdam, The Netherlands, 2016; pp. 524–533. [Google Scholar]
  20. Yang, N.; van Hout, G.; Feijs, L.; Chen, W.; Hu, J. Eliciting values through wearable expression in weight loss. In Proceedings of the 19th International Conference on Human-Computer Interaction with Mobile Devices and Services, Vienna, Austria, 4–7 September 2017; pp. 1–6. [Google Scholar]
  21. Pearson, J.; Robinson, S.; Jones, M. It’s About Time: Smartwatches as public displays. In Proceedings of the 33rd Annual ACM Conference on Human Factors in Computing Systems, Seoul, Korea, 18–23 April 2015; pp. 1257–1266. [Google Scholar]
  22. Kleinman, L.; Hirsch, T.; Yurdana, M. Exploring mobile devices as personal public displays. In Proceedings of the 17th International Conference on Human-Computer Interaction with Mobile Devices and Services, Copenhagen, Denmark, 24–27 August 2015; pp. 233–243. [Google Scholar]
  23. Jarusriboonchai, P.; Li, H.; Harjuniemi, E.; Müller, H.; Häkkilä, J. Always with Me: Exploring Wearable Displays as a Lightweight Intimate Communication Channel. In Proceedings of the Fourteenth International Conference on Tangible, Embedded, and Embodied Interaction, Sydney, Australia, 9–12 February 2020; pp. 771–783. [Google Scholar]
  24. Yang, N.; van Hout, G.; Feijs, L.; Chen, W.; Hu, J. Supporting weight loss through digitally-augmented social expression. In International Conference on Human-Computer Interaction; Springer: Cham, Switzerland, 2019; pp. 459–470. [Google Scholar]
  25. Johnstone, A.M.; Murison, S.D.; Duncan, J.S.; Rance, K.A.; Speakman, J.R. Factors influencing variation in basal metabolic rate include fat-free mass, fat mass, age, and circulating thyroxine but not sex, circulating leptin, or triiodothyronine. Am. J. Clin. Nutr. 2005, 82, 941–948. [Google Scholar] [CrossRef] [PubMed] [Green Version]
  26. Ainsworth, B.E.; Haskell, W.L.; Herrmann, S.D.; Meckes, N.; Bassett, D.R., Jr.; Tudor-Locke, C.; Greer, J.L.; Vezina, J.; Whitt-Glover, M.C.; Leon, A.S. Compendium of Physical Activities: A second update of codes and MET values. Med. Sci. Sports Exerc. 2011, 43, 1575–1581. [Google Scholar] [CrossRef] [PubMed] [Green Version]
  27. Yang, N.; van Hout, G.; Feijs, L.; Chen, W.; Hu, J. Simulating social cycling experience in design research. In International Conference on Human Systems Engineering and Design: Future Trends and Applications; Springer: Cham, Switzerland, 2019; pp. 379–384. [Google Scholar]
  28. Yang, N.; van Hout, G.; Feijs, L.; Chen, W.; Hu, J. SocialBike: Quantified-Self Data as Social Cue in Physical Activity. In EAI International Conference on IoT Technologies for HealthCare; Springer: Cham Switzerland, 2019; pp. 92–107. [Google Scholar]
  29. Yang, N.; van Hout, G.; Feijs, L.; Chen, W.; Hu, J. Enhancing Intrinsic Motivation in Physical Activity through Quantified-self Data Sharing. EAI Endorsed Trans. Pervasive health Technol. 2020, 6, 1–12. [Google Scholar] [CrossRef]
  30. McAuley, E.; Duncan, T.; Tammen, V.V. Psychometric properties of the Intrinsic Motivation Inventory in a competitive sport setting: A confirmatory factor analysis. Res. Q. Exerc. Sport 1989, 60, 48–58. [Google Scholar] [CrossRef] [PubMed]
  31. Braun, V.; Clarke, V. Using thematic analysis in psychology. Qual. Res. Psychol. 2006, 3, 77–101. [Google Scholar] [CrossRef] [Green Version]
  32. Clarke, V.; Braun, V.; Hayfield, N. Thematic Analysis. Qualitative Psychology: A Practical Guide to Research Methods; SAGE Publications: London, UK, 2015; pp. 222–248. [Google Scholar]
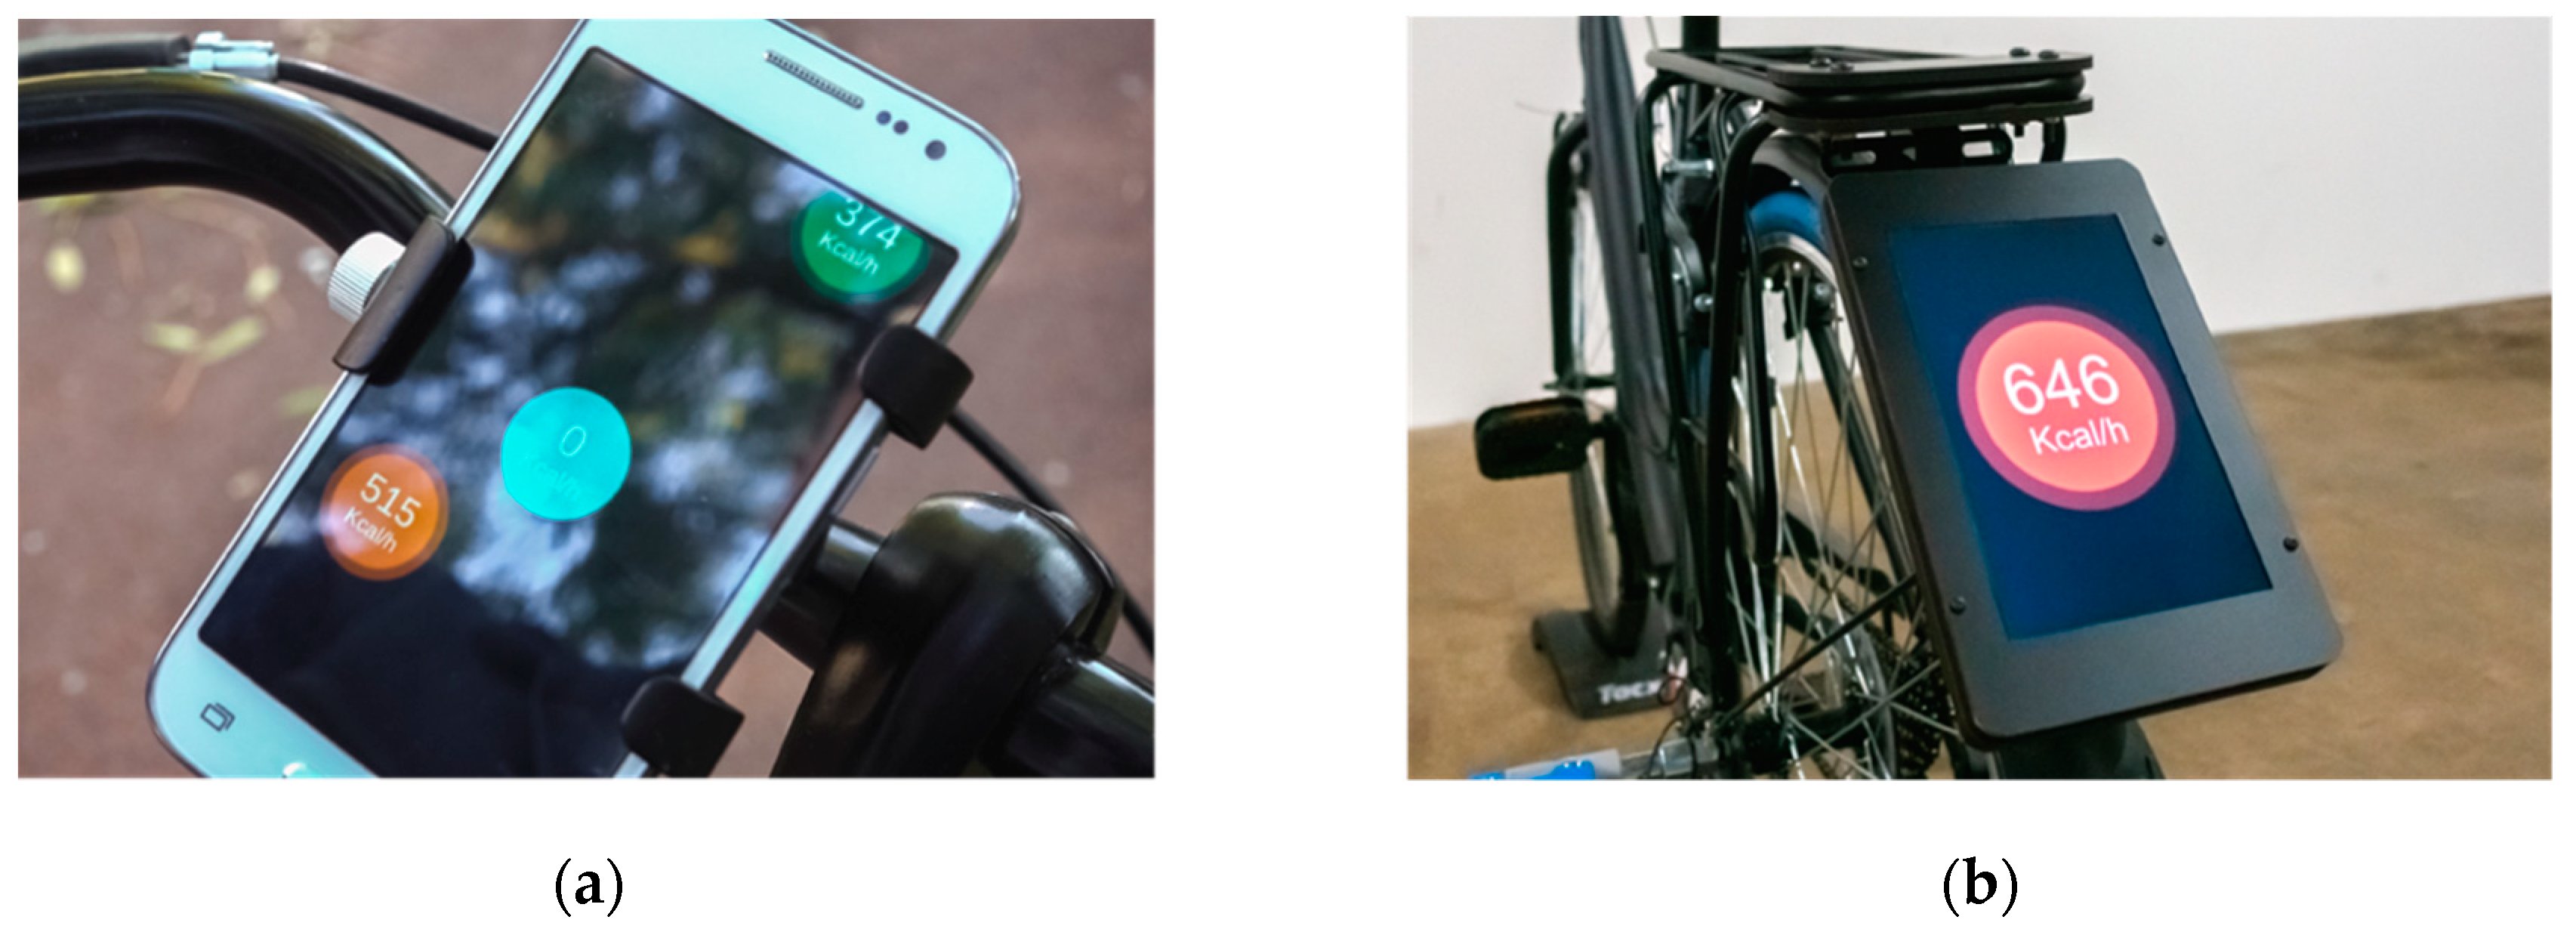
Figure 1. (a) The prototype of SocialBike’s front display; (b) The prototype of SocialBike’s rear display.
Sustainability 12 04904 g001
Figure 2. The color of the circle will change with the value.
Sustainability 12 04904 g002
Figure 3. The position of the circle in the front display corresponds to the actual position of the cyclists (top view).
Sustainability 12 04904 g003
Figure 4. Schematic of the cycling simulation system (top view).
Sustainability 12 04904 g004
Figure 5. (a) The Reed switch and magnet used to detect the rotational speed of the bike wheel; (b) The bike trainer used to provide resistance.
Sustainability 12 04904 g005
Figure 6. (a) Setup of the cycling simulation system with an user; (b) Setup of the cycling simulation system without user. The above pictures were taken with an indoor light source. In the formal experiments, the indoor lights were turned off to create an immersive experience.
Sustainability 12 04904 g006
Figure 7. Screenshots of different scenes in the simulation program (ad).
Sustainability 12 04904 g007
Figure 8. (a) Social Bike’s front display in the simulation system; (b) Social Bike’s rear display in the simulation system.
Sustainability 12 04904 g008
Figure 9. Start interface of the simulation program.
Sustainability 12 04904 g009
Figure 10. Three statuses of the independent variable: Display A—Control Display (a), Display B—Personal Data Display (b) and Display C—Social Data Display (c).
Sustainability 12 04904 g010
Figure 11. Quantitative results of the Intrinsic Motivation Inventory.
Sustainability 12 04904 g011
Figure 12. Quantitative results of users’ cycling behavior.
Sustainability 12 04904 g012
Table 1. Quantitative results of the Intrinsic Motivation Inventory.
Groups ComparisonSubscalesMean DifferencesStandard Deviation Differencesp-Value
B-AInterest/Enjoyment0.4087302 −0.9334427 0.0127
Perceived Competence0.3611111 −1.1244046 0.0621
Effort/Importance0.1944444 −1.7840475 0.5174
Pressure/Tension0.0111111 −1.0838497 0.9513
Perceived Choice 0.2341270 −0.7803362 0.0805
Value/Usefulness0.2817460 −0.6713514 0.0165
Relatedness0.2534722 −1.0396111 0.1524
C-AInterest/Enjoyment0.6111111 −1.1365187 0.0027
Perceived Competence0.2361111 −1.1807820 0.2383
Effort/Importance0.7388889 −1.3821883 0.0029
Pressure/Tension0.1055556 −1.2508156 0.6158
Perceived Choice 0.3492063 −0.9057281 0.0267
Value/Usefulness0.3095238 −0.6528699 0.0074
Relatedness0.7118056 −0.9305430 0.0001
C-BInterest/Enjoyment0.2023810 −0.8040531 0.1400
Perceived Competence−0.1250000 −0.8974169 0.4090
Effort/Importance0.5444444 −1.4693914 0.0328
Pressure/Tension0.0944444 −1.1870599 0.6361
Perceived Choice 0.1150794 −0.8051000 0.3969
Value/Usefulness0.0277778 −0.6087979 0.7859
Relatedness0.4583333 −0.6661456 0.0002
Numbers in Bold: p < 0.05.
Table 2. Quantitative results of users’ cycling behavior.
Groups ComparisonVariablesMean DifferencesStandard Deviation Differencesp-Value
B-AOverall Average Speed0.4074537 −1.7481947 0.1708
Social Average Speed−0.2735097 −1.8170849 0.3726
C-AOverall Average Speed0.6917943 1.6785748 0.0184
Social Average Speed0.6964290 −1.9919094 0.0432
C-BOverall Average Speed0.2843405 −1.3319899 0.2087
Social Average Speed0.9699387 −1.7587369 0.0022
Numbers in Bold: p < 0.05.
Table 3. Results of qualitative analysis.
ThemesCodes (Number of Participants)Exemplar Quotes
Preference for Front DisplayPrefer Display C (29)“I can already tell who was going to overtake me, and how fast he was riding.”
Prefer Display B (7)“I only care about how many calories I burned, I don’t care about other people’s data.”
Display C brought too much competition (2)“It (Display C) becomes a competition for me. I put a lot of effort into this part. I see a girl passing by me. I tried to chase her but can’t make it. So, I kind of disappointed myself.”
Source of MotivationCompetitive (22)“I feel more competent when doing this thing because I can see others’ data.”
Compare to Regular Cycling Behavior (3)“Without this app, I would not compare with others… Now the numbers are shown. It motivated me to make some changes in riding.”
Curiosity (5)“Their data made me curious. I know the person in front of me was fast. I want to see how fast she is… I think curiosity gives me more motivation than performance.”
Influence of Performance GapPerformance Gap (12)“I tried to catch up with her, but later I found that she was too fast, so I slowed down, and ride with the slow one.”
Health Risk (2)“If my heart situation is not as good as her, it might be risky for me… I tried, but I start to get tired, so I stop chasing her.”
Influence of Use ScenariosUse Scenarios (5)“It depends. If I have a class, I’ll want to keep it a little bit slower. Not be drowned in sweat… If I have a more suitable clothes, I will perform better. Sometimes I really want to catch up with the fast rider.”
Commuting Purpose (2)“If I have a clear purpose, it will have less impact on me.”
Traffic Condition (1)“If the traffic was too busy, I might worry about safety. It would be better if I was riding in the countryside.”
Influence on Social BehaviorTrigger for Social Interaction with Strangers (6)“This is an opportunity to open a conversation. It could be embarrassing to talk with strangers, but if you are using the same system at the same time, it is easier to start.”
Stranger Met Multiple Times (2)“I want to know how many times I have met him. If I meet him several times, I will be more familiar with him and more willing to interact with him.”
Competitive Relationship with Acquaintances (2)“Riding with friends will be more competitive. They will always want to overtake you. The competition is more continuous.”
Supportive Relationship with Acquaintances (5)“If I am faster, my data will help him to keep along with me. If he is faster, his data will help me to keep along with him.”
On-site Sharing versus Off-site SharingSaw Health-related Data Sharing on SNS (Social Networking Service) (23)“My friend and cousin are doing this.”
Not Influenced by Others’ Data Sharing on SNS (20)“I saw this and knew that he did some exercise, but I didn’t care about the details, I wouldn’t compare myself with them.”
Enjoy Others’ Data Sharing on SNS (3)“I feel happy for them. I feel motivated to do that (marathon), but I have never done that.”
Improve Motivation for Exercise (7)“This one is encouraging me more than just posting it on Facebook afterwards. It encourages me to use the bike to work out.”
More Connected to Other Cyclists (5)“The feeling of the moment can’t be taken home… because you are doing the same thing with me, so I pay more attention to the data you shared. If you are at home, our connection is weak.”
Concern about Real-time Data (3)“If I have been riding for a long time, I feel tired, and then I slow down, but the person just saw me might think I’m not riding hard.”
Data VisualizationAttract by Color Change (28)“Color is more intuitive. If there are many people on the road, you can tell who is with me based on the color. I will ride closer to them if their color is similar to mine.”
Attract by Numbers (8)“I focused on numbers first, it was something that is really controlled by my speed. Color can be a side message.”
The Breathing Animation is too Subtle (11)“I can see the change in color even if I am not staring at the screen. For the animation, I need to look at it for two or three seconds (P25).”
Rear Display and Privacy ConcernsInterested in Others’ Rear Display (5)“It attracts me to go closer to other people and interact with them.”
No Privacy Concern about Rear Display (29)“Because I can also see other people’s data, everyone is sharing… It is not a shameful number.”
Only Share Real-time Data (5)“I want to know more about my own riding information, such as distance… But I only want to share the real-time data. Historical data has some privacy issues.“
Turn off Rear Display (2)“Maybe I will turn it off; I don’t want to be trackable.”
Opportunity for further DevelopmentPresence of Cyclists’ side the Screen (3)“When they go beyond the screen, I can’t see them anymore. I hope there is still some information, like some dots on the edge of the screen (P4).”
More Social-related Visual Effects (2)“You can add more animation effects to make the two circles interact with each other.”
Semantics of Colors (2)“The red and yellow colors are similar to traffic lights. This may cause misunderstandings.”
Expand Applications Scenarios (3)“I can play games with this circle, like catching a Pokémon.”