Analysis of Flood-Vulnerable Areas for Disaster Planning Considering Demographic Changes in South Korea
Abstract
1. Introduction
2. Materials and Methods
2.1. Study Area: Spatial Division and Regional Characteristics of Floods
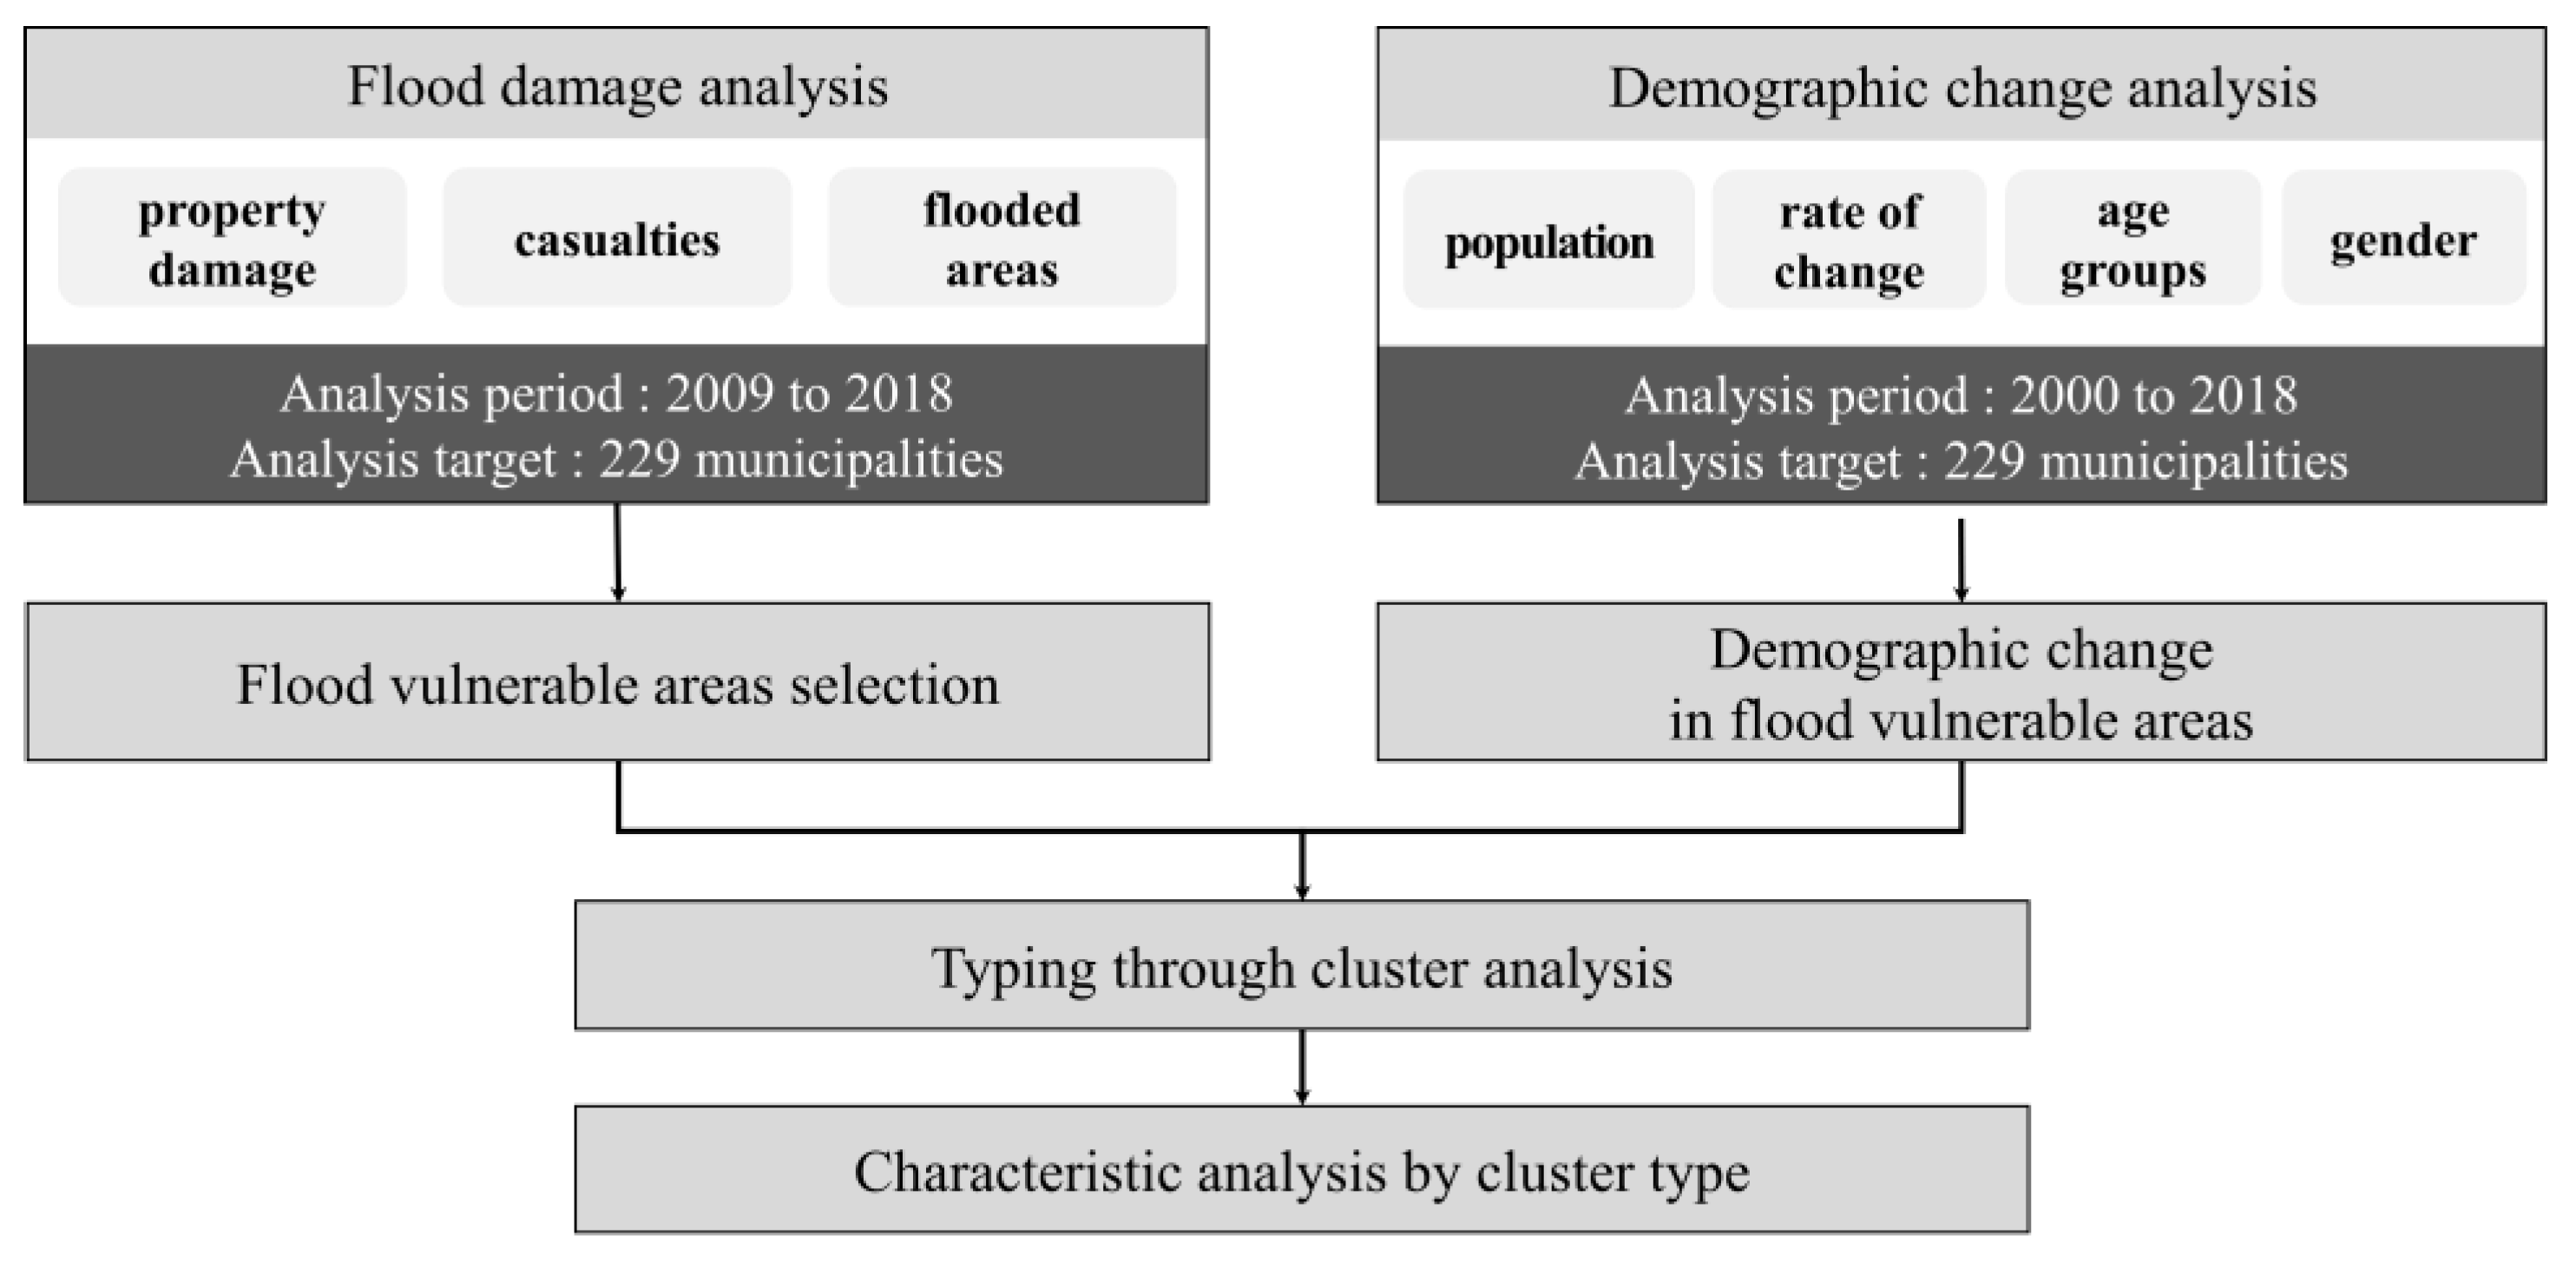
2.2. Methods
2.3. Flood Vulnerable Area Selection Data
2.4. Demographic Change Analysis Data
2.5. Cluster Analysis
3. Results
3.1. Flood Vulnerable Area Selection
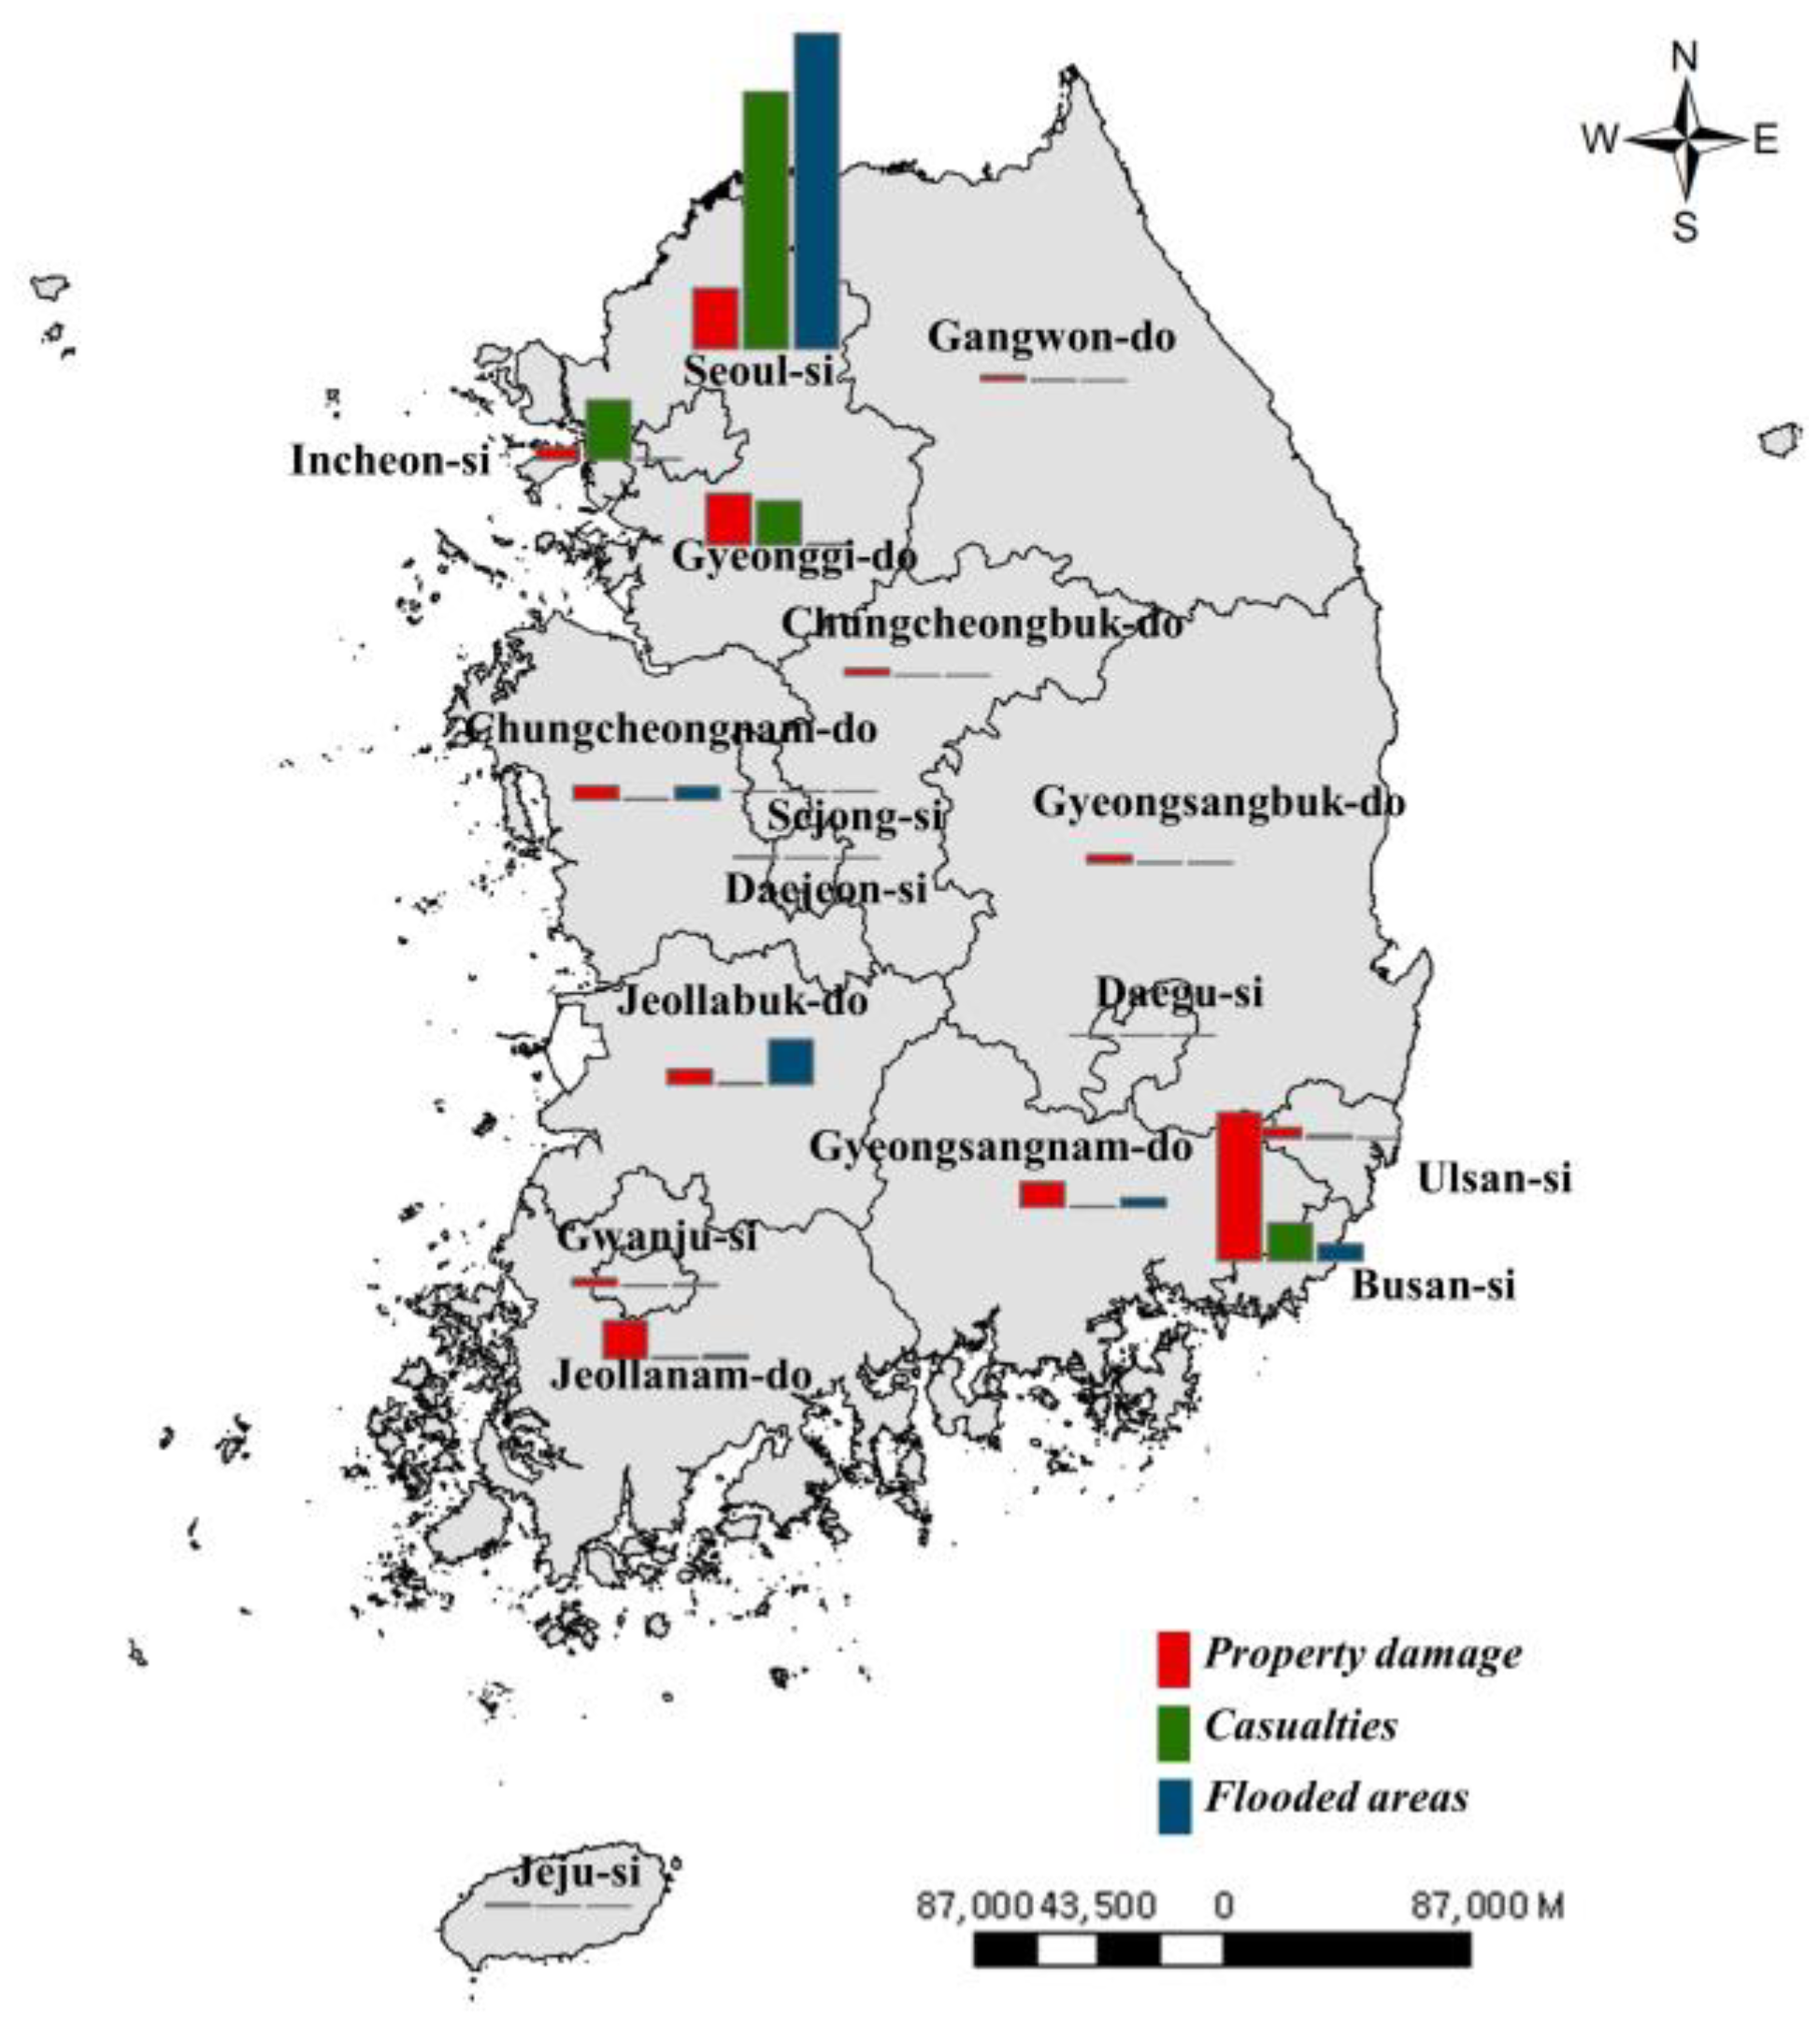
3.1.1. Selection and Characteristics of Vulnerable Areas by Major Administrative Region
3.1.2. Selection and Characteristics of Vulnerable Areas (si/gun/gu)
3.2. Demographic Change Analysis
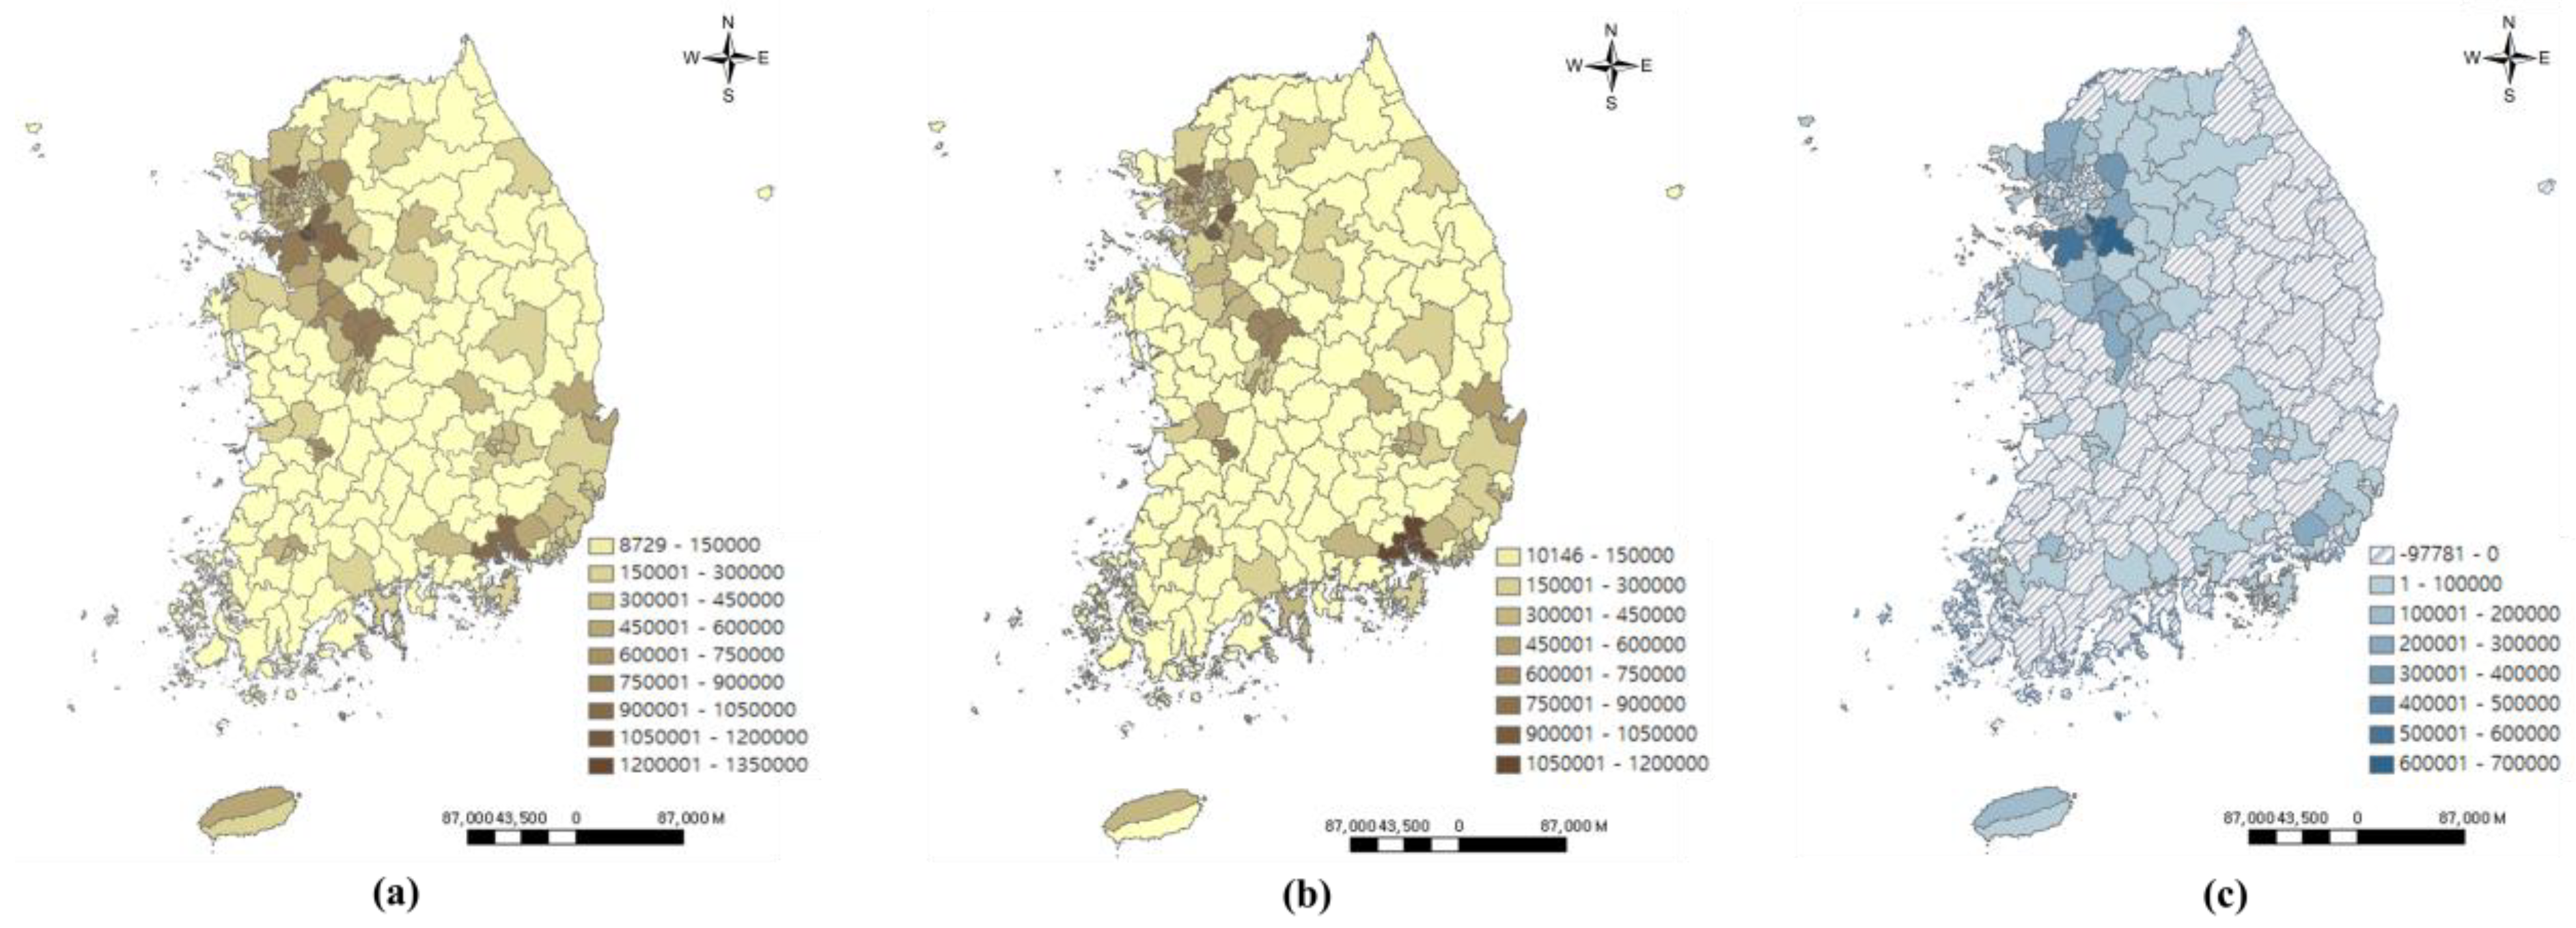
3.2.1. Demographic Change across South Korea
3.2.2. Demographic Change in Flood Vulnerable Areas
3.3. Characteristics of Flood Vulnerable Area Type Reflecting Demographic Change
3.3.1. Type Classification through Cluster Analysis
3.3.2. Analysis of Characteristics by Type
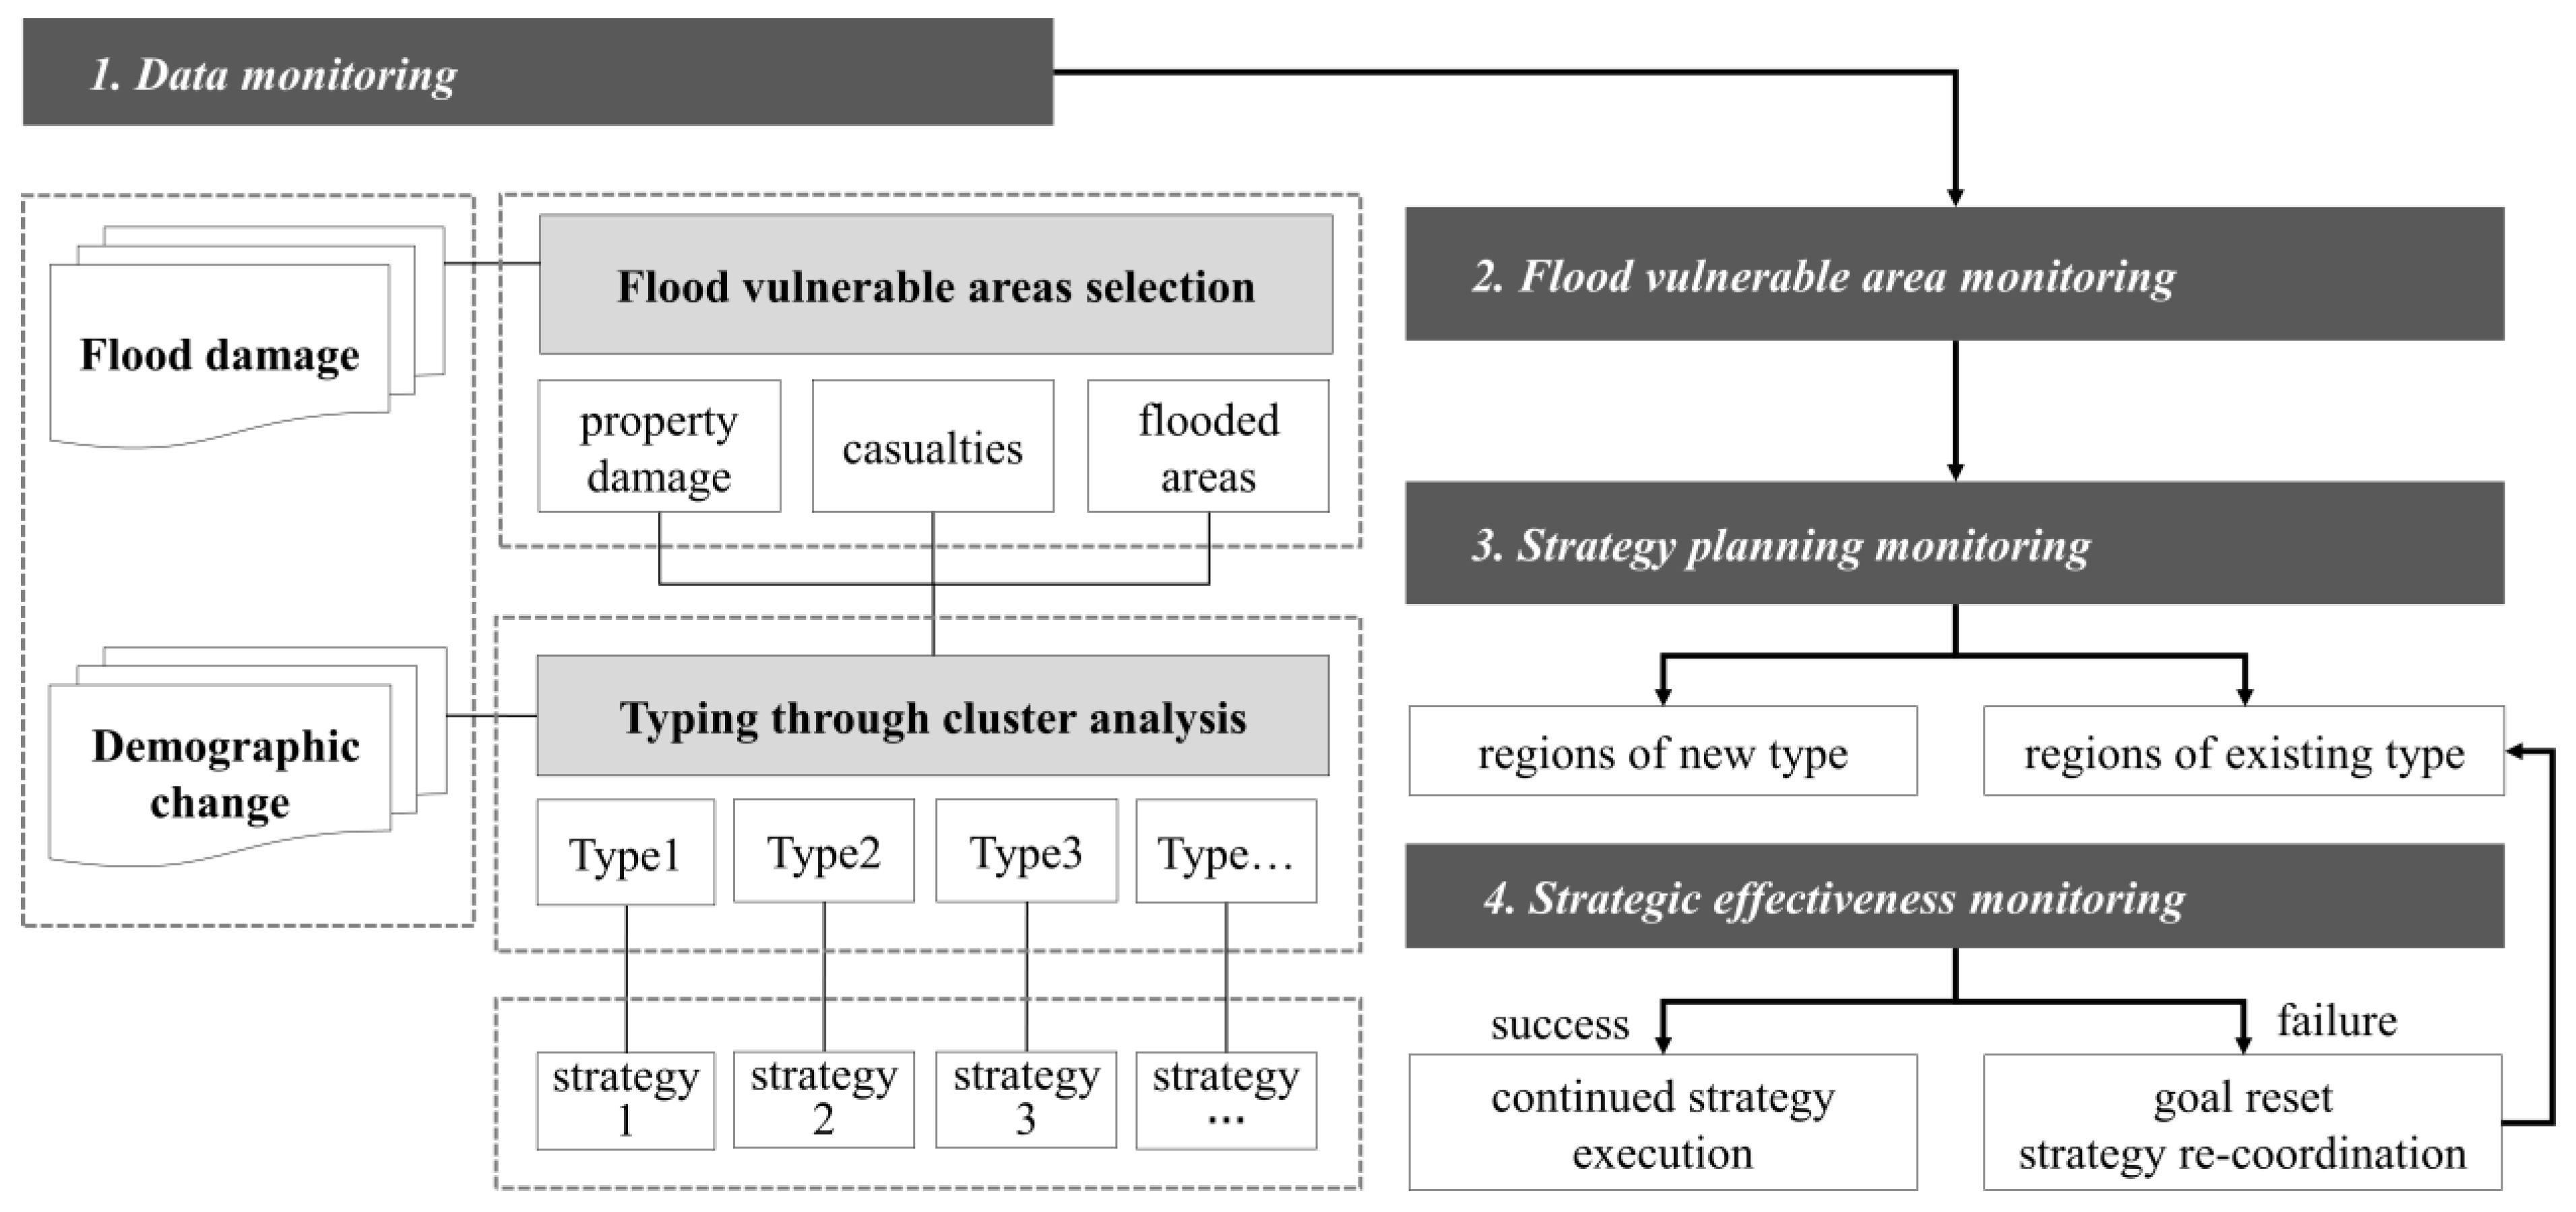
3.4. Recommendations
- Data monitoring: Identify trends of change through flood damage and population census data monitoring.
- Flood vulnerable area monitoring: The flood vulnerable areas are re-selected and re-categorized according to the changing trend.
- Strategic planning monitoring: The regional type is divided into “existing” and “new” to monitor the strategic plan by region type.
- Strategic effectiveness monitoring: The strategy is adjusted by monitoring the effectiveness of the strategy in a region, or by reviewing the application of other strategies in other regions where they worked well.
4. Discussions and Conclusions
Author Contributions
Funding
Conflicts of Interest
References
- Wisner, B.; Blaikie, P.; Cannon, T.; Davis, I. At Risk; Taylor & Francis: Abingdon, UK, 1994; ISBN 978-0-203-44423-8. [Google Scholar]
- Jonkman, S.N. Global Perspectives on loss of human life caused by floods. Nat. Hazards 2005, 34, 151–175. [Google Scholar] [CrossRef]
- Douben, K.-J. Characteristics of river floods and flooding: A global overview, 1985–2003. Irrig. Drain. 2006, 55, S9–S21. [Google Scholar] [CrossRef]
- Botzen, W.; Van den Bergh, J.C.J.M.; Bouwer, L.M. Climate change and increased risk for the insurance sector: A global perspective and an assessment for the Netherlands. Nat. Hazards 2009, 52, 577–598. [Google Scholar] [CrossRef]
- Kvočka, D.; Falconer, R.A.; Bray, M. Flood hazard assessment for extreme flood events. Nat. Hazards 2016, 84, 1569–1599. [Google Scholar] [CrossRef]
- Diffenbaugh, N.; Singh, D.; Mankin, J.S.; Horton, D.E.; Swain, D.L.; Touma, D.; Charland, A.; Liu, Y.; Haugen, M.; Tsiang, M.; et al. Quantifying the influence of global warming on unprecedented extreme climate events. Proc. Natl. Acad. Sci. USA 2017, 114, 4881–4886. [Google Scholar] [CrossRef]
- Davoudi, S.; Crawford, J.; Mehmood, A. Planning for Climate Change: Strategies for Mitigation and Adaptation for Spatial Planners; Routledge: London, UK, 2009; ISBN 9781849770156. [Google Scholar] [CrossRef]
- Biesbroek, R.; Swart, R.; Van Der Knaap, W.G. The mitigation–adaptation dichotomy and the role of spatial planning. Habitat Int. 2009, 33, 230–237. [Google Scholar] [CrossRef]
- Kim, Y.J.; Lee, J.E.; Kim, K.B. Development of flood mitigation strategies for urban resilience-focused on the assessment of gulpo stream’s watershed in Incheon, South Korea. Urban Des. Inst. Korea 2018, 19, 5–20. [Google Scholar] [CrossRef]
- Pielke, R.A.; Downton, M.W. Precipitation and damaging floods: Trends in the United States, 1932–1997. J. Clim. 2000, 13, 3625–3637. [Google Scholar] [CrossRef]
- Brody, S.D.; Kang, J.E.; Bernhardt, S. Identifying factors influencing flood mitigation at the local level in Texas and Florida: The role of organizational capacity. Nat. Hazards 2009, 52, 167–184. [Google Scholar] [CrossRef]
- Laurien, F.; Hochrainer-Stigler, S.; Keating, A.; Campbell, K.; Mechler, R.; Czajkowski, J. A typology of community flood resilience. Reg. Environ. Chang. 2020, 20, 1–14. [Google Scholar] [CrossRef]
- Jongman, B.; Winsemius, H.C.; Fraser, S.A.; Muis, S.; Ward, P.J. Assessment and adaptation to climate change-related flood risks. In Oxford Research Encyclopedia of Natural Hazard Science; Oxford University Press: Oxford, UK, 2018. [Google Scholar] [CrossRef]
- Cardona, O.D. Indicators of disaster risk and risk management. Science 2005, 284, 939–942. [Google Scholar] [CrossRef]
- Kubal, C.; Haase, D.; Meyer, V.; Scheuer, S. Integrated urban flood risk assessment-adapting a multicriteria approach to a city. Nat. Hazards Earth Syst. Sci. 2009, 9, 1881–1895. [Google Scholar] [CrossRef]
- Balica, S.F.; Douben, N.; Wright, N. Flood vulnerability indices at varying spatial scales. Water Sci. Technol. 2009, 60, 2571–2580. [Google Scholar] [CrossRef]
- Balica, S.F.; Wright, N.; van Der Meulen, F. A flood vulnerability index for coastal cities and its use in assessing climate change impacts. Nat. Hazards 2012, 64, 73–105. [Google Scholar] [CrossRef]
- Ministry of Land, Infrastructure and Transport. Comprehensive Water Resources Plan—Water Vision 2020; Ministry of Land, Infrastructure and Transport: 2000. Available online: http://molit.go.kr (accessed on 5 March 2020).
- National Disaster Management Research Institute. Development of Evaluation and Diagnosis Methods of Safer City; National Disaster Management Research Institute: 2013. Available online: http://ndmi.go.kr (accessed on 5 March 2020).
- Park, T.S.; Kim, K.M.; Yun, Y.S.; Lee, S.B. Analysis of Flood Damage Characteristics and Development of Flood Damage Index; Korea Research Institute for Human Settlements: Daejeon, Korea, 2005; Available online: https://scholar.google.co.kr/scholar?hl=ko&as_sdt=0%2C5&q=Analysis+of+flood+damage+characteristics+and+development+of+flood+damage+index&btnG (accessed on 5 March 2020).
- Korea Agency for Infrastructure Technology Advancement. Development of Evaluation Technique on the Abnormal Flood; Korea Agency for Infrastructure Technology Advancement: 2008. pp. 1–202. Available online: https://www.kaia.re.kr (accessed on 5 March 2020).
- Alkema, D. Flood risk assessment for EIA: An example of a motorway near Trento, Italy. Stud. Trentini Di Sci. Nat. Acta Geol. 2003, 78, 147–153. [Google Scholar]
- Tingsanchali, T.; Karim, M.F. Flood hazard and risk analysis in the southwest region of Bangladesh. Hydrol. Process. 2005, 19, 2055–2069. [Google Scholar] [CrossRef]
- Dang, N.M.; Babel, M.S.; Luong, H.T. Evaluation of food risk parameters in the day river flood diversion area, red river delta, vietnam. Nat. Hazards 2010, 56, 169–194. [Google Scholar] [CrossRef]
- Rauscher, M. Demographic change and climate change. Environ. Dev. Econ. 2019, 25, 5–20. [Google Scholar] [CrossRef]
- Raker, E.J. Natural hazards, disasters, and demographic change: The case of severe tornadoes in the United States, 1980–2010. Demography 2020, 57, 653–674. [Google Scholar] [CrossRef]
- Liddle, B.; Lung, S.; Liddle, B. Age-structure, urbanization, and climate change in developed countries: Revisiting STIRPAT for disaggregated population and consumption-related environmental impacts. Popul. Environ. 2010, 31, 317–343. [Google Scholar] [CrossRef]
- Donner, W.; Rodriguez, H. Population composition, migration and inequality: The Influence of demographic changes on disaster risk and vulnerability. Soc. Forces 2008, 87, 1089–1114. [Google Scholar] [CrossRef]
- Oriangi, G.; Albrecht, F.; Di Baldassarre, G.; Bamutaze, Y.; Mukwaya, P.I.; Ardö, J.; Pilesjö, P. Household resilience to climate change hazards in Uganda. Int. J. Clim. Chang. Strat. Manag. 2020, 12, 59–73. [Google Scholar] [CrossRef]
- Kim, E.J.; Kim, M.-Y.; Kim, H. Spatio-temporal trend of aging regions and their neighborhood environment: Findings from daegu metropolitan City, Korea. Sustainability 2020, 12, 1218. [Google Scholar] [CrossRef]
- Park, E.H. Ultra-low fertility and policy response in South Korea: Lessons from the case of Japan. Ageing Int. 2020, 45, 191–205. [Google Scholar] [CrossRef]
- Han River Flood Control Office. Characteristics of Flooding in Korea. Available online: http://www.hrfco.go.kr/web/floodPage/floodClass.do (accessed on 5 March 2020).
- Lee, J.S.; Myeong, S.; Choi, H.I.; Korea Environment Institute; Yeungnam University. Development of a flood vulnerability assessment methodology for coastal areas. J. Korean Soc. Hazard Mitig. 2017, 17, 397–402. [Google Scholar] [CrossRef]
- Messner, F.; Meyer, V. Flood damage, vulnerability and risk perception-Challenges for flood damage research. In Flood Risk Management: Hazards, Vulnerability and Mitigation Measures; Springer: Dordrecht, Netherlands, 2007; pp. 149–167. [Google Scholar]
- Scheuer, S.; Haase, D.; Meyer, V. Exploring multicriteria flood vulnerability by integrating economic, social and ecological dimensions of flood risk and coping capacity: From a starting point view towards an end point view of vulnerability. Nat. Hazards 2010, 58, 731–751. [Google Scholar] [CrossRef]
- Kim, J.K.; Park, I.C.; Yang, D.M. The development of a disaster situation analysis system based on national disaster statistics and damage information-A case of heavy rains and typhoons in South Korea. Crisis Emerg. Manag. Theory Prax. 2020, 16, 175–183. [Google Scholar] [CrossRef]
- The Ministry of the Interior and Safety (MOIS). Statistical Yearbook of Natural Disaster. Available online: http://kosis.kr/statHtml/statHtml.do?orgId=110&tblId=DT_15603N_004&conn_path=I2 (accessed on 5 March 2020).
- Statistics Korea. Census. Available online: http://kosis.kr/statHtml/statHtml.do?orgId=101&tblId=DT_1IN1503&conn_path=I3 (accessed on 5 March 2020).
- Barbieri, A.F.; Domingues, E.; Queiroz, B.L.; Ruiz, R.M.; Rigotti, J.I.; Carvalho, J.A.M.; Resende, M.F. Climate change and population migration in Brazil’s Northeast: Scenarios for 2025–2050. Popul. Environ. 2010, 31, 344–370. [Google Scholar] [CrossRef]
- Grosso, N.; Dias, L.; Costa, H.P.; Santos, F.D.; Garrett, P. Continental portuguese territory flood social susceptibility index. Nat. Hazards Earth Syst. Sci. 2015, 15, 1921–1931. [Google Scholar] [CrossRef]
- Rao, M.R. Cluster analysis and mathematical programming. J. Am. Stat. Assoc. 1971, 66, 622–626. [Google Scholar] [CrossRef]
- Hennig, C.; Meila, M.; Murtagh, F.; Rocci, R. Handbook of Cluster Analysis; Chapman and Hall/CRC: New York, NY, USA, 2015; ISBN 9781466551893. [Google Scholar] [CrossRef]
- Tasseff, B.; Bent, R.W.; Van Hentenryck, P. Optimization of structural flood mitigation strategies. Water Resour. Res. 2019, 55, 1490–1509. [Google Scholar] [CrossRef]
- Tasseff, B.; Bent, R.; van Hentenryck, P. Optimal flood mitigation over flood propagation approximations. In Lecture Notes in Computer Science (Including Subseries Lecture Notes in Artificial Intelligence and Lecture Notes in Bioinformatics); Springer: Cham, Switzerland, 2016; pp. 358–373. [Google Scholar]
- Judi, D.; Tasseff, B.; Bent, R.; Pan, F. Topography-based Flood Planning and Optimization Capability Development Report; Los Alamos National Laboratory: Los Alamos, NM, USA, 2014. [Google Scholar] [CrossRef]
- Brody, S.D.; Highfield, W.E. Open space protection and flood mitigation: A national study. Land Use Policy 2013, 32, 89–95. [Google Scholar] [CrossRef]
- Brody, S.; Highfield, W.E.; Blessing, R.; Makino, T.; Shepard, C. Evaluating the effects of open space configurations in reducing flood damage along the Gulf of Mexico coast. Landsc. Urban Plan. 2017, 167, 225–231. [Google Scholar] [CrossRef]
- Calil, J.; Newkirk, S. Aligning natural resource conservation, flood hazard mitigation, and social vulnerability remediation in Florida. J. Ocean Coast. Econ. 2017, 4. [Google Scholar] [CrossRef]
- Tyler, J.; Sadiq, A.-A.; Noonan, D.S. A review of the community flood risk management literature in the USA: Lessons for improving community resilience to floods. Nat. Hazards 2019, 96, 1223–1248. [Google Scholar] [CrossRef]
- Thieken, A.H.; Kienzler, S.; Kreibich, H.; Kuhlicke, C.; Kunz, M.; Muller, M.; Otto, A.; Petrow, T.; Pisi, S.; Schroeter, K. Review of the flood risk management system in Germany after the major flood in 2013. Ecol. Soc. 2016, 21. [Google Scholar] [CrossRef]
- Veerbeek, W.; Ashley, R.M.; Zevenbergen, C.; Rijke, J.; Gersonius, B. Building adaptive capacity for flood proofing in urban areas through synergistic interventions. In Proceedings of the WSUD 2012-7th International Conference on Water Sensitive Urban Design: Building the Water Sensitive Community, Final Program and Abstract Book; Engineers Australia: Barton, Australia, 21 January 2012; ISBN 9780858258952. Available online: https://scholar.google.be/scholar?hl=ko&as_sdt=0%2C5&q=Building+adaptive+capacity+for+flood+proofing+in+urban+areas+through+synergistic+interventions.&btnG=.
- Michel-Kerjan, E.; Kunreuther, H. Redesigning flood insurance. Science 2011, 333, 408–409. [Google Scholar] [CrossRef]
- Aerts, J.C.; Botzen, W. Climate change impacts on pricing long-term flood insurance: A comprehensive study for the Netherlands. Glob. Environ. Chang. 2011, 21, 1045–1060. [Google Scholar] [CrossRef]
- Ermolieva, T.; Filatova, T.; Ermoliev, Y.; Obersteiner, M.; De Bruijn, K.; Jeuken, A. Flood catastrophe model for designing optimal flood insurance program: Estimating location-specific premiums in the netherlands. Risk Anal. 2016, 37, 82–98. [Google Scholar] [CrossRef]
- Goniewicz, K.; Burkle, F.M. Analysis of the potential of IT system support in early warning systems: Mitigating flood risk in Poland. Prehospital Disaster Med. 2019, 34, 563–565. [Google Scholar] [CrossRef]
- Kellens, W.; Terpstra, T.; De Maeyer, P. Perception and communication of flood risks: A systematic review of empirical research. Risk Anal. 2012, 33, 24–49. [Google Scholar] [CrossRef] [PubMed]

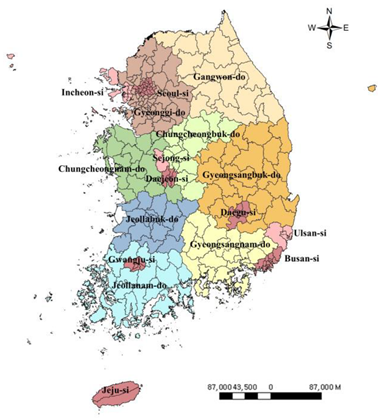 | Regions | Area (km2) | Si | Gun | Gu | |
|---|---|---|---|---|---|---|
| 1 | Seoul-si | 605.24 | - | - | 25 | |
| 2 | Busan-si | 769.94 | - | 1 | 15 | |
| 3 | Deagu-si | 883.52 | - | 1 | ||
| 4 | Incheon-si | 1063.27 | - | 2 | 8 | |
| 5 | Gwanju-si | 501.18 | - | - | 5 | |
| 6 | Deajeon-si | 539.53 | - | - | 5 | |
| 7 | Ulsan-si | 1061.54 | - | 1 | 4 | |
| 8 | Sejong-si | 464.91 | 1 | - | - | |
| 9 | Gyeonggi-do | 10,187.79 | 28 | 3 | - | |
| 10 | Gangwon-do | 16,827.91 | 7 | 11 | - | |
| 11 | Chungcheongbuk-do | 7407.85 | 3 | 8 | - | |
| 12 | Chungcheongnam-do | 8229.20 | 8 | 7 | - | |
| 13 | Jeollabuk-do | 8069.07 | 6 | 8 | - | |
| 14 | Jeollanam-do | 12,343.58 | 5 | 17 | - | |
| 15 | Gyeongsangbuk-do | 19,032.87 | 10 | 13 | - | |
| 16 | Gyeongsangnam-do | 10,540.12 | 8 | 10 | - | |
| 17 | Jeju-si | 1850.16 | 2 | - | - | |
| Total | 100,377.68 | 78 | 82 | 69 |
| Variable | Calculation Method | ||
|---|---|---|---|
| Vulnerable area characteristics | |||
| Property damage (million South Korean won/km2) | Flood property damage between 2009 and 2018 | ||
| Casualties (person/km2) | Flood casualties 2009 and 2018 | ||
| Flooded areas (km2/km2) | Flooded areas between 2009 and 2018 | ||
| Demographic characteristics | |||
| Population (person) | 0–9 years old | Male | Population in 2018 |
| Population change (person) | 10–19 years old | Female | Population in 2018–Population in 2000 |
| Rate of population change (%) | 20–64 years old | (Population in 2018–Population in 2000)/Population in 2018 × 100 | |
| Population proportion (%) | 65–74 years old | Population by age group or gender/population in 2018 × 100 | |
| Rate of population proportion change (%) | +75 years old | Population proportion in 2018–Population proportion in 2000 | |
| Property Damage | Casualties | Flooded Areas | ||||||||||
|---|---|---|---|---|---|---|---|---|---|---|---|---|
| Municipalities Si/Do/Gun/Gu | Million won/km2 | % | Municipalities Si/Do/Gun/Gu | Person/km2 | % | Municipalities Si/Do/Gun/Gu | km2/km2 | % | ||||
| Total | 1,392,9.54 | 100.00 | Total | 7337.55 | 100.00 | Total | 3.46 | 100.00 | ||||
| Sub-Total: Top 30 | 796,5.27 | 57.18 | Sub-Total: Top 30 | 6440.45 | 87.77 | Sub-Total: Top 30 | 3.46 | 99.94 | ||||
| Busan | Suyeong | 843.49 | 6.06 | Seoul | Yangcheon | 658.19 | 8.97 | Seoul | Gangseo | 2.683 | 77.59 | |
| Busan | Seo | 763.30 | 5.48 | Seoul | Dongjak | 497.73 | 6.78 | Chungcheongbuk | Jeonju | 0.368 | 10.36 | |
| Busan | Yeongdo | 702.68 | 5.04 | Seoul | Gwanak | 496.70 | 6.77 | Chungcheongnam | Seocheon | 0.080 | 2.31 | |
| Busan | Saha | 555.82 | 3.99 | Incheon | Michuhol | 441.16 | 6.01 | Busan | Yeonje | 0.076 | 2.20 | |
| Busan | Nam | 438.00 | 3.14 | Seoul | Gangdong | 364.00 | 4.96 | Busan | Haeundea | 0.066 | 1.91 | |
| Seoul | Seocho | 436.77 | 3.14 | Seoul | Guro | 352.38 | 4.80 | Gyeongsangnam | Sacheon | 0.028 | 0.82 | |
| Busan | Yeonje | 332.96 | 2.39 | Seoul | Geumcheon | 339.93 | 4.63 | Gyeongsangnam | Changnyeong | 0.028 | 0.81 | |
| Busan | Gijang | 316.96 | 2.28 | Seoul | Gwangjin | 314.18 | 4.28 | Jeollanam | Suncheon | 0.024 | 0.68 | |
| Seoul | Yangcheon | 299.54 | 2.15 | Incheon | Bupyeong | 313.88 | 4.28 | Gyeonggi | Hwaseong | 0.017 | 0.50 | |
| Busan | Buk | 235.70 | 1.69 | Seoul | Seocho | 267.71 | 3.65 | Chungcheongbuk | Gimje | 0.017 | 0.49 | |
| Jeollanam | Wando | 228.65 | 1.64 | Seoul | Gangseo | 240.85 | 3.28 | Gyeongsangnam | Miryang | 0.011 | 0.31 | |
| Seoul | Gwanak | 228.59 | 1.64 | Gyeonggi | Bucheon | 239.78 | 3.27 | Chungcheongnam | Taean | 0.010 | 0.29 | |
| Busan | Dongnae | 227.67 | 1.63 | Gyeonggi | Gwangmyeong | 178.56 | 2.43 | Gwanju | Gwangsan | 0.009 | 0.29 | |
| Busan | Haeundea | 226.73 | 1.63 | Busan | Dongnae | 167.68 | 2.29 | Gyeongsangbuk | Pohang | 0.007 | 0.20 | |
| Gyeonggi | Dongducheon | 213.61 | 1.53 | Seoul | Gangnam | 162.22 | 2.21 | Chungcheongbuk | Iksan | 0.007 | 0.19 | |
| Jeollanam | Mokpo | 191.51 | 1.37 | Seoul | Yeongdeungpo | 145.02 | 1.98 | Chungcheongnam | Cheongyang | 0.006 | 0.18 | |
| Busan | Geumjeong | 176.15 | 1.26 | Seoul | Songpa | 119.21 | 1.62 | Gyeongsangnam | Jinju | 0.006 | 0.18 | |
| Gwanju | Nam | 149.98 | 1.08 | Seoul | Mapo | 115.68 | 1.58 | Chungcheongnam | Buyeo | 0.005 | 0.16 | |
| Seoul | Seodaemun | 145.63 | 1.05 | Busan | Yeonje | 112.49 | 1.53 | Jeollanam | Naju | 0.005 | 0.14 | |
| Ulsan | Buk | 138.71 | 1.00 | Seoul | Eunpyeong | 106.54 | 1.45 | Jeollanam | Boseong | 0.002 | 0.06 | |
| Gyeonggi | Gwangmyeong | 137.73 | 0.99 | Incheon | Namdong | 102.09 | 1.39 | Chungcheongnam | Yesan | 0.002 | 0.06 | |
| Gyeonggi | Gwangju | 125.54 | 0.90 | Busan | Nam | 89.21 | 1.22 | Incheon | Jung | 0.002 | 0.06 | |
| Gyeonggi | Yangju | 119.23 | 0.86 | Busan | Dong | 87.41 | 1.19 | Jeollanam | Gurye | 0.002 | 0.05 | |
| Seoul | Dongjak | 114.73 | 0.82 | Incheon | Gyeyang | 87.37 | 1.19 | Incheon | Bupyeong | 0.001 | 0.04 | |
| Ulsan | Jung | 114.17 | 0.82 | Seoul | Dongdaemun | 82.94 | 1.13 | Chungcheongbuk | Imsil | 0.001 | 0.02 | |
| Gyeonggi | Uiwang | 111.31 | 0.80 | Seoul | Seodaemun | 80.57 | 1.10 | Incheon | Ongjin | 0.001 | 0.02 | |
| Gyeongsangnam | Tongyeong | 99.70 | 0.72 | Seoul | Gangbuk | 72.96 | 0.99 | Deagu | Dalseong | 0.001 | 0.01 | |
| Jeollanam | Yeosu | 98.03 | 0.70 | Gyeonggi | Anyang | 70.73 | 0.96 | Busan | Gangseo | 0.000 | 0.01 | |
| Seoul | Songpa | 97.71 | 0.70 | Busan | Yeongdo | 68.80 | 0.94 | Chungcheongnam | Hongseong | 0.000 | 0.01 | |
| Jeollanam | Shinan | 94.65 | 0.68 | Incheon | Seo | 64.47 | 0.88 | Seoul | Seocho | 0.000 | 0.01 | |
| (a) South Korea | (b) Flood Vulnerable Areas in South Korea | |||||||||||
|---|---|---|---|---|---|---|---|---|---|---|---|---|
| Population (×103) | Proportion (%) | Population (×103) | Proportion (%) | |||||||||
| 2000 | 2018 | 2018–2000 | 2000 | 2018 | 2018–2000 | 2000 | 2018 | 2018–2000 | 2000 | 2018 | 2018–2000 | |
| Total | 45,985 | 51,630 | +5644 | 100.00 | 100.00 | - | 19,255 | 20,799 | +1544 | 100.00 | 100.00 | - |
| Male | 23,068 | 25,877 | +2809 | 50.16 | 50.12 | −0.04 | 9660 | 10,340 | +681 | 50.17 | 49.72 | −0.45 |
| Female | 22,917 | 25,752 | +2835 | 49.84 | 49.88 | +0.04 | 9595 | 10,459 | +864 | 49.83 | 50.28 | +0.45 |
| Infants | 6574 | 4280 | −2294 | 14.30 | 8.29 | −6.01 | 2621 | 1683 | −938 | 13.61 | 8.09 | −5.52 |
| Male | 3473 | 2198 | −1275 | 7.55 | 4.26 | −3.30 | 1383 | 864 | −519 | 7.18 | 4.15 | −3.03 |
| Female | 3102 | 2083 | −1019 | 6.74 | 4.03 | −2.71 | 1238 | 819 | −419 | 6.43 | 3.94 | −2.49 |
| School-age | 6756 | 5036 | −1720 | 14.69 | 9.75 | −4.94 | 2853 | 1943 | −910 | 14.82 | 9.34 | −5.48 |
| Male | 3529 | 2614 | −915 | 7.67 | 5.06 | −2.61 | 1494 | 1005 | −489 | 7.76 | 4.83 | −2.93 |
| Female | 3227 | 2421 | −806 | 7.02 | 4.69 | −2.33 | 1360 | 939 | −421 | 7.06 | 4.51 | −2.55 |
| Working-age | 29,281 | 34,859 | +5577 | 63.68 | 67.52 | +3.84 | 12,536 | 14,215 | +1678 | 65.11 | 68.34 | +3.23 |
| Male | 14,778 | 17,877 | +3099 | 32.14 | 34.63 | +2.49 | 6311 | 7190 | +879 | 32.78 | 34.57 | +1.79 |
| Female | 14,503 | 16,982 | +2478 | 31.54 | 32.89 | +1.35 | 6226 | 7025 | +799 | 32.33 | 33.77 | +1.44 |
| Aged | 2294 | 4202 | +1907 | 4.99 | 8.14 | +3.15 | 853 | 1735 | +883 | 4.43 | 8.34 | +3.92 |
| Male | 942 | 1984 | +1041 | 2.05 | 3.84 | +1.79 | 352 | 821 | +470 | 1.83 | 3.95 | +2.12 |
| Female | 1352 | 2218 | +866 | 2.94 | 4.30 | +1.36 | 501 | 914 | +413 | 2.60 | 4.40 | +1.79 |
| Super-aged | 1078 | 3254 | +2176 | 2.34 | 6.30 | +3.96 | 391 | 1222 | +831 | 2.03 | 5.88 | +3.85 |
| Male | 345 | 1205 | +860 | 0.75 | 2.33 | +1.58 | 120 | 460 | +340 | 0.63 | 2.21 | +1.59 |
| Female | 735 | 2049 | +1316 | 1.59 | 3.97 | +2.38 | 270 | 762 | +492 | 1.40 | 3.66 | +2.26 |
| Cluster | Number of Cases in Each Cluster | |||||
|---|---|---|---|---|---|---|
| 1 | 2 | 3 | 4 | 5 | 6 | |
| 2 | 30 | 44 | ||||
| 3 | 35 | 38 | 1 | |||
| 4 | 18 | 25 | 30 | 1 | ||
| 5 | 11 | 12 | 21 | 29 | 1 | |
| 6 | 18 | 2 | 18 | 21 | 22 | 1 |
| Variable | Cluster 1 | Cluster 2 | Cluster 3 | |||
|---|---|---|---|---|---|---|
| Property damage | 94.50 million won/ km2 | 112.43 million won/km2 | 173.53 million won/km2 | |||
| Casualties | 241.09 person/km2 | 10.24 person/km2 | 71.83 person/km2 | |||
| Flooded area | 0.17 km2/km2 | 0.01 km2/km2 | 0.00 km2/km2 | |||
| Male | Female | Male | Female | Male | Female | |
| Population (×103) | 253,366 | 259,782 | 40,145 | 39,388 | 145,500 | 147,723 |
| Infants | 20,284 | 19,209 | 2998 | 2847 | 12,420 | 11,775 |
| School-age | 24,313 | 22,593 | 3454 | 3166 | 14,590 | 13,706 |
| Working-age | 178,617 | 179,774 | 26,298 | 22,947 | 100,926 | 99,145 |
| Aged | 19,866 | 21,822 | 4305 | 4849 | 11,280 | 12,717 |
| Super-aged | 10,285 | 16,385 | 3088 | 5578 | 6283 | 10,380 |
| Population change (×103) | 4273 | 13,851 | −478 | −2088 | 10,025 | 13,011 |
| Infants | −15,278 | −12,679 | −1924 | −1571 | −7734 | −6231 |
| School-age | −14,940 | −12,943 | −2447 | −2173 | −6325 | −5457 |
| Working-age | 14,109 | 17,266 | 693 | −1974 | 12,670 | 11,683 |
| Aged | 12,584 | 11,532 | 1,250 | 402 | 6643 | 6139 |
| Super-aged | 7803 | 10,680 | 1953 | 3230 | 4773 | 6879 |
| Rate of population change | ||||||
| Infants | −77.55% | −67.95% | −101.40% | −91.73% | −71.65% | −61.23% |
| School-age | −65.15% | −60.77% | −86.37% | −88.36% | −50.66% | −46.68% |
| Working-age | +6.71% | +8.63% | −3.44% | −18.70% | +11.29% | +11.24% |
| Aged | +63.06% | +52.87% | +25.03% | +2.80% | +59.51% | +48.62% |
| Super-aged | +75.79% | +64.71% | +62.93% | +57.80% | +76.28% | +66.91% |
| Population proportion | 49.37% | 50.63% | 50.48% | 49.52% | 49.62% | 50.38% |
| Infants | 3.95% | 3.74% | 3.77% | 3.58% | 4.24% | 4.02% |
| School-age | 4.74% | 4.40% | 4.34% | 3.98% | 4.98% | 4.67% |
| Working-age | 34.81% | 35.03% | 33.07% | 28.85% | 34.42% | 33.81% |
| Aged | 3.87% | 4.25% | 5.41% | 6.10% | 3.85% | 4.34% |
| Super-aged | 2.00% | 3.19% | 3.88% | 7.01% | 2.14% | 3.54% |
| Rate of population proportion change | ||||||
| Infants | −3.23% | −2.70% | −2.23% | −1.80% | −3.22% | −2.65% |
| School-age | −3.19% | −2.78% | −2.84% | −2.52% | −2.77% | −2.42% |
| Working-age | +1.58% | +2.21% | +1.88% | −1.50% | +1.75% | +1.44% |
| Aged | +2.40% | +2.17% | +1.69% | +0.68% | +2.13% | +1.90% |
| Super-aged | +1.50% | +2.04% | +2.50% | +4.15% | +1.58% | +2.24% |
| Cluster (number) | Characteristics | Regions (Si/Do/Gun/Gu) |
|---|---|---|
| 1 (18) | Large number of casualties; large flooded areas; low population growth | Seoul: Eunpyeong, Yangcheon, Gangseo, Guro, Yeongdeungpo, Dongjak, Gwanak, Gangnam, Songpa, and Gangdong; Busan: Haeundea; Incheon: Michuhol, Namdong, and Bupyeong; Gyeonggi: Anyang and Bucheon; Chungcheongbuk: Jeonju; Gyeongsangbuk: Pohang |
| 2 (25) | Small and medium cities; population reduction; low birth rate; fast population aging | Busan: Seo, Dong, Yeongdo, and Gangseo; Incheon: Jung and Ongjin; Gyeonggi: Dongducheon and Uiwang; Chungcheongnam: Buyeo, Seocheon, Cheongyang, Hongseong, Yesan, and Taean; Chungcheongbuk: Gimje and Imsil; Jeollanam: Naju, Gurye, Boseong, Wando, and Shinan; Gyeongsangnam: Tongyeong, Sacheon, Miryang, and Changnyeong |
| 3 (30) | Large property damage; high population growth; high proportion of young people | Seoul: Gwangjin, Dongdaemun, Gangbuk, Seodaemun, Mapo, Geumcheon, and Seocho; Busan: Dongnae, Nam, Buk, Saha, Geumjeong, Yeonje, Suyeong, and Gijang; Deagu: Dalseong;, Incheon: Gyeyang and Seo; Gwanju: Nam and Gwangsan; Ulsan: Jung and Buk; Gyeonggi: Gwangmyeong, Gwangju, and Yangju; Chungcheongbuk: Iksan; Jeollanam: Mokpo, Yeosu, and Suncheon; Gyeongsangnam: Jinju |
© 2020 by the authors. Licensee MDPI, Basel, Switzerland. This article is an open access article distributed under the terms and conditions of the Creative Commons Attribution (CC BY) license (http://creativecommons.org/licenses/by/4.0/).
Share and Cite
Lee, H.-K.; Bae, Y.-H.; Son, J.-Y.; Hong, W.-H. Analysis of Flood-Vulnerable Areas for Disaster Planning Considering Demographic Changes in South Korea. Sustainability 2020, 12, 4727. https://doi.org/10.3390/su12114727
Lee H-K, Bae Y-H, Son J-Y, Hong W-H. Analysis of Flood-Vulnerable Areas for Disaster Planning Considering Demographic Changes in South Korea. Sustainability. 2020; 12(11):4727. https://doi.org/10.3390/su12114727
Chicago/Turabian StyleLee, Hye-Kyoung, Young-Hoon Bae, Jong-Yeong Son, and Won-Hwa Hong. 2020. "Analysis of Flood-Vulnerable Areas for Disaster Planning Considering Demographic Changes in South Korea" Sustainability 12, no. 11: 4727. https://doi.org/10.3390/su12114727
APA StyleLee, H.-K., Bae, Y.-H., Son, J.-Y., & Hong, W.-H. (2020). Analysis of Flood-Vulnerable Areas for Disaster Planning Considering Demographic Changes in South Korea. Sustainability, 12(11), 4727. https://doi.org/10.3390/su12114727


