Article

A Data-driven Approach for Sustainable Building Retrofit—A Case Study of Different Climate Zones in China

1
School of Economics and Management, Nanjing Tech University, Nanjing 211816, China
2
Department of Civil Engineering, Faculty of Engineering, The University of Hong Kong, Hong Kong, China
3
School of Architecture, Georgia Institute of Technology, GA 30332-0155, USA
*
Author to whom correspondence should be addressed.
Sustainability 2020, 12(11), 4726; https://doi.org/10.3390/su12114726
Submission received: 7 May 2020 / Revised: 2 June 2020 / Accepted: 4 June 2020 / Published: 9 June 2020

Abstract

:
This study presents a data-driven retrofitting approach by systematically analyzing the energy performance of existing high-rise residential buildings using a normative calculation logic-based simulation method. To demonstrate the practicality of the approach, typical existing buildings in five climate zones of China are analyzed based on the local building characteristics and climatic conditions. The results show that the total energy consumption is 544 kWh/m2/year in the severe cold zone, which is slightly higher than that in the cold zone (519 kWh/m2/year), but double that in the hot summer and cold winter zone, three times higher than that in the warm zone, and five times above that in the temperate zone. The dominant energy needs in different climatic zones are distinctive. The identified potentially suitable retrofitting measures are important in reducing large-scale energy consumption and can be used in supporting sustainable retrofit decisions for existing high-rise residential buildings in different climatic zones.

1. Introduction

While energy is consumed in different commodities, urban areas emit 70% of the total greenhouse gases globally [1]. Energy consumption in existing buildings accounts for about 40% of global energy use, which exceeds the needs of industry and transportation [2,3]. Of this total, space heating and cooling consume approximately 60% [4]. Residential buildings in non-OECD regions consumed less than 50% of overall global residential sector energy in 2012, but that share is estimated to increase to approximately 60% in 2040. Electricity consumption in existing buildings will rise sharply from 31% of the overall energy consumption in 2012 to 47% in 2040 in non-OECD countries. China is the world’s largest energy consumer generally, second largest for all buildings, and largest for residential buildings [5]. The total building stocks in China were estimated to be around 44 billion m2 by the end of 2005 [6], which was increased to over 50 billion m2 in 2010 and is expected to increase to around 58 to 78 billion m2 by 2050 [7]. The lifetimes of buildings in China range from 50 to 75 years [8,9,10]. The rate of energy consumption in China, for example, is expected to increase by an average of 7.4% over the next decade [3], with the total energy need in buildings increasing from the 2005 level by 110–150% by 2050 and by 160–220% by 2095 [11]). Residential energy use has increased by an average of 2.4% per year since 2012 in China [12].
Owing to a rapid increase in urban populations, over 40% of existing dwellings are high-rise buildings in the megacities of mainland China [13,14]. More than 90% of residents live in high-rise buildings in Hong Kong that are located in the warm winter and hot summer zone, and a street canyon with crowded tall buildings is a typical urban feature in this megacity [15]. Existing high-rise apartments account for about 44% of the total residential blocks in Shanghai in the cold winter and hot summer region [16]. More than 90% of existing buildings have a poor energy performance as they seldom incorporated energy-saving measures into the building design when they were built, in order to save costs and shorten the construction time period, because of the shortage of mandatory norms for building energy efficiency and the limitation of financial conditions. As a result, the total building energy consumption has been more than 896 megatons of coal equivalent (Mtce) since 2016, accounting for about 20% of the total primary energy consumption. The energy use of residential buildings has been up to 209 Mtce since 2016, accounting for 23% of the total building energy use [17].
More importantly, the energy consumption in the housing section keeps going up, which is driven by a growing service need, thermal comfort improvements, and aging equipment and buildings [18]. Existing high-rise residential buildings have an increasing need of retrofitting for a higher building performance and a better indoor environment, and retrofit solutions should consider new integrated energy-saving strategies in China [19]. While high-rise residential buildings account for a large proportion of the building stock and energy consumption is increasing dramatically, introducing sustainable retrofit to high-rise residential buildings should therefore help reduce energy consumption, and hence achieve reduction targets of energy consumption in a country or city [20,21]. For instance, the national energy-efficient target for the residential sector in China is retrofitting more than 60% of existing housing buildings until the end of 2020 in order to achieve a higher building energy performance [17]. Sustainable retrofit is one of the most effective measures to reduce large-scale energy consumption as well as the associated carbon emissions and other environmental impacts of existing buildings. An evaluation of energy performance could help unveil the potential retrofitting scope so as to determine the applicability of various sustainable retrofit measures for buildings under different climatic conditions.
Building performance simulation (BPS) has become an important method in retrofitting existing buildings as it not only can predict the energy savings from building upgrades, but also evaluate the financial benefits and thermal comfort improvements [22]. By using BPS we can not only analyze the current performance and predict the future thermal performance of existing buildings after retrofitting, but also help identify the energy savings by subtracting the post-retrofit energy use from the pre-retrofit, which represents the building performance improvements produced by renovation [23]. Numerous studies have examined energy consumption in buildings using various simulation models or forecasting engines [24,25,26,27]. Schiefelbein et al. [1] used an energy modeling approach based on the open source geographical information system (GIS) datasets to reduce input data uncertainty, where building models with representative geometries and physical properties were generated based on building archetype information in Germany. A similar study was conducted by Chen et al. [28] in the USA, which highlighted the simulation of urban building energy performance by developing the dataset based on the GIS data of the existing building stocks. EnergyPlus software is also commonly employed to simulate the building energy and to quantify the potential savings of energy due to the use of a variable speed unit on the rooftop of the referenced building [29] and the specific energy performance of residential buildings due to the heating, ventilation, and air conditioning (HVAC) system’s on/off controller in the USA [30]. Other tools, such as eQuest software [31], DesignBuilder v4.2 [32], an integration of EnergyPlus with DesignBuilder [33], building information modeling (BIM) [34], and so on, were used to analyze the building energy performance for different applications globally. It is hard to compare one BPS with another, since each has advantages and disadvantages [35]. All the above simulation tools are based on sophisticated dynamic energy simulation programs, although they are the most common methods to evaluate and predict building performance [36]. However, these programs require specific building material parameters, detailed HVAC systems, definite operation schedules, and dynamic environmental conditions, but collecting these materials is a tremendous workload for a country without a national database system of building information; meanwhile, building and calibrating a performance simulation model is time-consuming and comprehensive because of the required numerous complicated inputs [37,38]. Due to the lack of a simplified simulation method for the wide range of data—especially for temporal, spatial, and climate variability—energy simulation is often complex and difficult with the existing methods [39,40]. On the other hand, it is impossible to amend the engines of most dynamic simulation tools, since the model calculations are complicated and it is hard to connect control algorithms with those simulation tools [41]. Therefore, it is better to adopt a reduced-order simulation tool such as the normative model, which requires simplified parameters and modeling time but has functions similar to complicated dynamic simulation programs, with an open calculation engine to evaluate the building thermal performance in order to identify the most appropriate retrofitting solutions for existing buildings. The normative simulation method is an effective approach to calculate the energy performance of existing buildings and predict the reliable retrofit solutions based on less input information, modeling time, and calculation complexity [42]. Several advantages are associated with the use of a normative calculation approach, such as faster computational capability, transparency, robustness, and reproducibility [43,44]; it provides an effective way to encourage energy performance rating [45] and the calculations are suitable for energy characterization and energy labeling in buildings [46], etc. It does not only estimate the baseline energy consumption in a building, but it can also explore the energy efficiency and cost-effectiveness of retrofit technologies for an existing building [44]. The approach is widely applied in different studies for single to large-scale building energy management applications [43,45,47,48].
Building energy savings caused by energy-efficient measures vary greatly from one climate to another during a life cycle [49], and thus, a specific retrofitting solution has distinct economic viability and can improve energy efficiency based on different building characteristics and climates [50]. Several studies concentrated on retrofit solutions applied to a single broad climatic zone and seldom analyzed the impact of differences in climatic conditions among various regions on the energy-efficient and cost-effective retrofit decisions in a country. According to the climatic conditions in Hong Kong, the most suitable green retrofit methods refer to 28 technologies and the recommended energy-efficient renovation solutions are relevant to six categories [51]. The most common retrofit measures in northern China consist of wall insulation and improvements in the heating system, including the heating distribution pipe system, metering devices, and heating plant [52]. In particular, the retrofit measures related to controls on a heat exchange station are some of the important critical factors in the heating systems in northern China, which can save around 18.5% energy use after improvements [53]. These studies showed that the most appropriate retrofit solutions for a climate zone may be inapplicable to other climatic regions because of the different climatic conditions. Even if the same retrofit measure can be employed in various climatic zones, its specific size/thickness/projection may vary in different regions because of the discrepancies of climatic conditions and major energy needed. To identify the optimal retrofit solutions for a specific climate zone, it is essential to explore the impact of climatic conditions on the choices of proper retrofit measures. Therefore, this paper aims to find out the potentially suitable retrofitting measures by evaluating the building thermal performance through a simplified energy simulation model (based on a normative simulation method) developed on building prototypes with local building characteristics, specific construction materials, and the relevant thermal properties in diverse climatic zones, including analysis of the composition of building energy consumption.

2. Methodology

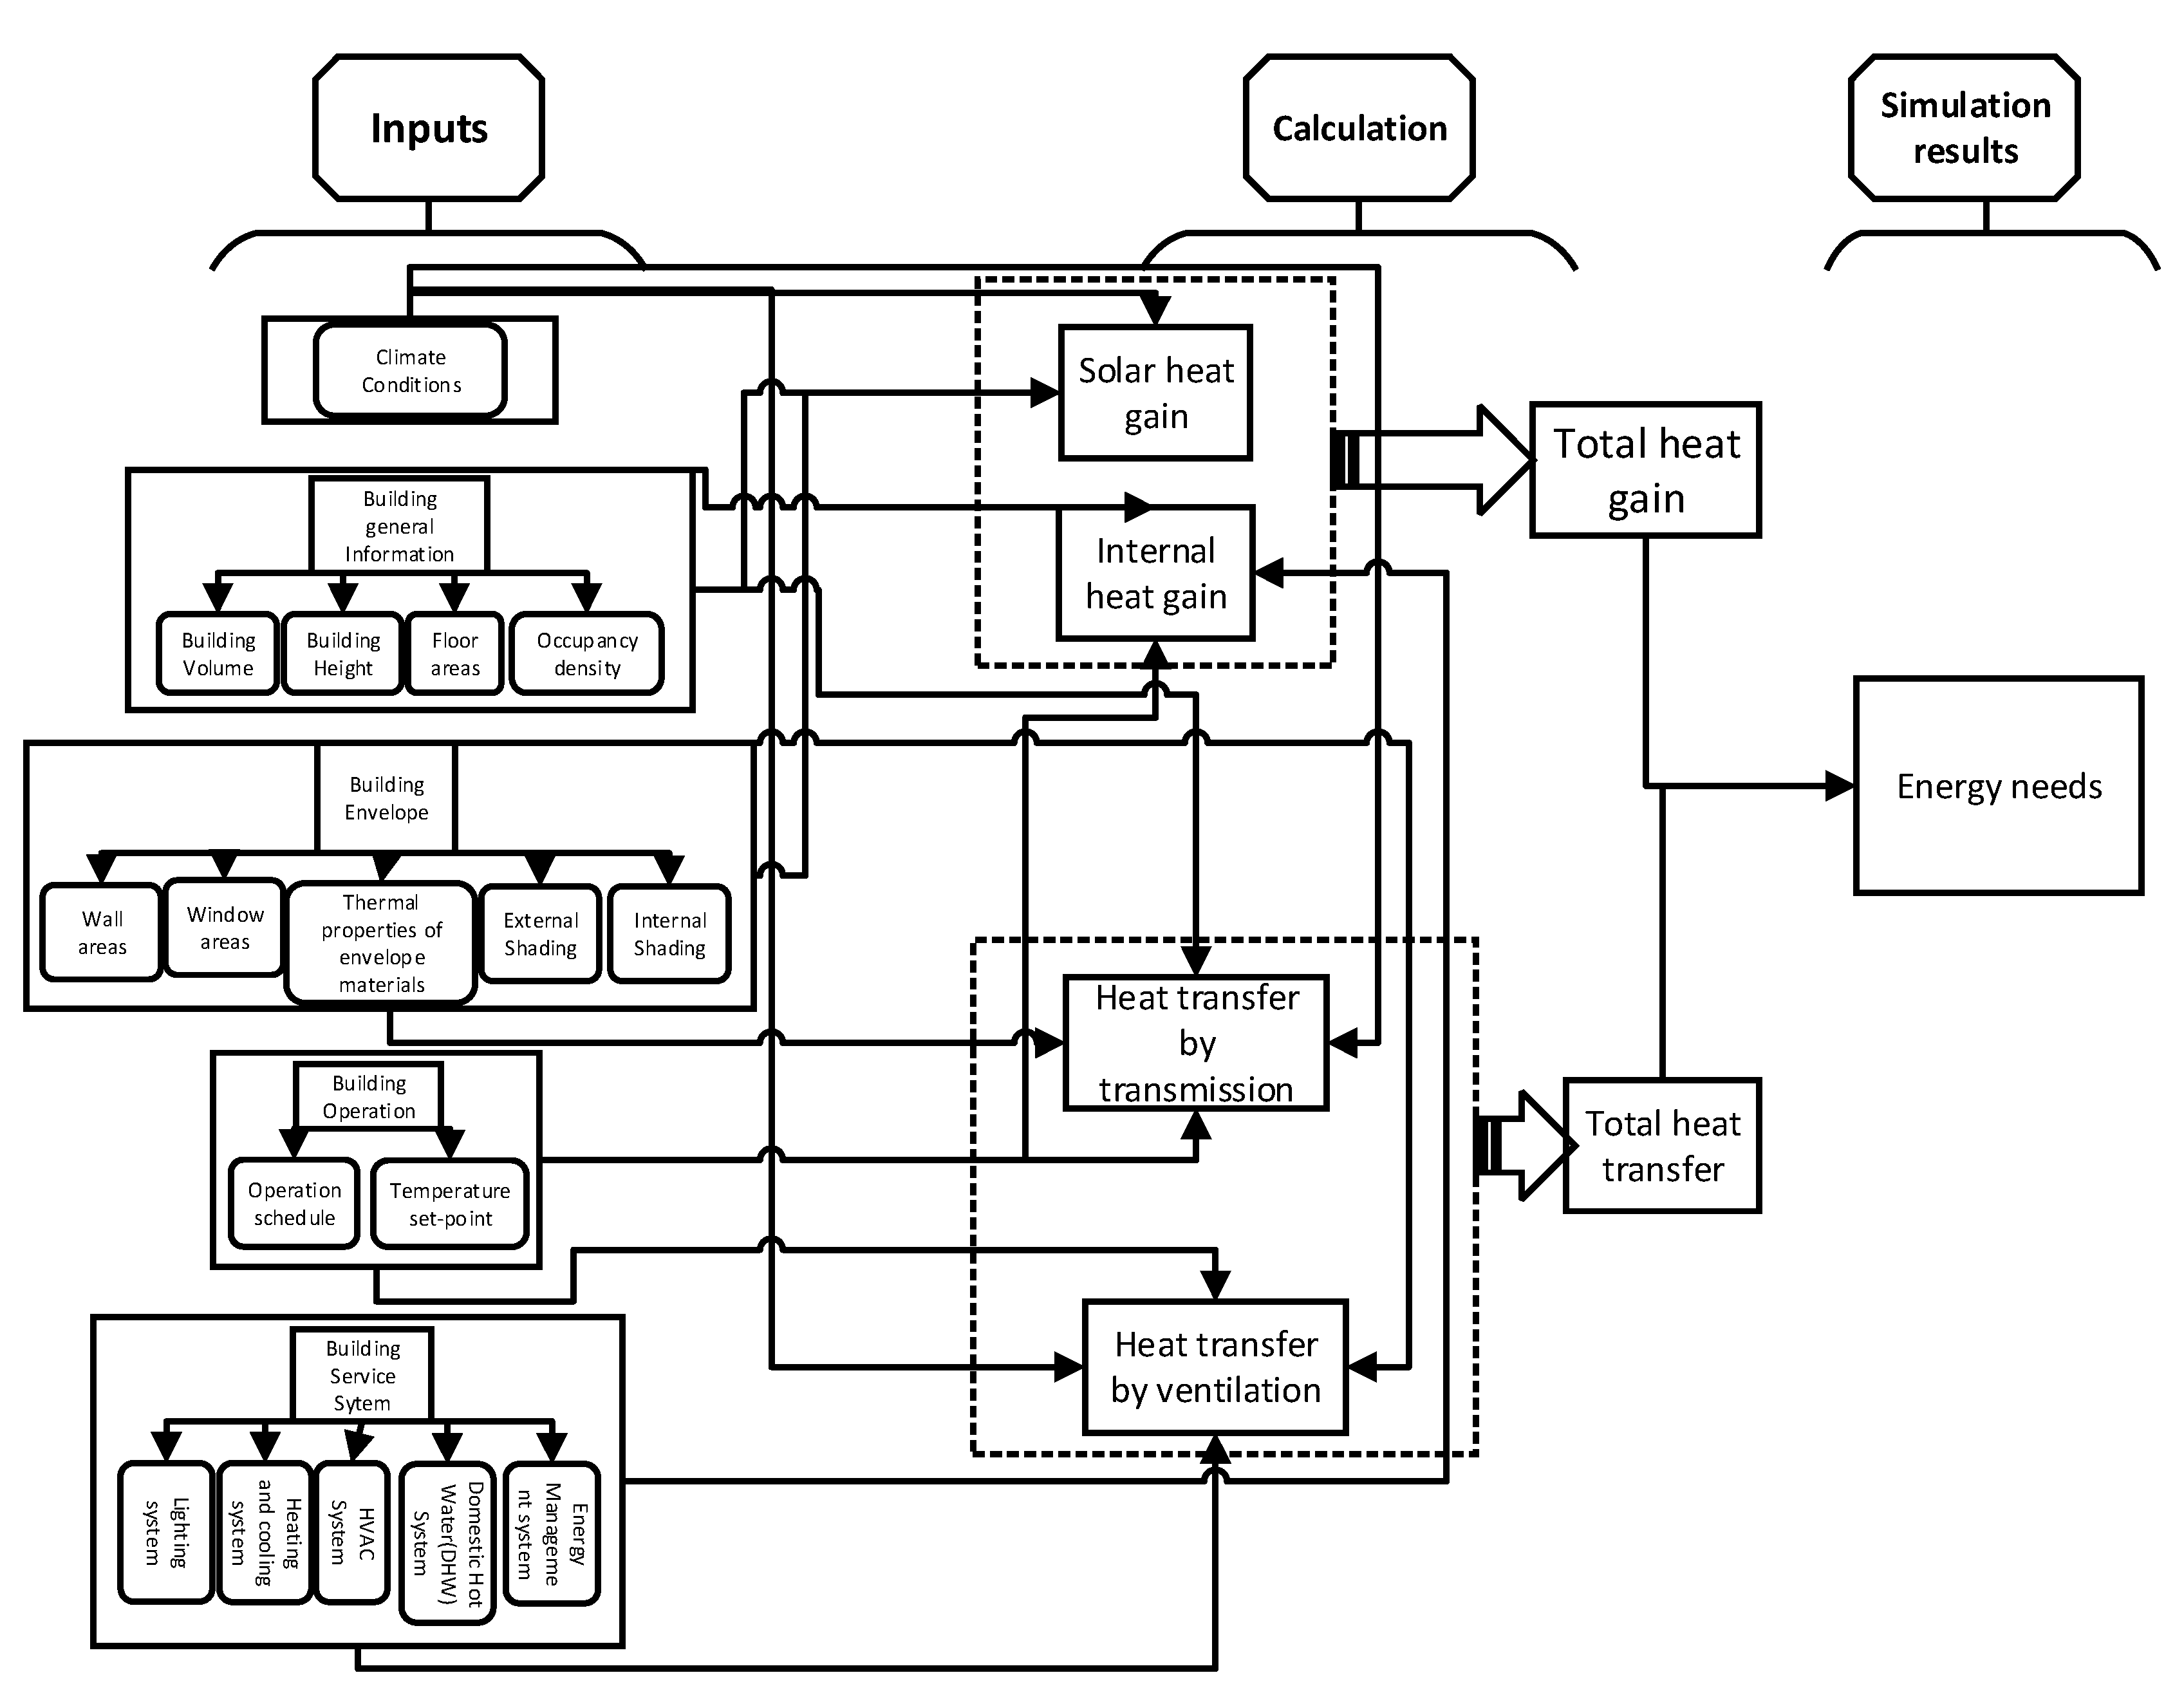
The simplified workflow of the study is shown in Figure 1.

2.1. Principles of the Simulation Model

The purpose of simulation is to simplify the reality, and thus it is better to keep the model as simple as possible to meet the objectives of the simulation [54]. One of the most common building energy analysis methods is normative calculation, which follows the standards developed by the European Committee for Standardization (CEN) and International Organization for Standardization (ISO). Its calculation method employs a set of normative statements, including those concerning the building envelopes and systems of different types of buildings. Based on its simplicity and unified model assumptions, normative calculation simulates the building energy performance in a transparent and standard way. This method is easier to use because of its simplicity in the data capturing and calculation process, compared to the transient dynamic simulation methods. Although its calculation results may not be the most accurate in observing the physical variable, it is also sufficiently reliable for estimating the building energy performance [55]. Normative calculation also can avoid modelers’ biases and reduce modeling errors since it is not only transparent, but it also limits the inputs and makes assumptions according to the standards [56]. Meanwhile, it can produce a reliable energy performance assessment with confidence equal to or higher than the dynamic simulation programs, despite having some deficiencies in presenting specific building characteristics, and thus, normative calculation has been widely applied to building retrofit analysis [57,58].
Normative calculation is usually used in some reduced-order models, which adopt simple inputs to calculate energy performance and present the output data in a simplified way [56]. Reduced-order energy analysis is an effective strategy to reduce the complexity and required orders of a simulation model. This simplified method loses some of the accuracy, but it can increase the computing efficiency considerably. As a result, the reduced-order model can be used to determine the best inputs to the energy model and the optimal strategy for the best building energy efficiency with the minimum cost [41].
The EPC was developed on the Excel platform, which can integrate the optimization process with energy simulation. This platform not only helps users evaluate the building thermal performance, but it also allows them to develop their own optimization model to conduct decision analyses. Apart from being transparent and objective, the EPC can quickly evaluate the energy performance and support rapid decisions for energy-efficient strategies through the Excel platform [59]. The usability, reliability, and fidelity of the EPC was demonstrated by earlier studies, and its capacity is completely sufficient for comparing the building thermal performances caused by different building parameters [35,59,60,61]. The simulation flowchart is given in Figure 2. The energy performance calculator (EPC) used in this study, which was developed by Georgia Institute of Technology, is a reduced-order simulation based on the normative calculation logic and it can work as a dynamic simulation program. The EPC does not only require fewer input parameters than some traditional dynamic simulations, but also features robust and easily reproducible advantages. Its open program allows users to change and choose appropriate parameters for simulation, which is forbidden in a general normative model. This study adopted this tool to predict building thermal performance as it requires less and simpler input information than the other more complicated dynamic simulation tools available. More importantly, it permits the alteration of links involved in the calculation engine according to the user’s need. As shown in previous relevant studies, most simulation models have deterministic frameworks and it is difficult to change the calculation code of the simulation program as the source code is large and complicated and most of it is not open to the public [62].
In order to identify the optimal solution through the EPC, an add-on for the optimization process, which is called EPC-Tech-OPT, was used. Tech-OPT is a product of the expanded EPC that can determine the optimal set of technologies for the purpose of minimizing the cost, maximizing the energy savings, etc. The optimizing process is carried out in Solver, which works as an add-on in Excel. The basic input data and relevant standards are provided on the EPC spreadsheet. The whole calculation process of the EPC is conducted in Excel without any external calculation engine, computing code, or other interfaces. As mentioned before, normative calculation tends to reduce the inputs to ensure a simple process, and thus there are only eight required groups of building parameters, including (i) building general information; (ii) building systems; (iii) renewable energy (RE) systems; (iv) energy source; (v) thermal zones; (vi) operation schedule; (vii) building envelope, i.e., heat capacity, size, and orientation; and (viii) thermal properties of envelope materials. It does not require specific technical parameters for its simulation. The detailed categories of inputs are described in Table 1.

2.2. Simulation Logic and Governing Equations

2.2.1. Simulation Logic

As mentioned above, the reduced-order energy simulation tool was developed according to the CEN-ISO standard, which describes the calculation logic of the building thermal performance. This logic can show the main primary relationship between the thermal properties of building components and their calculated energy performance. The calculation logic illustrates how the thermal properties of a building will determine the energy use within it. In terms of such a logic, we can gain a deep understanding of the contributions of a building retrofit with improved building characteristics to a building’s energy efficiency.
The building energy consumption primarily lies in the energy need that is caused by heat gain and heat transfer between the indoor and outdoor environments. The gap between the heat transfer and heat gain results in the total indoor energy need, and the energy need determines the energy consumption when the energy efficiency of mechanical systems is fixed. The major concern regarding the calculation of energy need is how to compute heat transfer by means of transmission and ventilation of a building zone, internal and solar heat gains, and the energy need for heating, cooling, domestic hot water (DHW), and so forth. In order to calculate the building energy consumption, the starting point is the calculation of heat transfer, which has a close relationship with the building characteristics, and the steps for the whole simulation are as follows:
(1)
Calculate the heat transmission between indoor and outdoor environments. The heat transmission through the building envelope mainly depends on the envelope materials and the temperature difference between inside and outside environments;
(2)
Calculate the heat transfer by ventilation. The heat transfer by natural ventilation or by a mechanical ventilation system is governed by the difference between the temperature of the conditioned zone and the supply air temperature;
(3)
Calculate the internal heat gain. Heat gain is composed of internal heat gain and solar heat gain. According to CEN-ISO standard 13790 [63], internal heat gain is caused by domestic appliances, occupants’ activities, lighting, the HVAC system, hot water and sewage, processes and goods, and so forth;
(4)
Calculate the solar heat gain. The solar heat gain refers to the direct heat gain through windows and indirect heat gains through opaque materials, therefore, this parameter has a close relationship with the building characteristics and climate conditions;
(5)
Calculate the building energy need. According to the above four steps, there is a definite gap between heat gain and heat transfer, and hence the energy need of a building in a certain climate zones is obtained;
(6)
Calculate the building energy consumption. Based on energy need, building energy consumption is still controlled by the energy efficiency of the mechanical systems. Higher energy efficiency means that less delivered energy will be required to meet energy need, given that energy need remains constant. In other words, there are two effective aspects that have a great potential to reduce energy consumption in a building: (i) reducing the energy need, and (ii) improving the energy efficiency of the mechanical systems. The combination of these aspects presents the best way to improve the building thermal performance.

2.2.2. Governing Equations

The total heat transfer by transmission can be defined by Equation (1) extracted from the CEN-ISO standard 13790: 2008 (i.e., eqn. 16 as found in the standard), which is formulated as
Q t r = k { H t r , k × ( θ θ e , k ) } × t
Equation (1) shows that heat transfer through a building element between two thermal zones/environments mainly relies on the heat transfer coefficient (thermal properties of a building element), the temperature of two thermal zones [63]. The heat transfer coefficient of a building element represents its thermal transmittance, which is expressed in the U-value (W/(m2·K)). The heat transfer between the indoor and outdoor environments is one of the major sources of increasing heating and cooling need; thus, the U-value of a building component is a critical factor in determining building thermal performance.
The total heat transfer by ventilation depends on the heat transfer coefficient by ventilation of the air flow of element k, the required indoor temperature, and the supply temperature of the air flow element k. Their relationship is described by Equation (2) extract from the CEN-ISO standard 13790: 2008 (i.e., eqn. 20 as found in the standard) as follows:
Q v e = k { H v e , k × ( θ θ s , k ) } × t
The significant factor in Equation (2) is the heat transfer coefficient by ventilation, which is mainly determined by the heat capacity of air per volume and the time average air flow rate of air flow element k [63]. One of the three decisive factors is the air flow rate, which is strongly related to air leakage of a thermal zone. This relationship means that more attention should be paid to air leakage when upgrading an existing building, as air leakage can lead to different degrees of heat transfer and increase energy consumption. Regarding the other decisive factors involved in the equation, it is obvious that both the mechanical systems (referring to ventilation, cooling, or heating) and the building envelope (referring to air infiltration) are the key factors that can affect the ventilation heat transfer coefficient, which determines heat transfer by ventilation.
The internal heat gain is provided within the building by occupants (sensible metabolic heat) and by appliances such as domestic appliances, office equipment, etc., other than energy intentionally provided for heating, cooling, or hot water preparation. According to the simple hourly calculation method, the sum of the heat flow rates from internal heat sources in the considered building zone, Φ i n t , as expressed in watts, is calculated for each hour as given by Equation (3) extracted from the CEN-ISO standard 13790 (i.e., eqn. 35 as found in the standard) as follows:
Φ i n t = k Φ i n t , k + l ( 1 b t r , l ) Φ i n t , u , l
This calculation logic indicates that the energy efficiencies of lighting systems, mechanical systems, and appliances have significant impacts on internal heat gain. Thus, the thermal performance of building service systems can affect energy consumption directly because of their own energy needs, and this would also lead to some additional indirect energy need. To reduce the total energy consumption, it is necessary to improve the energy efficiency of the mechanical systems and lighting systems.
Solar heat gain is the major source of excessive cooling need in summer, and solar heat gain through building elements can be expressed by Equation (4) extracted from the CEN-ISO standard 13790 (i.e., eqn. 43 as found in the standard) [63] as follows:
Φ s o l ,   k = F s , o , k × A s , k × E s , k F r , k × Φ r ,   k
It can be seen from Equation (4) that several critical factors might affect the solar heat gain, including the shading reduction factor (SRF) for the external envelope and solar irradiance, which rests on climatic conditions. The SRF, which is related to the shading devices, plays an important role in solar heat gain. Obviously, solar heat gain can increase cooling consumption, and thus an effective way to reduce energy consumption is to decrease solar heat gain by using shading devices attached to the building envelope.

2.3. Typical Cities with High-Rise Buildings in Various Climates

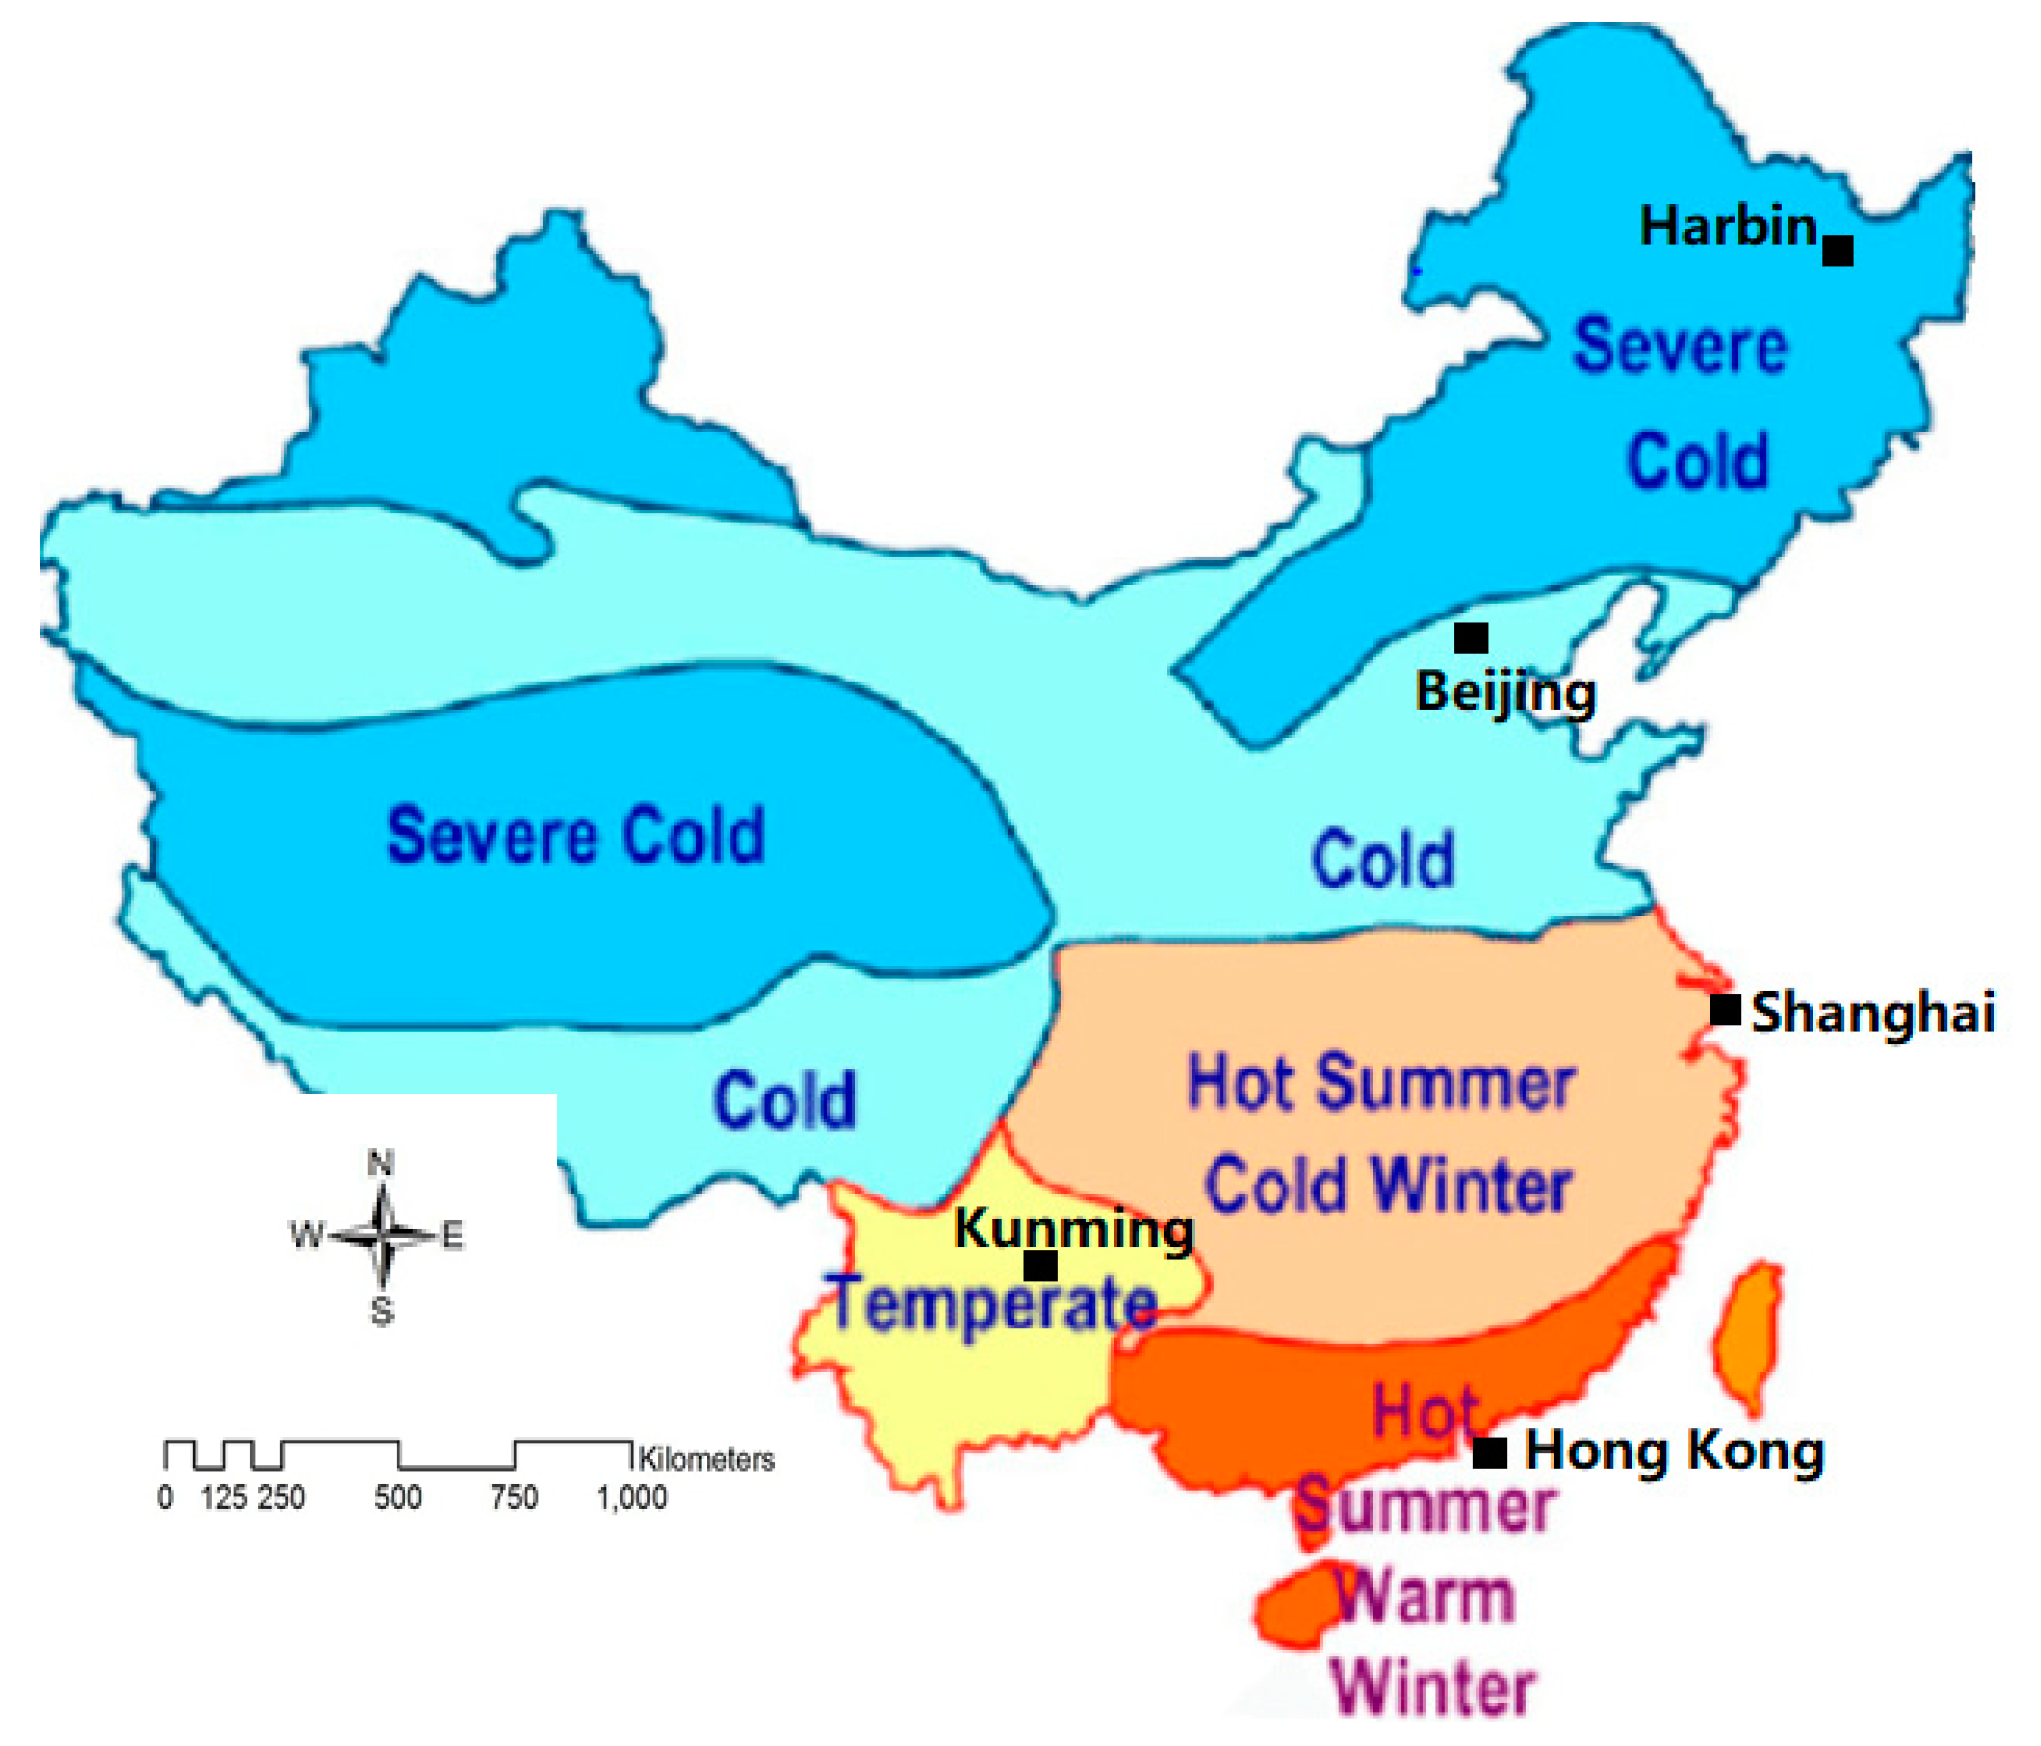
There are five different climatic zones in China, including the warm zone (often called the hot summer and warm winter zone), temperate zone, hot summer and cold winter zone, cold zone and severe cold zone, as shown in Figure 3. These climatic zones not only have diverse average temperatures in summer and winter, but also feature distinct relative humidity levels. For instance, the mean temperature in the severe cold zone is less than 25 °C in July, but it is in the range of 25–30 °C in the hot summer and cold winter zone in the same month. The annual average relative humidity varies from 50% to 70% in the severe cold zone, but it ranges from 70% to 80% in the hot summer and cold winter zone. These diverse climatic conditions have important impacts on building designs, energy consumption, and building retrofit solutions. In each climatic zone of China, high-rise residential buildings are concentrated in big cities because of the high population density. The cities with the highest population density in the five climatic zones in China are Hong Kong (6544 people/km2) in the warm zone, Kunming (318 people/km2) in the moderate zone, Shanghai (24,137 people/km2) in the hot summer and cold winter zone, Beijing (17,232 people/km2) in the cold zone, and Harbin (3164 people/km2) in the severe cold zone [14,64,65,66,67]. The majority of the population live in high-rise residential buildings in urban areas in China and this living trend has dominated the housing market in major cities since 1990s; hence, it is worthwhile focusing on the cities with the highest population density, which is the critical factor in driving up the quantity of high-rise residential buildings in a certain climate. The energy consumption in these existing high-rise residential buildings has increased significantly and will keep going up because of the improving household requirements, and so retrofitting is deemed a priority to operate existing residential buildings in an energy-efficient way during their lifespans [19]. Therefore, the building prototypes for energy-efficient retrofitting analysis in this study depended on the building characteristics and climate conditions in the above cities in the five climate zones, which mainly refer to local climate information and building characteristics.

2.3.1. Warm Zone

Hong Kong is a typical city in the hot summer and warm winter zone of China, with a high population density and a large concentration of high-rise buildings. A street lined with high-rise buildings is a typical urban feature in this city [15]. Due to its warm climate, Hong Kong experiences temperate winters, and therefore heating need is low and usually negligible. The outdoor relative humidity is high in Hong Kong, with an annual average value of up to 78% [68]. If some households do require heating, typically in winter, they usually use heaters or split room air conditioners (ACs) to provide heating as ACs can provide heating or cooling according to the requirements of indoor thermal comfort in different seasons. The typical coefficient of performance (COP) of such an AC is 2.5. The temperature set point of cooling in summer is 24 °C, according to the energy-efficient requirements in Hong Kong [69]. According to the code issued in 2005 for the energy efficiency of ACs, the COP of cooling is no less than 2.4, while the COP of heating is no less than 2.8 [70]. Thus, it was reasonable to deem the cooling COP and the heating COP of a typical apartment as 2.4 and 2.8, respectively. Ventilation is one of the most important factors of maintaining acceptable indoor air quality in buildings, and the most common type in residential buildings in Hong Kong is natural ventilation. In particular, public housing usually adopts natural ventilation to reduce energy consumption [71], thus it was assumed that natural ventilation should be adopted in the building prototype for Hong Kong.

2.3.2. Temperate Zone

A typical city in the temperate zone is Kunming with the highest population density in the temperate zone, in which buildings need to comply with the regulations and codes issued by Yunnan province, as Kunming is the capital of this province. The relative humidity is around 70% in Kunming [72]. According to the lighting design standards for residential buildings issued in 2004 and 2013, the lighting power density is around 7 W/m2. Fluorescent lamps are mentioned in both these standards, and most incandescent lamps have been replaced by fluorescent lamps in residential buildings because of their superior luminance at the same level of energy consumption and at a similar cost [73]. The split ACs have been very popular in residential buildings, and they are the dominant heating and cooling appliance in southern China, especially in temperate climates. The COP of heating and cooling should conform to the energy-efficient standard of room air conditioners, which is applied nationwide. ACs used at different time periods comply with different standards issued at different times. The standard issued in 2004 required the standard COP of air conditioners to be no less than 2.5, while the renewed standard was set at a higher requirement (its minimum COP is around 3.0) in 2010 [74]. The life span of an AC is around 15 years [75]. The typical building was built in the 1990s and the average energy efficiency of its ACs would be around 2.5, in order to conform to the rule issued in 2004. Thus, the COP of an AC was assumed as 2.5 in this study.

2.3.3. Hot Summer and Cold Winter Zone

This study selected the high-rise building characteristics in Shanghai as a reference to identify the simulation features of a high-rise apartment prototype in the hot summer and cold winter zone. The yearly average relative humidity in Shanghai is around 74%, which is in the range of 70–80% for the hot summer and cold winter zone. The average temperature is 27.8 °C and 3.5 °C in the hottest month and coldest month, respectively [76]. Due to the weather conditions, there is both a heating and a cooling need in Shanghai, but there is no central heating system to provide heating or cooling for residents, as more than 80% of households use ACs to keep the indoor environment warm or cool in different seasons [77].

2.3.4. Cold Zone

Beijing is a typical city with a high density of high-rise buildings, owing to the highest population density in the cold zone. The most popular heating system in existing residential buildings is the central heating generated by a gas-fired boiler in a community in Beijing, according to the requirements of the energy-efficient design standard issued in 2006 [78]. Until 2010, more than 70% of heating had been provided by boilers using natural gas or coal in Beijing, with natural gas boilers comprising more than 40% of the total heating system. If we focus only on the natural gas-fired boiler, its COP can usually reach around 0.8 in China [79], but if taking the energy efficiency of the distribution pipes of a heating system into account, the heating COP of the whole system is less than that of a single heating plant. The real COP of the heating system in residential buildings may be approximately 0.74 in Beijing, as shown in some retrofitting. Hence, the heating system was presumed to be a natural gas-based central heating system and its COP was deemed as 0.74. According to the weather information for Beijing mentioned in the standard of climatic regionalization for architecture, the average temperature in winter is about −4.5 °C, but summer there is still quite hot. The annual average relative humidity is around 60% because of Beijing’s dry weather. To keep the indoor environment comfortable in summer, occupants in residential buildings usually employ split air conditioners to provide cooling, especially in old housing estates [80].

2.3.5. Severe Cold Zone

Harbin is located in the central area of a severe cold zone in China and is a typical city with the highest population density. In Harbin, there are three major types of heating systems: (i) combined heat and power (CHP) district heating; (ii) central heating from large, medium, or small coal or gas-fired boilers; and (iii) separate heating for individual households. Due to the extremely low temperature in winter, heating is always turned on in the severe cold zone, and thus the heating operation schedule was assumed to be 24 h in the prototype, i.e., continuous. The average living space per person was about 20 m2 per person in urban areas of Harbin in 2008 [81].
The general information for building prototypes in different climate zones in China is given in Table 2, and the thermal properties of the building prototypes are shown in Table 3. Detailed information of the prototype buildings in different climatic zones are given in the Supplementary Information (S1–S5).

2.4. Prototype Buildings

2.4.1. Warm Zone

The standard building design led to similar building characteristics of public blocks built in the 1990s. Accordingly, the layout of the simulation prototype for Hong Kong in the warm zone was assumed to be similar to the “Harmony Shape,” and accordingly, the configuration of the prototype apartment took the design of the Harmony Shape building as a reference. To explore the effect of solar heat gain through the building envelope on building energy consumption, it was better to expose the envelope of the building prototype to the external environment as much as possible. This study built up the prototype by integrating it with information from an apartment in an existing Harmony building on the northwest corner that had more elements facing the outside environment, in order to investigate the effects of the climatic conditions on the energy-efficient retrofit solutions, as shown in Figure 4. Due to sharply escalating housing prices, more than 90% of apartments have less than 70 m2 of floor area, with an average range between 40 m2 and 69.9 m2 [11]. Using the building drawings collected from the Housing Authority, the specific configuration of each apartment in a Harmony residential building can be identified, including floor area, layout, and so forth. The floor area of a sample apartment on a standard floor is around 48 m2 in terms of the information described in the collected designs, thus it was reasonable to assign a 48-m2 floor area to the prototype. More information of prototype building can be found in Supplementary Information S1.

2.4.2. Temperate Zone

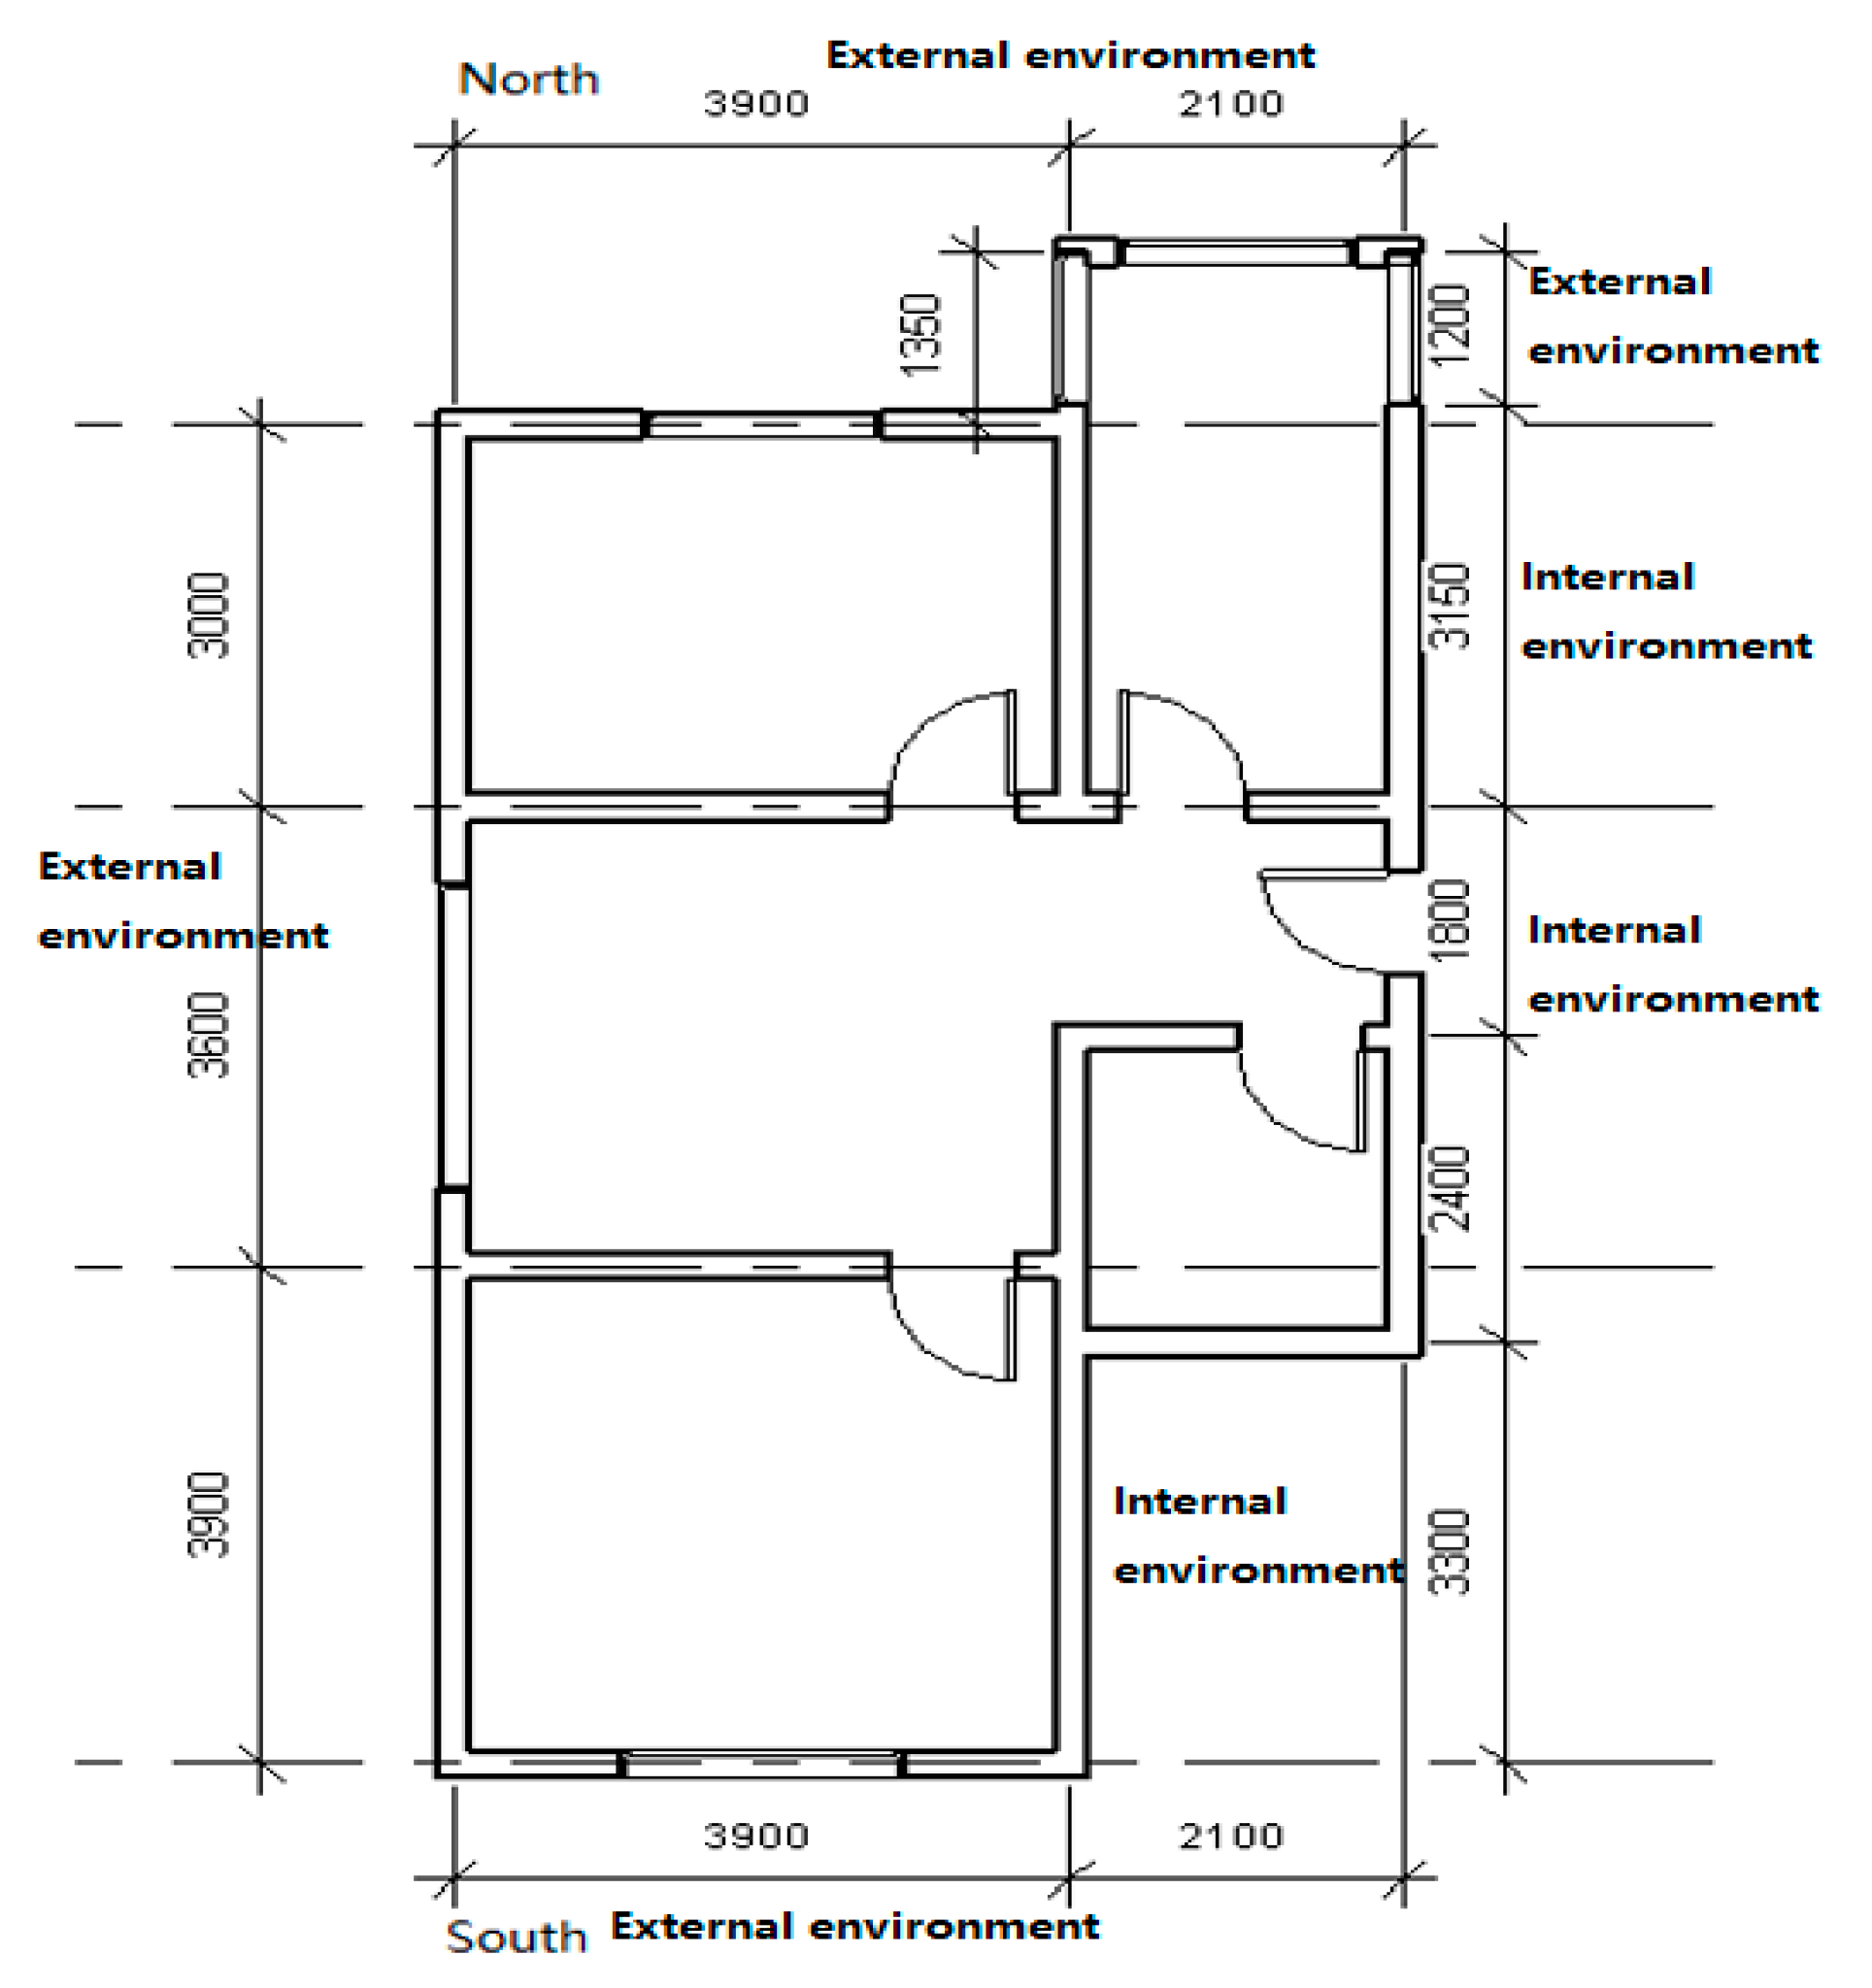
Apartments with a floor area of 100–120 m2 dominated the housing sector in the 1990s [26] and the average floor area of an apartment built at that time was around 117 m2. This study took an apartment with about 116 m2 as an example to investigate the potential retrofit solutions for high-rise housing in the temperate zone. Most existing old residential buildings have a north–south orientation, as this direction carries strong cultural connotations in China. A survey on building thermal environments in Kunming showed that high-rise buildings with 8–15 floors account for 31% of the existing residential buildings. High-rise buildings are mainly located in several districts of Kunming, and the Cuihu district is one area dense with high-rise residential buildings [42]. In the district, the common shape of an old residential building is rectangular, and most apartment windows face north and south, according to information provided by the online sales market for secondhand housing. Taking the layout of existing apartments from the online housing market into account, the simulation prototype of an apartment was designed as in Figure 5. More information of the prototype building can be found in Supplementary Information S2.

2.4.3. Hot Summer and Cold Winter Zone

Since 1995, combined high-rise residential buildings with more than nine floors and consisting of several apartments sharing stairs and an elevator in a block have become popular. There may be two, three, four or even eight apartments on a floor in a combined apartment building. The most common floor areas for an apartment are around 60–70 m2 (including the auxiliary areas, and the actual indoor areas are less than 60 m2) due to skyrocketing housing prices. Several high-rise residential buildings were renovated in order to improve their thermal performance and indoor comfort and a well-known one is located in Jinyangerjiefang. The building design and building characteristics provided a guide to establish the prototypical apartment in Shanghai [63]. Taking the common floor area of an apartment and the layout design of Jinyangerjiefang as a reference, the layout of an apartment prototype with a 53-m2 floor area with a north–south direction was designed, as seen in Figure 6. In order to compare the simulation result of this prototype with that in other climates, the study still assumed that the prototype was situated in the northwestern corner of a building as described in the following picture. The prototypical apartment was therefore oriented on the east–west axis with most of the windows facing the south and north. The floor height was assumed to be the same as the previous climates, which was 2.7 m. More information of the prototype building can be found in Supplementary Information S3.

2.4.4. Cold Zone

In order to reflect the real situation of existing high-rise residential buildings in cold zones, the layout of the simulation prototype took the retrofit project as a reference. The energy-efficient retrofit project carried out in cold and severe cold zones was named “Sino-German Technical Cooperation—Energy Efficiency in Existing Buildings”; the project aimed to reduce energy consumption in existing old residential buildings and improve their indoor thermal comfort. According to the retrofit project in Beijing, the existing high-rise buildings built in the 1990s have 18 floors with a 2.7-m floor height. On the standard floor, there are always eight apartments, and floor areas differ from 40–65 m2, but the most common apartments have around a 50-m2 floor area with two bedrooms and a small living room [69]. The prototype was designed as about 57 m2 with two bedrooms and one living room (Figure 7). In order to be consistent with prototypes in other climatic zones, the prototype in the cold was still situated in the north–west corner on a floor; there are two windows on the north, one on the south, one on the west, and one on the east, in order to investigate the effect of climatic conditions on building energy consumption, none of which considered shading devices. More information of the prototype building can be found in Supplementary Information S4.

2.4.5. Severe Cold Zone

In Harbin, most residential buildings built in the 1990s are medium high-rise buildings consisting of 7–8 floors and account for 73.4% of the total residential buildings [81]. The dominant shape of high-rise residential buildings in Harbin is rectangular with a long length on the east–west axis but short width on the north–south orientation. The north–south orientation is always the most culturally popular building direction in any time period, as discussed previously. In fact, the most common building orientation in severe cold zones is still north–south, since it can maximize solar heat gain and reduce energy consumption [82]. Based on the above information about apartments built in the 1990s in Harbin, the apartment prototype was designed with a 59-m2 floor area with a rectangular shape on the north–south orientation (Figure 8). More information of the prototype building can be found in Supplementary Information S5.

3. Results and Discussion

3.1. Energy Need and Consumption in Different Climatic Zones

3.1.1. Warm Zone

Based on the prototype for the warm zone, the simulation model was built up and the energy need and energy consumption were calculated by the EPC tool on the Excel platform. Figure 9A shows the monthly heating and cooling need for one year in the warm zone. The cooling need predominated in most seasons, from April to November, and the peak cooling occurred in July. This was due to the long, hot summer, which can last for about six months, from May to October. The peak energy need for cooling reached 22.5 kWh/m2 over the duration of the hot and humid summer, and even at its lowest, the energy need was still more than 10 kWh/m2. Compared to the cooling need, the heating need was much less in winter, since the cold season is quite short in the warm zone. January is the coldest season, but the highest monthly heating need was around 3 kWh/m2 during all required heating months. In February and December, the heating need was less than 2.5 kWh/m2, which only accounted for about 10% of the peak cooling need. This simulation result confirmed that a retrofit measure for reducing the heating need would have no significant impact on the improvement of the whole building thermal performance.
It can be seen from Figure 10A that the annual total energy use was about 202 kWh/m2 in the prototype apartment, most of which was consumed in the summer season (details are given in the Supplementary Information, Table S6). The largest proportion of energy consumption, more than 14%, occurred in July because of high cooling consumption. Energy use was very similar between the months of June and September, since cooling need was the dominant energy requirement for this entire period. For instance, cooling consumed more than 54% of the total delivered energy in June, 58% in July, and 56% in August. This proportion indicates that decreasing the cooling need should be the focus for the reduction in energy consumption, and that retrofit measures should concentrate on how to reduce the energy used for cooling. Regarding the heating need, this required only approximately 5 kWh/m2 per year, which accounted for less than 5% of the overall energy consumption. It was reasonable to ignore the heating need in the warm zone since variations in heating need in this region are negligible.
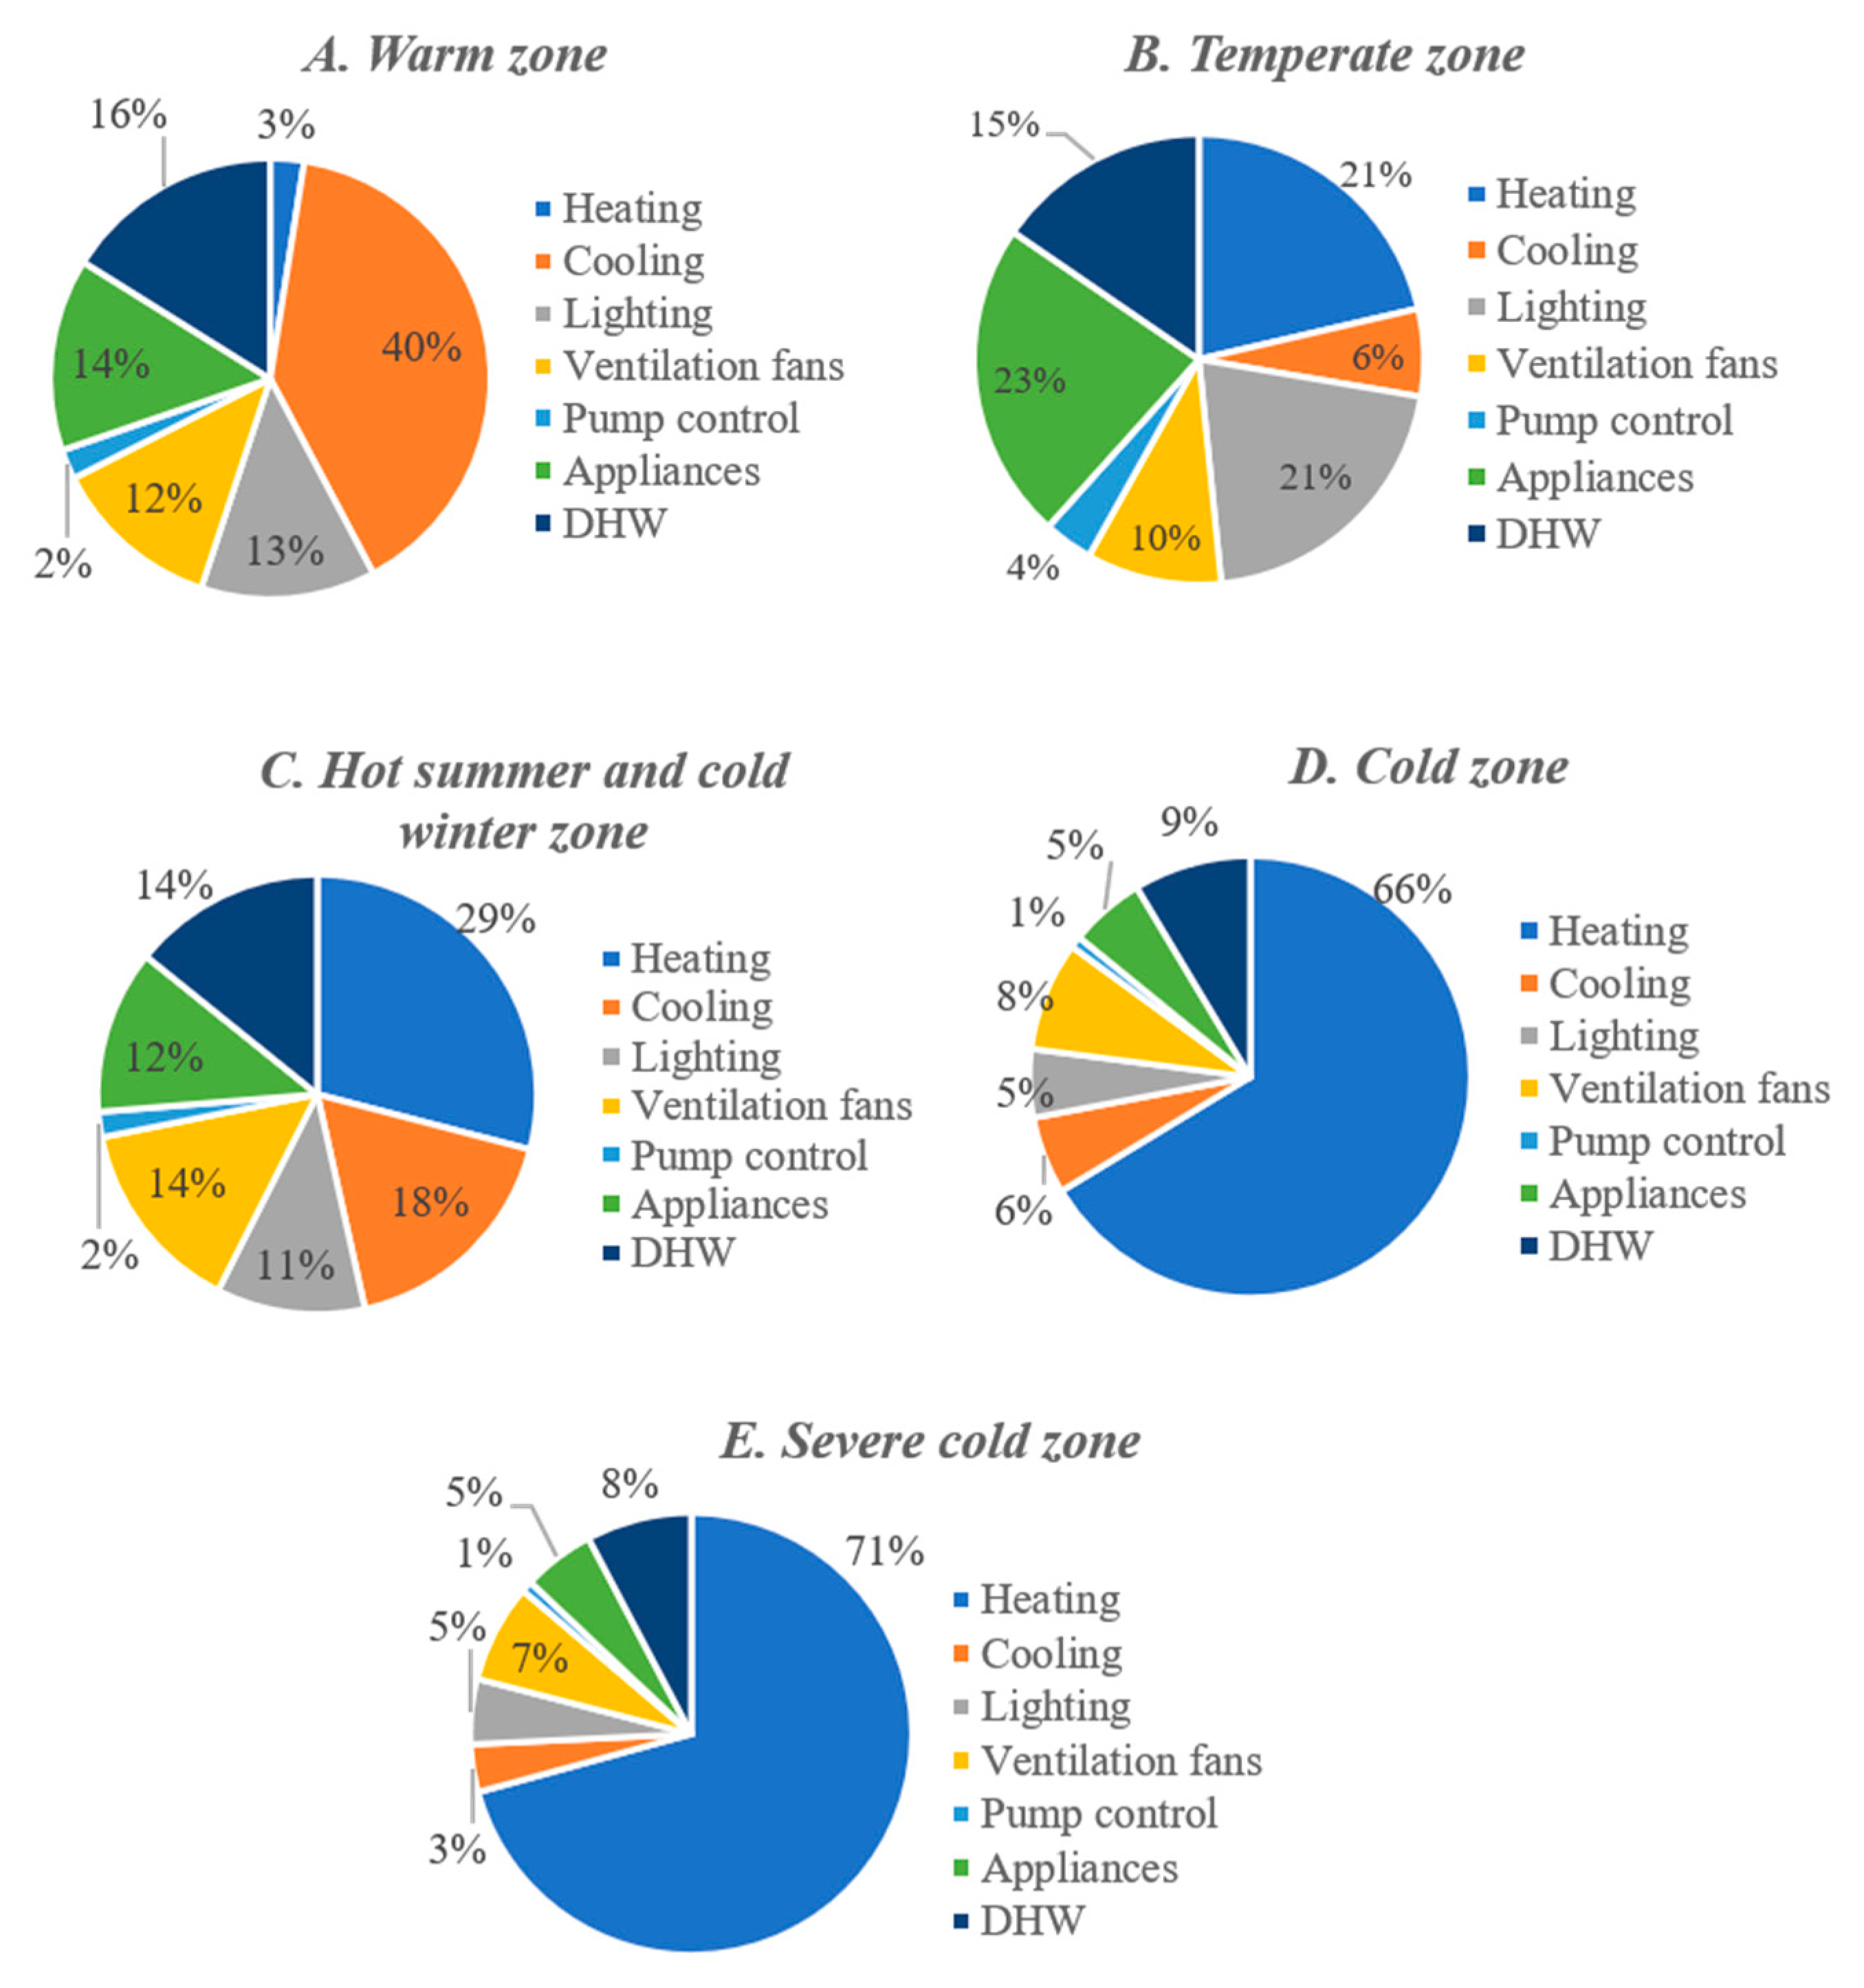
Energy consumption for cooling was determined by the cooling need and the energy efficiency of the AC system. On the one hand, the cooling need is caused by solar heat gain, and thus those renovation measures that can reduce solar heat gain will be beneficial to cooling need reduction. On the other hand, improvements in the energy efficiency of AC systems can reduce the delivered energy while meeting the same cooling need. The ventilation and pump control systems are associated with the AC system, and improvements in air conditioners will consequently reduce energy consumption caused by ventilation and pumps. Annual lighting consumption was about 26 kWh/m2, accounting for about 13% of the overall energy use in a year (Figure 11A). If the energy efficiency of the lighting system can be improved by retrofitting the building, the energy used for lighting will clearly decline. Occupants required about 33 kWh/m2 of energy to produce DHW, which accounted for about 16% of the total delivered energy. It will be necessary to improve the energy efficiency of water heaters in order to reduce the energy used for DHW (Figure 9A and Figure 10A, Table S6).

3.1.2. Temperate Zone

According to the prototype designed for the temperate zone, the thermal performance of existing apartments built in the 1990s was obtained by energy simulation. As seen in Figure 9B, the cooling need was quite low in the temperate zone, with a peak of less than 2 kWh/m2 per month. Such low cooling need was due to the climatic conditions of the temperate zone, which had an average high temperature of around 25 °C, i.e., close to the set point of an AC system. The heating need was much greater than the cooling need in this area, with the highest monthly heating need occurring in December, at more than 12 kWh/m2. Apparently, heating is mainly required in the four months from November to February, but the average monthly energy need was around 10 kWh/m2, which was less than one-half of the energy need for cooling in the warm zone. The low heating need in winter was due to the temperate zone, where the mean temperature is more than 10 °C during the season. Based on the simulation result of the heating and cooling need, the emphasis of the building retrofit should be placed on the reduction of heating need, since there is still potential to reduce it, although its baseline is not high.
According to Figure 10B, the total annual energy consumption was around 125 kWh/m2, which was less than that in the warm zone (202 kWh/m2). The major reason for the lower energy consumption was less need for the mechanical systems to provide cooling and heating. During a 12-month period, the energy used in winter assumed the largest share of the total delivered energy, especially in December and January, as depicted in Figure 10B.
The monthly energy consumption on the coldest days was around 16 kWh/m2, which accounted for more than 13% of the annual energy used. More importantly, the heating need consumed almost one-half of the monthly delivered energy in the cold season. There is no doubt that reducing the heating need would be an effective way to reduce energy consumption, and it is therefore necessary to take measures to improve the thermal performance of those building elements related to the heating need while retrofitting existing buildings. Because of the low heating and cooling need, the energy used by fans and pump controls was much lower than that in the warm zone. If some retrofit measures are adopted to improve the energy efficiency of mechanical systems, then the fans and pump controls will consume less energy for the same amount of heating, ventilation, and air conditioning (HVAC) supply. Lighting was another primary factor in determining the total energy consumption, and its use accounted for more than 20% of the yearly delivered energy (Figure 11B). Renovation of the lighting system would not only reduce the energy need for lighting, but would also decrease internal heat gain, which may cause an increase in the cooling need in summer. The hot water heater is still worth renovating since the energy used for DHW was around 19 kWh/m2, which was the fourth top source of energy consumption. Annual sunshine in the temperate zone amounts to more than 2197 h, and solar water heaters may therefore be useful for reducing the delivered energy for DHW (Figure 9B and Figure 10B, Table S7).

3.1.3. Hot Summer and Cold Winter Zone

The prototype with particular building characteristics provided sufficient supports to identify building energy need and consumption in the hot summer and cold winter zone. In the hot summer and cold winter zone, the heating need was much higher than the cooling need, as shown in Figure 9C. The annual heating need was more than double the yearly cooling need. The peak heating need occurred in January, and its monthly value was above 30 kWh/m2. The time period during which the heating need was dominant spanned from December to March. During these four months, the overall heating need accounted for more than 90% of the entire heating need in the winter season. This is due to the low average temperature in winter, which is below 10 °C (the heating set point is 18 °C). The highest cooling need was around 17 kWh/m2, which occurred in July, the hottest month. The duration of cooling need was more than four months, from June to September. This indicated that the AC system was in operation for at least four months to provide cooling. The absolute quantity and duration of cooling need had a significant impact on the total energy need, although they were ultimately less than those of the heating need. To reduce the energy need in this zone, it would be better to take into account both heating and cooling.
Obviously, the monthly and total delivered energy in the hot summer and cold winter zone are much greater than those in the temperate zone because of the larger heating and cooling need, as shown in Figure 10C and Table S8. The total annual energy consumption was more than 237 kWh/m2, which was twice that in the temperate zone, although these two areas are adjacent. This means that the structure of energy need in these neighboring regions is mutually distinct, and therefore the focus of building energy efficiency should also be different. The largest monthly energy consumption occurred in January, with a dominant heating need at more than 35 kWh/m2. The average heating need in other cold months was also more than 20 kWh/m2, and thus the heating need caused by the cold months from December to March accounted for 90% of the overall heating need. This baseline of heating consumption implies a big potential to save energy by decreasing the heating need and the energy delivered for heating.
The total energy consumption for cooling was around 41 kWh/m2 per year, 90% of which was used between June and September. The highest energy consumption for cooling was more than 12 kWh/m2, which occurred in July, similar to other climatic zones. As mentioned before, the floor area of the prototype apartment was 47 m2; as a result, the monthly energy cost for cooling need was more than USD 50 if the unit cost of the electricity is USD 0.09. From the perspectives of energy saving and economic issues, it would be worth paying attention to the reduction in cooling need while retrofitting a building in the hot summer and cold winter zone. Mechanical fans are linked with the cooling and heating system, and their energy consumption would increase alongside any increases in heating or cooling consumption. While decreasing heating or cooling consumption, the fans will consume less energy. Lighting and DHW were other critical groups that affected the whole energy consumption. The annual energy used for lighting need reached 26 kWh/m2, which was less than 10% of the overall yearly delivered energy. The need of DHW expended about 33 kWh/m2 per year, which accounted for 15% of the total delivered energy (Figure 11C). It would be possible to reduce lighting consumption by improving the energy efficiency of the lighting system via some energy-efficient retrofit measures. The existing DHW was provided by conventional gas-fired or electrical boilers, and thus the application of RE heaters may be useful for dramatically reducing the energy consumption of DHW (Figure 9C and Figure 10C, Table S8).

3.1.4. Cold Zone

The simulation model based on the prototypical apartment uncovered the energy requirements and building thermal performance in the cold zone. The cold zone is a heating dominant region, as reflected in Figure 9D. The peak heating need was around 48 kWh/m2, which was four times its highest cooling need (12 kWh/m2). The cold season, with dominant heating, lasts for five months, from November to March, with the lowest heating need in winter being higher than the peak cooling need in summer. The immense heating need is due to the very low winter temperatures, with an average temperature always below zero, except in March. In other words, the mean temperature in the coldest three months is lower than zero, and thus strenuous mechanical heating is required to maintain indoor thermal comfort. Although the cooling need was much lower than the heating need (12 kWh/m2), it was still close to that in the cold winter and hot summer zone (15 kWh/m2). Based on this comparison, it can be said that summer is still hot in the cold zone, and that the cooling need in summer also plays an important role in determining the whole energy need in the hot season. It is certain that a reduction in heating need can make a large contribution to energy savings, since its baseline is immense and even a small reduction can yield greater absolute energy conservation. Meanwhile, the reduction in cooling need should also be taken into account while planning for saving energy since it dominates the energy need in summer. All in all, it would be better to focus on both heating and cooling need instead of solely on heating need in the cold zone.
The overall annual energy consumption was up to 519 kWh/m2 in the cold zone, which was close to double that in the hot summer and cold winter zone, as presented in Table S9 and Figure 10D. The energy used for heating was more than 340 kWh/m2 in a year, which accounted for up to 66% of the total delivered energy (Figure 11D). Based on this proportion, it would be sensible to focus on the reduction of heating consumption in order to save energy. In addition, most of heating consumption was in the three coldest months, from December to February; they consumed up to 85% of the entire energy used for heating. This means that the mechanical system is always working during the cold time period and the operation span is quite long. The huge consumption and long operation of the heating system indicates that the emphasis of energy saving should be on the reduction of heating need and the energy efficiency of the mechanical heating system. Owing to the huge heating consumption, another major part of the delivered energy is consumed by the mechanical fan that is involved in the mechanical heating and cooling systems. An improvement to the mechanical system and the reduction of heating or cooling need will help fans reduce energy consumption.
In this region, the annual energy consumption for cooling was above 29 kWh/m2, which was similar to the lighting energy consumption. The total amount was less than that in the hot summer and cold winter zone, although their monthly cooling consumptions in the hottest months came close. However, the reduction in cooling consumption still had an effect on the overall delivered energy in summer, since cooling dominated energy need during the hot season. Yet decreasing heating consumption should be prioritized when there is a conflict between the heating and cooling reductions, as the former presents a more robust energy saving potential. Lighting had the same baseline of energy consumption as cooling; and thus, it would be worthwhile to reduce the energy consumption of lighting in order to achieve a certain target of energy saving. Due to the low temperature of tap water in this zone, water heaters require more energy to produce hot water when compared to other southern zones. Energy consumption in this regard accounted for about 8% of the total energy consumption, and thus to save energy, it may be helpful if there were a cost-effective way to reduce the energy for DHW.

3.1.5. Severe Cold Zone

Similarly, the apartment prototype built in the early section was the foundation for the prediction of building thermal performance, and it can guide researchers to emphasize the significant aspects of the building retrofit in the severe cold zone. In the severe cold zone, the dominant heating season lasts from October to March, more than five months. As such, more heating is required to maintain a comfortable indoor temperature, as shown in Figure 9E. The severe cold zone is located in northernmost China, which is the coldest area with the longest winter in the country, with an average winter temperature below −15 °C. Thus, the heating need dominates the energy need in this region, and the peak need was close to 50 kWh/m2 per month. The lowest monthly heating need in winter approximated the highest cooling need in summer. Particularly, the heating need dramatically increased from November, and the total heating need caused by the most severe cold days during the November to February period was more than 140 kWh/m2. This is a huge energy need, and thus there is great potential for reducing energy consumption by decreasing the heating need.
Summer there is quite short, lasting for only three months, from June to August. During the summer season, the monthly peak cooling need was less than 10 kWh/m2, occurring in July. The overall cooling need throughout the whole year was around 20 kWh/m2, which was much lower than the peak heating need in winter. It would therefore be reasonable to focus on the heating need rather than the cooling need. To reduce energy use in this region, it would be better to make strategies to control the heating need instead of the cooling need when making decisions regarding energy conservation.
According to the information shown in Figure 10E and Table S10, the overall annual energy consumption was about 544 kWh/m2, and most of the delivered energy was consumed in winter. In fact, the energy used for indoor heating accounted for more than 85% of the monthly delivered energy in January. In other cold months, including November, December, and February, more than 80% of the total delivered energy was for heating. Throughout the whole year, heating consumption still accounted for 71% of the annual delivered energy and was above 385 kWh/m2 (Figure 11E), which was three times the overall annual energy use (125 kWh/m2) in this temperate zone. Obviously, energy saving should concentrate on reducing heating consumption in the severe cold zone. In order to reduce the energy used for the heating need, it would be effective to cut down such need by improving the building elements, which can reduce heat transfer and loss. Since mechanical systems are always on to provide heating in winter and their energy efficiency determines the amount of delivered energy when the need remains constant, renovating these systems can improve their COP, which can in turn lower the required energy based on the same need. Owing to the huge need for mechanical heating, the fans involved in the heating system consume a larger part of the yearly delivered energy, compared to lighting and appliances. If the heating need is decreased and the energy efficiency of mechanical systems is improved, the energy used by fans will decrease dramatically.
The annual energy consumption for lighting was higher than 25 kWh/m2, which was very close to the heating consumption in the temperate zone. As discussed earlier, the lighting equipment is typically fluorescent with low energy efficiency, and there is no control system to reduce the energy waste from lighting. Thus, there is still a potential to reduce the lighting energy consumption by improving the lighting system. Similar to the cold zone, DHW in the severe cold zone consumed about 8% of the total delivered energy, amounting to 42 kWh/m2 per year. DHW is mainly supplied by gas or electrical heaters in existing residential buildings. This traditional DHW equipment has relatively low energy efficiency, and thus upgrading such equipment may be a viable solution for reducing the DHW consumption. According to the local climatic conditions, the yearly sunshine amounts to more than 2570 h, which suggests that it is possible to make use of solar energy to provide DHW. To maximize energy reduction, solar water heaters should be taken into account as retrofit alternatives.

3.2. Comparison of Energy Consumption among Climatic Zones

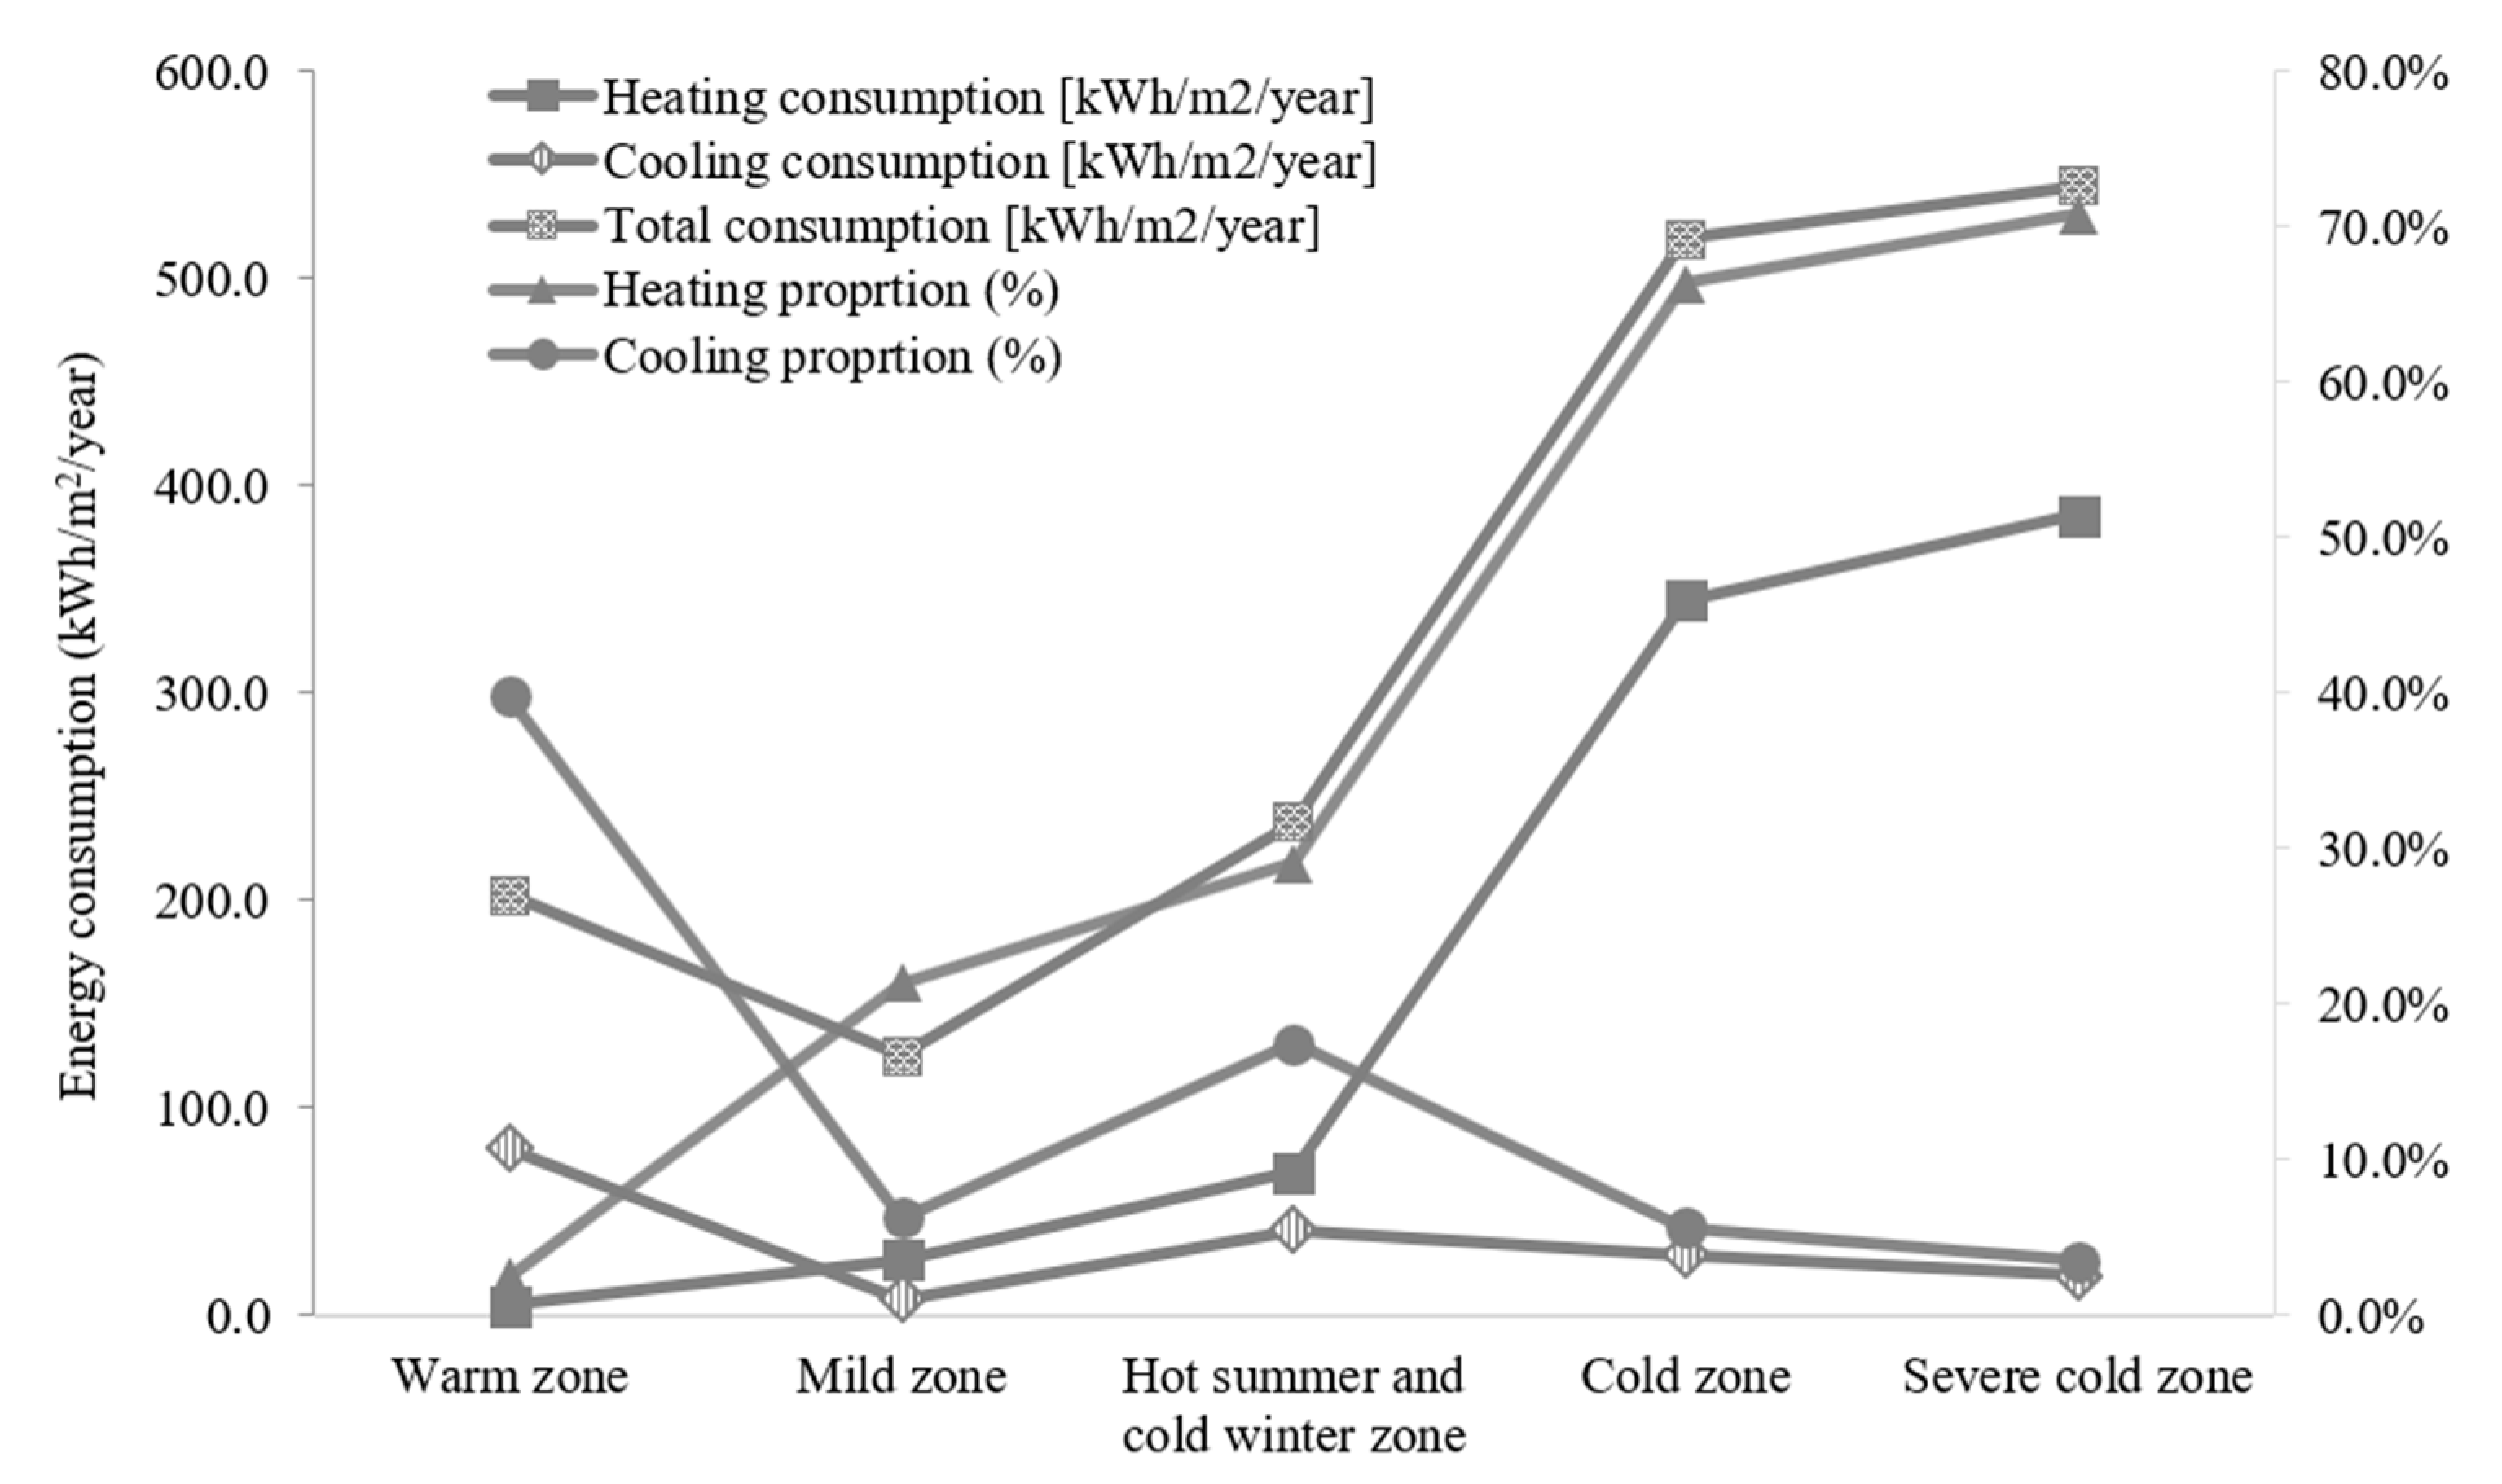
According to the energy consumption in the five climatic zones of China discussed above, the predominant energy needs in different climatic zones are mutually distinct. More importantly, the total energy consumption per floor area can be different due to the prevailing weather conditions, as presented in Figure 12. As shown in Table 4, the total energy consumption per square meter per year was 544 kWh/m2/year in the severe cold zone, which was more than five times the overall delivered energy in the temperate zone and more than 2.5 times the energy used in warm zones. Owing to similar climatic conditions, the cold zone required a similar amount of energy resources (519 kWh/m2/year) to meet the user need. The total energy consumption in the heating-dominant regions, including the cold and severe cold zones, was more than double the overall energy use in the southern part of China, including the warm, temperate, and hot summer and cold winter zones. From the perspective of energy distribution, the focus of energy conservation should be on the heating-dominant areas, since they consume most of the total delivered energy. It is possible to reduce a large portion of energy consumption in the cold and severe cold zones, since the baseline of energy use for a square meter is extremely high in these two areas. Nevertheless, there may be less potential to reduce energy consumption in the temperate zone, as its overall energy use per floor area in a year was less than 130 kWh/m2.
Apparently, heating need consumed most of the total delivered energy in the cold and severe cold zones, and its consumption accounted for more than 66% of the overall energy use. The absolute value of energy used for heating on each floor area per year was more than 344 kWh/m2 in these two zones. Only heating consumption was much higher than the entire required energy of any other climatic region. Even for the hot summer and cold winter zone, where indoor heating is needed due to the cold weather, the total energy consumption was still much lower than the heating consumption in the northern part of China, as depicted in Figure 10E. The cooling consumption was quite low in heating-dominant regions, accounting for less than 6% of the total delivered energy, i.e., around 30 kWh/m2/year in the cold zone and 19 kWh/m2/year in the severe cold zone. Thus, it is worth paying more attention to reducing energy consumption for heating for the purpose of energy saving in the northern part of China.
Regarding the warm zone, the cooling need was a major source of energy consumption, accounting for around 40% of the total delivered energy. Heating need can be ignored when planning for measures to improve the building energy efficiency, as its entire amount in a year was about 5 kWh/m2. The largest energy saving potential was related to the reduction in cooling consumption. In the temperate zone, the heating need was much higher compared to the warm zone, and it was the primary energy consumer. It accounted for more than 20% of the entire delivered energy, but cooling consumption was too negligible to warrant an effort to reduce it in this zone. Although the total energy consumption was not as high as the other regions, as shown in Figure 10E, the building energy efficiency will likely be improved by decreasing heating consumption. In the hot summer and cold winter zone, the energy used for cooling was slightly lower than that consumed by heating. Heating consumption accounted for about 29% of overall energy use, while the cooling need consumed about 18% of the total energy use. In this region, cooling consumption was approximately one-half of that in the warm zone, but the energy used for heating was more than double that consumed in the temperate zone. This consumption configuration indicates that it is important to consider the reduction in heating and cooling consumption in retrofit decisions that are made to achieve a certain energy-saving target. If there is a conflict in the selection of retrofit measures, it may be sensible to focus on decreasing heating consumption in the temperate zone, since energy used for cooling was only 69% that of the delivered energy for heating. Based on the above findings and discussion (the energy need profile in each climate zone), a summary of the identified potential retrofit measures, including their prioritization, is shown in Table 5.

4. Conclusions

To identify the potential retrofitting measures, this study evaluated the energy performance of existing high-rise buildings in different climate zones in China. The existing building energy consumption determines the applicability of different types of renovation measures to different climatic zones. On the basis of the identification of specific building features, the prototyping method was used to summarize typical building characteristics in each climatic zone. By integrating the prototypes with the specific characteristics and the climatic conditions, an energy simulation model of a local building’s thermal performance was optimized for different climatic zones.
Although the thermal properties of existing building elements were similar in the hot summer and cold winter zone and the temperate zone, their energy consumption configuration varied greatly. The lowest building energy consumption occurred in the temperate zone with an annual amount of less than 130 kWh/m2/year. The energy consumed for cooling need can be ignored in this area because of its low absolute value, despite the fact that it accounted for approximately 6% of the total energy use. It is worth focusing on the heating need when retrofitting existing buildings because heating consumed more than 20% of the overall delivered energy in the temperate zone and 29% in the hot summer and cold winter zone, where the energy consumed for heating was 26.75 kWh/m2/year in the temperate zone and 68.91 kWh/m2/year in the other zones. Although the energy used for cooling was lower than that used for heating in the mixed season zones, cooling still used more than 17% of the total energy consumption. A potential retrofit solution should be the best balance of the reduction in heating and cooling consumption of energy.
Although the building materials and thermal properties of existing buildings in the cold and severe cold zones varied greatly, energy consumption in these two regions was very similar. Energy consumption in these zones was the highest of all the zones (544 kWh/m2/year); this was double the energy consumption in the hot summer and cold winter zone, and about five times that of the temperate zone. Although the cooling need in the cold zone was higher than that in the severe cold zone, there was no significant discrepancy in energy consumption for heating need between these two zones, which was about 70% of the total energy use for both of them. It may, therefore, be reasonable to ignore the difference in the impact of climatic conditions and building elements on energy consumption in these two areas. The majority of energy consumption (40%) in the warm zone was on cooling need. Although the climatic conditions in the warm zone and the hot summer and cold winter zone varied greatly, the total annual energy consumption (202 kWh/m2/year) was similar. This similarity may be caused by the different building characteristics of the existing buildings, and thus the most suitable retrofit solution should be different in these two areas. Meanwhile, energy consumption for cooling in the warm zone was twice that in the hot summer and cold winter zone, but the heating need in the former was quite low. According to the energy need profile in the studied zones, the largest energy saving potential is related to the reduction in cooling consumption in the warm zone, whereas retrofitting measures should focus on reducing the heating need in the temperate zone. The reduction in heating and cooling consumption is the priority in retrofit decisions in the hot summer and cold winter zone, whereas retrofit measures should primarily focus on reducing the heating energy need in both cold and severe cold zones. It is believed that the introduced approach, energy need profile, and the identified potential retrofit measures can be used in practice for large-scale energy saving targets in the studied climate zones. Future work should focus on the development of deterministic decision models for selecting cost-effective sustainable building retrofit measures for high-rise residential buildings in different climatic zones.

Supplementary Materials

The following are available online at https://www.mdpi.com/2071-1050/12/11/4726/s1.

Author Contributions

Conceptualization, Q.H. and S.T.N.; methodology, Q.H. and S.T.N; software, Q.H.; validation, Q.H. and S.T.N.; formal analysis, Q.H.; investigation, Q.H.; resources, Q.H.; data curation, Q.H.; writing—original draft preparation, Q.H. and M.U.H.; writing—review and editing, S.T.N. and M.U.H.; visualization, Q.H. and M.U.H.; supervision, S.T.N. and G.L.A.; project administration, S.T.N.; funding acquisition, Q.H. and S.T.N. All authors have read and agreed to the published version of the manuscript.

Funding

The APC was funded by the project of National Social Science Foundation of China (Project No. 17BMZ083).

Conflicts of Interest

The authors declare no conflict of interest.

References

  1. Schiefelbein, J.; Rudnick, J.; Scholl, A.; Remmen, P.; Fuchs, M.; Müller, D. Automated urban energy system modeling and thermal building simulation based on OpenStreetMap data sets. Build. Environ. 2019, 149, 630–639. [Google Scholar] [CrossRef]
  2. Yang, L.; Yan, H.; Lam, J.C. Thermal comfort and building energy consumption implications—A review. Appl. Energy 2014, 115, 164–173. [Google Scholar] [CrossRef]
  3. Pérez-Lombard, L.; Ortiz, J.; Pout, C. A review on buildings energy consumption information. Energy Build. 2008, 40, 394–398. [Google Scholar] [CrossRef]
  4. Urge-Vorsatz, D.; Cabeza, L.F.; Serrano, S.; Barreneche, C.; Petrichenko, K. Heating and cooling energy trends and drivers in buildings. Renew. Sustain. Energy Rev. 2015, 41, 85–98. [Google Scholar] [CrossRef] [Green Version]
  5. IEA. Energy Balances of Non-OECD Countries 2015; International Energy Agency (IEA): Paris, France, 2015. [Google Scholar]
  6. Yang, W.; Kohler, N. Simulation of the evolution of the Chinese building and infrastructure stock. Build. Res. Inf. 2008, 36, 1–19. [Google Scholar] [CrossRef]
  7. Güneralp, B.; Zhou, Y.; Ürge-Vorsatz, D.; Gupta, M.; Yu, S.; Patele, P.L.; Fragkias, M.; Li, X.; Seto, K.C. Global scenarios of urban density and its impacts on building energy use through 2050. Proc. Natl. Acad. Sci. USA 2017, 114, 8945–8950. [Google Scholar] [CrossRef] [PubMed] [Green Version]
  8. Zhang, X.; Wang, F. Life-cycle assessment and control measures for carbon emissions of typical buildings in China. Build. Environ. 2015, 86, 89–97. [Google Scholar] [CrossRef]
  9. Yim, S.Y.C.; Ng, S.T.; Hossain, M.U.; Wong, J.M.W. Comprehensive evaluation of carbon emissions for the development of high-rise residential building. Buildings 2018, 8, 147. [Google Scholar] [CrossRef] [Green Version]
  10. Hossain, M.U.; Ng, S.T. Influence of waste materials on buildings’ life cycle environmental impacts: Adopting resource recovery principle. Resour. Conserv. Recyc. 2019, 142, 10–23. [Google Scholar] [CrossRef]
  11. Eom, J.; Clarke, L.; Kim, S.H.; Kyle, P.; Patel, P. China’s building energy demand: Long-term implications from a detailed assessment. Energy 2012, 46, 405–419. [Google Scholar] [CrossRef]
  12. EIA. International Energy Outlook; US Energy Information Administration: Washington, DC, USA, 2016. Available online: https://www.eia.gov/outlooks/ieo/pdf/0484(2016).pdf (accessed on 17 September 2019).
  13. Hui, X. Housing, Urban Renewal and Socio-Spatial Integration: A Study on Rehabilitating the Former Socialistic Public Housing Areas in Beijing; TU Delft: Delft, The Netherlands, 2013. [Google Scholar]
  14. Ekblad, S.; Werne, F. Housing and health in Beijing: Implications of high-rise housing on children and the aged. J. Soc. Soc. Welf. 2015, 17, 51–77. [Google Scholar]
  15. Ng, E.; Chen, L.; Wang, Y.; Yuan, C. A study on the cooling effects of greening in a high-density city: An experience from Hong Kong. Build. Environ. 2012, 47, 256–271. [Google Scholar] [CrossRef]
  16. Yang, F.; Lau, S.S.Y.; Qian, F. Summertime heat island intensities in three high-rise housing quarters in inner-city Shanghai China: Building layout, density and greenery. Build. Environ. 2010, 45, 115–134. [Google Scholar] [CrossRef]
  17. Development Bureau. Profile of Old Buildings in Hong Kong; Development Bureau: Hong Kong, China, 2010. Available online: http://www.legco.gov.hk/yr09-10/english/hc/sub_leg/sc05/papers/sc050209cb1-1163-1-e.pdf (accessed on 10 February 2017).
  18. Chen, R.; Chen, R. Research on energy-saving design of high-rise residential buildings in central plains. Resour. Inf. Eng. 2017, 32, 157–158. [Google Scholar]
  19. Baldwin, A.N.; Loveday, D.L.; Li, B.; Murray, M.; Yu, W. A research agenda for the retrofitting of residential buildings in China—A case study. Energy Policy 2018, 113, 41–51. [Google Scholar] [CrossRef] [Green Version]
  20. Galvin, R.; Sunikka-Blank, M. Ten questions concerning sustainable domestic thermal retrofit policy research. Build. Environ. 2017, 118, 377–388. [Google Scholar] [CrossRef]
  21. Weinsziehr, T.; Grossmann, K.; Gröger, M.; Bruckner, T. Building retrofit in shrinking and ageing cities: A case-based investigation. Build. Res. Infor. 2017, 45, 278–292. [Google Scholar] [CrossRef]
  22. Daly, D.; Cooper, P.; Ma, Z. Qualitative analysis of the use of building performance simulation for retrofitting lower quality office buildings in Australia. Energy Build. 2018, 181, 84–94. [Google Scholar] [CrossRef]
  23. Zhang, Y.; O’Neill, Z.; Dong, B. Comparisons of inverse modeling approaches for predicting building energy performance. Build. Environ. 2015, 86, 177–190. [Google Scholar] [CrossRef]
  24. Liu, Y.; Wang, W.; Ghadimi, N. Electricity load forecasting by an improved forecast engine for building level consumers. Energy 2017, 139, 18–30. [Google Scholar] [CrossRef]
  25. Khodaei, H.; Hajiali, M.; Darvishan, A.; Sepehr, M.; Ghadimi, N. Fuzzy-based heat and power hub models for cost-emission operation of an industrial consumer using compromise programming. Appl. Therm. Eng. 2018, 137, 395–405. [Google Scholar] [CrossRef]
  26. Hao, L.; Xiong, X.; Minghai, H. Survey of Current Energy Consumption Status and Analysis on Energy Saving Potential in Yunnan Moderate Region (North District). Green Build. 2016, 2, 1–3. (In Chinese) [Google Scholar]
  27. De Masi, R.F.; Gigante, A.; Ruggiero, S.; Vanoli, G.P. The impact of weather data sources on building energy retrofit design: Case study in heating-dominated climate of Italian backcountry. J. Build. Perform. Simul. 2020. [Google Scholar] [CrossRef]
  28. Chen, Y.; Hong, T.; Luo, X.; Hooper, B. Development of city buildings dataset for urban building energy modeling. Energy Build. 2019, 183, 252–265. [Google Scholar] [CrossRef] [Green Version]
  29. Wang, W.; Katipamula, S.; Ngo, H.; Underhill, R. Energy performance evaluation of variable-speed packaged rooftop units using field measurements and building energy simulation. Energy Build. 2019, 183, 118–128. [Google Scholar] [CrossRef]
  30. Cetin, K.S.; Fathollahzadeh, M.H.; Kunwar, N.; Do, H. Development and validation of an HVAC on/off controller in EnergyPlus for energy simulation of residential and small commercial buildings. Energy Build. 2019, 183, 467–483. [Google Scholar] [CrossRef]
  31. Zhou, Z.; Zhang, S.; Wang, C.; Zuo, J.; He, Q.; Rameezdeen, R. Achieving energy efficient buildings via retrofitting of existing buildings: A case study. J. Clean. Prod. 2016, 112, 3605–3615. [Google Scholar] [CrossRef]
  32. Gercek, M.; Arsan, Z.D. Energy and environmental performance based decision support process for early design stages of residential buildings under climate change. Sustain. Cities Soc. 2019, 48, 101580. [Google Scholar] [CrossRef]
  33. Lopes, M.A.R.; Antunes, C.H.; Reis, A.; Martins, N. Estimating energy savings from behaviours using building performance simulations. Build. Res. Inf. 2017, 45, 303–319. [Google Scholar] [CrossRef]
  34. Jeon, J.; Lee, J.; Ham, Y. Quantifying the impact of building envelope condition on energy use. Build. Res. Inf. 2019, 47, 404–420. [Google Scholar] [CrossRef]
  35. Hong, T.; Chou, S.K.; Bong, T.Y. Building simulation an overview of developments and information sources. Build. Environ. 2000, 35, 347–361. [Google Scholar] [CrossRef]
  36. Kim, J.; Augenbroe, G.; Suh, H.S. Comparative study of the LEED and ISO-CEN building energy performance rating methods. In Proceedings of the 13th Conference of International Building Performance Simulation Association, Chambery, France, 26–28 August 2013. [Google Scholar]
  37. Yang, T.; Pan, Y.; Mao, J. An automated optimization method for calibrating building energy simulation models with measured data: Orientation and a case study. Appl. Energy 2016, 179, 1220–1231. [Google Scholar] [CrossRef]
  38. Mahdavi, A. In the matter of simulation and buildings: Some critical reflections. J. Build. Perform. Simul. 2020, 13, 26–33. [Google Scholar] [CrossRef]
  39. Rezaee, R.; Brown, J.; Haymaker, J.; Augenbroe, G. A new approach to performance-based building design exploration using linear inverse modeling. J. Build. Perform. Simul. 2019, 12, 246–271. [Google Scholar] [CrossRef] [Green Version]
  40. De Rosa, M.; Brennenstuhl, M.; Cabrera, C.A.; Eicker, U.; Finn, D.P. An iterative methodology for model complexity reduction in residential building simulation. Energies 2019, 12, 2448. [Google Scholar] [CrossRef] [Green Version]
  41. Cole, W.J.; Powell, K.M.; Hale, E.T.; Edgar, T.F. Reduced-order residential home modeling for model predictive control. Energy Build. 2014, 74, 69–77. [Google Scholar] [CrossRef]
  42. Wei, Z.; Wei, Z.; Wen, Q. Research on the building Energy-saving Situation of High-rise Residence in Kunming. Archit. Technol. 2012, 4, 52–55. (In Chinese) [Google Scholar]
  43. Qiu, S.; Li, Z.; Pang, Z.; Zhang, W.; Li, Z. A quick auto-calibration approach based on normative energy models. Energy Build. 2018, 172, 35–46. [Google Scholar] [CrossRef]
  44. Lee, J.W.; Jung, H.J.; Park, J.Y.; Lee, J.B.; Yoon, Y. Optimization of building window system in Asian regions by analyzing solar heat gain and daylighting elements. Renew. Energy 2013, 50, 522–531. [Google Scholar] [CrossRef]
  45. Caceres, A.G.; Diaz, M. Usability of the EPC tools for the profitability calculation of a retrofitting in a residential building. Sustainability 2018, 10, 3159. [Google Scholar] [CrossRef] [Green Version]
  46. Bruno, R.; Pizzuti, G.; Arcuri, N. The prediction of thermal loads in building by means of the EN ISO 13790 dynamic model: A comparison with TRNSYS. Energy Proc. 2016, 101, 192–199. [Google Scholar] [CrossRef]
  47. Balaras, C.A.; Dascalaki, E.G.; Droutsa, K.G.; Kontoyiannidis, S. Empirical assessment of calculated and actual heating energy use in Hellenic residential buildings. Appl. Energy 2016, 164, 115–132. [Google Scholar] [CrossRef]
  48. Pacheco-Torres, R.; Heo, Y.; Choudhary, R. Efficient energy modelling of heterogeneous building portfolios. Sustain. Cities Soc. 2016, 27, 49–64. [Google Scholar] [CrossRef]
  49. Babaizadeh, H.; Haghighi, N.; Asadi, S.; Brown, R.; Riley, D. Life cycle assessment of exterior window shadings in residential buildings in different climate zones. Build. Environ. 2015, 90, 168–177. [Google Scholar] [CrossRef]
  50. Kharseh, M.; Al-Khawaja, M. Retrofitting measures for reducing buildings cooling requirements in cooling-dominated environment: Residential house. Appl. Therm. Eng. 2016, 98, 352–356. [Google Scholar] [CrossRef]
  51. Tan, Y.; Liu, G.; Zhang, Y. Green retrofit of aged residential buildings in Hong Kong: A preliminary study. Build. Environ. 2018, 143, 89–98. [Google Scholar] [CrossRef]
  52. Lv, S.; Wu, Y.; Sun, J. Pattern analysis and suggestion of energy efficiency retrofit for existing residential buildings in China’s northern heating region. Energy Policy 2009, 37, 2102–2105. [Google Scholar]
  53. Xin, L.; Chenchen, W.; Chuanzhi, L. Effect of the energy-saving retrofit on the existing residential buildings in the typical city in northern China. Energy Build. 2018, 177, 154–172. [Google Scholar] [CrossRef]
  54. Robinson, S. Conceptual modelling for simulation Part I: Definition and requirements. J. Oper. Res. Soc. 2007, 59, 278–290. [Google Scholar] [CrossRef] [Green Version]
  55. Augenbroe, G.; Park, C.S. Quantification methods of technical building performance. Build. Res. Inf. 2005, 33, 159–172. [Google Scholar] [CrossRef]
  56. Lee, S.H.; Hong, T.; Piette, M.A.; Taylor-Lange, S.C. Energy retrofit analysis toolkits for commercial buildings: A review. Energy 2015, 89, 1087–1100. [Google Scholar] [CrossRef] [Green Version]
  57. Roulet, C.A.; Anderson, B. CEN Standards for Implementing the European Directive on Energy Performance of Buildings. In Proceedings of the 23rd Conference on Passive and Low Energy Architecture, Geneva, Switzerland, 6–8 September 2006. [Google Scholar]
  58. Poel, B.; van Cruchten, G.; Balaras, C.A. Energy performance assessment of existing dwellings. Energy Build. 2007, 39, 393–403. [Google Scholar] [CrossRef]
  59. Lee, S.H.; Fei, Z.; Augenbroe, G. The use of normative energy calculation beyond building performance rating systems. In Proceedings of the 12th Conference of International Building Performance Simulation Association, Sydney, NSW, Australia, 14–16 November 2011. [Google Scholar]
  60. Kim, J. The Impact of Occupant Modeling on Energy Outcomes of Building Energy Simulation. Ph.D. Thesis, Georgia Institute of Technology, Atlanta, GA, USA, 2016. [Google Scholar]
  61. Zhang, Y. Optimal Strategies for Demand Charge Reduction by Commercial Building Owners. Ph.D. Thesis, Georgia Institute of Technology, Atlanta, GA, USA, 2017. [Google Scholar]
  62. Domínguez-Muñoz, F.; Cejudo-López, J.M.; Carrillo-Andrés, A. Uncertainty in peak cooling load calculations. Energy Build. 2010, 42, 1010–1018. [Google Scholar] [CrossRef]
  63. ISO. Energy Performance of Buildings—Calculation of Energy Use for Space Heating and Cooling; ISO: Geneva, Switzerland, 2008; pp. 1–172. [Google Scholar]
  64. Lee, T.C.; Kok, M.H.; Chan, K.Y. Climatic Influences on the Energy Consumption in Domestic and Commercial Sectors in Hong Kong. In Proceedings of the The 16th Annual International Sustainable Development Research Conference, Hong Kong, China, 30 May–1 June 2010. [Google Scholar]
  65. Diamond, R.C.; Ye, Q.; Feng, W.; Yan, T.; Mao, H.; Li, Y.; Guo, Y.; Wang, J. Sustainable building in China—A green leap forward? Buildings 2013, 3, 639–658. [Google Scholar] [CrossRef]
  66. Hou, Y.L.; Mu, H.Z.; Dong, G.T.; Shi, J. Influences of urban temperature on the electricity consumption of Shanghai. Adv. Clim. Chang. Res. 2014, 5, 74–80. [Google Scholar]
  67. CERC-BEE. Cool Roofs in China Can Save Energy and Reduce Emissions. U.S.-China Clean Energy Research Center Building Energy Efficiency (CERC-BEE) Consortium, 2019. Available online: https://newscenter.lbl.gov/2014/08/27/cool-roofs-in-china-can-save-energy-and-reduce-emissions/ (accessed on 4 April 2019).
  68. Hong Kong Observatory. Climate of Hong Kong. 2017. Available online: http://www.hko.gov.hk/cis/climahk_e.htm (accessed on 16 September 2017).
  69. Fong, K.F.; Lee, C.K. Towards net zero energy design for low-rise residential buildings in subtropical Hong Kong. Appl. Energy 2012, 93, 686–694. [Google Scholar] [CrossRef]
  70. EMSD. The Code of Practice for Energy Efficiency of Air Conditioning Installations in 2005; Electrical and Mechanical Services Department (EMSD): Hong Kong, China, 2005; pp. 1–48.
  71. Yik, F.W.H.; Lun, Y.F. Energy saving by utilizing natural ventilation in public housing in Hong Kong. In Proceedings of the 2nd International Conference on Sustainable Healthy Buildings, Seoul, Korea, 9 October 2009. [Google Scholar]
  72. NMC. Climatic Conditions in Kunming. 2017. Available online: http://www.nmc.cn/publish/forecast/AYN/kunming.html (accessed on 16 September 2017).
  73. MOHURD. Standard for Lighting Design of Buildings; PRC Ministry of Housing and Urban-Rural Development: Beijing, China, 2013.
  74. China Standard Association. The Minimum Allowable Value of the Energy Efficiency and Energy Efficiency Grades for Room Air Conditioners; Standards Press of China: Beijing, China, 2010; pp. 1–5. [Google Scholar]
  75. China Standard Association; General Administration of Quality Supervision, Inspection and Quarantine. General Requirements on Fixed Number of Years of Safety Use and Recycling for House and Similar Electrical Appliances; Standards Press of China: Beijing, China, 2007; pp. 1–8. [Google Scholar]
  76. Wu, Y. Analysis on the housing and property status in Shanghai. Shanghai Real Estate 2015, 5, 1. (In Chinese) [Google Scholar]
  77. Feng, X.; Yan, D.; Peng, C. Influence of residential building air tightness on energy consumption. HVA AC 2014, 44, 5–14. (In Chinese) [Google Scholar]
  78. Beijing Planning Commission. Design Standard for Energy Efficiency of Residential Buildings in Beijing; China Architecture and Building Press: Beijing, China, 2006; pp. 1–56. [Google Scholar]
  79. Zhang, W.; Zhang, S.; Meng, J. The Estimate Calculation to Thermal Efficiency of Medium & Mini type Gas-fired Boiler. Ind. Boiler 2005, 1, 20–22. (In Chinese) [Google Scholar]
  80. Sheng, G.; Jie, G.; Li, G. Technical and Economic Analysis of Air Conditioning System in Residential Buildings in Beijing. In Proceedings of the HVAC National Conference, Haikou, China, 8–12 November 2016. [Google Scholar]
  81. Harbin Municipal Bureau of Statistics. Average Number of Persons and Income/Expenditure per Household; Harbin Municipal Bureau of Statistics: Harbin, China, 2008. Available online: http://www.harbin.gov.cn/art/2009/1/31/art_441_29932.html (accessed on 2 March 2017).
  82. Jin, H.; Zhao, B. Design Strategy of Energy-Efficient Public Buildings in Cold zone Of China. In Proceedings of the ASES, Baltimore, MA, USA, 16–20 April 2013. [Google Scholar]
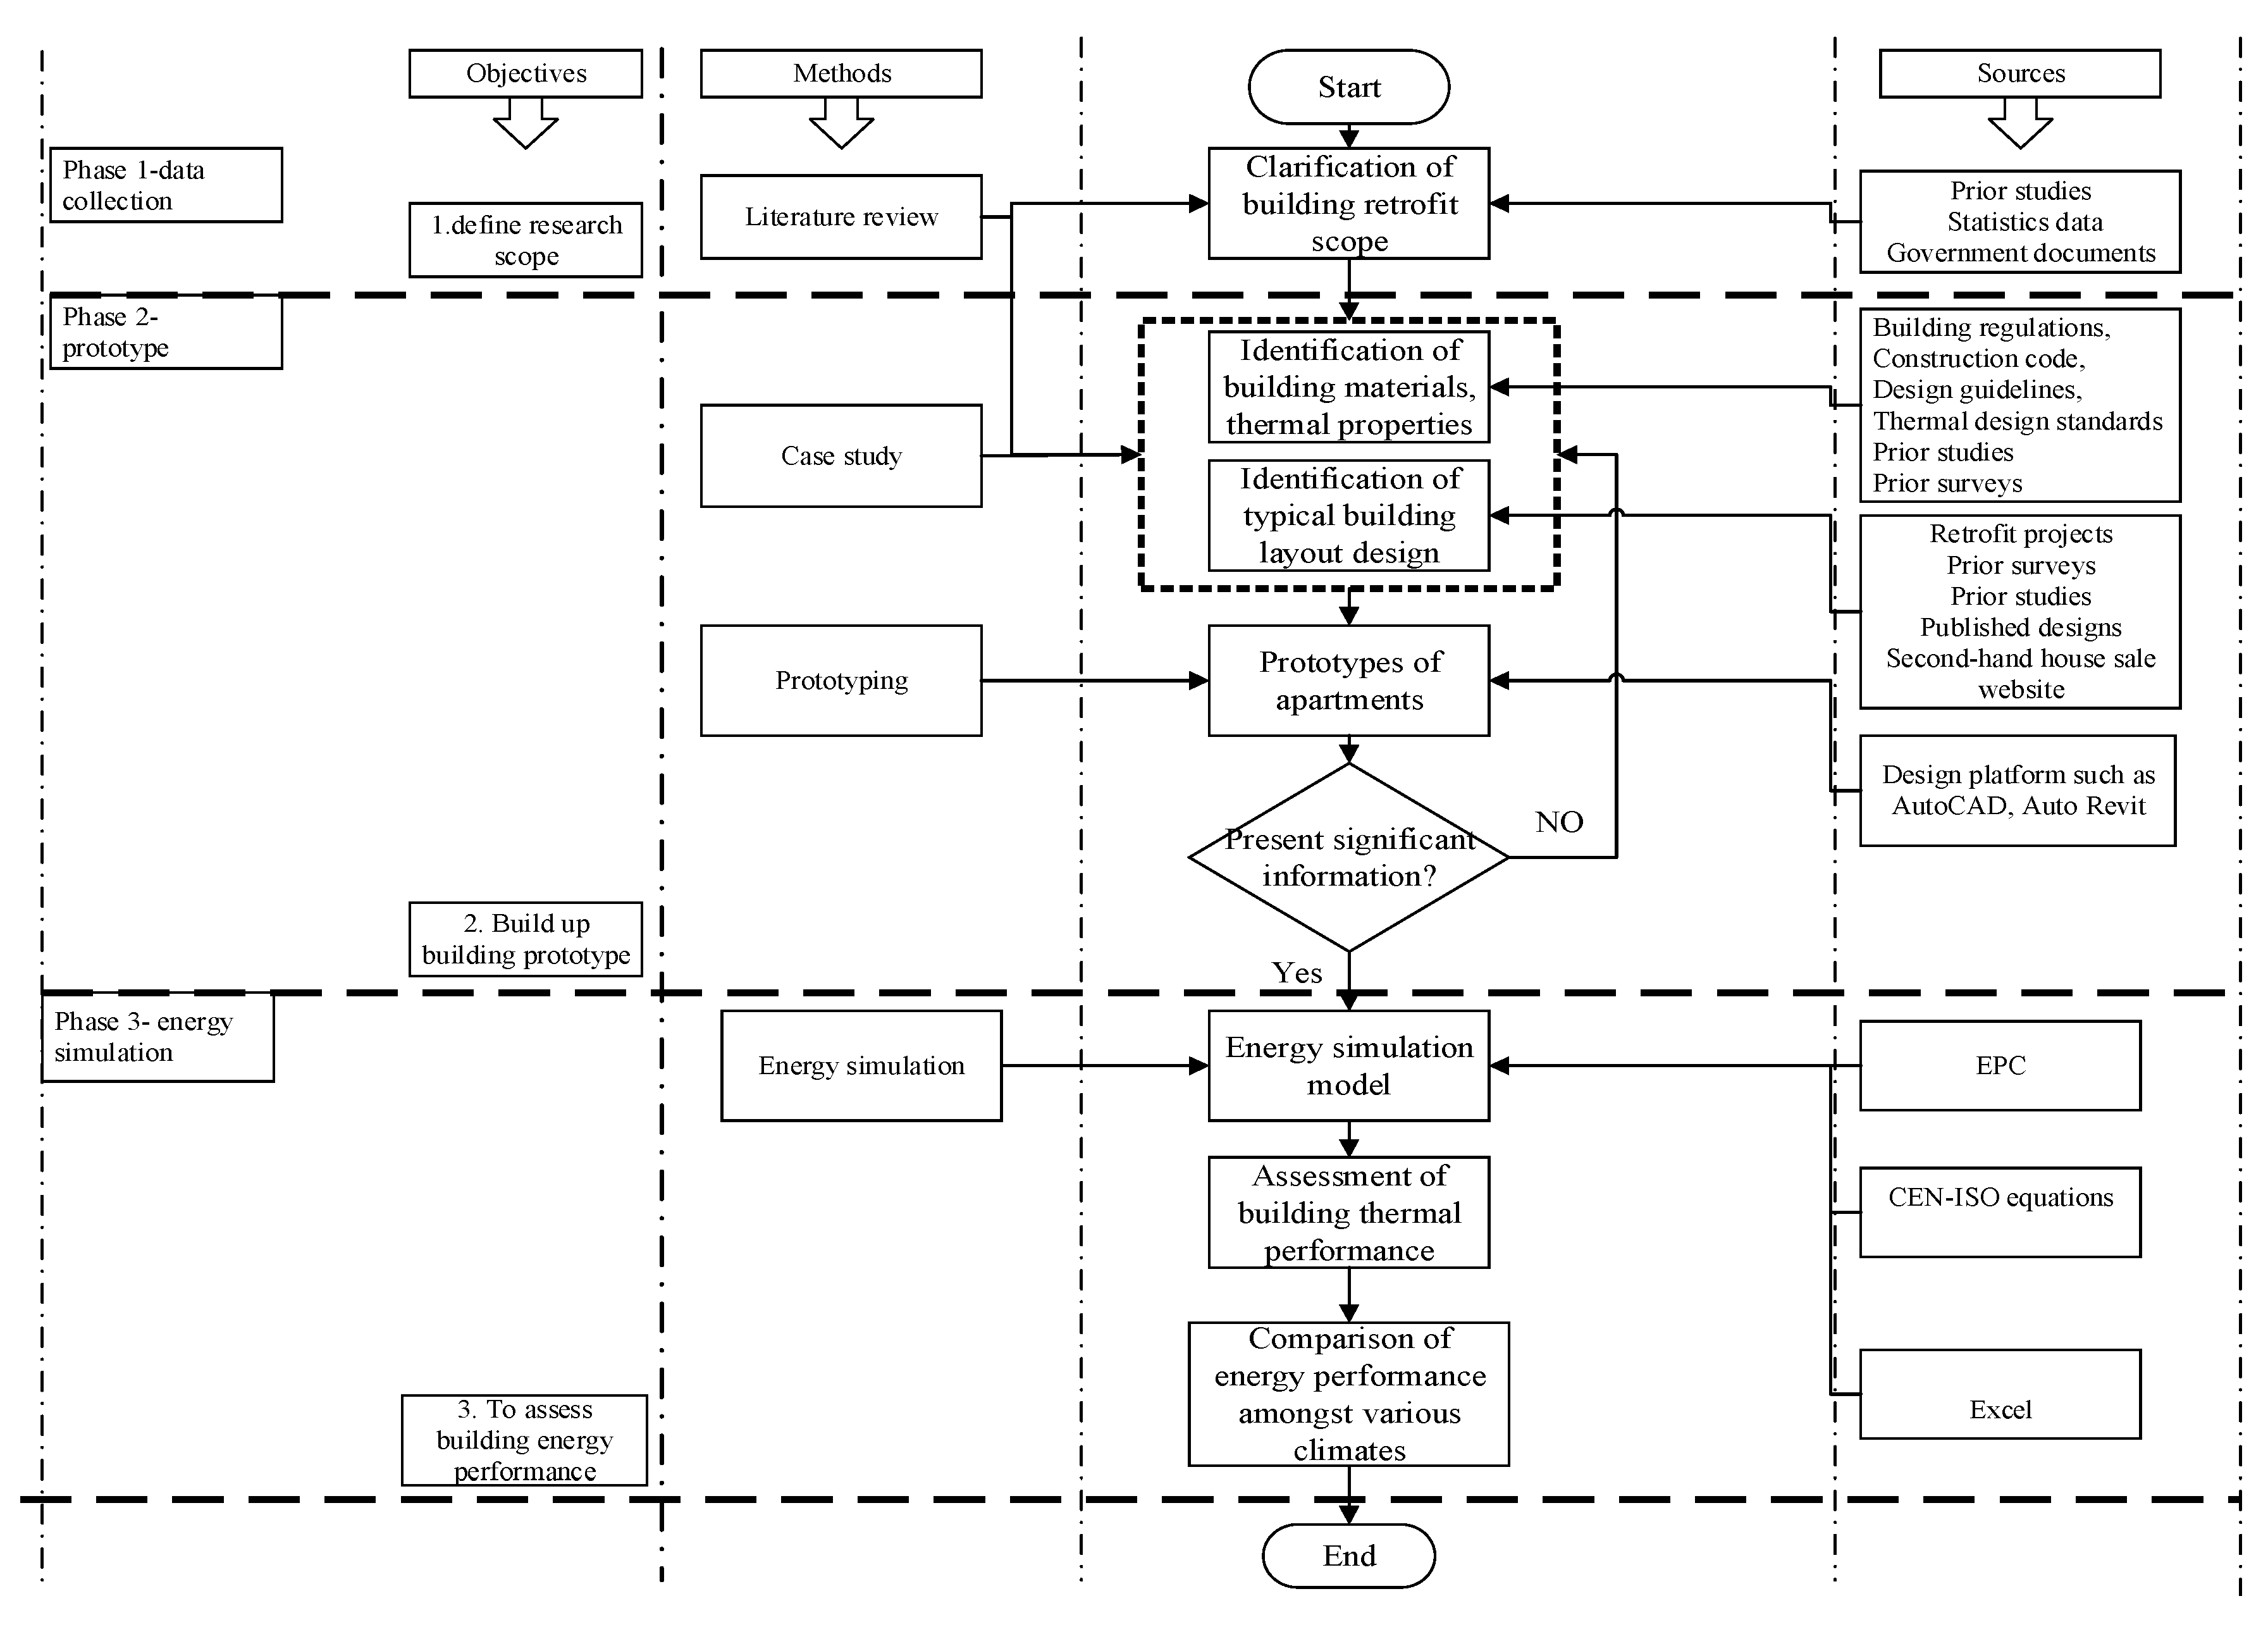
Figure 1. The study workflow.
Sustainability 12 04726 g001
Figure 2. Energy simulation flowchart.
Sustainability 12 04726 g002
Figure 3. China’s climate zones [67].
Sustainability 12 04726 g003
Figure 4. Layout of a prototype and its floor layout in Hong Kong [17].
Sustainability 12 04726 g004
Figure 5. Layout of a prototype in the temperate zone [42].
Sustainability 12 04726 g005
Figure 6. Layout of prototype in the hot summer and cold winter zone [63].
Sustainability 12 04726 g006
Figure 7. Layout of a prototype in the cold zone [Beijing Uni-Construction Group Co., L., (2010)].
Sustainability 12 04726 g007
Figure 8. Layout of prototype in the severe cold zone [82].
Sustainability 12 04726 g008
Figure 9. Heating and cooling need in different climatic zones.
Sustainability 12 04726 g009
Figure 10. Total energy consumption in different climatic zones.
Sustainability 12 04726 g010
Figure 11. Contributions of different drivers to the total energy consumption.
Sustainability 12 04726 g011
Figure 12. Comparison of energy consumption in different climatic zones.
Sustainability 12 04726 g012
Table 1. Inputs of the energy performance calculator (EPC).
Categories of InputsEPC Input Parameters
Building general informationbuilding location
local weather data
ventilation volume
building height
Building systemslighting
heating and cooling plants
HVAC system
domestic hot water (DHW)
energy management system
Renewable energy (RE) systemsphotovoltaic system
solar water heating system
wind turbine system
Energy sourcesource for heating, cooling, and DHW
energy and emission factor
Thermal zonesfloor area
occupant density
power density
Operation schedulehourly schedule
Building envelopeheat capacity
size
orientation
thermal properties of materials
Table 2. General information regarding building prototypes in the different climatic zones.
ParameterSpecificationParameterSpecificationParameterSpecification
Warm zone: Hong Kong
LocationWarm zoneOccupancy density (m2/person)9Ventilationnatural ventilation
Outdoor relative humidity78%Heating system − θeff = 2.8split air conditionerDomestic hot waterindividual gas water heater
Cooling system − θeff = 2.4split air conditionerLighting density (W/m2)15
Temperature setpoint in winter (°C)18 (MOHURD, 2010a,b)Air leakage (m3/h)4.5
Temperature setpoint in summer (°C)24Shading deviceno
Operation schedule of heating/cooling24-h onRE systemno
Temperate zone: Kunming
LocationTemperate zoneOccupancy density (m2/person)30Ventilationnatural ventilation
Outdoor relative humidity70%Heating system − Coefficient of performance (COP) = 2.5split air conditionerDomestic hot waterindividual gas water heater
Cooling system − COP = 2.5split air conditionerLighting density (W/m2)7
Temperature setpoint in winter (°C)18Air leakage (m3/h)9
Temperature setpoint in summer (°C)26Shading deviceno
Operation schedule of heating/cooling24-h onREno
Hot summer and cold winter: Shanghai
LocationHot summer and cold winterOccupancy density17Ventilationnatural ventilation
Outdoor relative humidity74%Heating system − COP = 2.5split air conditionerDomestic hot waterindividual electric water heater
Cooling system − COP = 2.5split air conditionerLighting density (W/m2)7
Temperature setpoint in winter (°C)18Air leakage (m3/h)9
Temperature setpoint in summer (°C)26Shading deviceno
Operation schedule of heating/cooling24-h onREno
Cold zone: Beijing
LocationCold zoneOccupancy density (m2/person)14Ventilationnatural ventilation
Outdoor relative humidity57%Heating system − (energy efficiency θeff)central heating from natural gasDomestic hot waterindividual gas water heater
Cooling system − (energy efficiency θeff)Split air conditionerLighting density (W/m2)7
Temperature setpoint in winter (°C)18Air change rate (/h)0.6
Temperature setpoint in summer (°C)26Shading deviceno
Operation schedule of heating/cooling24-h onRE systemno
Severe cold zone: Harbin
LocationSevere cold zoneOccupancy Density (m2/person)20Ventilationnatural ventilation
Outdoor relative humidity74%Heating System (energy efficiency, θeff = 0.74)central heating from natural gas boilerDomestic hot waterindividual electric water heater
Cooling System (energy efficiency, θeff = 2.5)split air conditionerLighting density (W/m2)7
Temperature Setpoint in Winter (°C)18Air change rate (/h)0.5
Temperature Setpoint in Summer (°C)26Shading Deviceno
Operation Schedule of Heating/Cooling24-h onREno
Table 3. Thermal properties of building prototypes in the different climatic zones.
ZoneExternal WallExternal Window
Warm zoneMain structural materials20 mm cement plaster + 150 mm thick concrete + 20 mm cement plastersingle clear 6 mm glazing
U-value (W/m2 K)2.95.8
Absorption coefficient0.68NA
Emissivity0.900.84
Solar heat gain coefficientNA0.83
Temperate zoneMain structural materials20 mm cement plaster + 240 mm clay bricks + 20 mm cement plastersingle clear 3 mm with aluminum frame
U-value (W/m2 K)2.06.4
Absorption coefficient0.76NA
Emissivity0.900.84
Solar heat gain coefficientNA0.85
Hot summer and cold winter zoneMain structural materials20 mm cement plaster + 240 mm clay bricks + 20 mm cement plaster5 mm single glazing with aluminum frame
U-value (W/m2 K)2.06.4
Absorptance0.76NA
Emissivity0.900.84
SHGCNA0.85
Cold zoneMain structural materials20 mm cement plaster + 300 mm ceramic concrete block + 20 mm cement plaster5 mm single glazing with aluminum frame
U-value (W/m2 K)1.616.4
Absorption coefficient0.68NA
Emissivity0.900.84
Solar heat gain coefficientNA0.85
Severe cold zoneMain structural materials30 mm cement plaster + 490 mm hollow bricks + 30 mm cement plaster5/5 mm double glazing with aluminum frame
U-value (W/m2/K)0.843.26
Absorption coefficient0.76NA
Emissivity0.900.84
Solar heat gain coefficientNA0.85
Table 4. Comparison of energy consumption in various climatic zones.
Climatic ZonesHeating Energy [kWh/m2/Year]Cooling Energy [kWh/m2/Year]Total Consumption
ConsumptionProportion (%)ConsumptionProportion (%)
Warm zone5.02.5%80.539.8%202.4
Temperate zone26.821.4%7.96.3%125.1
Hot summer and cold winter zone68.929.0%41.517.5%237.3
Cold zone344.366.3%29.55.7%519.0
Severe cold zone385.470.8%19.03.5%544.7
Table 5. Potential retrofit measures in different climate zones.
Identified Potential Retrofit MeasureWarm ZoneTemperate ZoneHot Summer and Cold Winter ZoneCold ZoneSevere Cold Zone
Improvement in the reduction in cooling energy need (e.g., energy efficiency of the AC system, reduce solar heat gain, etc.)*********
Energy efficiency in lighting system*******
Energy efficiency of water heaters**********
Improvement in the reduction in heating energy need (e.g., improve the thermal performance of those building elements related to the heating need; energy-efficient mechanical heating systems, etc.)************
***, extremely relevant; **, highly relevant; * relevant.