Next Article in Journal
Role of Situational Dependence in the Use of Self-Service Technology
Previous Article in Journal
Do Women Affect the Final Decision on the Housing Market? A Case Study
 
 
Correction published on 28 July 2022, see Sustainability 2022, 14(15), 9257.
Article

Prioritization of Renewable Energy Alternatives for China by Using a Hybrid FMCDM Methodology with Uncertain Information

1
School of Economics and Management, North China Electric Power University, Beijing 102206, China
2
Beijing Key Laboratory of New Energy and Low-Carbon Development, North China Electric Power University, Beijing 102206, China
*
Author to whom correspondence should be addressed.
Sustainability 2020, 12(11), 4649; https://doi.org/10.3390/su12114649
Submission received: 22 May 2020 / Revised: 2 June 2020 / Accepted: 4 June 2020 / Published: 6 June 2020 / Corrected: 28 July 2022
(This article belongs to the Section Energy Sustainability)

Abstract

:
With the deteriorating ecological environment and increasing energy consumption, developing clean and renewable energy sources has become a key measure to solve environmental problems and energy shortages. The multicriteria decision-making (MCDM) technique is widely used in the assessment of renewable energy alternatives (REA) to determine the most sustainable and appropriate option for a country or region. Classic REA ranking is conducted in a deterministic environment through MCDM techniques. However, with the increasing complexity of environmental and energy issues, the REA ranking method is unsuitable for use in today’s China. Therefore, in this paper, a fuzzy MCDM technique based on the interval-valued hesitant fuzzy elimination and choice expressing reality (IVHF-ELECTRE II) method, taking into account the uncertainty and ambiguity of the information, is proposed for REA ranking. A case study in China is conducted to elaborate on the rationality and feasibility of the proposed framework. According to the ranking results, hydro is determined as the best REA in China, followed by wind energy, solar photovoltaic, geothermal, biomass energy, and solar thermal. This research provides a feasible method and insightful reference for national decision-makers to utilize when evaluating the REA and establishing a macroplanning policy for renewable energy under an uncertain environment.

1. Introduction

The utilization of renewable energy is recognized as a critical measure to ensure global energy security, mitigate environmental pollution, and deal with climate warming. Renewable energy consumption increased by 14.5% in 2018 worldwide. China has become the biggest contributor to renewable energy growth (32 million tons of oil equivalent), exceeding the entire Organization for Economic Co-operation and Development (26 million tons of oil equivalent) [1]. Due to the fast development, China has become the world’s largest energy consumer with 4640 million tce total energy consumption in 2018. Meanwhile, energy and environmental issues are gradually becoming serious in China and affecting the power industry. The development of renewable energy has become a key solution for China to deal with energy and environment problems [2].
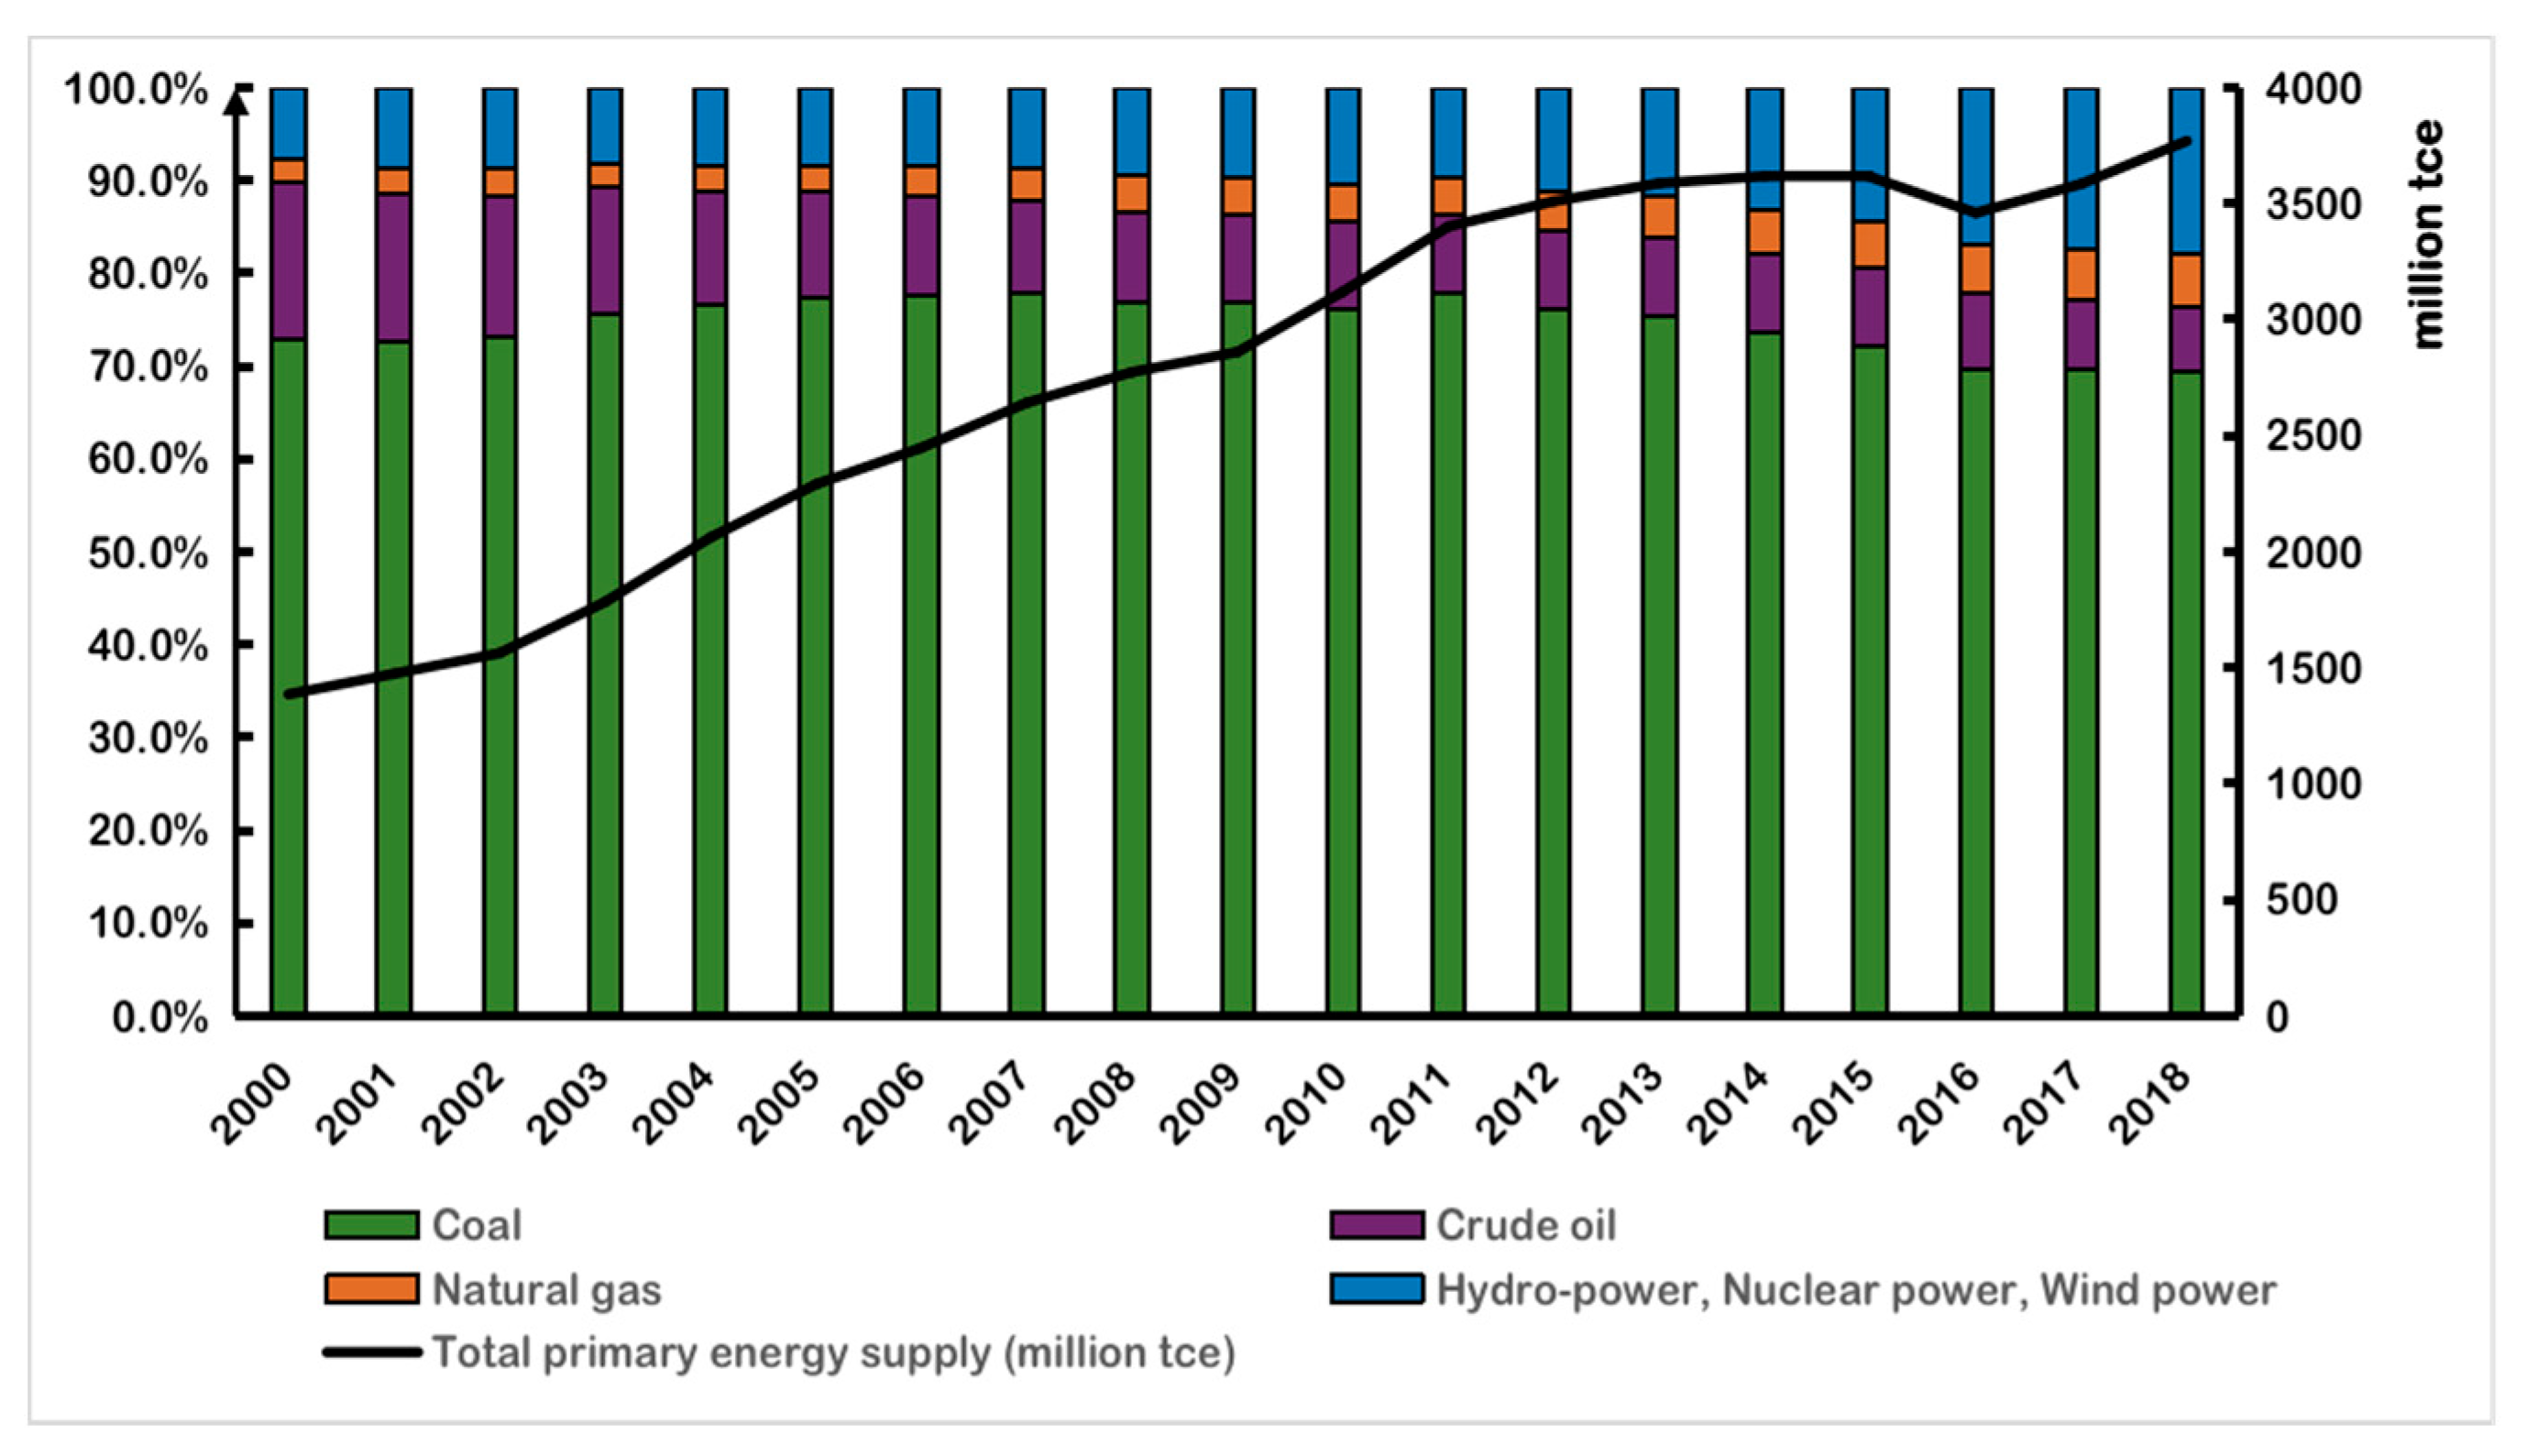
The changes in the Chinese primary energy supply structure, as well as the rapid growth of total gross energy consumption and gross domestic product (GDP) in the past 19 years are intuitively depicted in Figure 1 [3]. Figure 2 clearly shows the changes in China’s energy structure over the past 19 years [3]. With the rapid growth in China’s economy, primary energy supply (PES) and energy consumption have soared. Furthermore, China’s total PES increased from 1385.7 million tce to 3770 million tce from 2000 to 2018, which is approximately a 2.7-fold increase. The rapid economic development also stimulated the increase in total energy consumption, reaching 4640 million tce in 2018. However, the structure of energy supply has not altered much. Coal still maintains a predominant position in the primary energy supply. As can be seen from Figure 2, the proportion of coal has slowly declined since 2011, and the proportion of crude oil production has steadily declined over time. The proportion of clean energy (natural gas, hydro, wind power, nuclear power) has been rising impressively in the past 19 years and it reached 23.5% in 2018.
Through the above review of China’s supply energy structure over the past 19 years, it can be concluded that the replacement of coal consumption is of vital importance in China’s energy transition. On the strategic side, to mitigate environmental pollution and climate change and promote sustainable development, there is a general trend to develop renewable energy and promulgate long-term and stable plans to promote renewable energy utilization. In the "13th Five-Year Plan" for power development, China committed to increase the proportion of nonfossil energy consumption to 15% by 2020. However, different types of renewable energy have respective advantages and disadvantages. In the context of vigorously developing renewable energy, the coordination of planning and continuous optimization of the power supply structure and energy consumption structure are issues that the Chinese government urgently needs to address. In order to increase the proportion of nonfossil energy consumption, more efforts need to be made in research regarding the priorities of renewable energy development, as this will provide policy-makers with insightful and scientific references to formulate macroplanning of renewable energy development and promote energy transition in China.
Prioritization of renewable energy alternatives is a complicated macroplanning issue in the energy sector. The widely used macro energy modeling decision-making methods include life cycle assessment, cost-benefit analysis, and multicriteria decision-making (MCDM) [4] Considering the complexity and diversity of energy planning issues, the shortcomings of single-objective analysis are emerging, so single-target optimization/analysis is no longer applicable. MCDM is regarded as a multicriteria assessment method for energy planning and involves environmental, socioeconomic, and technical factors [5] Therefore, MCDM tools are suitable for macro energy planning because they provide policy-makers with flexibility while considering multistandards and various objectives [6,7,8].
In general, there are three types of MCDM models commonly used in energy planning, namely, value measurement models; goal, aspiration and reference level models; and outranking models. These models have been used in combination as well [5]. Value measurement models are basically utility-based models and include methods like multiattribute utility theory (MAUT), analytic hierarchy process (AHP), the weighted sum method, and the weighted product method. Research shows that AHP is the preferred method in energy planning compared to MAUT in most cases, in spite of its flaws, such as procedural complexity in scaling constants calculation [5]. Kaya et al. [9] used the fuzzy comprehensive VIekriterijumsko KOmpromisno Rangiranje-Analytic Hierarchy Process (VIKOR-AHP) method to determine the best renewable energy alternative in Istanbul, which turned out to be wind energy. Secondly, this method was used to select the best wind energy production base. Amer and Daim [10] ranked five renewable energy alternatives(wind energy, solar energy, solar thermal energy and biomass energy) for electricity generation in Pakistan via the AHP method from technical, economic, social, environmental and political aspects. Kabak and Dagdeviren [11] came up with a hybrid model consisting of an analytic network process (ANP) and benefits, opportunities, costs and risks (BOCR) in order to determine Turkey’s energy situation and prioritize renewable energy sources. They concluded that hydro power is the best resource in Turkey. Ahmad et al. [12] used the AHP method to comprehensively evaluate a variety of resources in Kazakhstan from four aspects: technology, economics, society, and environment. The results showed that hydro is the most advantageous resource, followed by solar energy. Tasri and Susilawati [13] applied a methodology based on fuzzy AHP to determine the most suitable renewable energy alternative for electricity production in Indonesia. Nigim et al. [14] utilized AHP and sequential interactive model for urban sustainability (SIMUS) methods to help communities in prefeasibility ranking of local renewable energy. Chatzimouratidis et al. [15] used the AHP method to evaluate various types of power plants from the aspects of technology, economy, and sustainability. Considering sustainable development, renewable energy power plants are ranked at the top of the overall ranking, while nuclear power plants and fossil fuel power plants are ranked in the last five positions. Kahraman et al. [16] focused on the determination of the best renewable energy alternative for Turkey by using the fuzzy analytic hierarchy process and fuzzy axiomatic design methods, and they determined wind energy as the best renewable energy alternative. Ahmad et al. [17] used the AHP model to prioritize resources and revealed that solar energy is the most advantageous resource in Malaysia, followed by biomass, hydro power and wind power, respectively. Štreimikienė et al. [18] selected the power generation technology of the Lithuanian power sector through AHP and the additive ratio evaluation method (ARAS ), and the results showed that the best choice was to develop nuclear power, followed by biomass technology. Goal programming (GP) is defined by multiple objective functions, including several GP methods such as the STEP method [19] and the technique for order of preference by similarity to ideal solution (TOPSIS). Sengul et al. [20] proposed a decision support framework based on interval Shannon’s entropy methodology and fuzzy TOPSIS for ranking renewable energy supply systems in Turkey. The analysis showed that a hydro power station is the best renewable energy supply system. Sadeghi et al. [21] aimed to evaluate four REAs in Yazd province of Iran by a fuzzy MCDM approach. They determined weights of criteria by the fuzzy analytic hierarchy process (FAHP) method and used fuzzy TOPSIS method to rank different alternatives. The result showed that solar energy is the best alternative for Yazd province. Outranking models include Preference Ranking Organization Method for Enrichment Evaluations (PROMETHEE) and elimination and choice expressing reality (ELECTRE). ELECTRE methods are popularly used in energy planning because its inputs are more flexible and its output results are practical and feasible.
The ELECTRE method was created by Benayoun, Roy, and Sussman in 1966 [22], and remains popular in energy, business, and financial management fields [23]. Different ELECTRE algorithms have been proposed one after the other: ELECTRE II [24], ELECTRE III [25], ELECTRE IV [26], ELECTRE TRI (electre tree) [27,28] and ELECTRE IS [27]. Different ELECTRE algorithms have multiple applications in the energy sector, specifically in macro energy policy-making problems and energy siting issues. Haralambopoulos and Polatidis [29] applied the PROMETHEE II method in a group decision-making process to provide multicriteria analysis in renewable energy projects. Troldborg et al. [30] used the PROMETHEE method for a national-scale sustainability evaluation of eleven renewable energy technologies in Scotland. Neves et al. used the ELECTRE-III-based MCDM method to sort energy efficiency initiatives [31]. Papadopoulos and Karajannidis applied a multistandard analysis of the ELECTRE-III method to choose the best renewable energy source for an islanding power generation system [32]. Catalina et al. used the ELECTRE-III method to select the best energy alternatives for multisource systems and conducted case studies [33]. Beccali et al. applied the ELECTRE III method to energy planning in Sardinia and conducted analysis of three different scenarios [34]. Polatidis et al. respectively introduced the applications of ELECTRE-III and PROMETHEE-II methods to the alternatives selection process in the geothermal field and compared the results [35]. J.M.Sánchez-Lozano et al. used the ELECTRE TRI method to choose the best site for solar plant installation, based on the combination of the geographic information system and the decision support system [36]. Dong et al. [37] applied the ELECTRE-II method to evaluate seven operating wind/solar hybrid power plants and selected the best location. J.M.Sánchez-Lozano et al. compared two MCDM methods: the technique for order preference by similarity to ideal solution (TOPSIS) and ELECTRE TRI, then used them for the location of solar farms [38].
With regard to energy macroplanning, formulating energy policies often deals with factors difficult to define and quantify. Specifically, there are various intangible factors from technology, the economy, geographic regions and the environment, whose values are usually uncertain and ambiguous. Thus, few scholars have also studied the fuzzy ELECTRE method in the energy field. Mousavi et al. [39] introduced a modified ELECTRE decision model in the hesitant fuzzy environment to solve the decision-making problem, and a renewable energy policy decision of two developing countries confirmed the feasibility of proposed model. Wu et al. [40] builds a fuzzy framework based on the ELECTRE III method for offshore wind farm site selection.
Through the review of the above literature, it can be seen that when solving the problem of energy ranking, it is particularly critical to figure out how to deal with uncertain and fuzzy information to reduce subjective arbitrariness and effectively use the decision-maker’s preferred information, so as to improve the quality of multicriteria decisions. In this paper, a fuzzy multicriteria decision-making (FMCDM) method based on interval-valued hesitant fuzzy elimination and choice expressing reality II (IVHF-ELECTRE II) is proposed to evaluate renewable energy alternatives in China with uncertain information. The aim of this is to provide decision-making tools and references for policy-makers. FMCDM refers to multicriteria decision-making (MCDM) in the case of vague or incomplete data involved.
First, on the basis of the analysis of the literature, this paper constructs a comprehensive evaluation standard system for renewable energy alternatives composed of main criteria and subcriteria. Then, combined with the knowledge and experience of experts, the triangular fuzzy number weighting method is utilized to obtain the weights of the main criteria and subcriteria. Finally, considering the uncertainty and ambiguity of the information of each alternative to different quantitative criteria and qualitative criteria, the IVHF-ELECTRE II method is used to rank China’s renewable energy alternatives in a hesitant fuzzy environment. The proposed method’s ability to solve REA ranking problems in a hesitant fuzzy environment with uncertain information is a great advantage. Hesitant fuzzy environment refers to an environment in which decision-makers (DM) struggle to evaluate REA performance in different criteria with precise values. This also corresponds to the real situation. First, specific REA contains different technologies which may results in the uncertainties of evaluation. For instance, biomass mainly contains dedicated biomass and energy from waste, so there will be uncertainties in the macro evaluation of certain criteria of biomass, such as technical efficiency. Second, limitations of current science and technology require the hesitant fuzzy environment; for example, due to difficulties and inaccuracies in resource detection, total potential power generation cannot be decided with precise value. Third, the uncertainty in the qualitative assessment needs to be addressed, which is caused by the cognitive limitations of humans and the uncertainty of thinking. The originality of this article is that this is the first time that the combination of triangular fuzzy number weighting and the IVHF-ELECTRE II method is applied to the field of renewable energy alternative sequencing, which subsequently provides a reference for China’s renewable energy macro policy-makers.
The structure of this paper is divided into four parts: Section 2 describes the hybrid FMCDM methodology employed in this paper. Section 3 conducts a case study of renewable energy alternative prioritization in China with uncertain information. Finally, Section 4 presents the conclusions of this paper.

2. Methodology

2.1. Triangular Fuzzy Number Weighting

Due to its intuitive and simple calculations, triangular fuzzy number (TFN) is widely used in fuzzy environments, and it is effectively applied to deal with FMCDM [41].
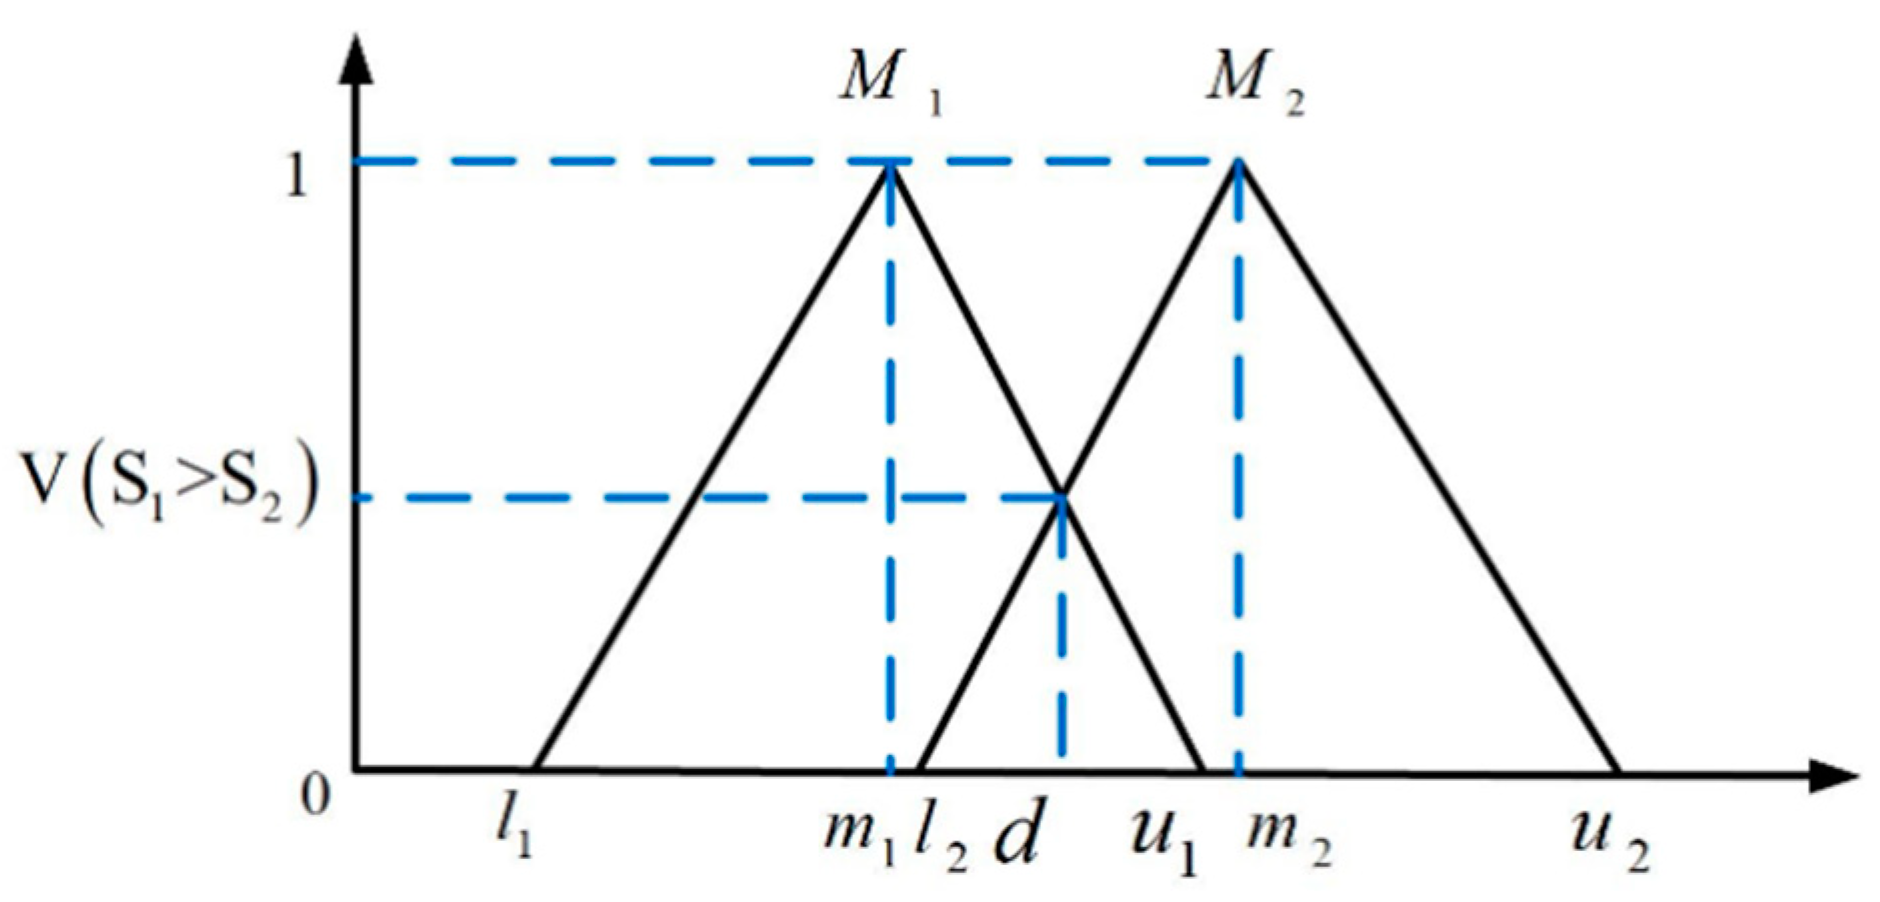
In defining a triangular fuzzy number, as shown in Figure 3, its membership function is
μ M ( x ) = { 0         x < l ( x l ) / ( m l ) l   x m ( x u ) / ( m u ) m x u 0         x > u
where l m u , l represents the smallest possible value, m represents the most possible value, and u represents the largest possible value.
Step 1: Construct a TFN judgment matrix:
The TFN judgment matrix M is obtained by comparing the relative importance of the criteria through expert judgments. TFN M i j = ( l i j , m i j , u i j ) indicates the importance of the i t h criterion relative to the j t h criterion. The larger l i j , m i j , u i j is, the more important the latter is than the former, and its value is continuously [0, 1].
Step 2: Calculate the fuzzy comprehensive degree of each criterion in the same layer [42]:
The fuzzy comprehensive degree S i of the i t h criterion in the current layer is
S i = j = 1 n M i j ( i = 1 n j = 1 n M i j ) 1
For triangular fuzzy numbers M 1 = ( l 1 , m 1 , u 1 ) and M 2 = ( l 2 , m 2 , u 2 ) , M 2 M 1 is defined as:
M 1 M 2 = ( l 1 × l 2 , m 1 × m 2 , u 1 × u 2 )
The value of j = 1 n M i j can be obtained by calculating the value of each criterion in the fuzzy judgment matrix through the following formula:
j = 1 n M i j = ( j = 1 n l j , j = 1 n m j , j = 1 n u j , )
( i = 1 n j = 1 n M i j ) 1 is represented as
( i = 1 n j = 1 n M i j ) 1 = ( 1 / i = 1 n u i , 1 / i = 1 n m i , 1 / i = 1 n l i ) l i , m i , u i > 0
Step 3: Calculate the probability matrix:
When set S 1 = ( l 1 , m 1 , u 1 ) and S 2 = ( l 2 , m 2 , u 2 ) are the fuzzy comprehensive degree of two criteria, the probability of S 1 S 2 is defined as V ( S 1 S 2 ) . The calculation of probability degree is shown in Figure 4, and the formula is as follows:
V ( S 1 S 2 ) = h g t ( S 1 S 2 ) = μ ( d ) = { 1 m 1 m 2 0 l 2 u 1 l 2 u 1 ( m 1 u 1 ) ( m 2 l 2 ) otherwise
After the calculation of the degree, the degree matrix V can be obtained
V = ( V ( S 1 S 1 ) V ( S 1 S 2 ) V ( S 1 S n ) V ( S 2 S 1 ) V ( S 2 S 2 ) V ( S 2 S n ) V ( S n S 1 ) V ( S n S 2 ) V ( S n S n ) )
Step 4: Calculate the local weight of the criterion in the current layer. The weight component w i ( 0 ) of the i t h criterion of the current layer is taken as
w i ( 0 ) = min { V ( S i S K ) : k = 1 , 2 , , n }
Normalize w ( 0 ) to get the local weight of the i t h criterion w i ( 1 ) ( i = 1 , 2 , , n ) :
w i ( 1 ) = w i ( 0 ) / j = 1 n w j ( 0 ) , i = 1 , 2 , , n
Step 5: Calculate the global weight of the criteria. The global weight of the j t h subcriterion under the i t h main criterion is w j
w j = i = 1 n A i w i j
where A i is the weight of the i t h main criterion and w i j is the local weight of the j t h subcriterion relative to the i t h main criterion.

2.2. Interval-Valued Hesitant Fuzzy ELECTRE II

2.2.1. Preliminaries

Definition 1: Let X be a given set, and an interval-valued hesitant fuzzy set (IVHFS) A be [43]
A = { < x i , h A ( x i ) > | x i X , i = 1 , 2 , , n }
where h A ( x i ) : X D [ 0 , 1 ] returns a subset of [0, 1] when it is applied to X. For convenience, h A ( x i ) is an interval-valued hesitant fuzzy element (IVHFE) and we recorded it as
h A ( x i ) = { γ | γ h A ( x i ) }
where γ = [ γ L , γ U ] is an interval number, standing for the possible membership degree of the element x i X to A . γ L = inf γ and γ U = sup γ represent the lower limit and upper limit of γ separately.
Definition 2: For the IVHFE h , s ( h ) = 1 l h γ h γ is the score function of h , where l h represents the number of elements in h . s ( h ) is a subinterval of [0, 1]. For two IVHFEs h 1 and h 2 , if s ( h 1 ) s ( h 2 ) , which means h 1 is superior or indifferent to h 2 , then denote h 1 h 2 .
Definition 3: Let a = [ a L , a U ] , b = [ b L , b U ] , l a = a U a L , l b = b U b L , then the possibility of a b is
p ( a b ) = max { 1 max ( b U a L l a + l b , 0 ) }
Definition 4: The degree of deviation of IVHFE h is
σ ( h ) = [ 1 2 l h γ h ( γ L s ( h ) L ) 2 + ( γ U s ( h ) U ) 2 ] 1 2
where l h is the number of intervals in IVHFE h and s ( h ) is the score of IVHFE h . σ ( h ) reflects the degree of deviation of all values in IVHFE h from its mean. Generally, the number of intervals in different IVHFEs is different, and there is no order. To calculate the distance between two IVHFEs, the interval numbers are organized in ascending order, so l h = max { l h 1 , l h 2 } , where l h 1 , l h 2 are the number of elements in h 1 and h 2 , respectively. When l h 1 l h 2 , we add elements to IVHFEs with fewer intervals until the number of intervals in h 1 and h 2 is the same. If l h 1 > l h 2 , according to the pessimistic criterion, add the smallest element in h 1 to h 1 until the number of intervals in h 1 and h 2 is the same; or according to the optimism criterion, add the largest element in h 1 to h 1 until the number of intervals in h 1 and h 2 is the same [43]. In this paper, the IVHFE is extended according to the optimistic criterion.
Definition 5 [43]: Let the elements of the IVHFE, h 1 = { γ 1 | γ 1 h 1 } , h 2 = { γ 2 | γ 2 h 2 } be arranged in ascending order, γ 1 σ ( i ) , γ 2 σ ( i ) ( i = 1 , 2 , , l ) respectively represent the i t h small value in h 1 and h 2 , then the distance of the IVHFE h 1 and h 2 is
d 1 ( h 1 , h 2 ) = 1 2 l i = 1 l ( | γ 1 σ ( i ) L γ 2 σ ( i ) L | + | γ 1 σ ( i ) U γ 2 σ ( i ) U | )
d 2 ( h 1 , h 2 ) = [ 1 2 l i = 1 l ( ( | γ 1 σ ( i ) L γ 2 σ ( i ) L | ) 2 + ( | γ 1 σ ( i ) U γ 2 σ ( i ) U | ) 2 ) ] 1 2
where γ 1 σ ( i ) = [ γ 1 σ ( i ) L , γ 1 σ ( i ) U ] γ 2 σ ( i ) = [ γ 2 σ ( i ) L , γ 2 σ ( i ) U ] . Equations (15) and (16) are extensions of the Hamming and the Euclidean distance, which are the most often used distance measure methods and there is no indication which one has a significant advantage over the other in fuzzy sets [44]. This paper uses Hamming distance to measure distance.

2.2.2. Interval Hesitant Fuzzy ELECTRE II

Set a range of multicriteria decision-making alternatives A = { A 1 , A 2 , A m } , evaluation criteria set Z = { z 1 , z 2 , z n } , the corresponding weight vector W = ( w 1 , w 2 , , w n ) T , and the IVHF-decision matrix H = ( h i j ) m × n . h i j ( i = 1 , 2 , , m ; j = 1 , 2 , , n ) indicates possible membership degree of the i t h alternative A i satisfying the j t h criterion z j .
  • Hesitant fuzzy concordance and discordance indexes
The IVHF-concordance (discordance) sets are divided into three sets, namely the strong, medium and weak concordance (discordance) sets. They are defined as follows [43]:
IVHF-strong concordance set J C i k :
J C i k = { j | p ( h i j , h k j ) > p ( h k j , h i j ) σ ( h i j ) < σ ( h k j ) , j J }
IVHF-moderate concordance set J C i k :
J C i k = { j | p ( h i j , h k j ) > p ( h k j , h i j ) σ ( h i j ) σ ( h k j ) , j J }
IVHF-weak concordance set J C i k :
J C i k = { j | p ( h i j , h k j ) = p ( h k j , h i j ) σ ( h i j ) < σ ( h k j ) , j J }
IVHF-strong discordance set J D i k :
J D i k = { j | p ( h i j , h k j ) < p ( h k j , h i j ) σ ( h i j ) > σ ( h k j ) , j J }
IVHF-moderate discordance set J D i k :
J D i k = { j | p ( h i j , h k j ) < p ( h k j , h i j ) σ ( h i j ) σ ( h k j ) , j J }
IVHF-weak discordance set J D i k :
J D i k = { j | p ( h i j , h k j ) = p ( h k j , h i j ) σ ( h i j ) > σ ( h k j ) , j J }
IVHF-indifference set J i k = :
J i k = = { j | p ( h i j , h k j ) = p ( h k j , h i j ) σ ( h i j ) = σ ( h k j ) , j J }
where J = { 1 , 2 , , n } , p ( h i j , h k j ) = p ( s ( h i j ) s ( h k j ) ) .
The IVHF-concordance index c i k ( i , k = 1 , 2 , m ; i k ) of the alternatives A i and A k is
c i k = ω c × j J C i k ω j + ω c × j J C i k ω j + ω c × j J C i k ω j + ω J = × j J i k = ω j
Here ω c , ω c , ω c , ω J = represent attitude weights of the IVHF-strong concordance set, the moderate concordance set, the weak concordance set and the indifference set. The larger the element c i k , the greater the degree of A i A k . Then, the concordance matrix C = ( c i k ) m × m , c i k [ 0 , 1 ] ( i , k = 1 , 2 , m ; i k ) can be established.
The discordance index d i k means the degree of rejecting the assertion that “scheme A i is better than A k ”. The discordance index d i k ( i , k = 1 , 2 , , m ; i k ) of alternatives A i and A k is:
d i k = max j J D i k J D i k J D i k { ω D × d ( w j h i j , w j h k j ) , ω D × d ( w j h i j , w j h k j ) , ω D × d ( w j h i j , w j h k j ) } / max j J d ( w j h i j , w j h k j )
Here ωD ω D ω D respectively represents the attitude weights of IVHF-strong discordance set, the moderate discordance set, and the weak discordance set. Then, the discordance matrix D = ( d i k ) m × m , d i k [ 0 , 1 ] ( i , k = 1 , 2 , , m ; i k ) can be obtained; the larger dik is, the greater the degree of A i A k is.
2.
Calculation of outranking matrix and total dominance matrix
Calculate the outranking matrix A = ( a i k ) m × m , where matrix A is the Hadamard product of C and ED, namely;
a i k = c i j ( 1 d i k )
where E denotes a matrix whose elements of m × m are both 1, and the larger a i k , the greater the degree of A i A k . Define the total dominance matrix E = ( e i k ) m × m :
e i k = { 1 , a i k a k i 0 , a i k < a k i
in the total dominance matrix E , e i k = 1 indicates that the scheme A i is superior to the scheme A k , and at this time, the scheme A k can be eliminated and recorded as A i A k .

2.3. Decision-Making Steps

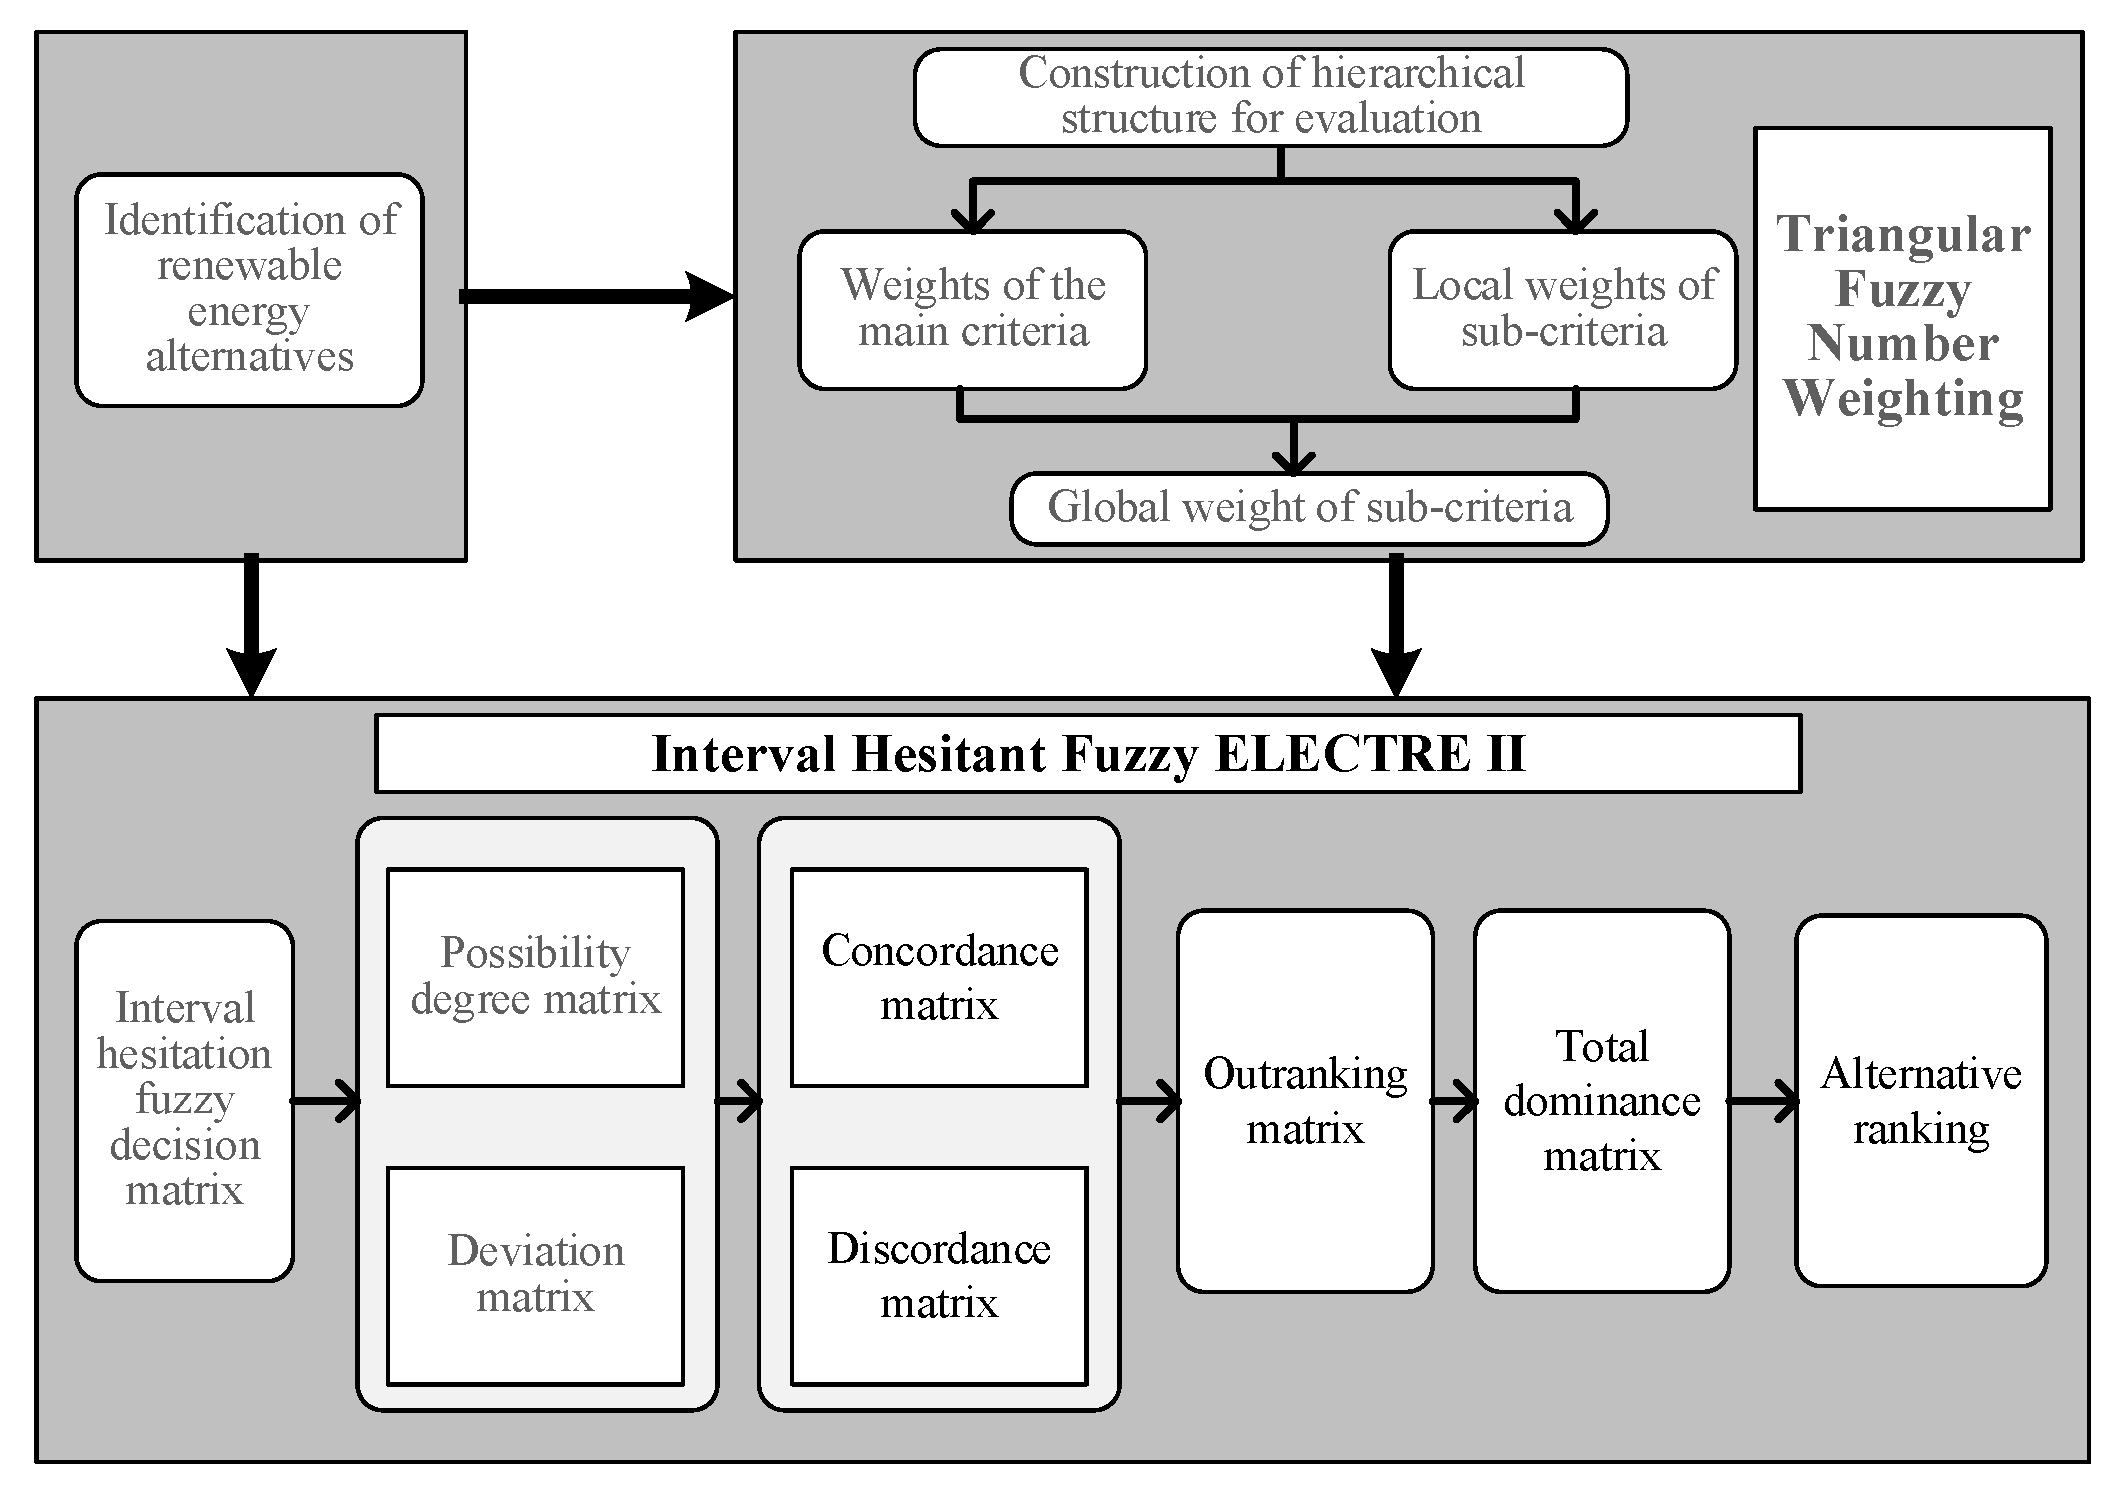
Base the above definition and analysis, the fuzzy model of three parts is proposed in order to rank renewable energy alternatives, as depicted in Figure 5. The specific steps are as follows:
(1) Identification of renewable energy alternatives
Based on local renewable energy resources and future developing potential, identify renewable energy alternatives in the study region. The number of renewable energy alternatives is represented by m .
(2) Triangular fuzzy number weighting
Step1: Select representative criteria from various facets to evaluate different renewable energy resources and construct a hierarchical structure based on the selected criteria. The number of subcriteria for evaluation is represented by n .
Step2: Calculate the weights of criteria in the evaluation hierarchical structure.
(3) Prioritization of renewable energy alternatives based on interval hesitant fuzzy ELECTRE II with uncertain information
Step1: Establish an IVHF-decision matrix H = ( h i j ) m × n for the evaluation of renewable energy alternatives. Calculate the IVHF-scoring matrix according to Definition 2 in Section 2.2.1.
Step2: Calculate the possibility degree of s ( h i j ) s ( h k j ) ( i , k = 1 , 2 , m ; i k ; j = 1 , 2 , n ) and the deviation degree of the IVFEs according to Formulas (13) and (14). Based on the possibility degree matrix and the calculated deviation matrix, calculate the IVHF-concordance (discordance) sets ( J C J C J C J D J D J D J = ) according to Formula (18)–(24) and determine the corresponding attitude weights vector ω = ( w c , w c , w c , w D , w D , w D , w J = ) .
Step3: Calculate the IVHF-concordance index c i k ( i , k = 1 , 2 , m ; i k ) and construct the concordance matrix C = ( c i k ) m × m according to Formula (24).
Step4: According to Formula (15), calculate the weighted distance of each alternative for each criterion. According to Formula (25), calculate the IVHF-discordance indexes d i k ( i , k = 1 , 2 , m ; i k ) and construct the discordance matrix D = ( d i k ) m × m .
Step5: Calculate the outranking matrix A = ( a i k ) m × m according to Formula (26).
Step6: Obtain the total dominance matrix E = ( e i k ) m × m according to Formula (28) and draw the priority relationship diagram of the renewable energy alternatives according to the total advantage matrix. Then, sort the alternatives.

3. Case Study and Results

In this study, a hybrid hesitant FMCDM model is introduced to rank renewable energy alternatives in China with uncertain information.

3.1. Identification of Renewable Energy Alternatives

3.1.1. Wind

Converting wind energy into electricity is one of the most basic ways of utilizing wind energy. Due to the long coastline and monsoon climate characteristics, China’s wind resource is extremely rich. In 2004–2006, the China Meteorological Administration organized the third national wind energy resource survey, which reveals that the exploitable wind energy about 600–1000 GW on land and 400–500 GW on the shore [45]. Chinese and American researchers used the fifth edition of the Geodetic Earth Observation System Data Assimilation System database to estimate the potential of wind power. This study indicates that a 1.5-MW turbine deployed in a land-based area with favorable wind resources can provide up to 24.7 kWh of electricity per year [45]. Wind is generally considered to be environmentally friendly, but it still has some impact on the environment and ecology, including the high noise level caused by wind turbines, visual impact, the impact on land fauna and flora, marine life, and miscellaneous impact on climate change [46].

3.1.2. Solar

Solar energy is abundant in China, and more than two-thirds of the country can receive more than 5000 MJ/m2 of radiation and more than 2200 hours of sunshine [47]. With high solar radiation and sunshine hours every year, China’s Tibet, Qinghai, Xinjiang, Gansu, Ningxia and Inner Mongolia regions are rich in solar energy resources, with high solar radiation and sunshine hours every year [48]. According to data provided by the Institute of Geology and Geophysics of the Chinese Academy of Sciences, the Gobi area in china has an area of approximately 570,000 square kilometers. If 5% of the Gobi area is used to develop photovoltaic stations, power generation will be more than 1.5 billion kW (1-kW photovoltaic power stations per 25 m2) [49]
There are two methods of solar power generation, photovoltaic and solar thermal power generation. Distributed photovoltaic power generation systems are developing rapidly in China because of their advantages of flexible geographical location, clean and nonpolluted characteristics, lack of fuel consumption, simple construction and high technology maturity. According to data from the National Energy Administration, the cumulative installed capacity of photovoltaic power generation in China reached 204.3 million kW in 2019. Additionally, the centralized and distributed photovoltaic power generation of China have continuously ranked first in the world for many years [50]. However, due to the limitation of electric energy storage technology, it is more difficult to connect photovoltaic energy to the grid. In contrast, heat storage technology makes it relatively easy to store electric energy. Solar thermal power has the ability to store energy, peak load regulation, and achieve continuous power generation. It is the physical heat of light conversion, and compared with photovoltaic cells, it is cleaner and more environmentally friendly. However, solar thermal power is a centralized solar power (CSP) generation, and most of China’s eligible areas for CSP are in Tibet, Qinghai—far away from users. In addition, due to the immature photothermal technology, the current cost is relatively high, so it has not been vigorously developed in China. Photovoltaic and photo-thermal are very different in terms of power generation methods, resource conditions, principles, characteristics, energy storage, grid connection and other aspects. Therefore, this paper considers the two resource situations, respectively. While solar PV stations do not increase greenhouse gas emissions or air pollution, large amounts of electricity and toxic substances are used to make photovoltaic cells/modules. Furthermore, PV plants take up a lot of land and may have a long-term impact on the habitats of native plants and animals [51]. On the other hand, while solar thermal power has a relatively small environmental impact, the system stores high-temperature chemical fluids. The leakage of these materials may be dangerous and harmful. In addition, the concentrated sunlight beam generated by reflecting panels may kill birds and insects flying through it [51].

3.1.3. Hydro

Abundant hydro resources bestowed by nature have provided unparalleled opportunities and unprecedented advantages for the rapid development of hydropower in China over the last decades. China has the most abundant hydro power reserves on earth, with a potential capacity of 694 GW [52]. As shown in [53,54], the available installed capacity from the technical perspective and the annually average generating capacity are evaluated to be about 542 GW and 2470 Twh/year, respectively, while those indexes from the economic perspective are 402 GW and 1750 Twh/year, respectively. Hydropower may change natural water temperature and compounds, channel flow features, and silt loads, and can even hinder the migration of fish and alter the environment of an area larger than a reservoir. Furthermore, it may also increase greenhouse gas emissions due to the aerobic and anaerobic decomposition of biomass in water [55].

3.1.4. Biomass

In China, agricultural and forestry residues are the most common materials for biomass energy. According to the current technical status of biomass energy utilization, the total biomass resources that China may utilize are estimated to be 460 million tons of standard coal per year [56]. In addition, He et al. [57] used the remote energy alternative planning system (LEAP) to establish a model for power planning. This paper indicates that the installed capacity of agricultural and forestry wastes, municipal solid wastes and marsh gas power generation in the benchmark scenario is expected to increase to 22350 MW, 21150 MW and 4900 MW by 2030, respectively. The carbon footprint emissions from biomass combustion come from carbon dioxide captured from the atmosphere through plant photosynthesis, which is considered a carbon-neutral process [58]. However, burning biomass releases other pollutants into the air, including carbon monoxide, volatile organic compounds and nitrogen oxides, which releases more pollution than burning fossil fuels in some cases [59].

3.1.5. Geothermal

China is located in the two major geothermal belts of the world. The southeast coast belongs to the circum-Pacific geothermal belt, and southwest Yunnan–Tibet geothermal field belongs to the Mediterranean–Himalayan geothermal belt. China has ample geothermal resources that are widely distributed. The total geothermal energy in China is about 11×106 EJa−1, accounting for 7.9% in the world [60]. China’s potential geothermal reserves are 135.3 billion tons of standard coal, with an estimated reserve of 116.6 billion tons of standard coal and proven reserves of 3.16 billion tons of standard coal [38]. Located in YangBajing, China’s largest geothermal power station has a capacity of 2.518 MW and an annual output of 100 million kilowatt-hours [60,61]. Direct use of geothermal energy has relatively small negative effects on the environment. Reported environmental impacts include greater earthquake frequency, heat effects, and chemicals emission [62].

3.2. Triangular Fuzzy Number Weighting

3.2.1. Construction of Hierarchical Structure for Evaluation

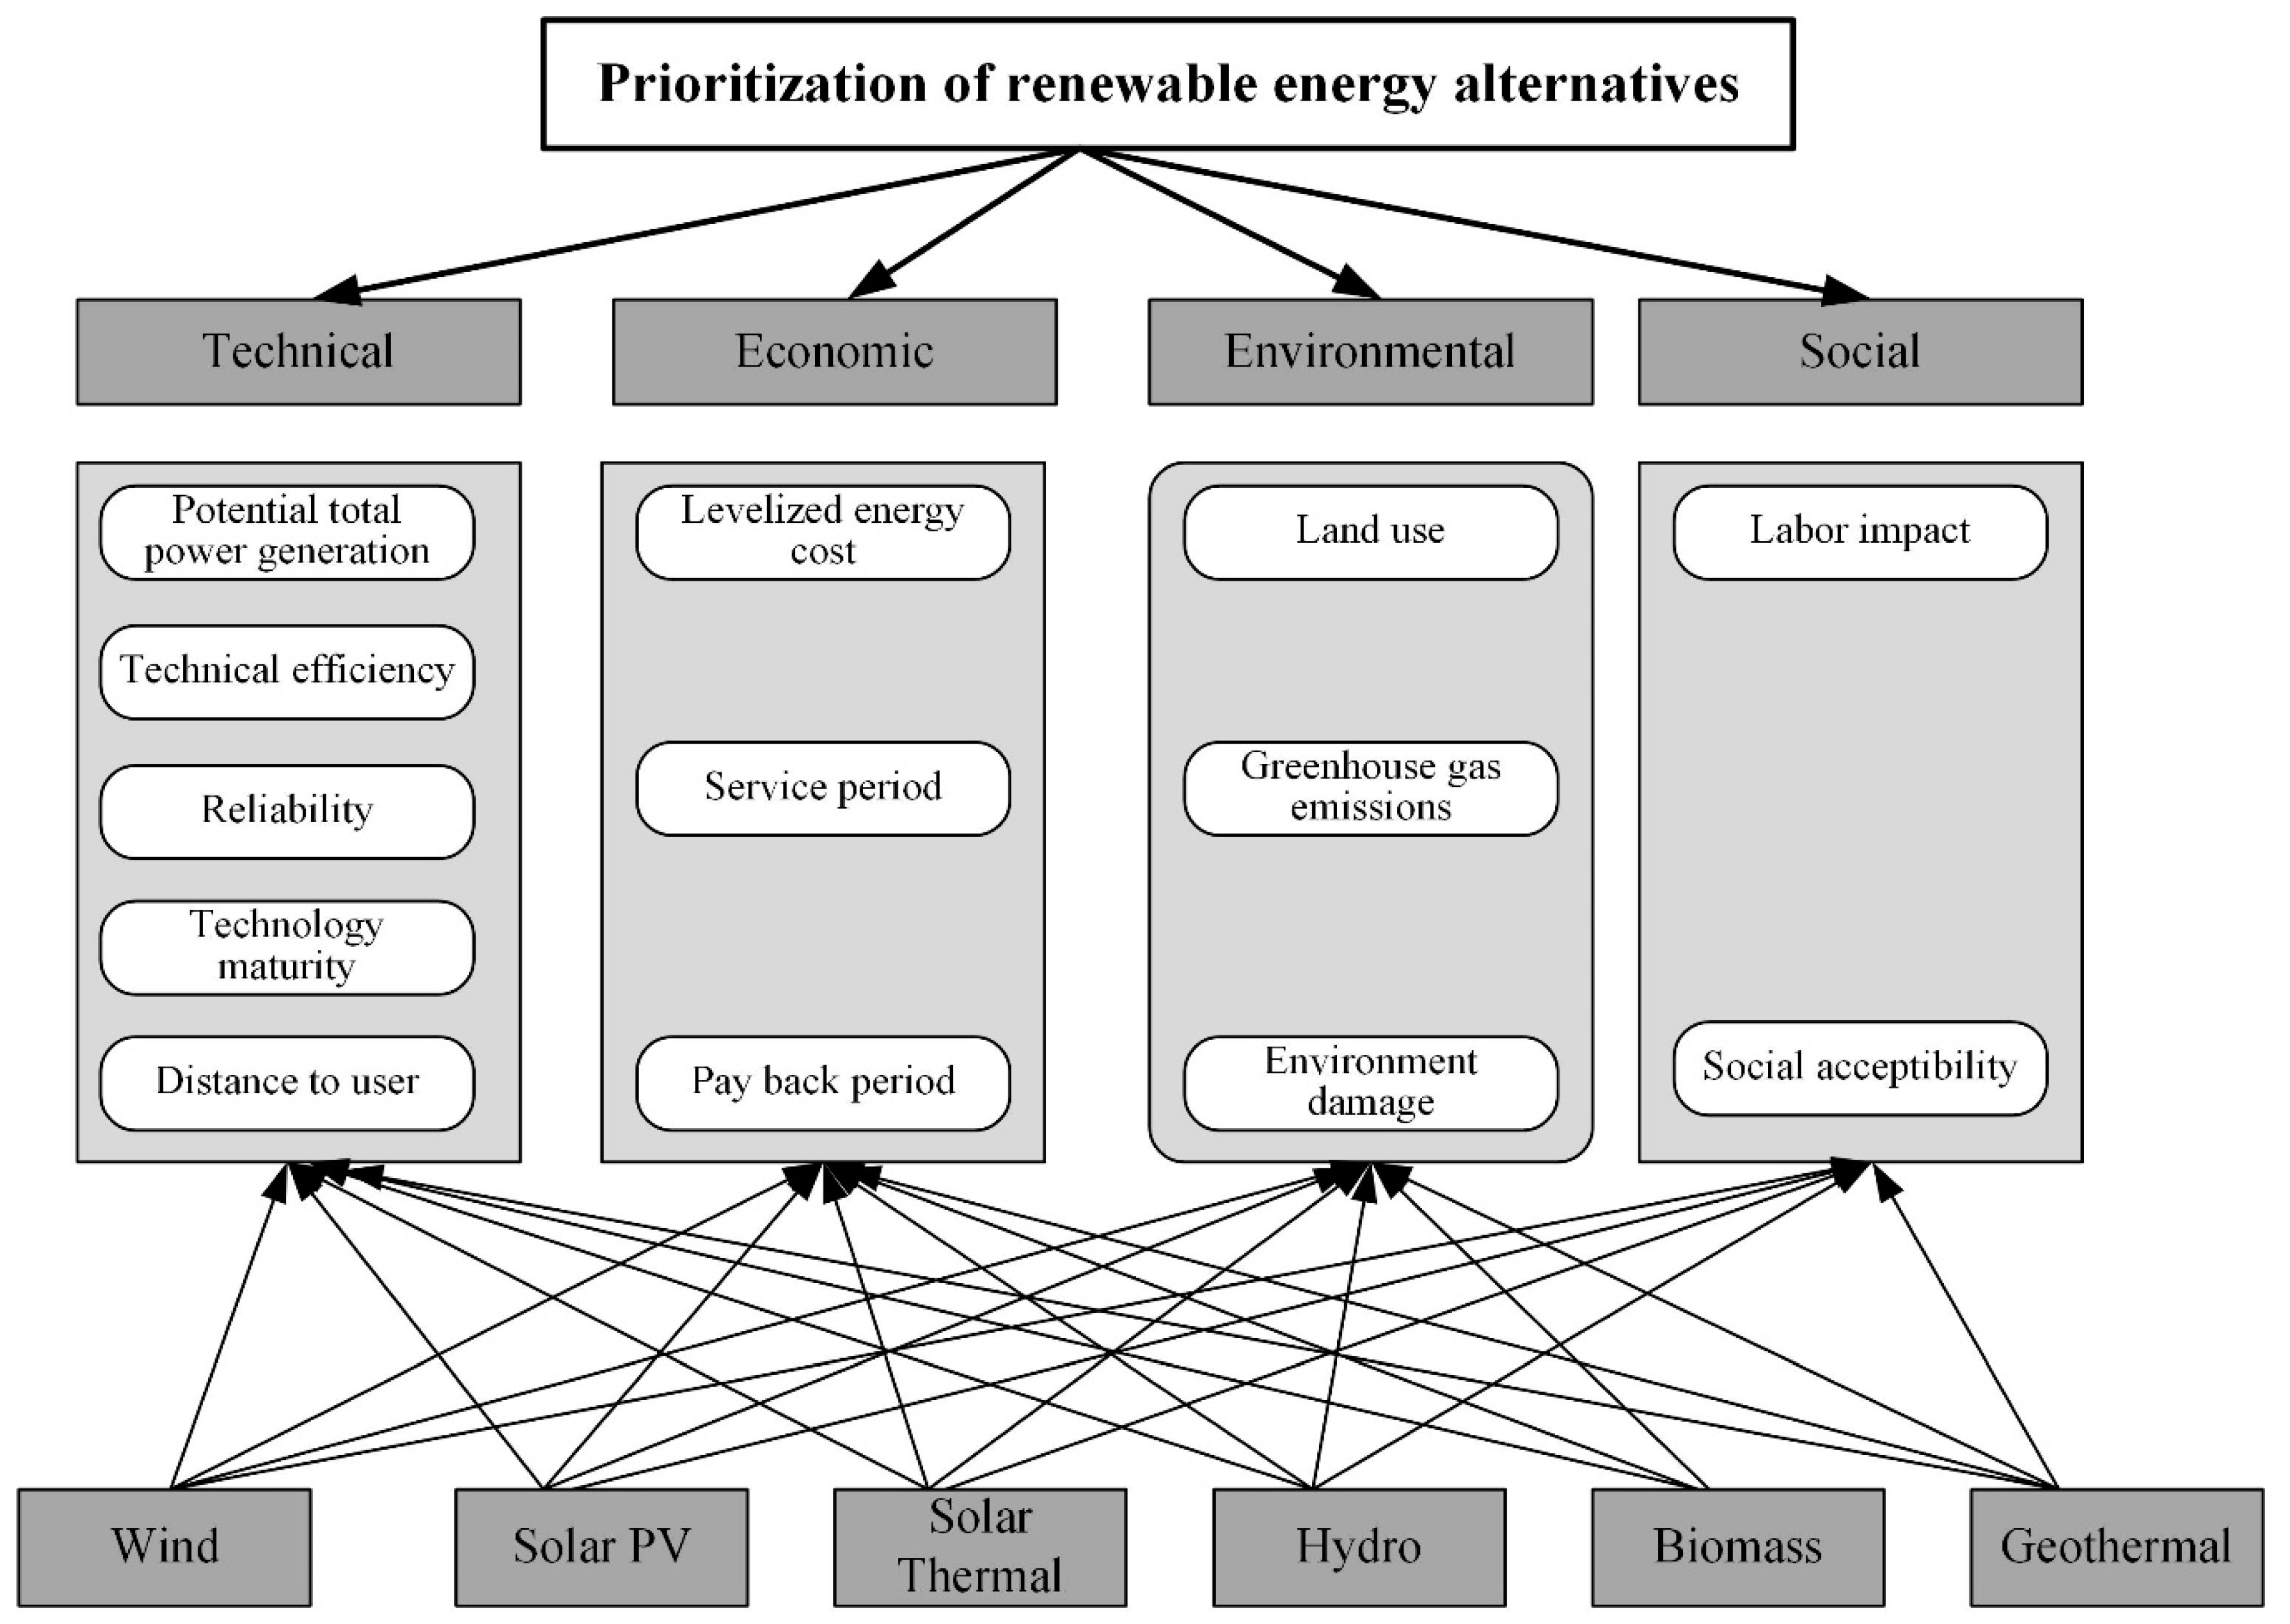
Prioritization of renewable energy alternatives requires comprehensive consideration of technical, economic, environmental, and social aspects. To evaluate renewable energy alternatives for China, a hierarchical structure including 4 main criteria and 13 subcriteria is used for the six alternatives mentioned in the Section 3.1. These criteria and alternatives are determined from the review of energy decision-making papers in the literature and experts’ ideas. The evaluation criteria system is shown in Figure 6 and the explanation is shown in Table 1.

3.2.2. Calculation of Triangular Fuzzy Number Weighting

The triangular fuzzy number weighting method is applied to calculate the weights of the evaluation criteria. Experienced experts are invited to judge relative importance of every criterion in the different layers. Five triangular fuzzy number judgment matrices ( M , M 1 , M 2 , M 3 , M 4 ) are constructed, as shown in Table 2, Table 3, Table 4, Table 5 and Table 6.
Taking the weight calculation of the main criteria based on the triangular fuzzy judgment matrix M as an example, the weight calculation process is as follows:
(1) Calculate the fuzzy comprehensive degree of “Technical” S A according to Formula (2)–(4):
j = 1 n M 1 j = ( 0.5 ; 0.5 ; 0.5 ) + ( 0.5 ; 0.6 ; 0.7 ) + ( 0.6 ; 0.7 ; 0.8 ) + ( 0.6 ; 0.8 ; 0.9 ) = ( 2.2 ; 2.6 ; 2.9 ),
M 1 M 2 = ( l 1 l 2 , m 1 m 2 , u 1 u 2 ),
i = 1 n j = 1 n M i j = ( 0.5 ; 0.5 ; 0.5 ) + ( 0.5 ; 0.6 ; 0.7 ) + ( 0.6 ; 0.7 ; 0.8 ) + ( 0.6 ; 0.8 ; 0.9 ) + ( 0.3 ; 0.4 ; 0.5 ) + ( 0.5 ; 0.5 ; 0.5 ) + ( 0.5 ; 0.6 ; 0.7 ) + ( 0.5 ; 0.6 ; 0.7 ) + ( 0.2 ; 0.3 ; 0.4 ) + ( 0.3 ; 0.4 ; 0.5 ) + ( 0.5 ; 0.5 ; 0.5 ) + ( 0.6 ; 0.7 ; 0.8 ), + ( 0.1 ; 0.2 ; 0.4 ) + ( 0.3 ; 0.4 ; 0.5 ) + ( 0.2 ; 0.3 ; 0.4 ) + ( 0.5 ; 0.5 ; 0.5 ) = ( 6.7 ; 8 ; 9.3 )
S A = j = 1 n M i j ( i = 1 n j = 1 n M i j ) 1 = ( 2.2 ; 2.6 ; 2.9 ) ( 1 9.3 ; 1 8 ; 1 6.7 ) = ( 0.2366 ; 0.3250 , 0.4328 ).
(2) Similarly, fuzzy comprehensive degrees of the main criteria “Economic”, “Environmental” and “Social” are calculated, represented as S B , S C , and S D , respectively. S B = ( 0.1935 ; 0.2625 ; 0.3582 ) ; S C = ( 0.1720 ; 0.2375 ; 0.3284 ) ; S D = ( 0.1183 ; 0.1750 ; 0.2687 ) .
According to Formula (6): V ( A B ) = 0.2366 0.3582 0.2625 0.3582 0.3250 + 0.2366 = 0.6606
(3) The probability matrix of the main criteria is calculated according to Formula (6) and (7), as presented in Table 7:
(4) Calculate the weight vector according to Formula (8) and (9) and normalize the weight vector to obtain the weights of the main criteria, as shown in Figure 7:
Similarly, the local weights of the subcriteria can be obtained by calculating Table 3, Table 4, Table 5 and Table 6 according to Formula (6)–(9).
  • W ( A 1 , A 2 , A 3 , A 4 , A 5 ) = ( 0.1987 , 0.1486 , 0.2424 , 0.2760 , 0.1342 )
  • W ( B 1 , B 2 , B 3 ) = ( 0.6307 , 0.1084 , 0.2610 )
  • W ( C 1 , C 2 , C 3 ) = ( 0.2637 , 0.3682 , 0.3682 )
  • W ( D 1 , D 2 ) = ( 0.6655 , 0.3344 )
5) According to Formula (10), calculate the global weights of subcriteria, taking A1 as an example W A 1 = 0.4257 0.1987 = 0.0846 . The top indicators in the global weight ranking are: “Levelized energy cost (B1)”, “Technology Maturity(A4)”, “Potential total power generation(A1)”, “Greenhouse gas emissions(C2)”, and “Environment damage(C3)”. This shows that China’s macroscopic renewable energy development strategy at this stage should give priority to REAs featuring abundant resources, advanced technology, an environmentally friendly nature and relatively economical characteristics. Global weights of substandards are as shown in Table 8:

3.3. Prioritization of Renewable Energy Alternatives in China

A case study in China for the prioritization of renewable alternatives is presented to illustrate the feasibility of the proposed IVHF-ELECTRE II model. E i ( i = 1 , 2 , 3 , 4 , 5 , 6 ) is used to represent wind, solar PV, solar thermal, hydro, biomass and geothermal energy, respectively. The thirteen subcriteria ( A 1 ,   A 2 ,   A 3 ,   A 4 ,   A 5 ,   B 1 ,   B 2 ,   B 3 ,   C 1 ,   C 2 ,   C 3 ,   D 1 ,   D 2 ) to evaluate different renewable energy alternatives are denoted by z j ( j = 1 , 2 , , 13 ) = in this subsection. The specific evaluation process is shown as follows:
Step 1: A hybrid model which combines qualitative and quantitative methods is used in this paper, in which quantitative data come from published papers, research reports, etc., while qualitative data come from the scores of two well-known experts with more than 40 years of experience in the Chinese power energy industry and one experts in the field of “Energy and Environment Intersection”. The original data are shown in Table 9.
Data normalization: To eliminate the influence of physical dimensions different and measurements on the final decision, the data under the quantitative indicators need to be standardized to a [0, 1] interval. The standardized method is shown in Equation (28):
( a i j _ , a i j _ ) = { ( a i j a maxj , a i j _ a maxj )      if a i j F A ) ( a m in j a i j _ , a m in j a i j )      if a i j F B )
where FA refers to the maximization index and FB refers to the minimization index. For example, the largest potential total power generation (A1) is 247000TWh / y, A1 ∈ FA, and the A1 score of Solar PV is (1296/247000, 6480/247000), which is (0.01, 0.03). The standardized data are shown in Table 10.
Step 2: Calculate the possibility degree of s ( h y ) s ( h k j ) ( i , k = 1 , 2 , 6 ; i k , j = 1 , 2 , 13 ) and the deviation degree of the IVFEs according to Formulas (13) and (14). Then, calculate the IVHF-concordance (discordance) sets ( J C J C J C J D J D J D J = ) according to Formula (17) and (18) and determine the corresponding attitude weights vector ω = ( w c , w c , w c , w D , w D , w D , w J = ) . For simplicity, we put the IVHF-concordance (discordance) sets and the corresponding attitude weights vector in the Appendix A.
Step 3: Calculate the IVHF-concordance index cik according to Formula (24), and construct the concordance matrix C = ( c i k ) 6 × 6 ( i , k = 1 , 2 , , 6 ; i k ) . The thirteen criteria’ weights are the global weights of the subcriteria calculated in Section 3.1.
C = [ 0.517 0.762 0.268 0.645 0.657 0.401 0.778 0.400 0.554 0.592 0.163 0.233 0.272 0.196 0.481 0.652 0.513 0.652 0.809 0.707 0.277 0.355 0.718 0.157 0.533 0.271 0.310 0.469 0.214 0.403 ],
Step 4: Calculate the weighted distance of each alternative for each criterion according to Formula (15). Then, calculate the discordance index d i k according to Formula (25), and construct discordant matrix D = ( d i k ) 6 × 6 ( i , k = 1 , 2 , 6 ; i k ) .
D = [ 0.773 0.342 0.900 0.717 0.582 0.900 0.248 0.900 0.720 0.900 1.000 1.000 1.000 0.900 0.900 0.458 0.893 0.622 0.441 0.750 0.900 0.972 0.394 0.957 1.000 0.900 0.808 0.469 0.900 0.792 ],
Step 5: Calculate the outranking matrix A = ( a i k ) 6 × 6 ( i , k = 1 , 2 , 6 ) according to Formula (26).
A = [ 0.118 0.501 0.027 0.182 0.275 0.040 0.585 0.040 0.155 0.059 0.000 0.000 0.000 0.020 0.048 0.354 0.055 0.246 0.452 0.177 0.028 0.010 0.435 0.007 0.000 0.027 0.060 0.249 0.021 0.084 ],
Step 6: According to Formula (27), calculate the total dominance matrix E . According to the total dominance matrix, draw the priority relationship diagram of the renewable energy alternatives, as shown in Figure 8.
E = [ 1 1 0 1 1 0 1 0 1 0 0 0 0 0 0 1 1 1 1 1 0 0 1 0 0 0 1 1 0 1 ],
According to the priority relationship diagram, the priority relationship between six renewable energy alternatives is E 4 > E 1 > E 6 > E 2 > E 5 > E 3 . The results show that in the case of uncertain information, hydro is considered to be the best choice for China’s renewable energy priority, followed by wind energy, solar photovoltaic, geothermal, biomass energy, and solar thermal. It should be noted that the ranking results are related to experts’ understanding of uncertain information and subjective preferences.
Due to the mature technology and low cost, hydro and wind are at the forefront of priority development in the current and near future, which is also consistent with the research of Zhang et al. [52] Due to the low-cost, low-carbon, clean and renewable characteristics, reliable and flexible operation, and fundamental auxiliary services, hydropower is considered as the most important renewable energy in China. Considering the current water conservancy in China, the potential of hydropower has not been fully utilized. Hydro power is characterized by its low cost and long-running time; therefore, it ranks high in technical efficiency, reliability, technology maturity, levelized energy cost, and service period indicators, which explains its first place in the REA ranking. In general, wind power performs well on indicators such as potential total power generation, greenhouse gas emissions, and social acceptability.
With relatively mature technology, conventional PV power generation technology has developed steadily in China while solar thermal is still in the stage of technological innovation and improvement. The power generation process of solar thermal plants requires a large land area and relatively huge amounts of water, resulting in the increasing investment cost. However, compared with solar PV, solar thermal can better match the existing power grid. With the support of funds and policies, solar power, especially solar PV, is expected to rapidly develop.
With ample resources and incentive policies, geothermal energy and biomass energy will also be expected to rapidly grow. The utilization of geothermal energy in China ranks first in the world. With relatively high reliability, a low operating cost and a long operating time, geothermal energy performs better in levelized energy cost, service period, and payback period. With the technical development of enhanced geothermal system (EGS) along with cost reduction, there is reason to believe that geothermal systems will also develop rapidly. The main problem of biomass power generation is the supply of biomass materials. The development of biomass energy currently has little policy support for the collection and transportation of raw materials. To promote the development of the biomass energy industry, China may grow more energy crops in the future. Moreover, China has gradually implemented garbage classification in cities such as Shanghai and Beijing. The shortage of biomass resources may be alleviated.

4. Discussion and Conclusions

This paper researches on the priority order of renewable energy alternatives in China based on the FMCDM method. Decisions of policy-makers and values of different criteria are ambiguous, and different criteria may be contradictory; therefore, considering the ambiguity of the expert’s thinking process during the evaluation coupled with the uncertainty of quantitative indicators, an FMCDM technique based on the IVHF-ELECTRE II method combined with triangular fuzzy number weighting is proposed to rank renewable energy alternatives in China. First, on the basis of the analysis of the literature, this paper constructs a comprehensive evaluation standard system for renewable energy alternatives composed of main criteria and subcriteria. Then, using the triangular fuzzy number weighting method combined with the knowledge and experience of experts, the weights of the main criteria and subcriteria are obtained. Finally, the IVHF-ELECTRE II method is used to rank China’s renewable energy alternatives considering the uncertainty and ambiguity of the information of each alternative in relation to different quantitative criteria and qualitative criteria. The results show that, in the case of uncertain information, the priority relationship of the six renewable energy alternatives in China is ranked in the following order: hydropower, wind energy, solar PV, geothermal, biomass energy, and solar thermal.
The advantages of the proposed method are twofold: (1) In the selection of REA, the uncertainty of the assessment of REA caused by the different specific technical types and technological progress are considered, as well as the uncertainty in the qualitative assessment, which is caused by the cognitive limitations of humans and the uncertainty of thinking. This can better simulate the actual situation in the decision-making process of REA ranking. (2) It handles both quantitative and qualitative information, as well as mixed-decision information, including clear values and interval values. It also uses various evaluation information to solve REA ranking problems on a macro level without losing information.
In order to curb global warming and environmental degradation, and to fulfill China’s commitment to reduce its carbon emissions by 60%–65% in 2030 compared to 2005, China needs to increase its efforts to develop renewable energy. To achieve this macro objective, overall planning for the development of renewable energy must be made. Based on the priority analysis results of renewable energy alternatives in this article, reasonable suggestions are proposed to assist the government and relevant policy-makers in coordinating and planning renewable energy.
China is undergoing an energy structure transformation. The energy structure transformation includes, but is not limited to, the optimization and upgrading of the power supply structure, the adjustment of the energy supply side, and the transformation of the energy consumption side. Renewable energy alternatives are a key measure for the energy structure transition, which requires rational planning and timely guidance. At this stage, China still uses thermal power as its main solution. The power supply structure still needs to be continuously optimized and adjusted to increase the installed capacity of renewable energy. Based on the prioritization results of renewable energy in this paper and the installed hydro power capacity, it is suggested that wind power-installed capacity should be the mainstay of renewable energy.
From the perspective of resources, wind energy has great development potential in China. However, due to the uneven distribution of energy in time and space, China’s resources and demand have been reversed. It is necessary to vigorously develop distributed wind power and reduce the on-grid tariff for wind power. In order to reasonably guide the transition and upgrade of energy supply and demand, there is an urgent need to construct transmission channels, promote the consumption of renewable energy, and promote the virtuous cycle of renewable energy substitution. Moreover, characterized by its storage-like flexibility, peak shaving and valley filling, hydropower should continue to play a capacity support role and provide the grid with ancillary services, so as to support the development of other variable renewable energy and gradually replace fossil energy. Therefore, based on the research results of this paper, the Chinese government should steadily advance hydro power construction on the macro energy plan. However, before implementing a specific hydropower project, it is necessary to comprehensively adopt the opinions of experts in various fields and fully measure the environmental hazards caused by hydropower stations.
This research provides planners and decision-makers with a tool to help them make decisions with uncertain information in a strategic way that can be used for future energy policy development purposes. In addition, the methodology of the model is equally applicable to the formulation and reference of energy policies in different regions of China, as well as other developing countries. At last, emerging renewable energy technologies and new reasonable criteria can also extend this model in the future.

Author Contributions

Conceptualization, H.Z.; data curation, M.Y.; funding acquisition, X.X.; investigation, M.Y. and K.W.; methodology, K.W.; project administration, D.N.; resources, X.X.; software, H.Z.; supervision, D.N.; validation, M.Y. and L.S.; writing—original draft, H.Z.; writing—review and editing, H.Z. and K.W. All authors have read and agreed to the published version of the manuscript.

Funding

This work is supported by the 2018 Key Projects of Philosophy and Social Sciences Research, Ministry of Education, China (grant number 18JZD032) and Natural Science Foundation of China (grant number 71804045).

Conflicts of Interest

The authors declare no conflict of interest.

Appendix A

J C i k = [ [ 13 ] [ 3 , 4 , 13 ] [ 4 , 10 , 11 ] [ 11 , 13 ] [ 3 , 4 ] [ 3 ] [ 4 , 10 ] [ 13 ] [ 3 ] [ 11 ] [ 11 , 13 ] [ 6 , 10 ] [ 13 ] [ 4 , 13 ] [ 4 , 6 , 10 ] [ 11 , 13 ] [ 4 , 13 ] [ 11 , 13 ] [ 6 ] [ 3 ] [ 3 ] [ 6 , 10 ] ],
J C i k = [ [ 1 , 2 , 4 , 6 , 10 ] [ 1 , 2 , 5 , 6 , 7 , 10 , 11 ] [ 1 , 9 , 11 , 12 , 13 ] [ 1 , 2 , 6 , 9 , 13 ] [ 1 , 2 , 3 , 4 , 5 , 9 , 10 , 12 ] [ 3 , 5 , 8 , 9 , 11 , 12 ] [ 1 , 5 , 7 , 8 , 10 , 11 , 12 , 13 ] [ 1 , 5 , 9 , 11 , 12 ] [ 1 , 5 , 9 , 11 , 13 ] [ 1 , 3 , 4 , 5 , 9 , 10 , 11 , 12 ] [ 8 , 9 , 12 ] [ 2 , 9 ] [ 9 , 11 , 12 ] [ 9 ] [ 1 , 2 , 4 , 9 , 12 ] [ 2 , 3 , 4 , 7 , 8 ] [ 2 , 4 , 6 , 7 , 8 , 10 ] [ 1 , 2 , 5 , 6 , 7 , 8 , 10 ] [ 1 , 2 , 3 , 7 , 8 , 9 , 13 ] [ 1 , 2 , 4 , 5 , 6 , 7 , 9 , 10 ] [ 3 , 7 , 8 , 12 ] [ 2 , 6 , 7 , 8 , 12 ] [ 1 , 2 , 3 , 5 , 6 , 7 , 8 , 12 ] [ 11 , 12 ] [ 1 , 2 , 3 , 4 , 5 , 12 ] [ 7 , 8 ] [ 2 , 6 , 7 , 8 ] [ 6 , 7 , 8 , 10 ] [ 8 , 12 ] [ 7 , 8 , 9 ] ],
J C i k = [ [ 3 ] [ 10 ] [ 5 ] [ 5 ] ],
J D i k = [ [ 6 , 10 ] [ 6 ] [ 13 ] [ 13 ] [ 3 , 4 , 13 ] [ 3 , 4 ] [ 4 , 13 ] [ 4 , 13 ] [ 3 ] [ 3 ] [ 3 ] [ 3 ] [ 4 , 10 , 11 ] [ 4 , 10 ] [ 11 ] [ 4 , 6 , 10 ] [ 6 , 10 ] [ 11 , 13 ] [ 13 ] [ 11 , 13 ] [ 11 , 13 ] [ 11 , 13 ] ],
J D i k = [ [ 3 , 5 , 8 , 9 , 11 , 12 ] [ 8 , 9 , 12 ] [ 2 , 3 , 4 , 7 , 8 ] [ 3 , 7 , 8 , 12 ] [ 7 , 8 ] [ 1 , 2 , 4 , 6 , 10 ] [ 2 , 9 ] [ 2 , 4 , 6 , 7 , 8 , 10 ] [ 2 , 6 , 7 , 8 , 12 ] [ 2 , 6 , 7 , 8 ] [ 1 , 2 , 5 , 6 , 7 , 10 , 11 ] [ 1 , 5 , 7 , 8 , 10 , 11 , 12 , 13 ] [ 1 , 2 , 5 , 6 , 7 , 8 , 10 ] [ 1 , 2 , 3 , 5 , 6 , 7 , 8 , 12 ] [ 6 , 7 , 8 , 10 ] [ 1 , 9 , 11 , 12 , 13 ] [ 1 , 5 , 9 , 11 , 12 ] [ 9 , 11 , 12 ] [ 11 , 12 ] [ 8 , 12 ] [ 1 , 2 , 6 , 9 , 13 ] [ 1 , 5 , 9 , 11 , 13 ] [ 9 ] [ 1 , 2 , 3 , 7 , 8 , 9 , 13 ] [ 7 , 8 , 9 ] [ 1 , 2 , 3 , 4 , 5 , 9 , 10 , 12 ] [ 1 , 3 , 4 , 5 , 9 , 10 , 11 , 12 ] [ 1 , 2 , 4 , 9 , 12 ] [ 1 , 2 , 4 , 5 , 6 , 7 , 9 , 10 ] [ 1 , 2 , 3 , 4 , 5 , 12 ] ]
J D i k = [ [ 5 ] [ 5 ] [ 3 ] [ 10 ] ],
J i k = [ [ 1 , 2 , 3 , 4 , 5 , 6 , 7 , 8 , 9 , 10 , 11 , 12 , 13 ] [ 7 ] [ 7 ] [ 1 , 2 , 3 , 4 , 5 , 6 , 7 , 8 , 9 , 10 , 11 , 12 , 13 ] [ 6 ] [ 6 ] [ 1 , 2 , 3 , 4 , 5 , 6 , 7 , 8 , 9 , 10 , 11 , 12 , 13 ] [ 5 ] [ 1 , 2 , 3 , 4 , 5 , 6 , 7 , 8 , 9 , 10 , 11 , 12 , 13 ] [ 5 ] [ 5 ] [ 1 , 2 , 3 , 4 , 5 , 6 , 7 , 8 , 9 , 10 , 11 , 12 , 13 ] [ 5 ] [ 1 , 2 , 3 , 4 , 5 , 6 , 7 , 8 , 9 , 10 , 11 , 12 , 13 ] ],
ω = ( w c , w c , w c , w D , w D , w D , w J = ) = ( 1 , 0.9 , 0.8 , 1 , 0.9 , 0.8 , 0.7 )

References

  1. BP p.l.c. BP Statistical Review of World Energy. Available online: http://www.bp.com/content/dam/bp/business-sites/en/global/corporate/pdfs/energy-economics/statistical-review/bp-stats-review-2019-full-report.pdf/ (accessed on 29 October 2019).
  2. Ming, Z.; Ximei, L.; Yulong, L.; Lilin, P. Review of renewable energy investment and financing in China: Status, mode, issues and countermeasures. Renew. Sustain. Energy Rev. 2014, 31, 23–37. [Google Scholar] [CrossRef]
  3. National Bureau of Statistics PRC Statistical yearbook of China; China Statistical Publishing House: Beijing, China, 2018.
  4. Strantzali, E.; Aravossis, K. Decision making in renewable energy investments: A review. Renew. Sustain. Energy Rev. 2016, 55, 885–898. [Google Scholar] [CrossRef]
  5. Kumar, A.; Sah, B.; Singh, A.R.; Deng, Y.; He, X.; Kumar, P.; Bansal, R.C. A review of multi criteria decision making (MCDM) towards sustainable renewable energy development. Renew. Sustain. Energy Rev. 2017, 69, 596–609. [Google Scholar] [CrossRef]
  6. Khan, M.I. Evaluating the strategies of compressed natural gas industry using an integrated SWOT and MCDM approach. J. Clean. Prod. 2018, 172, 1035–1052. [Google Scholar] [CrossRef]
  7. Kazancoglu, Y.; Ozturkoglu, Y. Integrated framework of disassembly line balancing with Green and business objectives using a mixed MCDM. J. Clean. Prod. 2018, 191, 179–191. [Google Scholar] [CrossRef]
  8. Florindo, T.J.; Florindo, G.D.M.; Talamini, E.; da Costa, J.S.; de Léis, C.M.; Tang, W.Z.; Schultz, G.; Kulay, L.; Pinto, A.T.; Ruviaro, C.F. Application of the multiple criteria decision-making (MCDM) approach in the identification of Carbon Footprint reduction actions in the Brazilian beef production chain. J. Clean. Prod. 2018, 196, 1379–1389. [Google Scholar] [CrossRef]
  9. Kaya, T.; Kahraman, C. Multicriteria renewable energy planning using an integrated fuzzy VIKOR & AHP methodology: The case of Istanbul. Energy 2010, 35, 2517–2527. [Google Scholar]
  10. Amer, M.; Daim, T.U. Selection of renewable energy technologies for a developing county: A case of Pakistan. Energy Sustain. Dev. 2011, 15, 420–435. [Google Scholar] [CrossRef]
  11. Çolak, M.; Kaya, İ. Prioritization of renewable energy alternatives by using an integrated fuzzy MCDM model: A real case application for Turkey. Renew. Sustain. Energy Rev. 2017, 80, 840–853. [Google Scholar] [CrossRef]
  12. Ahmad, S.; Nadeem, A.; Akhanova, G.; Houghton, T.; Muhammad-Sukki, F. Multi-criteria evaluation of renewable and nuclear resources for electricity generation in Kazakhstan. Energy 2017, 141, 1880–1891. [Google Scholar] [CrossRef]
  13. Tasri, A.; Susilawati, A. Selection among renewable energy alternatives based on a fuzzy analytic hierarchy process in Indonesia. Sustain. Energy Technol. Assess. 2014, 7, 34–44. [Google Scholar] [CrossRef]
  14. Nigim, K.; Munier, N.; Green, J. Pre-feasibility MCDM tools to aid communities in prioritizing local viable renewable energy sources. Renew. Energy 2004, 29, 1775–1791. [Google Scholar] [CrossRef]
  15. Chatzimouratidis, A.I.; Pilavachi, P.A. Technological, economic and sustainability evaluation of power plants using the Analytic Hierarchy Process. Energy Policy 2009, 37, 778–787. [Google Scholar] [CrossRef]
  16. Kahraman, C.; Ihsan, K.; Cebi, S. A comparative analysis for multiattribute selection among renewable energy alternatives using fuzzy axiomatic design and fuzzy analytic hierarchy process. Energy 2009, 34, 1603–1616. [Google Scholar] [CrossRef]
  17. Ahmad, S.; Tahar, R.M. Selection of renewable energy sources for sustainable development of electricity generation system using analytic hierarchy process: A case of Malaysia. Renew. Energy 2014, 63, 458–466. [Google Scholar] [CrossRef]
  18. Štreimikienė, D.; Šliogerienė, J.; Turskis, Z. Multi-criteria analysis of electricity generation technologies in Lithuania. Renew. Energy 2016, 85, 148–156. [Google Scholar] [CrossRef]
  19. Dvořák, P.; Martinát, S.; Van der Horst, D.; Frantál, B.; Turečková, K. Renewable energy investment and job creation; a cross-sectoral assessment for the Czech Republic with reference to EU benchmarks. Renew. Sustain. Energy Rev. 2017, 69, 360–368. [Google Scholar] [CrossRef]
  20. Şengül, Ü.; Eren, M.; Shiraz, S.E.; Gezder, V.; Şengül, A.B. Fuzzy TOPSIS method for ranking renewable energy supply systems in Turkey. Renew. Energy 2015, 75, 617–625. [Google Scholar] [CrossRef]
  21. Sadeghi, A.; Larimian, T.; Molabashi, A. Evaluation of renewable energy sources for generating electricity in province of Yazd: A fuzzy MCDM approach. Procedia-Soc. Behav. Sci. 2012, 62, 1095–1099. [Google Scholar] [CrossRef]
  22. Benayoun, R.; Roy, B.; Sussman, B. ELECTRE: Une méthode pour guider le choix en présence de points de vue multiples. Note Trav. 1966, 49. Available online: https://www.scirp.org/(S(351jmbntvnsjt1aadkposzje))/reference/ReferencesPapers.aspx?ReferenceID=2519107 (accessed on 29 October 2019).
  23. Govindan, K.; Jepsen, M.B. ELECTRE: A comprehensive literature review on methodologies and applications. Eur. J. Oper. Res. 2016, 250, 1–29. [Google Scholar] [CrossRef]
  24. Roy, B.; Bertier, P. La méthode ELECTRE II Note Trav. 142Dir.; Groupe Metra: Paris, France, 1971. [Google Scholar]
  25. Roy, B. ELECTRE III: Un algorithme de classements fondé sur une représentation floue des préférences en présence de critères multiples. Cah. CERO 1978, 20, 3–24. [Google Scholar]
  26. Roy, B.; Hugonnard, J.-C. Ranking of suburban line extension projects on the Paris metro system by a multicriteria method. Transp. Res. Part Gen. 1982, 16, 301–312. [Google Scholar] [CrossRef]
  27. Yu, W. ELECTRE TRI(aspects méthodologiques et manuel d’utilisation); Document du LAMSADEE; Université de Paris–Dauphine: Paris, France, 1992. [Google Scholar]
  28. Roy, B.; Bouyssou, D. Aide multicritère à la décision: Méthodes et Cas; Economica Paris: Paris, France, 1993; ISBN 2-7178-2473-1. [Google Scholar]
  29. Haralambopoulos, D.; Polatidis, H. Renewable energy projects: Structuring a multi-criteria group decision-making framework. Renew. Energy 2003, 28, 961–973. [Google Scholar] [CrossRef]
  30. Troldborg, M.; Heslop, S.; Hough, R.L. Assessing the sustainability of renewable energy technologies using multi-criteria analysis: Suitability of approach for national-scale assessments and associated uncertainties. Renew. Sustain. Energy Rev. 2014, 39, 1173–1184. [Google Scholar] [CrossRef]
  31. Neves, L.P.; Martins, A.G.; Antunes, C.H.; Dias, L.C. A multi-criteria decision approach to sorting actions for promoting energy efficiency. Energy Policy 2008, 36, 2351–2363. [Google Scholar] [CrossRef]
  32. Papadopoulos, A.; Karagiannidis, A. Application of the multi-criteria analysis method Electre III for the optimisation of decentralised energy systems. Omega 2008, 36, 766–776. [Google Scholar] [CrossRef]
  33. Catalina, T.; Virgone, J.; Blanco, E. Multi-source energy systems analysis using a multi-criteria decision aid methodology. Renew. Energy 2011, 36, 2245–2252. [Google Scholar] [CrossRef]
  34. Beccali, M.; Cellura, M.; Mistretta, M. Decision-making in energy planning. Application of the Electre method at regional level for the diffusion of renewable energy technology. Renew. Energy 2003, 28, 2063–2087. [Google Scholar]
  35. Polatidis, H.; Haralambidou, K.; Haralambopoulos, D. Multi-criteria decision analysis for geothermal energy: A comparison between the ELECTRE III and the PROMETHEE II methods. Energy Sources Part B Econ. Plan. Policy 2015, 10, 241–249. [Google Scholar] [CrossRef]
  36. Sánchez-Lozano, J.M.; Antunes, C.H.; García-Cascales, M.S.; Dias, L.C. GIS-based photovoltaic solar farms site selection using ELECTRE-TRI: Evaluating the case for Torre Pacheco, Murcia, Southeast of Spain. Renew. Energy 2014, 66, 478–494. [Google Scholar] [CrossRef]
  37. Jun, D.; Tian-tian, F.; Yi-sheng, Y.; Yu, M. Macro-site selection of wind/solar hybrid power station based on ELECTRE-II. Renew. Sustain. Energy Rev. 2014, 35, 194–204. [Google Scholar] [CrossRef]
  38. Sánchez-Lozano, J.; García-Cascales, M.; Lamata, M. Comparative TOPSIS-ELECTRE TRI methods for optimal sites for photovoltaic solar farms. Case study in Spain. J. Clean. Prod. 2016, 127, 387–398. [Google Scholar] [CrossRef]
  39. Mousavi, M.; Gitinavard, H.; Mousavi, S. A soft computing based-modified ELECTRE model for renewable energy policy selection with unknown information. Renew. Sustain. Energy Rev. 2017, 68, 774–787. [Google Scholar] [CrossRef]
  40. Wu, Y.; Zhang, J.; Yuan, J.; Geng, S.; Zhang, H. Study of decision framework of offshore wind power station site selection based on ELECTRE-III under intuitionistic fuzzy environment: A case of China. Energy Convers. Manag. 2016, 113, 66–81. [Google Scholar] [CrossRef]
  41. Zhang, L.; Xu, X.; Tao, L. Some similarity measures for triangular fuzzy number and their applications in multiple criteria group decision-making. J. Appl. Math. 2013, 2013, 1–7. [Google Scholar] [CrossRef]
  42. Liang, X.; Guo, T.; Meng, X. A method on macroscopic traffic safety evaluation based on weighting triangular fuzzy number algorithm. J. Transp. Inf. Saf. 2017, 35, 20–28. [Google Scholar]
  43. Chen, N.; Xu, Z.; Xia, M. Interval-valued hesitant preference relations and their applications to group decision making. Knowl.-Based Syst. 2013, 37, 528–540. [Google Scholar] [CrossRef]
  44. Szmidt, E.; Kacprzyk, J. Distances between intuitionistic fuzzy sets. Fuzzy Sets Syst. 2000, 114, 505–518. [Google Scholar] [CrossRef]
  45. McElroy, M.B.; Lu, X.; Nielsen, C.P.; Wang, Y. Potential for wind-generated electricity in China. Science 2009, 325, 1378–1380. [Google Scholar] [CrossRef]
  46. Nazir, M.S.; Mahdi, A.J.; Bilal, M.; Sohail, H.M.; Ali, N.; Iqbal, H.M. Iqbal Environmental impact and pollution-related challenges of renewable wind energy paradigm—A review. Sci. Total Environ. 2019, 683, 436–444. [Google Scholar] [CrossRef]
  47. China Renewable Energy Development Report; National Development and Reform Commission (NDRC): Beijing, China, 2006.
  48. Li, K.; Fan, H.N. Regional analysis of China’s terrestrial solar resource development potential. Prog. Geogr. 2010, 9, 27–32. [Google Scholar]
  49. Zhou, D. The Overview of Geothermal Power Generation. Electr. Power Surv. 2003, 3, 1–6. [Google Scholar]
  50. Grid-Connected Operation of Photovoltaic Power Generation in 2019; National Energy Administration: Beijing, China, 2020.
  51. Solar energy and the environment-U.S. Energy Information Administration (EIA). Available online: https://www.eia.gov/energyexplained/solar/solar-energy-and-the-environment.php (accessed on 2 June 2020).
  52. Zhang, D.; Wang, J.; Lin, Y.; Si, Y.; Huang, C.; Yang, J.; Huang, B.; Li, W. Present situation and future prospect of renewable energy in China. Renew. Sustain. Energy Rev. 2017, 76, 865–871. [Google Scholar] [CrossRef]
  53. Huang, H.; Yan, Z. Present situation and future prospect of hydropower in China. Renew. Sustain. Energy Rev. 2009, 13, 1652–1656. [Google Scholar] [CrossRef]
  54. Chang, X.; Liu, X.; Zhou, W. Hydropower in China at present and its further development. Energy 2010, 35, 4400–4406. [Google Scholar] [CrossRef]
  55. Hydropower and the environment-U.S. Energy Information Administration (EIA). Available online: https://www.eia.gov/energyexplained/hydropower/hydropower-and-the-environment.php (accessed on 2 June 2020).
  56. National Energy Administration. The 12th five-year plan for biomass energy development. Available online: http://zfxxgk.nea.gov.cn/auto87/201212/t20121228_1568.htm/ (accessed on 2 June 2020).
  57. Jiaxin He; Runqing Zhu; Boqiang Lin Prospects, obstacles and solutions of biomass power industry in China. J. Clean. Prod. 2019, 237, 117783. [CrossRef]
  58. Saxena, R.C.; Adhikari, D.K.; Goyal, H.B. Biomass-based Energy Fuel Through Biochemical Routes: A Review. Renew. Sustain. Energy Rev. 2009, 13, 156–167. [Google Scholar] [CrossRef]
  59. Vamvuka, D.; Kakaras, E. Ash properties and environmental impact of various biomass and coal fuels and their blends. Fuel Process. Technol. 2011, 92, 570–581. [Google Scholar] [CrossRef]
  60. Ling-zhen, K. Development Trend of Geothermal Energy Resource in China. Coal Technol. 2006, 7, 067. [Google Scholar]
  61. Liu, W.; Lund, H.; Mathiesen, B.V.; Zhang, X. Potential of renewable energy systems in China. Appl. Energy 2011, 88, 518–525. [Google Scholar] [CrossRef]
  62. Ármannsson, H.; Kristmannsdóttir, H. Geothermal environmental impact. Geothermics 1992, 21, 869–880. [Google Scholar] [CrossRef]
  63. Kabak, M.; Dağdeviren, M. Prioritization of renewable energy sources for Turkey by using a hybrid MCDM methodology. Energy Convers. Manag. 2014, 79, 25–33. [Google Scholar] [CrossRef]
  64. Chen, H. Optimizing Sichuan Clean Energy Delivery by Hydro/Wind Power Complementation. Electr. Power 2017, 50, 37–43. [Google Scholar] [CrossRef]
  65. Liu, Y.; Sun, C.; Xia, B.; Cui, C.; Coffey, V. Impact of community engagement on public acceptance towards waste-to-energy incineration projects: Empirical evidence from China. Waste Manag. 2018, 76, 431–442. [Google Scholar] [CrossRef] [PubMed]
  66. Y, Q. Studies on the Mid—term Evaluation of the Hydropower Development in China during the 13thFive—Year Plan; Chinese Academy of Sciences, Institute of Resources and Environmental Policy: Beijing, China, 2018. [Google Scholar]
  67. Dong, S. Evaluation Center of the State Council. China Geothermal Energy Development Report (2018); China Geological Survey, Ministry of Natural Resources, Department of New Energy and Renewable Resources; National Energy Administration, Institute of Science and Technology Strategy Consulting; Chinese Academy of Sciences, Institute of Resources and Environmental Policy: Beijing, China, 2018. [Google Scholar]
  68. Al Garni, H.; Kassem, A.; Awasthi, A.; Komljenovic, D.; Al-Haddad, K. A multicriteria decision making approach for evaluating renewable power generation sources in Saudi Arabia. Sustain. Energy Technol. Assess. 2016, 16, 137–150. [Google Scholar] [CrossRef]
  69. Stein, E.W. A comprehensive multi-criteria model to rank electric energy production technologies. Renew. Sustain. Energy Rev. 2013, 22, 640–654. [Google Scholar] [CrossRef]
  70. Wu, C.; Zhou, Z.; Ma, L.; Yin, X. Comparative study on biomass power generation technologies. Kezaisheng NengyuanRenewable Energy Resour. 2008, 26, 34–37. [Google Scholar]
  71. Dong, S. Evaluation of Investment Economic Benefit of XY Thermal Power Plant 2 × 350MW Construction Project. Master’s Thesis, Jilin University, Changchun, China, 2015. [Google Scholar]
  72. Coskun, A.; Bolatturk, A.; Kanoglu, M. Thermodynamic and economic analysis and optimization of power cycles for a medium temperature geothermal resource. Energy Convers. Manag. 2014, 78, 39–49. [Google Scholar] [CrossRef]
  73. Reddy, V.S.; Kaushik, S.; Tyagi, S. Exergetic analysis and performance evaluation of parabolic trough concentrating solar thermal power plant (PTCSTPP). Energy 2012, 39, 258–273. [Google Scholar] [CrossRef]
  74. Amponsah, N.Y.; Troldborg, M.; Kington, B.; Aalders, I.; Hough, R.L. Greenhouse gas emissions from renewable energy sources: A review of lifecycle considerations. Renew. Sustain. Energy Rev. 2014, 39, 461–475. [Google Scholar] [CrossRef]
Figure 1. Primary energy supply and composition in China [3].
Sustainability 12 04649 g001
Figure 2. Electricity generation profile in China (2000–2018) [3].
Sustainability 12 04649 g002
Figure 3. Memberships function of triangular fuzzy number (TFN).
Sustainability 12 04649 g003
Figure 4. Calculation of the probability degree.
Sustainability 12 04649 g004
Figure 5. Flowchart for the decision-making problem.
Sustainability 12 04649 g005
Figure 6. The hierarchical structure for evaluation in this paper.
Sustainability 12 04649 g006
Figure 7. Weights of the main criteria.
Sustainability 12 04649 g007
Figure 8. Priority relationship diagram of the renewable energy alternatives.
Sustainability 12 04649 g008
Table 1. Selected criteria for renewable energy alternatives.
Main CriteriaSubcriteriaUnitCriteria TypeThe Principal of EvaluationRelated Reference
Prioritization of Renewable energy alternativesTechnical APotential total power generation A1TWh/yMaximize The potential amount of the renewable generation per year.[13]
Technical efficiency A2%MaximizeThe ratio of output electrical energy to input energy specifically.[11,18,20,62]
Reliability A3-MaximizeThe continuity of electricity supply and the predictability of the specific renewable power generation technology.[13,20,63]
Technology Maturity A4-MaximizeState-of-the-art of technology.[13,18,20,63]
Distance to User A5-MinimizeDistance between renewable energy and users.[16,64]
Economic BLevelized energy cost B1Pound / MWhMinimizeAll the costs over the renewable energy system’s lifespan.[13,63]
Service period B2YearMaximizeThe average useful life of renewable energy power generation.[63,65]
Payback period B3YearMinimizeThe time that is necessary to reach the break-even point and compensate the original cost of renewable energy investment.[63,65]
Environmental CLand use C1M2/kwMinimizeThe average land area required for the renewable technology.[13,18,63,64,66]
Greenhouse gas emissions C2gCO2eq/kWhMinimizeThe life-cycle greenhouse gas emissions from the renewable technology.[13,18,63]
Environment damage C3-MinimizeThe impairment of renewable energy generation to the environment.[10,18,63]
Social DLabor impact D1Jobs/MWMaximizeNumber of jobs provided or driven by renewable technology.[18,29,63,64,66]
Social acceptability D2-MaximizeCivil acceptance or attitude towards renewable energy projects.[13,18,20,29,63,64,66]
Table 2. Triangular fuzzy judgment matrix of the main criteria.
ABCD
A ( 0.5 ; 0.5 ; 0.5 ) ( 0.5 ; 0.6 ; 0.7 ) ( 0.6 ; 0.7 ; 0.8 ) ( 0.6 ; 0.8 ; 0.9 )
B ( 0.3 ; 0.4 ; 0.5 ) ( 0.5 ; 0.5 ; 0.5 ) ( 0.5 ; 0.6 ; 0.7 ) ( 0.5 ; 0.6 ; 0.7 )
C ( 0.2 ; 0.3 ; 0.4 ) ( 0.3 ; 0.4 ; 0.5 ) ( 0.5 ; 0.5 ; 0.5 ) ( 0.6 ; 0.7 ; 0.8 )
D ( 0.1 ; 0.2 ; 0.4 ) ( 0.3 ; 0.4 ; 0.5 ) ( 0.2 ; 0.3 ; 0.4 ) ( 0.5 ; 0.5 ; 0.5 )
Table 3. Triangular fuzzy judgment matrix of the subcriteria under the main criterion “technology” M1.
A1A2A3A4A5
A1 ( 0.5 ; 0.5 ; 0.5 ) ( 0.4 ; 0.6 ; 0.7 ) ( 0.3 ; 0.4 ; 0.5 ) ( 0.2 ; 0.4 ; 0.5 ) ( 0.5 ; 0.6 ; 0.7 )
A2 ( 0.3 ; 0.4 ; 0.6 ) ( 0.5 ; 0.5 ; 0.5 ) ( 0.2 ; 0.4 ; 0.5 ) ( 0.2 ; 0.3 ; 0.4 ) ( 0.4 ; 0.5 ; 0.6 )
A3 ( 0.5 ; 0.6 ; 0.7 ) ( 0.5 ; 0.6 ; 0.8 ) ( 0.5 ; 0.5 ; 0.5 ) ( 0.3 ; 0.4 ; 0.6 ) ( 0.6 ; 0.7 ; 0.8 )
A4 ( 0.5 ; 0.6 ; 0.8 ) ( 0.6 ; 0.7 ; 0.8 ) ( 0.4 ; 0.6 ; 0.7 ) ( 0.5 ; 0.5 ; 0.5 ) ( 0.5 ; 0.7 ; 0.8 )
A5 ( 0.3 ; 0.4 ; 0.5 ) ( 0.4 ; 0.5 ; 0.6 ) ( 0.2 ; 0.3 ; 0.4 ) ( 0.2 ; 0.3 ; 0.5 ) ( 0.5 ; 0.5 ; 0.5 )
Table 4. Triangular fuzzy judgment matrix of the subcriteria under the main criterion “economy” M2.
B1B2B3
B1 ( 0.5 ; 0.5 ; 0.5 ) ( 0.6 ; 0.8 ; 0.9 ) ( 0.6 ; 0.7 ; 0.8 )
B2 ( 0.1 ; 0.2 ; 0.4 ) ( 0.5 ; 0.5 ; 0.5 ) ( 0.3 ; 0.4 ; 0.5 )
B3 ( 0.2 ; 0.3 ; 0.4 ) ( 0.5 ; 0.6 ; 0.7 ) ( 0.5 ; 0.5 ; 0.5 )
Table 5. Triangular fuzzy judgment matrix of the subcriteria under the main criterion “environment” M3.
C1C2C3
C1 ( 0.5 ; 0.5 ; 0.5 ) ( 0.3 ; 0.4 ; 0.5 ) ( 0.3 ; 0.5 ; 0.6 )
C2 ( 0.5 ; 0.6 ; 0.7 ) ( 0.5 ; 0.5 ; 0.5 ) ( 0.4 ; 0.6 ; 0.7 )
C3 ( 0.4 ; 0.5 ; 0.7 ) ( 0.3 ; 0.4 ; 0.6 ) ( 0.5 ; 0.5 ; 0.5 )
Table 6. Triangular fuzzy judgment matrix of the subcriteria under the main criterion “society” M4.
D1D2
D1 ( 0.5 ; 0.5 ; 0.5 ) ( 0.5 ; 0.6 ; 0.7 )
D2 ( 0.3 ; 0.4 ; 0.5 ) ( 0.5 ; 0.5 ; 0.5 )
Table 7. Probability matrix of main criteria.
ABCD
A1111
B0.6606 111
C0.5120 2.2482 11
D0.1763 0.4619 0.6072 1
Table 8. Global weights of subcriteria.
Main CriteriaWeightsSubcriteriaLocal WeightsGlobal Weights
Technical(A)0.4257 Potential total power generation(A1)0.1987 0.0846
Technical efficiency(A2)0.1486 0.0633
Reliability(A3)0.2424 0.1032
Technology Maturity(A4)0.2760 0.1175
Distance to User(A5)0.1342 0.0572
Economic(B)0.2812 Levelized energy cost(B1)0.6307 0.1774
Service period(B2)0.1084 0.0305
Payback period(B3)0.2610 0.0734
Environmental
(C)
0.2180 Land use(C1)0.2637 0.0575
Greenhouse gas emissions(C2)0.3682 0.0802
Environment damage(C3)0.3682 0.0802
Social(D)0.0750 Labor impact(D1)0.6656 0.0499
Social acceptability(D2)0.3344 0.0251
Table 9. Original data.
SubcriteriaUnitWindSolar PVSolar ThermalHydroBiomassGeothermalReference
Potential total power generation(A1)TWh/y-
247,000
1296–
6480
575–28762474
–6083
1532–26967.12[61,67]
Technical efficiency(A2)%359.5–12218014–3511.4[68,69,70]
Reliability(A3)-(0.5,0.7)
(0.6,0.7)
(0.5,0.8)
(0.6,0.8)
(0.7,0.8)
(0.6,0.7)
(0.2,0.4)
(0.3,0.4)
(0.4,0.5)
(0.8,1)
(0.9,0.1)
(0.8,0.9)
(0.6,0,8)
(0.7,0.9)
(0.5,0.7)
(0.5,0.8)
(0.6,0.7)
(0.4,0.5)
EA
Technology Maturity(A4)-(0.7,0.8)
(0.7,0.8)
(0.8,0.9)
(0.6,0.8)
(0.7,0.9)
(0.7,0.9)
(0.2,0.4)
(0.3,0.4)
(0.5,0.6)
(0.8,1)
(0.8,0.9)
(0.9,1)
(0.4,0.7)
(0.6,0.7)
(0.5,0.6)
(0.2,0.4)
(0.3,0.5)
(0.3,0.4)
EA
Distance to User(A5)-(0.6,0.7)
(0.7,0.8)
(0.8,0.9)
(0.7,0.8)
(0.7,0.9)
(0.8,1)
(0.2,0.3)
(0.2,0.4)
(0.3,0.4)
(0.6,0.8)
(0.7,0.8)
(0.7,0.8)
(0.7,0.9)
(0.6,0.8)
(0.7,0.8)
(0.2,0.4)
(0.3,0.4)
(0.2,0.3)
EA
Levelized energy cost(B1)Yuan/ MWhOnshore: 44–211; Offshore:
70–1091
79–2639264–132018–660Dedicated biomass: 123–5719; Energy from waste: 853–879897–686[30]
Service period(B2)Year20–3020–3010–3040–10025–4520–60[71,72]
Payback period(B3)Year13–167–138–125–106–9.54–9[22]
Land use(C1)m2/kW10–120010–50010–10010–65001000–600020–1000[14,73]
Greenhouse gas emissions(C2)gCO2eq/kWhOnshore: 5–24;
Offshore: 8–124
9–30030–1502–75Dedicated biomass: 14–650; Energy from waste: 97–100011–78[74]
Environment damage(C3) -(0.7,0.9)
(0.6,0.7)
(0.6,0.8)
(0.6,0.7)
(0.7,0.9)
(0.8,0.9)
(0.6,0.8)
(0.5,0.6)
(0.6,0.7)
(0.3,0.6)
(0.4,0.5)
(0.3,0.5)
(0.5,0.6)
(0.5,0.7)
(0.6,0.7)
(0.4,0.8)
(0.2,0.6)
(0.4,0.5)
EA
Labor impact(D1)Jobs/MW0.9–4.00.7–250.2–5.00.9–1.211.2–19.80.25–2.5[19]
Social acceptability(D2)-(0.7,0.8)
(0.8,0.9)
(0.8,0.9)
(0.6,0.7)
(0.7,0.9)
(0.8,0.9)
(0.6,0.7)
(0.7,0.9)
(0.5,0.7)
(0.6,0.8)
(0.7,0.8)
(0.6,0.9)
(0.4,0.6)
(0.7,0.8)
(0.6,0.9)
(0.4,0.6)
(0.5,0.7)
(0.3,0.5)
EA
Table 10. Standardized table.
SubcriteriaWindSolar PVSolar Thermal PowerHydroBiomassGeothermal
Potential total power generation(A1)(0.03,1)(0.01,0.03)(0,0.01)(0.01,0.02)(0.01,0.01)(0.000029, 0.000029)
Technical efficiency(A2)(0.44,0.44)(0.12,0.15)(0.26,0.26)(1.0,1.0)(0.18,0.44)(0.14,0.14)
Reliability(A3)(0.5,0.7)
(0.6,0.7)
(0.5,0.8)
(0.6,0.8)
(0.7,0.8)
(0.6,0.7)
(0.2,0.4)
(0.3,0.4)
(0.4,0.5)
(0.8,1)
(0.9,0.1)
(0.8,0.9)
(0.6,0,8)
(0.7,0.9)
(0.5,0.7)
(0.5,0.8)
(0.6,0.7)
(0.4,0.5)
Technology Maturity(A4)(0.7,0.8)
(0.7,0.8)
(0.8,0.9)
(0.6,0.8)
(0.7,0.9)
(0.7,0.9)
(0.2,0.4)
(0.3,0.4)
(0.5,0.6)
(0.8,1)
(0.8,0.9)
(0.9,1)
(0.4,0.7)
(0.6,0.7)
(0.5,0.6)
(0.2,0.4)
(0.3,0.5)
(0.3,0.4)
Distance to User(A5)(0.6,0.7)
(0.7,0.8)
(0.8,0.9)
(0.7,0.8)
(0.7,0.9)
(0.8,1)
(0.2,0.3)
(0.2,0.4)
(0.3,0.4)
(0.6,0.8)
(0.7,0.8)
(0.7,0.8)
(0.7,0.9)
(0.6,0.8)
(0.7,0.8)
(0.2,0.4)
(0.3,0.4)
(0.2,0.3)
Levelized energy cost(B1)(0.05,0.2)
(0.08,0.4)
(0.02,0.2)(0.02,0.2)(0.08,1)(0.04,0.2)
(0.06,0.25)
(0.05,1)
Service period(B2)(0.2,0.3)(0.2,0.3)(0.1,0.3)(0.4,1)(0.25,0.45)(0.2,0.6)
Payback period(B3)(0.25,0.31)(0.31,0.57)(0.33,0.5)(0.4,0.8)(0.42,0.67)(0.44,1)
Land use(C1)(0.01,1)(0.02,1)(0.1,1)(0,1)(0.002,0.01)(0.01,0.5)
Greenhouse gas emissions(C2)(0.08,0.4)
(0.02,0.25)
(0.01,0.22)(0.01,0.07)(0.03,1)(0, 0.14)
(0, 0.02)
(0.03,0.18)
Environment damage(C3) (0.7,0.9)
(0.6,0.7)
(0.6,0.8)
(0.6,0.7)
(0.7,0.9)
(0.8,0.9)
(0.6,0.8)
(0.5,0.6)
(0.6,0.7)
(0.3,0.6)
(0.4,0.5)
(0.3,0.5)
(0.5,0.6)
(0.5,0.7)
(0.6,0.7)
(0.4,0.8)
(0.2,0.6)
(0.4,0.5)
Labor impact(D1)(0.04,0.16)(0.03,1)(0.01,0.2)(0.04,0.05)(0.45,0.79)(0.01,0.1)
Social acceptability(D2)(0.7,0.8)
(0.8,0.9)
(0.8,0.9)
(0.6,0.7)
(0.7,0.9)
(0.8,0.9)
(0.6,0.7)
(0.7,0.9)
(0.5,0.7)
(0.6,0.8)
(0.7,0.8)
(0.6,0.9)
(0.4,0.6)
(0.7,0.8)
(0.6,0.9)
(0.4,0.6)
(0.5,0.7)
(0.3,0.5)