Building a Composite Indicator to Measure Environmental Sustainability Using Alternative Weighting Methods


Abstract
1. Introduction
- Environmental sustainability. Sustainable agriculture must preserve biological biodiversity and the provision of ecosystem services. Thus, environmental sustainability can be defined as the ability to ensure greater agricultural productivity while simultaneously conserving natural resources and preventing the degradation of ecosystems.
- Economic sustainability. Sustainable agriculture must be economically viable, ensuring not only adequate profitability for farmers (the microeconomic level) but also a positive contribution to national/regional income (the macroeconomic level).
- Socio-cultural sustainability. Sustainable agriculture must be socially and culturally beneficial, i.e., it should ensure food security and the fair and equitable distribution of the wealth it generates, as well as contribute to the viability of rural communities.
2. Olive Farming in Spain: Environmental Sustainability Assessment
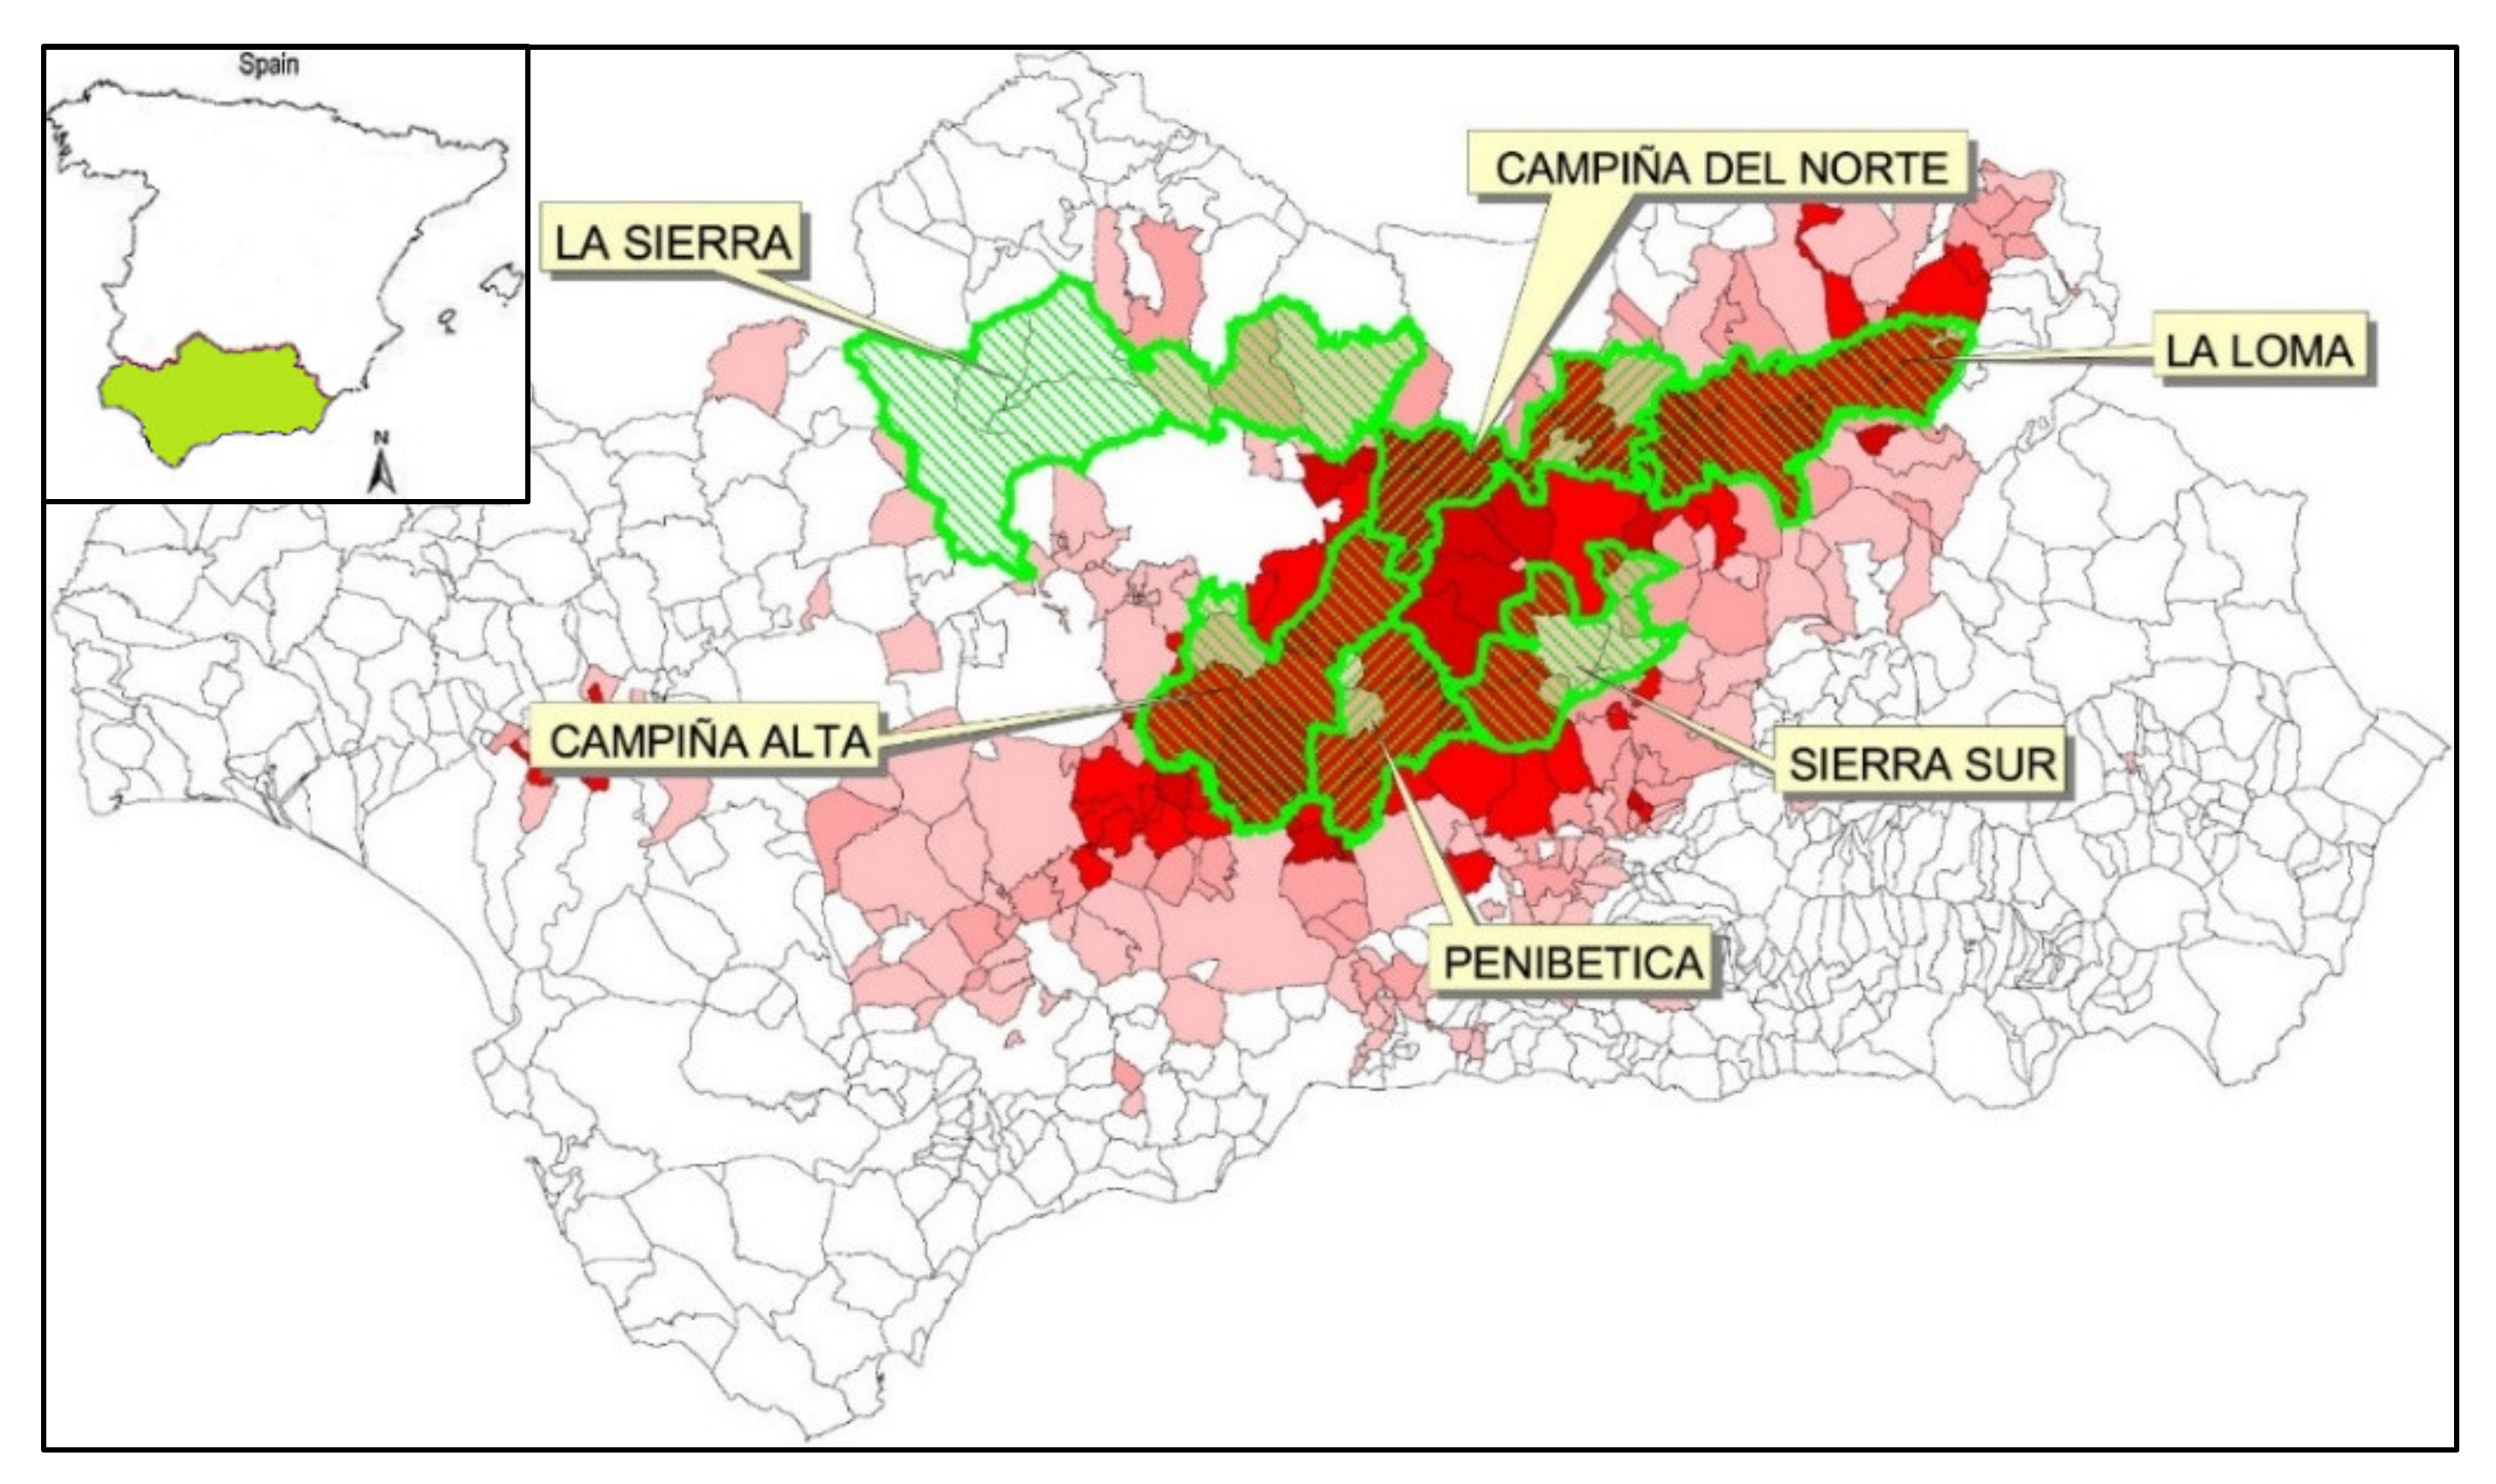
2.1. Recent Developments of Olive Groves in Spain
- Soil erosion. Erosion is the main environmental problem caused by this crop. The high soil erosion rates are due to the fact that more than 40% of all olive groves are located on land with unfavorable soil conditions for agricultural production (steep slopes, land particularly sensitive to erosion, or affected by frequent torrential rain), and that poor soil management by farmers has damaged natural vegetation cover (leading to farms with uncovered soils) [25]. This environmental impact has been aggravated in recent years by the expansion of olive groves into areas with especially adverse characteristics (steep slopes, extreme torrential rainfall, high erodibility of soils) [26].
- Loss of biodiversity. One of the main characteristics of olive groves in the 1980s (under traditional farming) was the high biodiversity associated with the crop, with olive being an example of a ‘high natural value’ agricultural system. The low-intensity olive farming (minimum use of agrochemicals) and the existence of old olive trees with semi-natural herbaceous vegetation located in areas with different land uses (vineyards, cereals, pastures, and Mediterranean forest) provided a varied habitat, where a large number of insects, birds, reptiles, and mammals found refuge. However, the extension (large olive monoculture areas where hedgerows, stone walls, and islands of shrubs and trees have been eliminated) and intensification of olive groves (disappearance of vegetable cover, intensive use of biocides, fertilizers and machinery, water pollution, and soil erosion) has changed this situation, leading to a reduction in both the number and diversity of animal species in olive grove systems [27,28].
- Non-point source water pollution. Modern olive growing has contributed to a decline in water quality due to the intense use of agrochemical products (mainly herbicides and fertilizers). This has resulted in non-point source water pollution problems in rivers, reservoirs and aquifers. Although in recent years some of the most polluting products widely used in olive farming (e.g., simazine and diuron) have been banned, water quality could be further improved by modifying some of the current olive farming practices [29].
- Overexploitation of water resources. Before the 1990s, most olive trees in Spain were rain-fed, but the intensification of the crop has seen the emergence of 800,000 hectares of irrigated olive groves. Although olive trees have low water requirements and are usually irrigated using highly efficient irrigation systems (water consumption using drip irrigation is around 1500 m3/ha·year), there is substantial pressure on water resources [30]. Increasing water extraction not only causes the overexploitation of water resources but also jeopardizes the ability to meet other water demands in basins with a higher degree of water scarcity [31].
2.2. Indicators Measuring Environmental Sustainability of Olive Farming
3. Building a Composite Indicator to Measure Environmental Sustainability
3.1. The Methodological Approach for Building Composite Indicators
- Indicator selection and data gathering. As explained in Section 2, an essential element of this kind of study is the selection of relevant AEIs based on strict quality criteria, and accurate data gathering to calculate the empirical values of these indicators. Given the huge number of possible indicators, the use of a solid theoretical framework is recommended; in this paper, the SAFE approach is applied.
- Normalization of indicators. Transforming indicators into dimensionless variables (normalization) is essential before they are weighted and aggregated, as they have usually been calculated using different units of measurement. To be able to compare them and perform arithmetic operations on them, they need to be expressed in homogeneous units within the same range. In our case, selecting from among the various normalization techniques available [40,41], we applied the min-max or re-scaling normalization, taking the reference values for each of the AEI considered as sustainability thresholds. Thus, the values of all the normalized indicators vary within a dimensionless range [0,1], where 0 is assigned to all cases where the AEI value is worse than or equal to an ‘unacceptable level of sustainability’ (i.e., the worst environmental performance) and 1 is assigned to all cases where the AEI value is better than or equal to a ‘desired level of sustainability’ (i.e., the best environmental performance).
- Weighting of indicators. Assigning weights enables us to identify the relative importance of the individual indicators. There are several valid procedures for weighting indicators, but the composite indicator may yield different results depending on the procedure used [42,43]. Therefore, the selection of a particular technique is a challenging task. The weighting techniques for constructing indices can be divided into ‘objective’ and ‘subjective’ ones [44]. With the former, weights are derived endogenously using statistical or mathematical procedures, such as principal components analysis (PCA), data envelopment analysis (DEA), the benefit of the doubt (BOD) approach or regression analysis (RA). With the latter, weights are determined exogenously on the basis of value judgments expressed by experts or decision-makers, as is the case with AHP, BWM, PA, budget allocation process (BAP) or conjoint analysis (CA). It is worth mentioning that environmental sustainability is a technical concept that requires scientific knowledge to define and measure, especially when it is applied to a specific ecosystem (in this case, olive groves in Spain). This justifies the use of exogenously determined weights in our case study, based on the opinion of experts on the environmental performance of olive groves. In particular, we have chosen AHP because it is the most commonly-applied technique among the subjective weighting methods available, BWM has been selected due to its novelty and the presumed advantages over AHP, and PA because it is an explicit and straightforward weighting method.
- Aggregation of indicators. The OECD and JRC [11] suggest several alternative functional forms that allow indicators to be aggregated, explaining their pros and cons. Depending on the aggregation method used to develop the indices, the results and the conclusions drawn from them may differ from case to case. Thus, the choice of the aggregation method is also subject to criticism relating to the shortcomings of the technique used [40,43,45]. The key issue when selecting a functional method of aggregating indicators is the compensability or marginal rate of substitution among indicators [18]: a) additive linear functions implicitly assume total compensability among indicators, b) multiplicative and geometric functions permit partial compensability, and c) non-compensatory functions assure non-compensability. In order to minimize the subjectivity regarding the method employed to build the composite indicator measuring environmental sustainability, the multicriteria function based on the distance to the ideal point measured by different metrics (i.e., different degrees of compensability) and developed by Díaz-Balteiro and Romero [46] has been chosen for implementation.
3.2. Alternative Techniques for Weighting Indicators
3.3. Data Collection for the Empirical Assessment of Environmental Sustainability
3.3.1. Farmer Survey
3.3.2. Expert Survey
4. Results
4.1. Indicator Weighting
4.1.1. Inter-rater Reliability
4.1.2. Multivariate Comparison of Weights from the Three Methods
4.2. Assessing the Environmental Performance of Irrigated Olive Farms
5. Conclusions
Author Contributions
Funding
Acknowledgments
Conflicts of Interest
References
- Hansen, J.W. Is agricultural sustainability a useful concept? Agric. Syst. 1996, 50, 117–143. [Google Scholar] [CrossRef]
- Pretty, J. Agricultural sustainability: Concepts, principles and evidence. Philos. Trans. R. Soc. B 2008, 363, 447–465. [Google Scholar] [CrossRef]
- Bockstaller, C.; Guichard, L.; Makowski, D.; Aveline, A.; Girardin, P.; Plantureux, S. Agri-environmental indicators to assess cropping and farming systems: A review. In Sustainable Agriculture; Lichtfouse, E., Navarrete, M., Debaeke, P., Véronique, S., Alberola, C., Eds.; Springer: Dordrecht, The Netherlands, 2009; pp. 725–738. [Google Scholar] [CrossRef]
- Lin, B.; Chen, X.; Yao, H.; Chen, Y.; Liu, M.; Gao, L.; James, A. Analyses of landuse change impacts on catchment runoff using different time indicators based on SWAT model. Ecol. Indic. 2015, 58, 55–63. [Google Scholar] [CrossRef]
- Maes, J.; Liquete, C.; Teller, A.; Erhard, M.; Paracchini, M.L.; Barredo, J.I.; Grizzetti, B.; Cardoso, A.; Somma, F.; Petersen, J.-E.; et al. An indicator framework for assessing ecosystem services in support of the EU Biodiversity Strategy to 2020. Ecosyst. Serv. 2016, 17, 14–23. [Google Scholar] [CrossRef]
- Mastrorilli, M.; Rana, G.; Verdiani, G.; Tedeschi, G.; Fumai, A.; Russo, G. Economic evaluation of hydrological ecosystem services in Mediterranean river basins applied to a case study in southern Italy. Water 2018, 10, 241. [Google Scholar] [CrossRef]
- Yli-Viikari, A.; Hietala-Koivu, R.; Huusela-Veistola, E.; Hyvönen, T.; Perälä, P.; Turtola, E. Evaluating agri-environmental indicators (AEIs)—Use and limitations of international indicators at national level. Ecol. Indic. 2007, 7, 150–163. [Google Scholar] [CrossRef]
- Piorr, H.-P. Environmental policy, agri-environmental indicators and landscape indicators. Agric. Ecosyst. Environ. 2003, 98, 17–33. [Google Scholar] [CrossRef]
- Sabiha, N.E.; Salim, R.; Rahman, S.; Rola-Rubzen, M.F. Measuring environmental sustainability in agriculture: A composite environmental impact index approach. J. Environ. Manag. 2016, 166, 84–93. [Google Scholar] [CrossRef]
- Seidel, C.; Heckelei, T.; Lakner, S. Conventionalization of organic farms in Germany: An empirical investigation based on a composite indicator approach. Sustainability 2019, 11, 2934. [Google Scholar] [CrossRef]
- OECD (Organization for Economic Co-operation and Development); JRC (Joint Research Centre). Handbook on Constructing Composite Indicators. Methodology and User Guide; OECD Publishing: Paris, France, 2008. [Google Scholar] [CrossRef]
- Dobbie, M.J.; Dail, D. Robustness and sensitivity of weighting and aggregation in constructing composite indices. Ecol. Indic. 2013, 29, 270–277. [Google Scholar] [CrossRef]
- Gan, X.; Fernandez, I.C.; Guo, J.; Wilson, M.; Zhao, Y.; Zhou, B.; Wu, J. When to use what: Methods for weighting and aggregating sustainability indicators. Ecol. Indic. 2017, 81, 491–502. [Google Scholar] [CrossRef]
- Becker, W.; Paruolo, P.; Saisana, M.; Saltelli, A. Weights and importance in composite indicators: Mind the gap. In Handbook of Uncertainty Quantification; Ghanem, R., Higdon, D., Owhadi, H., Eds.; Springer International Publishing: Cham, Switzerland, 2017; pp. 1187–1216. [Google Scholar] [CrossRef]
- El Gibari, S.; Gómez, T.; Ruiz, F. Building composite indicators using multicriteria methods: A review. J. Bus. Econ. 2018, 89, 1–24. [Google Scholar] [CrossRef]
- Krajnc, D.; Glavič, P. How to compare companies on relevant dimensions of sustainability. Ecol. Econ. 2005, 55, 551–563. [Google Scholar] [CrossRef]
- Gómez-Limón, J.A.; Riesgo, L. Alternative approaches to the construction of a composite indicator of agricultural sustainability: An application to irrigated agriculture in the Duero basin in Spain. J. Environ. Manag. 2009, 90, 3345–3362. [Google Scholar] [CrossRef] [PubMed]
- Gómez-Limón, J.A.; Sanchez-Fernandez, G. Empirical evaluation of agricultural sustainability using composite indicators. Ecol. Econ. 2010, 69, 1062–1075. [Google Scholar] [CrossRef]
- Rezaei, J. Best-worst multi-criteria decision-making method. Omega 2015, 53, 49–57. [Google Scholar] [CrossRef]
- Saisana, M.; Saltelli, A.; Tarantola, S. Uncertainty and sensitivity analysis techniques as tools for the quality assessment of composite indicators. J. R. Stat. Soc. Ser. A Stat. Soc. 2005, 168, 307–323. [Google Scholar] [CrossRef]
- Baquero, O.F.; Gallego-Ayala, J.; Gine-Garriga, R.; de Palencia, A.J.F.; Perez-Foguet, A. The influence of the human rights to water and sanitation normative content in measuring the level of service. Soc. Indic. Res. 2017, 133, 763–786. [Google Scholar] [CrossRef]
- Gómez-Limón, J.A.; Riesgo, L. Sustainability assessment of olive groves in Andalusia: A methodological proposal. New Medit 2012, 11, 39–49. [Google Scholar]
- Gómez-Limón, J.A.; Arriaza, M. Evaluación de la Sostenibilidad de las Explotaciones de Olivar en Andalucía; Analistas Económicos de Andalucía: Málaga, Spain, 2011. [Google Scholar]
- Gómez Calero, J.A. (Ed.) Sostenibilidad de la Producción de Olivar en Andalucía; Consejería de Agricultura y Pesca, Junta de Andalucía: Sevilla, Spain, 2009. [Google Scholar]
- Taguas, E.V.; Gómez, J.A. Vulnerability of olive orchards under the current CAP (Common Agricultural Policy) regulations on soil erosion: A study case in Southern Spain. Land Use Policy 2015, 42, 683–694. [Google Scholar] [CrossRef]
- Rodríguez-Entrena, M.; Arriaza, M.; Gómez-Limón, J.A. Determining economic and social factors in the adoption of cover crops under mower control in olive groves. Agroecol. Sustain. Food Syst. 2014, 38, 69–91. [Google Scholar] [CrossRef]
- Rey, P.J. Preserving frugivorous birds in agro-ecosystems: Lessons from Spanish olive orchards. J. Appl. Ecol. 2011, 48, 228–237. [Google Scholar] [CrossRef]
- Carpio, A.J.; Oteros, J.; Tortosa, F.S.; Guerrero-Casado, J. Land use and biodiversity patterns of the herpetofauna: The role of olive groves. Acta Oecol. 2016, 70, 103–111. [Google Scholar] [CrossRef]
- Hermosin, M.C.; Calderon, M.J.; Real, M.; Cornejo, J. Impact of herbicides used in olive groves on waters of the Guadalquivir river basin (southern Spain). Agric. Ecosyst. Environ. 2013, 164, 229–243. [Google Scholar] [CrossRef]
- Gómez-Limón, J.A.; Arriaza, M.; Villanueva, A.J. Typifying irrigated areas to support policy design and implementation: The case of the Guadalquivir river basin. Irrig. Drain. 2013, 62, 322–329. [Google Scholar] [CrossRef]
- Expósito, A.; Berbel, J. Drivers of irrigation water productivity and basin closure process: Analysis of the Guadalquivir River Basin (Spain). Water Resour. Manag. 2019, 33, 1439–1450. [Google Scholar] [CrossRef]
- Rodríguez-Entrena, M.; Arriaza, M. Adoption of conservation agriculture in olive groves: Evidences from southern Spain. Land Use Policy 2013, 34, 294–300. [Google Scholar] [CrossRef]
- Carmona-Torres, C.; Parra-López, C.; Sayadi, S.; Chirosa-Ríos, M. A public/private benefits framework for the design of polices oriented to sustainability in agriculture: An application to olive growing. Land Use Policy 2016, 58, 54–69. [Google Scholar] [CrossRef]
- Rodríguez-Entrena, M.; Colombo, S.; Arriaza, M. The landscape of olive groves as a driver of the rural economy. Land Use Policy 2017, 65, 164–175. [Google Scholar] [CrossRef]
- Ness, B.; Urbel-Piirsalu, E.; Anderberg, S.; Olsson, L. Categorising tools for sustainability assessment. Ecol. Econ. 2007, 60, 498–508. [Google Scholar] [CrossRef]
- Bockstaller, C.; Guichard, L.; Keichinger, O.; Girardin, P.; Galan, M.-B.; Gaillard, G. Comparison of methods to assess the sustainability of agricultural systems: A review. In Sustainable Agriculture; Lichtfouse, E., Navarrete, M., Debaeke, P., Véronique, S., Alberola, C., Eds.; Springer: Dordrecht, The Netherlands, 2009; pp. 769–784. [Google Scholar] [CrossRef]
- Van Cauwenbergh, N.; Biala, K.; Bielders, C.; Brouckaert, V.; Franchois, L.; Garcia Cidad, V.; Hermy, M.; Mathijs, E.; Muys, B.; Reijnders, J.; et al. SAFE. A hierarchical framework for assessing the sustainability of agricultural systems. Agric. Ecosyst. Environ. 2007, 120, 229–242. [Google Scholar] [CrossRef]
- Bell, S.; Morse, S. Sustainability Indicators. Measuring the Incommensurable? Earthscan: London, UK, 2008. [Google Scholar] [CrossRef]
- Pannell, D.J.; Glenn, N.A. A framework for the economic evaluation and selection of sustainability indicators in agriculture. Ecol. Econ. 2000, 33, 135–149. [Google Scholar] [CrossRef]
- Talukder, B.; Hipel, K.W.; vanLoon, G.W. Developing composite indicators for agricultural sustainability assessment: Effect of normalization and aggregation techniques. Resources 2017, 6, 66. [Google Scholar] [CrossRef]
- Pollesch, N.L.; Dale, V.H. Normalization in sustainability assessment: Methods and implications. Ecol. Econ. 2016, 130, 195–208. [Google Scholar] [CrossRef]
- Munda, G. Measuring sustainability: A multi-criterion framework. Environ. Dev. Sustain. 2005, 7, 117–134. [Google Scholar] [CrossRef]
- Böhringer, C.; Jochem, P.E.P. Measuring the immeasurable—A survey of sustainability indices. Ecol. Econ. 2007, 63, 1–8. [Google Scholar] [CrossRef]
- Zardari, N.H.; Ahmed, K.; Shirazi, S.M.; Yusop, Z.B. Weighting Methods and their Effects on Multi-Criteria Decision Making Model Outcomes in Water Resources Management; Springer: Cham, Switzerland, 2015. [Google Scholar]
- Rowley, H.V.; Peters, G.M.; Lundie, S.; Moore, S.J. Aggregating sustainability indicators: Beyond the weighted sum. J. Environ. Manag. 2012, 111, 24–33. [Google Scholar] [CrossRef]
- Díaz-Balteiro, L.; Romero, C. In search of a natural systems sustainability index. Ecol. Econ. 2004, 49, 401–405. [Google Scholar] [CrossRef]
- Saaty, T.L. The Analytic Hierarchy Process; McGraw-Hill: New York, NY, USA, 1980. [Google Scholar]
- Molinos-Senante, M.; Gómez, T.; Garrido-Baserba, M.; Caballero, R.; Sala-Garrido, R. Assessing the sustainability of small wastewater treatment systems: A composite indicator approach. Sci. Total Environ. 2014, 497, 607–617. [Google Scholar] [CrossRef]
- Saaty, T.L. Decision-making with the AHP: Why is the principal eigenvector necessary. Eur. J. Oper. Res. 2003, 145, 85–91. [Google Scholar] [CrossRef]
- Dodd, F.J.; Donegan, H.A.; McMaster, T.B.M. A statistical approach to consistency in AHP. Math. Comput. Model. 1993, 18, 19–22. [Google Scholar] [CrossRef]
- Wang, T.; Fu, Y. Constructing composite indicators with individual judgements and best–worst method: An illustration of value measure. Soc. Indic. Res. 2019. [Google Scholar] [CrossRef]
- Omrani, H.; Alizadeh, A.; Amini, M. A new approach based on BWM and MULTIMOORA methods for calculating semi-human development index: An application for provinces of Iran. Socio-Econ. Plan. Sci. 2019, 100689. [Google Scholar] [CrossRef]
- van Calker, K.J.; Berentsen, P.B.M.; Romero, C.; Giesen, G.W.J.; Huirne, R.B.M. Development and application of a multi-attribute sustainability function for Dutch dairy farming systems. Ecol. Econ. 2006, 57, 640–658. [Google Scholar] [CrossRef]
- Pöyhönen, M.; Hämäläinen, R.P. On the convergence of multiattribute weighting methods. Eur. J. Oper. Res. 2001, 129, 569–585. [Google Scholar] [CrossRef]
- Purvis, G.; Louwagie, G.; Northey, G.; Mortimer, S.; Park, J.; Mauchline, A.; Finn, J.; Primdahl, J.; Vejre, H.; Vesterager, J.P.; et al. Conceptual development of a harmonised method for tracking change and evaluating policy in the agri-environment: The Agri-environmental Footprint Index. Environ. Sci. Policy 2009, 12, 321–337. [Google Scholar] [CrossRef]
- Jager, J.; Putnick, D.L.; Bornstein, M.H. More than just convenient: The scientific merits of homogeneous convenience samples. Monogr. Soc. Res. Child. Dev. 2017, 82, 13–30. [Google Scholar] [CrossRef]
- Richardson, J.T.E. The use of Latin-square designs in educational and psychological research. Educ. Res. Rev. 2018, 24, 84–97. [Google Scholar] [CrossRef]
- Bradley, J.V. Complete counterbalancing of immediate sequential effects in a Latin square design. J. Am. Stat. Assoc. 1958, 53, 525–528. [Google Scholar] [CrossRef]
- Forman, E.H.; Peniwati, K. Aggregating individual judgments and priorities with the analytic hierarchy process. Eur. J. Oper. Res. 1998, 108, 165–169. [Google Scholar] [CrossRef]
- Hallgren, K.A. Computing inter-rater reliability for observational data: An overview and tutorial. Tutor. Quant. Methods Psychol. 2012, 8, 23–34. [Google Scholar] [CrossRef] [PubMed]
- Shrout, P.E.; Fleiss, J.L. Intraclass correlations: Uses in assessing rater reliability. Psychol. Bull. 1979, 86, 420–428. [Google Scholar] [CrossRef] [PubMed]
- McGraw, K.O.; Wong, S.P. Forming inferences about some intraclass correlation coefficients. Psychol. Methods 1996, 1, 30–46. [Google Scholar] [CrossRef]
- Cicchetti, D.V. Guidelines, criteria, and rules of thumb for evaluating normed and standardized assessment instruments in psychology. Psychol. Assess. 1994, 6, 284–290. [Google Scholar] [CrossRef]
- Koo, T.K.; Li, M.Y. A guideline of selecting and reporting intraclass correlation coefficients for reliability research. J. Chiropr. Med. 2016, 15, 155–163. [Google Scholar] [CrossRef] [PubMed]
- Huberty, C.J.; Morris, J.D. Multivariate analysis versus multiple univariate analyses. Psychol. Bull. 1989, 105, 302–308. [Google Scholar] [CrossRef]
- Field, A.; Miles, J.; Field, Z. Discovering Statistics Using R.; Sage Publications: Los Angeles, CA, USA, 2012. [Google Scholar]
- Tabachnick, B.G.; Fidell, L.S.; Ullman, J.B. Using Multivariate Statistics; Pearson: Boston, MA, USA, 2013. [Google Scholar]
- Mardia, K.V. The effect of nonnormality on some multivariate tests and robustness to nonnormality in the linear model. Biometrika 1971, 58, 105–121. [Google Scholar] [CrossRef]
- Vallejo, G.; Ato, M. Robust tests for multivariate factorial designs under heteroscedasticity. Behav. Res. Methods 2012, 44, 471–489. [Google Scholar] [CrossRef]
- Kuhfeld, W.F. A note on Roy’s largest root. Psychometrika 1986, 51, 479–481. [Google Scholar] [CrossRef]
- Teles, J. Concordance coefficients to measure the agreement among several sets of ranks. J. Appl. Statist. 2012, 39, 1749–1764. [Google Scholar] [CrossRef]


| Principles | Criteria | Agri-environmental Indicators (ACRONYM) [Measurement Unit] |
|---|---|---|
| Biodiversity protection | Ensuring olive grove genetic diversity | Number of olive grove varieties (NUMVAR) [olive grove varieties number] |
| Enhancing or protecting biological diversity | Index of biological diversity (DIVERSIND) [dimensionless] bounded [0,1] | |
| Pesticide risk (PESTRISK) [kg live organism/ha·year] | ||
| Enhancing or protecting habitat diversity (ecosystem) | Percentage of land with other crops (OTHERCROP) [%] | |
| Percentage of non-cultivated land (NONCULTIV) [%] | ||
| Natural resources conservation (soil and water) | Minimizing soil erosion | Soil erosion (EROSION) [t/ha·year] |
| Enhancing or protecting soil fertility | Soil organic matter (ORGMAT) [dimensionless] bounded [0,1] | |
| Enhancing or protecting soil and water quality | Nitrogen balance (NITROGBAL) [N kg/ha·year] | |
| Residual herbicide use (RESHERB) [kg active matter/ha·year] | ||
| Minimizing water extraction | Irrigation water use (WATERUSE) [m3/ha·year] | |
| Optimizing energy balance | Energy balance (ENERGYBAL) [MJ/ha·year] |
| Category | Variable | Mean | St. Dev. |
|---|---|---|---|
| Farm plantation | Olive grove area (ha) | 17.2 | 26.5 |
| Plantation density (trees/ha) | 98.0 | 23.0 | |
| Plantation age (years) | 99.5 | 101.2 | |
| Average production (kg of olives/ha·year) | 6146 | 1529 | |
| Farmers | Age (years) | 50.8 | 10.7 |
| Time devoted to agriculture (%) | 54.7 | 42.2 | |
| Family labor (person-days/ha·year) | 4.9 | 8.9 | |
| Hired labor (person-days/ha·year) | 5.9 | 8.7 | |
| Farm AEIs related to biodiversity protection | Number of olive grove varieties | 1.75 | 0.81 |
| Index of biological diversity (dimensionless, [0,1]) | 0.59 | 0.18 | |
| Pesticide risk (kg live organism/ha·year) | 3666 | 2314 | |
| Percentage of land with other crops (%) | 4.77 | 13.23 | |
| Percentage of non-cultivated land (%) | 0.50 | 2.14 | |
| Farm AEIs related to natural resources conservation | Soil erosion (t soil/ha·year) | 9.01 | 6.10 |
| Soil organic matter (dimensionless, [0,1]) | 0.71 | 0.28 | |
| Nitrogen balance (N kg/ha·year) | −7.27 | 51.93 | |
| Residual herbicide use (kg active matter/ha·year) | 839 | 670 | |
| Irrigation water use (m3/ha·year) | 686 | 314 | |
| Energy balance (MJ/ha·year) | 9990 | 4387 |
| AEI | AHP | BWM | PA | |||
|---|---|---|---|---|---|---|
| Mean | CV | Mean | CV | Mean | CV | |
| Biodiversity protection | ||||||
| NUMVAR | 0.021 | 119.6% | 0.025 | 67.7% | 0.029 | 76.1% |
| DIVERSIND | 0.146 | 53.3% | 0.145 | 52.8% | 0.142 | 41.8% |
| PESTRISK | 0.104 | 82.2% | 0.078 | 92.9% | 0.085 | 76.2% |
| OTHERCROP | 0.066 | 83.2% | 0.067 | 60.7% | 0.070 | 58.0% |
| NONCULTIV | 0.088 | 83.9% | 0.111 | 76.7% | 0.099 | 57.3% |
| Natural resources conservation | ||||||
| EROSION | 0.201 | 51.2% | 0.206 | 43.8% | 0.176 | 46.2% |
| ORGMAT | 0.112 | 68.6% | 0.113 | 63.1% | 0.112 | 52.0% |
| NITROGBAL | 0.055 | 63.7% | 0.058 | 51.3% | 0.072 | 38.4% |
| RESHERB | 0.074 | 105.5% | 0.065 | 71.2% | 0.075 | 65.1% |
| WATERUSE | 0.084 | 92.1% | 0.074 | 68.5% | 0.082 | 60.8% |
| ENERGYBAL | 0.050 | 97.9% | 0.058 | 73.4% | 0.058 | 70.4% |
| Mean | 81.9% | 65.6% | 58.4% | |||
| Weighting Method | ICC(3,k) Coefficient | Lower Bound | Upper Bound |
|---|---|---|---|
| AHP | 0.89 | 0.82 | 0.96 |
| BWM | 0.93 | 0.87 | 0.97 |
| PA | 0.92 | 0.85 | 0.97 |
| Within-Subjects Effect | Value | F | Hypothesis d.f. | Error d.f. | p-Value | |
|---|---|---|---|---|---|---|
| Statistic | Pillai’s Trace | 0.541 | 1.441 | 18.000 | 70.000 | 0.140 |
| Wilks’ Lambda | 0.522 | 1.449 | 18.000 | 68.000 | 0.138 | |
| Hotelling’s Trace | 0.794 | 1.455 | 18.000 | 66.000 | 0.136 | |
| Roy’s Largest Root | 0.589 | 2.289 | 9.000 | 35.000 | 0.039 | |
| Method | Mean | Min. | Max. | St. Dev. | CV | |
|---|---|---|---|---|---|---|
| = 1 | AHP | 0.549 | 0.140 | 0.783 | 0.118 | 21.5% |
| BWM | 0.533 | 0.151 | 0.782 | 0.116 | 21.9% | |
| PA | 0.536 | 0.106 | 0.777 | 0.120 | 22.3% | |
| = 0.75 | AHP | 0.414 | 0.105 | 0.587 | 0.090 | 21.8% |
| BWM | 0.402 | 0.113 | 0.587 | 0.089 | 22.1% | |
| PA | 0.404 | 0.079 | 0.582 | 0.091 | 22.6% | |
| = 0.5 | AHP | 0.278 | 0.070 | 0.512 | 0.066 | 23.6% |
| BWM | 0.270 | 0.076 | 0.496 | 0.065 | 23.9% | |
| PA | 0.272 | 0.053 | 0.510 | 0.066 | 24.4% | |
| = 0.25 | AHP | 0.143 | 0.035 | 0.483 | 0.050 | 35.0% |
| BWM | 0.139 | 0.038 | 0.475 | 0.050 | 35.7% | |
| PA | 0.139 | 0.026 | 0.482 | 0.050 | 36.1% | |
| = 0 | AHP | 0.007 | 0.000 | 0.454 | 0.052 | 700.9% |
| BWM | 0.007 | 0.000 | 0.454 | 0.052 | 696.6% | |
| PA | 0.007 | 0.000 | 0.454 | 0.052 | 718.5% |
| Compensation Parameter | ||||||
|---|---|---|---|---|---|---|
| = 1 | = 0.75 | = 0.5 | = 0.25 | = 0 | Overall | |
| Kendall’s W | 1.000 | 0.987 | 0.988 | 0.988 | 1.000 | 0.705 |
| p-value | 0.000 | 0.000 | 0.000 | 0.000 | 0.000 | 0.000 |
© 2020 by the authors. Licensee MDPI, Basel, Switzerland. This article is an open access article distributed under the terms and conditions of the Creative Commons Attribution (CC BY) license (http://creativecommons.org/licenses/by/4.0/).
Share and Cite
Gómez-Limón, J.A.; Arriaza, M.; Guerrero-Baena, M.D. Building a Composite Indicator to Measure Environmental Sustainability Using Alternative Weighting Methods. Sustainability 2020, 12, 4398. https://doi.org/10.3390/su12114398
Gómez-Limón JA, Arriaza M, Guerrero-Baena MD. Building a Composite Indicator to Measure Environmental Sustainability Using Alternative Weighting Methods. Sustainability. 2020; 12(11):4398. https://doi.org/10.3390/su12114398
Chicago/Turabian StyleGómez-Limón, José A., Manuel Arriaza, and M. Dolores Guerrero-Baena. 2020. "Building a Composite Indicator to Measure Environmental Sustainability Using Alternative Weighting Methods" Sustainability 12, no. 11: 4398. https://doi.org/10.3390/su12114398
APA StyleGómez-Limón, J. A., Arriaza, M., & Guerrero-Baena, M. D. (2020). Building a Composite Indicator to Measure Environmental Sustainability Using Alternative Weighting Methods. Sustainability, 12(11), 4398. https://doi.org/10.3390/su12114398