Article

Shear-Torque Fatigue Performance of Geogrid-Reinforced Asphalt Interlayers

1
Department of Civil and Building Engineering and Architecture, Università Politecnica delle Marche, via Brecce Bianche, 60131 Ancona, Italy
2
Laboratoire GC2D, Université de Limoges, Bd J. Derche, 19300 Egletons, France
*
Author to whom correspondence should be addressed.
Sustainability 2020, 12(11), 4381; https://doi.org/10.3390/su12114381
Submission received: 5 May 2020 / Revised: 23 May 2020 / Accepted: 25 May 2020 / Published: 27 May 2020
(This article belongs to the Special Issue Sustainable Pavement Engineering and Road Materials)

Abstract

:
Interlayer reinforcement systems represent a valid solution to improve performance and extend the service life of asphalt pavements, reducing maintenance costs. The main issue is that the presence of reinforcement may hinder the full transmission of stresses between asphalt layers, reducing the overall pavement bearing capacity. This study aimed at evaluating the mechanical behavior of geogrid-reinforced asphalt interlayers under cyclic shear loading. To this purpose, a trial section, characterized by three types of interface (reinforced with carbon fiber grid, reinforced with glass fiber grid and unreinforced), was built. Cores were taken from the trial section to carry out shear-torque fatigue tests. Static Leutner shear tests were also performed on cored specimens having the same interface configuration. From data gathered in the present study, shear-torque fatigue tests have proved to be a powerful tool for investigating reinforced specimens. Results clearly ranked the investigated materials, showing that the glass fiber grid has the lowest shear fatigue performance in comparison with the other two interfaces at 20 °C. However, the shear fatigue resistance of glass fiber grid increases significantly at 10 °C. Finally, an interesting correlation was found between cyclic and static shear test results that should be better investigated in future studies.

1. Introduction

In recent decades, highway agencies are facing a twofold problem. Pavement construction costs are shooting up due to the scarcity of pavement materials along with strict environmental regulations. The intensification of traffic and the increase in axle loads on road pavements are generating premature failure processes and rapid loss of structural and functional pavement characteristics. This degradation process is drastically accelerated by extreme weather conditions connected to climate changes [1,2]. Therefore, the reduced budgets for pavement rehabilitation coupled with the scarcity of raw materials are leading to the need for adopting maintenance strategies as effective and durable as possible.
The conventional method for pavement rehabilitation is the construction of asphalt overlays usually applied as partial replacement of existing cracked layers. As a consequence, asphalt overlay represents a cost-effective method, but it is rarely durable because of the propagation of pre-existing cracks from the lower old pavement (not replaced) to the upper new asphalt overlay. This mechanism of distress is well-known as reflective cracking.
In recent years, maintenance and rehabilitation processes in the road networks are often performed by inserting reinforcement systems within pavement layers. The idea of introducing interlayer reinforcement systems in road pavements dates to the 1950s and 1960s, when first attempts were carried out placing metal meshes between asphalt layers to improve pavement performance and durability. The results of these initial experiences were not encouraging because the installation system was too rudimentary, and the reinforcing material was not suitable for road pavement applications [3]. The use of new technologies and materials, such as geosynthetics, has provided new incentives for the use of interlayer reinforcement systems in pavement engineering. Contrarily to asphalt overlays, geosynthetics are able to significantly increase the maintenance intervals of road pavements, resulting in a cost-effective and long-lasting pavement rehabilitation method. Less frequently, reinforcement systems can be also used for new pavement construction. The use of geosynthetics also allows a reduction in the thickness of the old layers to be milled and of the new asphalt layers to be built above the reinforcement, leading to a reduction in materials to be disposed of, lower exploitation of raw materials, lower energy consumption (transport, laying and compaction), lower damage and inconvenience to secondary roads. Moreover, certain types of geosynthetics can be also milled and recycled [4]. Therefore, the pavement industry may benefit from adopting these interlayer systems by constructing more sustainable infrastructures.
Geosynthetics can fulfil various functions as separation, filtration, reinforcement, stiffening and drainage [5]. Several types of geosynthetics are available on the market produced by many manufacturers worldwide and can be grouped into four categories: geotextile, geomembrane, geogrid and geocomposite [4]. Among all, geogrids are the most used geosynthetics for reinforcement applications where no waterproofing functions are required.
The primary ability of a pavement reinforced with geosynthetics is to distribute the applied load to a wider area on top of the unbound layers, thus resulting in smaller strain–stress values, as shown in Figure 1. However, the efficiency of the interlayer reinforcement system strongly depends on the proper choice of the geosynthetics, correct installation, and characteristics of the asphalt concrete layers.
Before the reinforcement installation, the underlying layer must be devoid of structural defects (e.g., rutting, depressions, etc.,) and tack coat can be applied to improve the bonding of the layers, paying attention both to the application rate and curing time [6]. Regarding the reinforcement installation, the reinforcement has to be perfectly laid, avoiding any possible corrugation, and must remain flat during the laying of the upper layer [7,8,9,10,11]. It is good practice to follow the recommendations of the manufacturers when installing the products, otherwise, the application of reinforcements at the interface can be technically and economically ineffective or even harmful.
Although considerable studies have been conducted to investigate the behavior of reinforced asphalt pavement, there are still many open issues to be investigated. Different studies performed both in the laboratory and on real pavements showed that geosynthetics can extend the pavement fatigue life and improve resistance to reflective cracking and rutting [12,13,14,15,16,17,18,19,20,21]. Therefore, the extra endeavors and costs associated with the application of geosynthetics are justified by the longer service life and lower lifecycle costs of the pavement.
On the other hand, the presence of geosynthetics inevitably causes a significant reduction in the shear resistance between asphalt layers, this phenomenon is known as the debonding effect [18,22,23,24,25,26,27,28]. Since a good bonding between the pavement layers is essential to maintain the structural integrity, the debonding effect considerably influences the pavement response in terms of the stress–strain distribution, and, therefore, negatively impacts the pavement lifespan [9,20,29,30]. Graziani et al. [31] built a reinforced asphalt pavement instrumented with pressure cells and strain gauges. In this study, falling weight deflectometer (FWD) tests along with a layered elastic theory (LET) model analysis showed that certain geogrids cause a noticeable interface slip, and this could lead to an increase in the tensile strain within the pavement due to the debonding effect. Therefore, if the shear resistance excessively decreases due to the presence of the reinforcement, the overall pavement performance would be negatively affected, and slippage could occur at the pavement surface due to shear stresses produced by traffic loads.
In the laboratory, the interlayer bonding of double-layered reinforced specimens is typically evaluated by measuring the interlayer shear strength (ISS or τ p e a k   ) by means of static (i.e., monotonic) shear tests [32,33]. Nevertheless, road pavements are subjected to cyclic traffic loads with magnitudes considerably lower than those that cause the interface failure during static shear tests. In this sense, static (i.e., monotonic) shear tests can be used for quality assessment of the interlayer bonding properties at failure, whereas the adoption of cyclic shear tests can offer a more complex evaluation of interlayer bonding [34,35,36,37]. Moreover, cyclic shear test results can be used for modeling or pavement design purposes. The first cyclic shear tests used to investigate the shear fatigue performance of asphalt interlayers were conducted in the early 2000s [38,39,40]. So far, only a few studies were addressed to characterize the reinforced asphalt systems under cyclic shear loading [28,40,41,42] and, consequently, the shear fatigue behavior of reinforced asphalt pavement is not yet fully understood. This lack of exhaustive scientific knowledge regarding the shear fatigue behavior of reinforcements is also an obstacle for innovation and industrial practice.
Lastly, another crucial aspect that should be considered is that laboratory tests carried out on reinforced specimens fabricated in the laboratory may lead to results that do not occur with in situ cored specimens [18,43]. This may be due to the different compaction methods and reinforcement installation techniques used in the laboratory and in situ. Consequently, the construction of full-scale trial sections is more appropriate for evaluating the effect of reinforcement systems [44,45].

Objective and Scope

Given this background, this study focuses on the analysis of the interlayer bonding between asphalt layers and reinforcements. The main goal of this study was to evaluate the behavior of reinforcement systems and their effects on the interlayer mechanical properties under cyclic shear loading at the interface. To accomplish the objective of this study, a full-scale trial section, characterized by three types of interfaces (two reinforced with different geogrids and one unreinforced for comparison purposes), was built. Shear-torque fatigue tests were performed on in situ cored specimens to evaluate the fatigue performance of the reinforcement. Different fatigue failure criteria were adopted to select the most appropriate fatigue approach in order to determine the failure of each specimen. Besides, static (i.e., monotonic) direct shear tests were also performed on the same cored specimens by using the Leutner device to search for a possible correlation between cyclic and static shear tests in order to get useful insights for the future deepening of such an interesting goal.

2. Experimental Program

2.1. Reinforcing Materials

Two different geosynthetics (coded as CF and FG) were used as reinforcements in this experimental study. The CF geogrid (Figure 2a) was composed of carbon fiber rovings with a square 15 mm mesh pre-coated with bitumen in conjunction with a burn-off film applied on the underside, characterized by a tensile strength of 200 kN/m (in both directions), whereas, the FG geogrid (Figure 2b) was composed of glass fiber yarns with a square 25 mm mesh in conjunction with a light polyester knitted veil applied on the underside, characterized by a tensile strength of 100 kN/m (in both directions). Besides, the CF geogrid was characterized by a lower tensile elongation at failure with respect to the FG geogrid (1.75% in both directions for CF vs. 3% in both directions for FG).

2.2. Trial Section and Specimen Preparation

A full-scale trial section (8 m long, 3 m wide, and 2 m deep) was built at the Laboratoire GC2D of the University of Limoges (Egletons, France) in July 2017, in a pit installed in a building with the possibility to control several conditions (e.g., temperature, humidity). The trial section was characterized by different interfaces as follows:
  • unreinforced with a tack coat interface used as a reference for comparison purposes (coded as UN);
  • tack coat and carbon fiber geogrid (coded as CF);
  • tack coat and glass fiber geogrid (coded as FG).
The main construction activities of the pavement section are summarized below (Figure 3a–c):
  • 20/40 gravel with a thickness of 20 cm on the bottom of the pit;
  • subgrade course, having a thickness of 140 cm, prepared with decomposed granite;
  • subbase course, having a thickness of 30 cm, prepared with untreated gravel GNT 2 (GNT stands for “Grave Non-Traitée” in French) [46] of maximum diameter 31.5 mm;
  • base course, having a thickness of 9 cm, prepared with asphalt concrete GB 3 0/14 (GB stands for “Grave Bitume” in French) [47];
  • accurate cleaning and preparation of the upper base course surface and application of the tack coat (bituminous emulsion of pure bitumen) with a residual dosage of 0.5 kg/m2;
  • application of the geogrids directly on the fresh emulsion right after spreading (except for the unreinforced section);
  • application of the tack coat with a residual dosage of 0.5 kg/m2 only above the FG geogrid;
  • wearing course, having a thickness of 5 cm, with asphalt concrete BBSG 3 0/10 (BBSG stands for “Béton Bitumineux Semi Grenu” in French) [47], once the tack coat emulsion was fully cured.
Figure 3d shows the cross-section of the full-scale trial section. More details regarding the trial section are available in the references [48,49].
In May 2018, several cores with a nominal diameter of 100 and 150 mm and a thickness of 140 mm were extracted from the experimental pavement section (Figure 4). Each core was marked by an identification code (ID) defining its location in the trial section; for example, UN_2 represents the specimen number 2 taken from the unreinforced section (UN). In the laboratory, each core was sawed in order to obtain a total thickness of 90 mm (both layers of 45 mm). The average bulk density of the specimens, measured according to [50], was 2.23 g/cm3.

2.3. Testing Methods

2.3.1. Shear-Torque Fatigue Test

Shear-torque fatigue test carried out in stress-controlled mode consists of measuring the sinusoidal torsional rotation angle (α), when a sinusoidal torque (T) is applied along with a small axial compression load (N) on a cylindrical asphalt concrete specimen through a servo-hydraulic (MTS) device (Figure 5). The torsional rotation angle is measured with a magnetic non-contact angular sensor (accuracy 0.001°), which is located on the upper steel plate (Figure 5). The load cell measures the torque up to ±1 kNm and the axial load up to ±100 kN. During the test, small axial load amplitude is applied to ensure a good alignment of the specimen and steel plates, to guarantee the homogeneity of the stress states in the specimen. The sinusoidal evolution with time of the two measured values is defined by the following equations:
T ( t ) = T 0 sin ( ω t )
α ( t ) = α 0 sin ( ω t φ )
where T 0 is the amplitude of the applied torque, ω is the torque pulsation (ω = 2πf with f the load frequency), t is the time, α 0 is the amplitude of the torsional rotation angle, and φ is the phase angle related to the lag between stress and strain.
Considering complex notations, where j is the complex number defined by j2 = −1, the measured values can be written as follows:
T * = T 0 exp [ j ω t ]
α * = α 0 exp [ j ( ω t φ ) ]
The correspondence principle allows the application of known solutions for linear elastic structures also for geometrically identical bodies made of linear viscoelastic materials. Therefore, for cylindrical specimens, the applied torque (T) generates shear stress ( τ ) which varies linearly with the radius of the specimen (R) (Figure 5). From cyclic torque tests, complex shear modulus G * of materials can be calculated with the following equation:
G * = H I p T 0     exp [ j ω t ]   α 0   exp [ j ( ω t φ ) ]   = | G * |   exp [ j φ ]
where H is the specimen height, | G * | is the norm (or absolute value) of the complex shear modulus, and I p is the polar moment of inertia of the circular section.
The apparatus is placed in a climatic chamber to control the temperature during the test. Prior to testing, the specimen is glued between two steel plates using an epoxy resin (Figure 5) and care must be taken to avoid eccentricity of the specimen during gluing which could affect the test results. More details of the shear-torque fatigue test can be found in the references [37,51,52].
By analyzing fatigue test data, the choice of fatigue criterion has paramount importance for the understanding of material behavior. The fatigue life value ( N f ) at a selected stress level is defined as the number of cycles corresponding to the failure point calculated by adopting a given specific criterion for the tested specimen. Different approaches for the prediction of fatigue life can be found in the literature. Usually, the traditional approach defines failure as the point at which the decrease in the material modulus reaches a certain value (Figure 6a). The most classical fatigue criterion ( N f = N 50 ) uses a threshold value of 50% of the initial modulus values [53]. As an alternative to the traditional approach, Reese [54] suggested a new failure approach based on the evolution of the phase angle (φ) considering the viscoelastic behavior of asphalt materials. During cyclic loading, the measured phase angle of asphalt concrete generally shows a steady increase followed by a sudden decrease (Figure 6b). The cycle corresponding to this sudden decrease is defined as the number of cycles to failure ( N f = N φ m a x ). Compared to the traditional approach, this approach seems to have a more theoretical underpinning, as the sudden reduction in the phase angle represents a viscoelastic behavior modification of the material probably due to the formation of macro-cracks. However, the real mechanism governing the phase angle evolution (e.g., nonlinear viscoelasticity, fatigue damage) is not yet fully understood. Fatigue failure criterion that can accurately define the effective failure of the double-layered asphalt concrete specimens during cyclic shear-torque tests has yet to be developed. A recent study [51] adopted the acoustic emission (AE) technique to investigate the fatigue behavior of asphalt interlayers in cyclic torque tests, highlighting that the damage evolution phase occurs in the specimen when the norm of its complex shear modulus | G * | decreases by about 70% (Figure 6a). According to these results, the 70% decrease in the stiffness initial value can be used as fatigue criterion ( N f = N 70 ) for this type of test.

2.3.2. Leutner Test

The Leutner test [55], which is a static (i.e., monotonic) shear test compliant with prEN 12697-48 [56], consists of measuring the shear force when a constant shear displacement rate is applied across the interface of a double-layered specimen, without applying a normal load perpendicular to the interface. A specimen with a nominal diameter of 100 or 150 mm is clamped in the test equipment between two shear rings, taking care to ensure that the specimen interface is correctly aligned with the shear plane. The Leutner device is installed into a servo-mechanic press frame able to apply displacement rates up to 50 mm/min. An external linear variable displacement transducer (LVDT) is used to measure the shear displacement of the specimen at the interface. The shear force and displacement are recorded during the test. By plotting instant by instant the shear stress at the interface ( τ ), calculated as the ratio between the shear force and the specimen cross-sectional area, as a function of shear displacement, it is possible to determine the maximum shear stress (i.e., interlayer shear strength ISS or τ p e a k ). Lower τ p e a k implies lower interlayer bonding.

2.4. Testing Program

The experimental program consisted of evaluating the shear fatigue performance of reinforced and unreinforced cylindrical specimens by performing shear-torque fatigue tests in stress-controlled mode. Static Leutner tests were carried out in strain-controlled mode on the same specimens. A summary of the testing program is reported in Table 1. Prior to testing, all specimens were conditioned at the testing temperature in a climatic chamber for at least 4 h.
As shown in Table 1, shear-torque fatigue tests were carried out only on 100 mm nominal diameter specimens applying a sinusoidal torque at the frequency of 10 Hz. In this study, an alternate cyclic loading (signal centered at zero) was adopted to simulate the stress–strain state induced by a moving wheel in a straight pavement section (without braking and acceleration conditions), whereas the frequency of 10 Hz was chosen to simulate a traffic speed of roughly 80 km/h on a pavement at a depth of 10–20 cm [57]. Shear-torque fatigue tests were conducted at a temperature of 20 °C for each interface type as usually suggested for static shear tests [32]. For FG specimens, tests were also carried out at 10 °C. A preliminary test was conducted on an unreinforced specimen (UN), considering two different torque amplitudes ( T 0 = 20 and 40 Nm), to select the suitable loading range to apply during this experimentation. Different torque amplitudes ( T 0 ) ranging from 20 to 80 Nm were chosen to obtain a wide range of the number of cycles to failure ( N f ).
Static Leutner tests were carried out only on 150 mm nominal diameter specimens applying the standard displacement rate of 50.8 mm/min. Tests were conducted at 10 and 20 °C on UN and FG interface types. Three repetitions were performed for each test condition.
After each test, the specimen was visually inspected to determine the mode of shear failure: break at the interface, break within the asphalt layer or mixed break (both at the interface and within the asphalt layer).

3. Results

3.1. Shear-Torque Fatigue Test Results

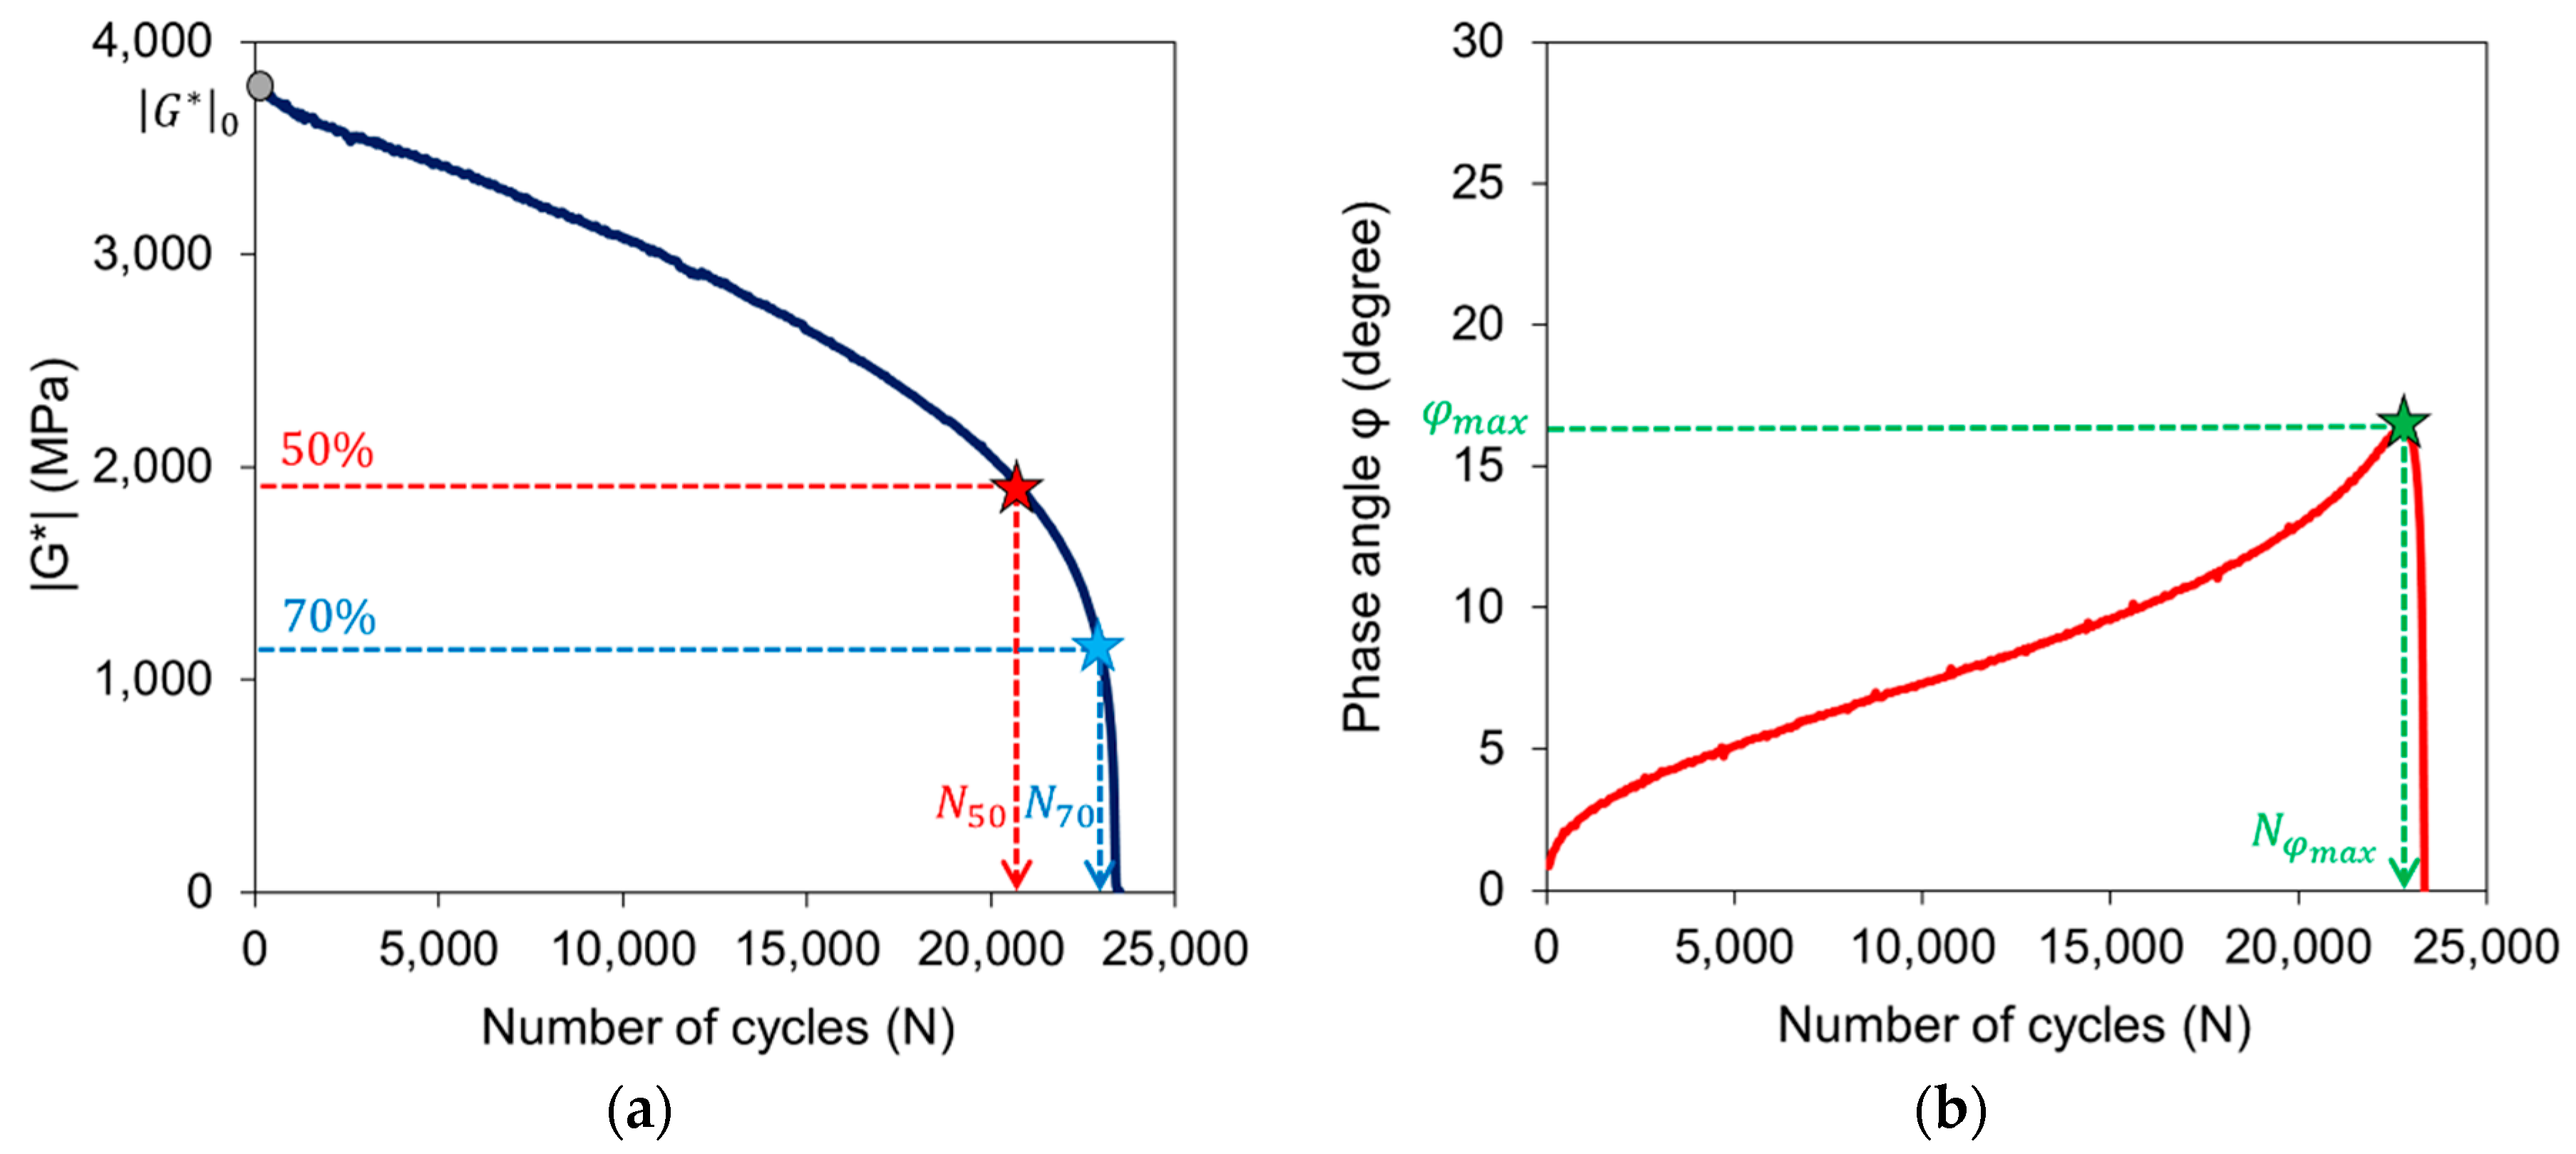
3.1.1. Viscoelastic Properties

The relationship between the applied shear stress amplitude ( τ m a x , 0 ) and the corresponding initial value of the norm of the complex shear modulus ( | G * | 0 ) is depicted in Figure 7. The equation used for calculating the amplitude of the applied shear stress ( τ m a x , 0 ) is shown in the following:
τ m a x , 0 = 2 T 0 π R 3
The initial value | G * | 0 is assumed as the norm of the complex shear modulus evaluated at the 50th cycle, because at this stage of the test, the double-layered specimen is not damaged yet and, at the same time, the induced stress–strain field can be considered not affected by the initial perturbation (i.e., steady). The results presented in Figure 7 show that the initial norm of the complex shear modulus ( | G * | 0 ) depends on the applied shear stress amplitude ( τ m a x , 0 ), i.e., the interface displays nonlinear viscoelastic behavior within this loading range. In particular, the measured | G * | 0 decreases as the applied shear stress amplitude increases. It can be also observed that the presence of a geogrid at the interface leads to smaller initial values of the norm of the complex shear modulus ( | G * | 0 ). Besides, due to the presence of the asphalt concrete layers, | G * | 0 increases as testing temperature decreases (from 20 to 10 °C) for the FG interface type.
The damage of the specimen was analyzed by using the evolution of the phase angle (φ) and the normalized norm of complex shear modulus ( | G * | n ). The latter is given by the following equation:
| G * | n = | G * | N | G * | 0
where | G * | N is the norm of the complex shear modulus calculated at any given number of loading cycles (N).
The results of specimen FG_7 tested with a torque amplitude T 0 = 55 Nm at 10 Hz and 10 °C are presented herein as a typical example. In Figure 8, the normalized norm of complex shear modulus ( | G * | n ) and the phase angle (φ) are presented as a function of the number of cycles. It is interesting to observe in Figure 8 that | G * | n decreases with the number of cycles, indicating a progressive weakening of the interface properties during the test characterized by a typical three-phase fatigue curve [51,52,58,59], whereas the phase angle (φ) increases during the cyclic test and drops suddenly approaching the end of the test. Four phases can be identified for the phase angle curve. The first phase consists of a quick increase in the phase angle; this is attributable to bulk reversible phenomena (e.g., self-heating) that tend to appear during the initial test cycles. The second phase is associated with a quasi-linear increase in the phase angle. In the third phase, irreversible phenomena (e.g., fatigue damage) appear and the phase angle quickly increases until a sudden drop (fourth phase). During the fourth phase, macro-cracks propagate at the interface, generating a not homogeneous distribution of stresses and strains. According to Reese [54], the maximum point of the phase angle defines the point at which the location of the damage begins.
Figure 9 shows the evolution of the normalized norm of complex shear modulus ( | G * | n ) of the FG interface type at various torque amplitudes ( T 0 ) at 10 Hz and 10 °C. It is possible to note that | G * | n decreases faster with the number of loading cycles as the applied torque amplitude increases.
Figure 10 shows the evolution of the phase angle (φ) of the FG interface type at 10 Hz and two testing temperatures (10 and 20 °C). It is possible to note that, for both temperatures, φ increases faster with the number of loading cycles by applying higher torque amplitude values. Besides, the phase angle values at 20 °C are greater than those at 10 °C because, as expected, asphalt materials are more viscous at higher temperatures. This observation is in agreement with a previous study [60], and the measured values of the phase angle are also comparable.
After the test, the failure occurred exactly at the interface for all the specimens, i.e., a complete detachment between the two layers of the specimen was observed. In particular, the failure for the FG interface type was on the polyester knitted veil side, denoting that the veil could be an obstacle to bonding the two layers in contact (Figure 11).

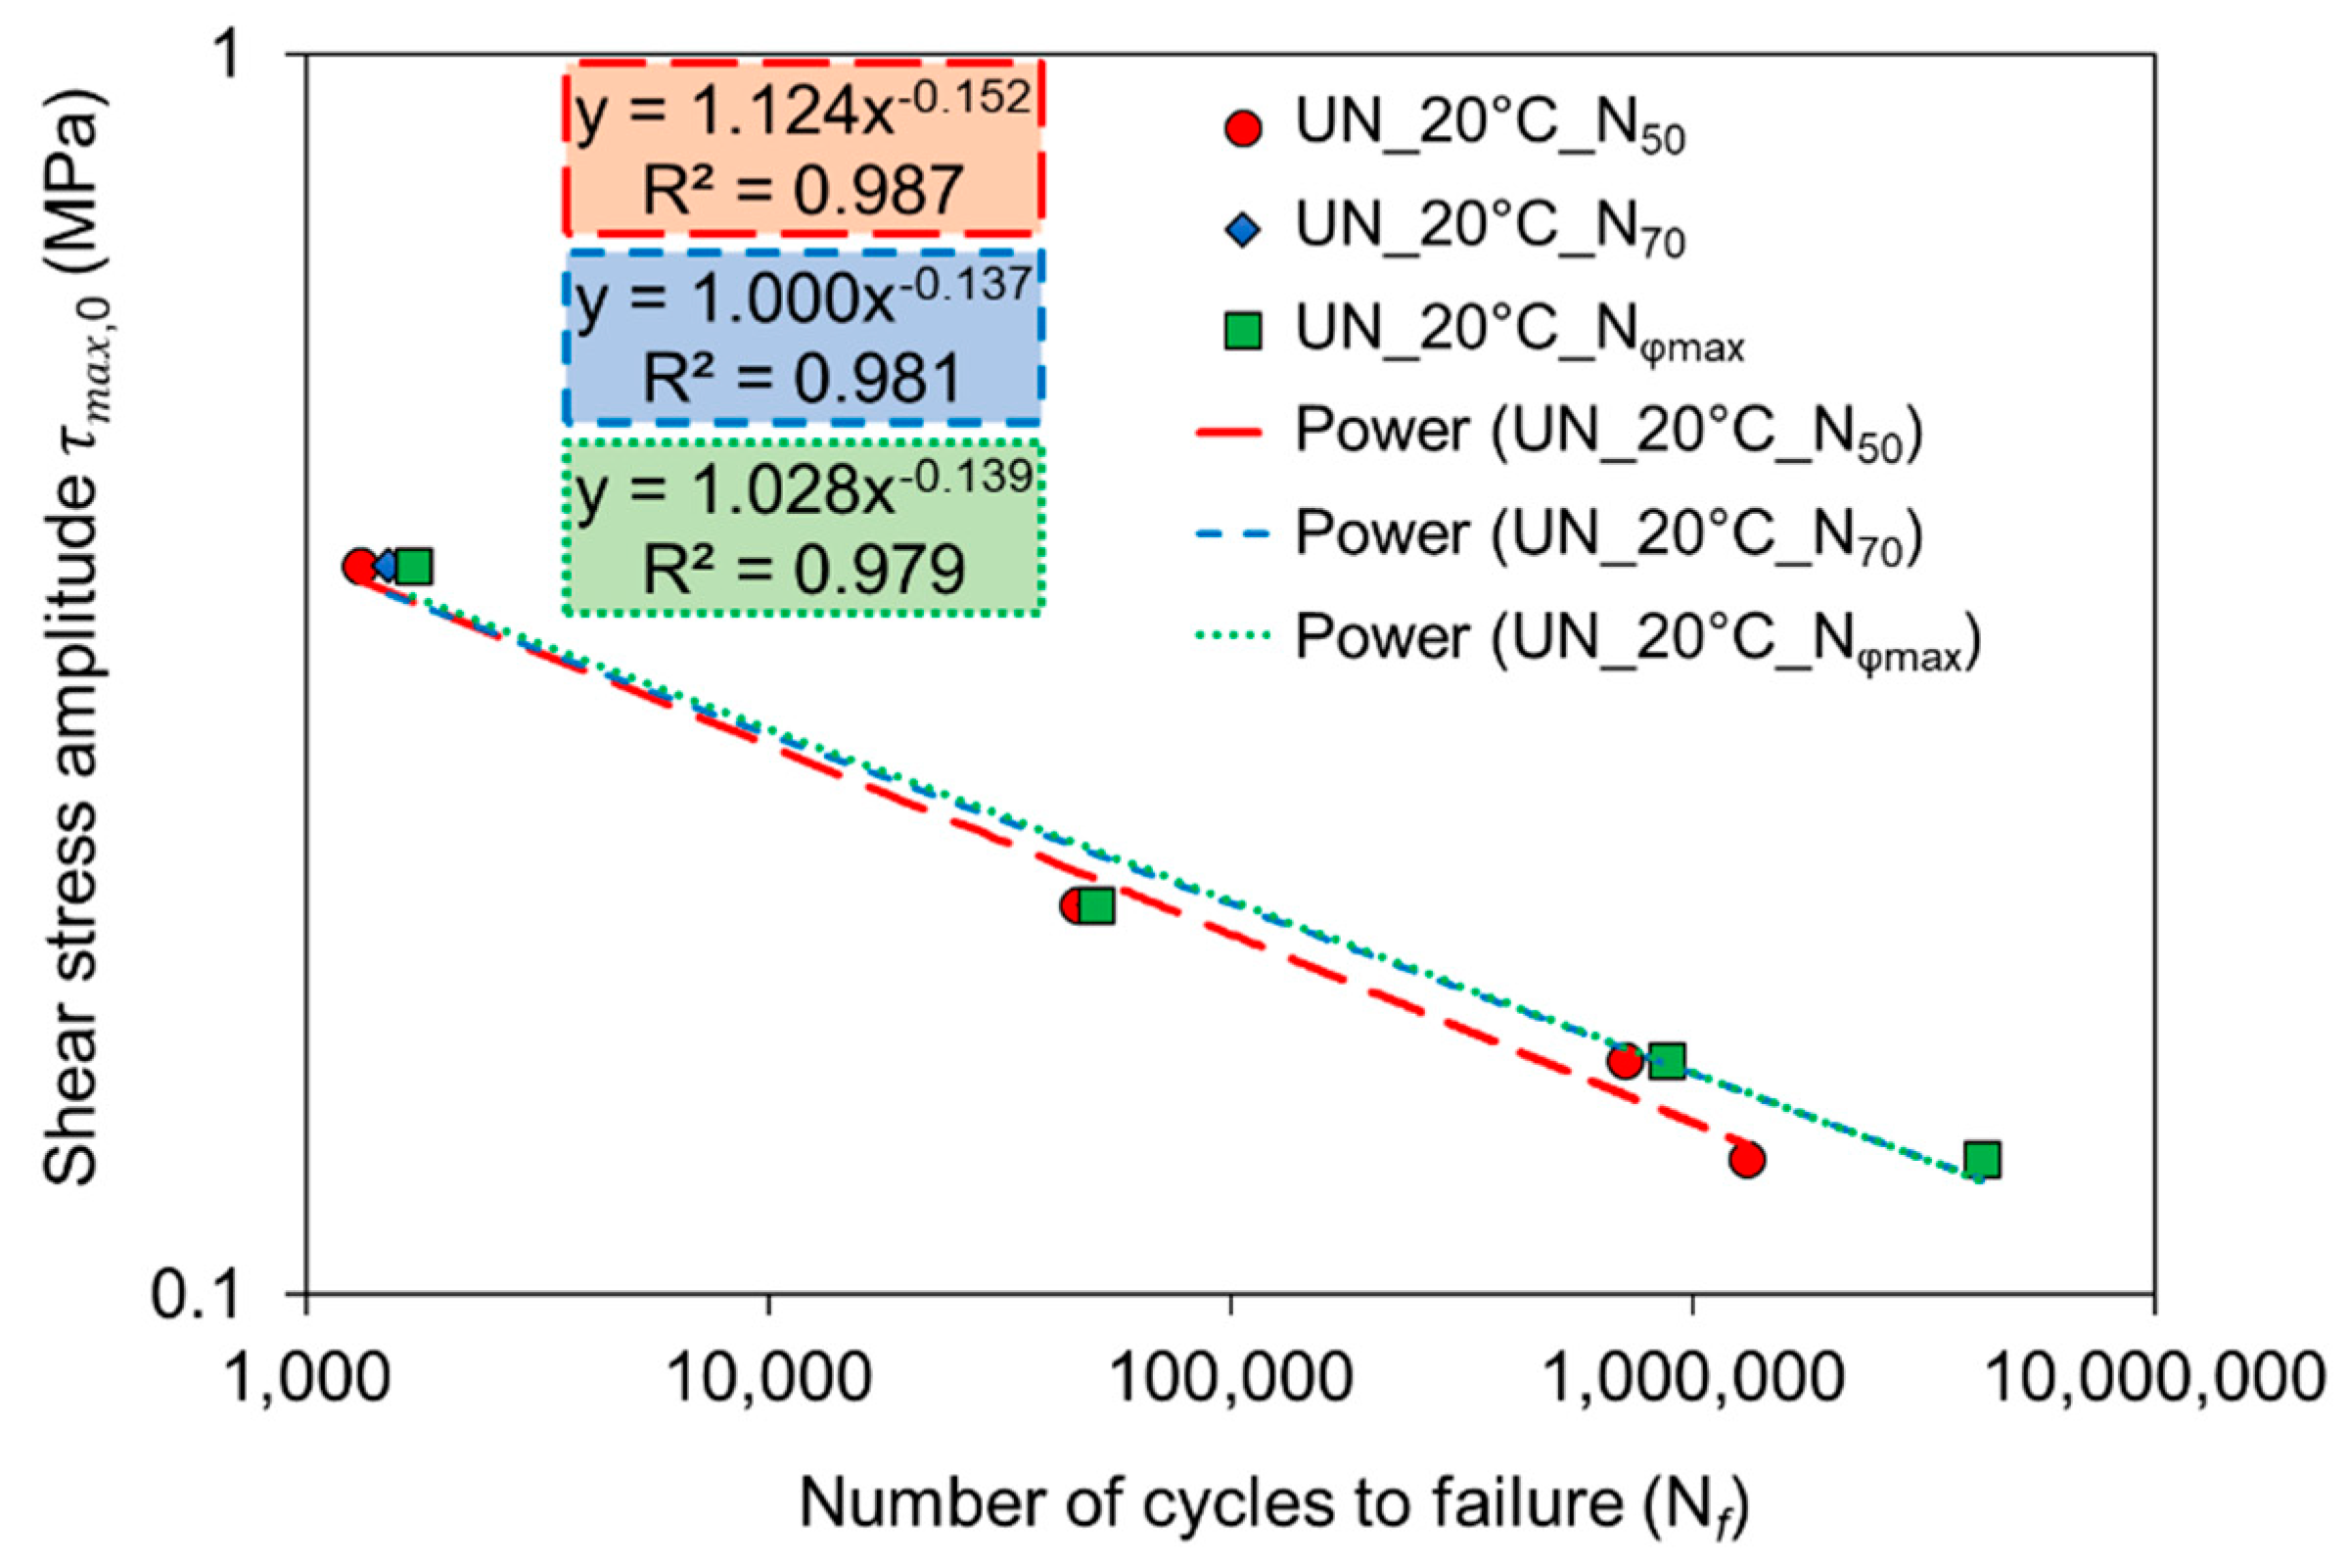
3.1.2. Interlayer Shear Fatigue Curve

The interlayer shear fatigue curves of the tested interface types are shown in a log–log plane from Figure 12, Figure 13, Figure 14 and Figure 15. A typical power-law model was used to obtain the relationship between the amplitude of the applied shear stress amplitude ( τ m a x , 0 ) and the number of cycles to failure ( N f ) according to the following equation:
τ m a x , 0 = a · N f b
where parameters a and b are regression coefficients. In particular, b represents the slope of the linear regression in a log–log plane.
In each plot, interlayer shear fatigue curves obtained by using the classical fatigue criterion ( N 50 ) were compared to those established by considering more appropriate failure criteria ( N 70 and N φ m a x ). The corresponding regression coefficients for the power-law model (a and b) are also presented in Table 2, as well as the coefficient of determination (R2).
Looking at the experimental results, it can be seen that the obtained interlayer shear fatigue curves are very similar by applying the failure criteria N 70 and N φ m a x , whereas in some cases, the N 50 failure criterion is not always in agreement with the previous ones (UN and FG interface types at 20 °C, Figure 12 and Figure 14, respectively). As a consequence, the traditional failure criterion ( N 50 ) can probably lead to a misleading ranking, since it is not capable of quantifying the damage mechanisms that occur within the interface. Meanwhile, the maximum phase angle ( N φ m a x ) and the 70% failure criterion ( N 70 ) can better correlate the number of cycles to failure with the damage process at the interlayer because they are related to a change in the inner behavior of the specimen. For example, once the specimen becomes severely damaged at the interface, the strain response curve in a stress-controlled test varies significantly from an actual sinusoidal function and this distortion is responsible for the drop in phase angle. These results also confirm the effectiveness of the 70% failure criterion already highlighted in a previous study carried out on unreinforced asphalt interlayers [51]. Thus, considering the weakness of the traditional approach, these results illustrate that the maximum phase angle and the 70% failure criterion provide similar results and can offer an accurate shear fatigue life prediction.
Several interesting findings can be drawn also looking at the results listed in Table 2. By comparing the fatigue law parameters at 20 °C for the N 70 and N φ m a x criteria, it is possible to observe that the FG interface shows the lowest and highest values for a and b, respectively. In general, coefficients of determination (R2) are greater than 0.9 for all the interface types, which indicates a very good correlation between measured data and the linear fatigue law. Nevertheless, R2 values increase as the temperature decreases (greater than 0.99) for the FG interface, indicating that the specimen-to-specimen interlayer shear variability increases at higher temperatures. Meanwhile, the parameter b values decrease as the testing temperature decreases, indicating a clear thermo-dependency for the interlayer shear fatigue properties.
In order to rank the different interface types (UN, CF and FG) and to investigate the influence of testing temperature on the FG interface, interlayer shear fatigue curves are represented in Figure 16 according to 70% norm of the complex shear modulus reduction criterion ( N 70 ). Since the asphalt mixture and compaction method of the tested specimens are the same, it can be asserted that the resistance to shear fatigue damage is only a function of the interface type.
Figure 16 shows that UN and CF interfaces provide very similar results in term of interlayer shear fatigue life, although it appears that UN interface guarantees slightly higher performance at a lower shear stress level than the CF interface. Moreover, for a given shear stress amplitude, FG reinforced specimens are characterized by a number of cycles to failure considerably lower than unreinforced and CF reinforced specimens (Figure 16). For example, with τ m a x , 0 = 0.15 MPa (i.e., T 0 = 30 Nm) as input level (orange dotted line in Figure 16), the FG interface requires less than 30,000 cycles to failure at 20 °C, whereas the other CF reinforced interface undergoes more than 700,000 cycles at the same temperature.
Starting from these results, it is expected that the CF geogrid is able to perform well in the field since the debonding effect highlighted by shear-torque fatigue loading is not so evident compared to the unreinforced interface UN. The fairly good performance of this type of geogrid has already been observed in previous studies by performing static shear tests on specimens reinforced with a similar geogrid [13,45]. This could be due to the presence of the pre-coating and the fact that the grid knots are not fixed, which allows the grid structure to move freely during the laying and compaction of the asphalt mixture ensuring the achievement of an optimal interlocking. Besides, the presence of the film applied on the underside of the CF geogrid, which is burned before installation, further improves the bonding properties on the underlying layer. On the contrary, the FG geogrid provides the lowest performance with respect to the other two interface types (UN and CF). This could be due to the presence of the polyester knitted veil and the fixed knots of the FG geogrid (unlike the CF geogrid), which probably hinder the achievement of an optimal bonding and interlocking between the two asphalt layers in contact as already observed in Figure 11.
As far as the testing temperature is concerned, the FG interface at 10 °C provides higher shear fatigue performance compared to those at 20 °C for the same reinforcement (Figure 16). This is in accordance with previous investigations carried out with various shear tests in cyclic modality on unreinforced specimens [34,39,61] and in static modality on reinforced specimens [45], where an improvement of interlayer resistance was measured at low temperatures. Therefore, it can be assumed that as the temperature decreases, since the asphalt concrete is a thermo-dependent material, the interlayer becomes stiffer and more loading cycles of the same stress intensity are needed to cause the failure of the specimen.
To allow a better comparison between the different interface types (UN, CF and FG), it is possible to calculate, from the power-law models reported in Figure 16, the parameter τ 6 shown in Figure 17. The parameter τ 6 is defined as the shear stress level that leads to a fatigue life of 1 million cycles ( N f = 106) in a cyclic shear test and it is inspired by ε 6 , defined as the strain level leading to specimen failure for 1 million cycles, which is used to calculate the admissible strain in asphalt pavement layers in the French pavement design method [34,62]. Lower τ 6 implies lower shear fatigue performance. As shown in Figure 17, the values of τ 6 confirm the outcomes previously discussed in Figure 16, but the comparison of τ 6 allows to easily rank the different interface types (UN, CF and FG), denoting that it can be a useful parameter to characterize the interlayer bonding in cyclic shear tests.
In synthesis, the obtained results demonstrate that an appropriate choice of the most suitable interlayer reinforcement system could increase the cyclic shear fatigue resistance strictly linked to the debonding effect. Moreover, shear-torque fatigue tests could provide useful guidance for the selection of the most appropriate reinforcement because the results are clearly sensitive to the testing parameters (i.e., type of interface and testing temperature). However, further work is needed to adopt a method for selecting effective torque levels because different reinforcement and/or type of interface experience different levels of sensitivity to changes in stress level. Furthermore, another shortcoming is that shear-torque fatigue tests are highly time-consuming, especially at very low stress–strain levels. On the other hand, the analysis of failure of fatigue curves could help for a better understanding of the experimental results obtained with routine testing protocols such as static (i.e., monotonic) shear tests for the evaluation of the interlayer shear strength (ISS or τ p e a k ).

3.2. Static Leutner Test Results

Figure 18 shows the results of static Leutner test, in terms of average interlayer shear strength ( τ p e a k ), for UN and FG specimens with a diameter of 150 mm at 10 and 20 °C. The τ p e a k value decreases with increasing testing temperature for both interface types but the reduction (in percentage) is greater for the UN system compared to the FG system (i.e., 45% and 22%, respectively).
Figure 18 also shows that the presence of the FG geogrid at the interface leads to lower τ p e a k compared to the corresponding unreinforced system (UN) for both temperatures according to the results of shear-torque fatigue tests. The reduction (in percentage) of τ p e a k by comparing UN and FG systems is of 59% and 42% at 10 and 20 °C, respectively. These results allow remarking that the interlayer reinforcement worsens the interlayer properties by decreasing the adhesion between the two asphalt layers [45].

3.3. Comparison between Cyclic and Static Shear Tests

As explained in the introduction, cyclic shear tests allow the determining of accurate parameters closely linked to field performance, but they are more time-consuming and require more effort to process the data compared to the static shear tests. In this sense, there is a need to find links between cyclic and static shear test to correlate different laboratory results and to predict interlayer shear fatigue performance from rapid and simple static shear tests. In the wake of this discussion, a possible interrelationship between cyclic and static shear tests can be found by calculating the cyclic–static shear ratio resistance (C2S2R) parameter as follows:
C 2 S 2 R = τ 6 τ p e a k
where τ 6 is the shear stress level that leads to a fatigue life of 1 million cycles ( N f = 106) determined in a cyclic shear test, and τ p e a k is the interlayer shear strength determined in a static shear test.
Based on the shear-torque fatigue tests results reported in Figure 17 and the static Leutner test results reported in Figure 18, C2S2R values were calculated for the UN and FG interface types at 20 °C, as shown in Table 3.
The C2S2R values in Table 3 are roughly the same for UN and FG interfaces at 20 °C, specifically τ 6 is almost 10% of τ p e a k . From a practical point of view, an empirical correlation between static Leutner test and shear-torque fatigue test results could consist of multiplying the interlayer shear strength ( τ p e a k ) of the static Leutner test by 0.10 to obtain the cyclic shear strength at 1 million cycles ( τ 6 ) for this interface type at 20 °C. This means that an interface type characterized by τ p e a k of 1 MPa can withstand 1 million cycles at a cyclic shear stress level of 0.10 MPa. Bearing in mind the very limited number of tests, it can be concluded that the C2S2R parameter can be assumed approximately equal to 0.1 for GB/BBSG interface, with pure bitumen emulsion as the tack coat (with and without reinforcement), but a larger number of testing specimens is required to obtain statistically significant results.
However, it is expected that C2S2R values could depend on the interface type (i.e., interlocking effect and tack coat contribution). For example, the higher the interlocking effect, the higher the interlayer shear strength ( τ p e a k ) with static shear tests, but the same effect is not yet clear with cyclic shear tests because of their recent development. Therefore, further investigation on different interface types, different asphalt mixtures and with a larger number of repetitions are needed to find correlations between cyclic and static shear tests and confirm these interesting results. In the future, this would allow the use of the static Leutner test to evaluate shear fatigue performance, applying simple empirical correlations to the test results.

4. Conclusions

This study was performed to investigate the shear fatigue performance of geogrid-reinforced asphalt interlayers. To this end, a full-scale trial section was built with three different types of interface: unreinforced (UN), reinforced with a carbon fiber geogrid (CF) and reinforced with a glass fiber geogrid (FG). Cores were taken directly from the trial section to carry out shear-torque fatigue tests. Three different failure criteria (50% and 70% stiffness modulus value reduction and maximum phase angle) were used to analyze shear fatigue life of test data. Besides, static (i.e., monotonic) shear tests were carried out with the Leutner device on the same specimens in an attempt to find a relationship between cyclic and static shear tests.
Based on the experimental results, the following main conclusions can be drawn:
  • Shear-torque fatigue test results clearly ranked the studied materials, showing that the carbon fiber geogrid (CF) reinforced interface provides similar shear fatigue behavior to the unreinforced interface (UN). In contrast, a significant reduction in shear fatigue behavior is evident with the glass fiber geogrid (FG) reinforced interface.
  • As far as the temperature effect is concerned, it was observed that shear fatigue resistance significantly increases with decreasing temperature for the FG interface. Further research is needed to investigate the influence of temperature also for the CF interface.
  • Good correlations were found between maximum phase angle and 70% stiffness modulus value reduction failure criteria. The results indicate that even though these fatigue failure criteria were not originally developed to be used with double-layered reinforced specimens, they may still be useful in ranking the different reinforced interfaces and appear to be able to predict the actual interlayer shear fatigue life.
  • Static Leutner test results showed that the interlayer shear strength ( τ p e a k ) decreases with increasing temperature and with the presence of the FG geogrid.
  • A promising correlation was found between the shear-torque fatigue test and the static Leutner test results. Such an approach is worthy of further investigation but needs to be validated through extensive research activity.
In conclusion, these findings showed that a correct choice of geogrid could reduce the debonding effect that inevitably occurs by introducing a reinforcement system within asphalt pavement. Shear-torque fatigue tests have proved to be powerful tools for investigating the damage progress in double-layered reinforced asphalt specimens. Considering the crucial importance to properly select and assess the reinforcement system to be inserted in asphalt pavements, this test method could provide useful information on the interlayer bonding condition and interlayer fatigue failure of reinforced systems under stresses and strains similar to those existing in a real pavement. However, the presented evaluation is very limited and needs to be deepened with an extended investigation.

Author Contributions

Conceptualization, F.C. and C.P.; formal analysis, D.R., F.C., F.A., C.P. and A.M.; investigation, D.R., C.P. and A.M.; resources, F.A., C.P. and A.M.; writing—original draft preparation, D.R.; writing—review and editing, F.C., C.P. and A.M.; supervision, C.P. All authors have read and agreed to the published version of the manuscript.

Funding

This research received no external funding.

Acknowledgments

The authors truly acknowledge S&P Clever Reinforcement Company and AfiTexinov for providing the reinforcing materials.

Conflicts of Interest

The authors declare no conflict of interest.

References

  1. Gudipudi, P.; Underwood, B.S.; Zalghout, A. Impact of climate change on pavement structural performance in the United States. Transp. Res. D Trans. Environ. 2017, 57, 172–184. [Google Scholar] [CrossRef]
  2. Underwood, B.S.; Guido, Z.; Gudipudi, P.; Feinburg, Y. Increased costs to US pavement infrastructure from future temperature rise. Nat. Clim. Change 2017, 7, 704–707. [Google Scholar] [CrossRef]
  3. Al-Qadi, I.L.; Elseifi, M.A. Field installation and design considerations of steel reinforcing netting to reduce reflection of cracks. In Proceedings of the 5th International RILEM Conference on Reflective Cracking in Pavements, Limoges, France, 5–8 May 2004; pp. 97–104. [Google Scholar]
  4. Button, J.W.; Lytton, R.L. Guidelines for using geosynthetics with hot-mix asphalt overlays to reduce reflective cracking. Transp. Res. Rec. J. Transp. Res. Board 2007, 2004, 111–119. [Google Scholar] [CrossRef] [Green Version]
  5. Zornberg, J.G. Functions and applications of geosynthetics in roadways. Procedia Eng. 2017, 189, 298–306. [Google Scholar] [CrossRef]
  6. Ferrotti, G.; Canestrari, F.; Virgili, A.; Grilli, A. A strategic laboratory approach for the performance investigation of geogrids in flexible pavements. Constr. Build. Mater. 2011, 25, 2343–2348. [Google Scholar] [CrossRef]
  7. Bocci, M.; Grilli, A.; Santagata, F.A.; Virgili, A. Influence of reinforcement geosynthetics on flexion behaviour of double-layer bituminous systems. In Proceedings of the International Conference on Advanced Characterisation of Pavement and Soil Engineering Materials, Athens, Greece, 20–22 June 2007; pp. 1415–1424. [Google Scholar]
  8. Francken, L. Prevention of cracks in pavements: Achievements and open questions. Road Mater. Pavement Des. 2005, 6, 407–425. [Google Scholar] [CrossRef]
  9. Shukla, S.K.; Yin, J.-H. Functions and installation of paving geosynthetics. In Proceedings of the 3rd Asian Regional Conference on Geosynthetics, Seoul, Korea, 21–23 June 2004. [Google Scholar]
  10. Uijting, B.G.J.; Jenner, C.G.; Gilchrist, A.J.T. Evaluation of 20 years experience with asphalt reinforcement using geogrids. In Proceedings of the 3rd International Conference Bituminous Mixtures and Pavements, Thessaloniki, Greece, 21–22 November 2002; pp. 869–877. [Google Scholar]
  11. Vanelstraete, A.; De Visscher, J. Long term performance on site of interface systems. In Proceedings of the 5th International RILEM Conference on Reflective Cracking in Pavements, Limoges, France, 5–8 May 2004; pp. 699–706. [Google Scholar]
  12. Brown, S.F.; Thom, N.H.; Sanders, P.J. A study of grid reinforced asphalt to combat reflection cracking. J. Assoc. Asphalt Paving Technol. 2001, 70, 543–569. [Google Scholar]
  13. Canestrari, F.; Belogi, L.; Ferrotti, G.; Graziani, A. Shear and flexural characterization of grid-reinforced asphalt pavements and relation with field distress evolution. Mater. Struct. 2015, 48, 959–975. [Google Scholar] [CrossRef]
  14. Correia, N.S.; Zornberg, J.G. Strain distribution along geogrid-reinforced asphalt overlays under traffic loading. Geotex. Geomembr. 2018, 46, 111–120. [Google Scholar] [CrossRef]
  15. Ferrotti, G.; Canestrari, F.; Pasquini, E.; Virgili, A. Experimental evaluation of the influence of surface coating on fiberglass geogrid performance in asphalt pavements. Geotex. Geomembr. 2012, 34, 11–18. [Google Scholar] [CrossRef]
  16. Ingrassia, L.P.; Virgili, A.; Canestrari, F. Investigating the effect of geocomposite reinforcement on the performance of thin asphalt pavements through accelerated pavement testing and laboratory analysis. Case Stud. Constr. Mater. 2020, 12, e00342. [Google Scholar] [CrossRef]
  17. Nejad, F.M.; Asadi, S.; Fallah, S.; Vadood, M. Statistical-experimental study of geosynthetics performance on reflection cracking phenomenon. Geotex. Geomembr. 2016, 44, 178–187. [Google Scholar] [CrossRef]
  18. Ragni, D.; Montillo, T.; Marradi, A.; Canestrari, F. Fast falling weight accelerated pavement testing and laboratory analysis of asphalt pavements reinforced with geocomposites. Lect. Notes Civil Eng. 2020, 48, 417–430. [Google Scholar] [CrossRef]
  19. Saride, S.; Kumar, V.V. Influence of geosynthetic-interlayers on the performance of asphalt overlays on pre-cracked pavements. Geotex. Geomembr. 2017, 45, 184–196. [Google Scholar] [CrossRef]
  20. Sobhan, K.; Tandon, V. Mitigating reflection cracking in asphalt overlay using geosynthetic reinforcements. Road Mater. Pavement Des. 2008, 9, 367–387. [Google Scholar] [CrossRef]
  21. Zofka, A.; Maliszewski, M.; Maliszewska, D. Glass and carbon geogrid reinforcement of asphalt mixtures. Road Mater. Pavement Des. 2017, 18, 471–490. [Google Scholar] [CrossRef]
  22. Caltabiano, M.A.; Brunton, J.M. Reflection cracking in asphalt overlays. J. Assoc. Asphalt Paving Technol. 1991, 60, 310–330. [Google Scholar]
  23. Canestrari, F.; Grilli, A.; Santagata, F.A.; Virgili, A. Interlayer shear effect of geosynthetic reinforcements. In Proceedings of the 10th International Conference on Asphalt Pavements, Québec City, QC, Canada, 12–17 August 2006. [Google Scholar]
  24. Canestrari, F.; Pasquini, E.; Belogi, L. Optimization of geocomposite for double layer bituminous system. In 7th RILEM International Conference on Cracking in Pavements; Scarpas, A., Kringos, N., Al-Qadi, I.A.L., Eds.; Springer: Dordrecht, The Netherlands, 2012; pp. 1229–1239. [Google Scholar] [CrossRef]
  25. Pasquini, E.; Bocci, M.; Ferrotti, G.; Canestrari, F. Laboratory characterisation and field validation of geogrid-reinforced asphalt pavements. Road Mater. Pavement Des. 2013, 14, 17–35. [Google Scholar] [CrossRef]
  26. Pasquini, E.; Bocci, M.; Canestrari, F. Laboratory characterisation of optimised geocomposites for asphalt pavement reinforcement. Geosynth. Int. 2014, 21, 24–36. [Google Scholar] [CrossRef] [Green Version]
  27. Raab, C.; Partl, M.N. Interlayer shear performance: Experience with different pavement structures. In Proceedings of the 3rd Eurasphalt and Eurobitume Congress, Vienna, Austria, 12–14 May 2004; pp. 535–545. [Google Scholar]
  28. Zamora-Barraza, D.; Calzada-Peréz, M.; Castro-Fresno, D.; Vega-Zamanillo, A. New procedure for measuring adherence between a geosynthetic material and a bituminous mixture. Geotex. Geomembr. 2010, 28, 483–489. [Google Scholar] [CrossRef]
  29. Canestrari, F.; Santagata, E. Temperature effects on the shear behaviour of tack coat emulsions used in flexible pavements. Int. J. Pavement Eng. 2005, 6, 39–46. [Google Scholar] [CrossRef]
  30. Jaskula, P.; Rys, D. Effect of interlayer bonding quality of asphalt layers on pavement performance. IOP Conf. Ser. Mater. Sci. Eng. 2017, 236, 012005. [Google Scholar] [CrossRef] [Green Version]
  31. Graziani, A.; Pasquini, E.; Ferrotti, G.; Virgili, A.; Canestrari, F. Structural response of grid-reinforced bituminous pavements. Mater. Struct. 2014, 47, 1391–1408. [Google Scholar] [CrossRef]
  32. Canestrari, F.; Ferrotti, G.; Lu, X.; Millien, A.; Partl, M.N.; Petit, C.; Phelipot-Mardelé, A.; Piber, H.; Raab, C. Mechanical testing of interlayer bonding in asphalt pavements. In Advances in Interlaboratory Testing and Evaluation of Bituminous Materials, RILEM State-of-the-Art Reports; Partl, M., Bahia, H.U., Canestrari, F., De la Roche, C., Di Benedetto, H., Piber, H., Sybilski, D., Eds.; Springer: Dordrecht, The Netherlands, 2013; Volume 9, pp. 303–360. [Google Scholar] [CrossRef]
  33. Petit, C.; Chabot, A.; Destrée, A.; Raab, C. Interface debonding behavior. In Mechanisms of Cracking and Debonding in Asphalt and Composite Pavements: State-of-the-Art of the RILEM TC241-MCD, RILEM State-of-the-Art Reports; Buttlar, W.G., Chabot, A., Dave, E.V., Petit, C., Tebaldi, G., Eds.; Springer International Publishing: Cham, Switzerland, 2018; pp. 103–153. [Google Scholar] [CrossRef]
  34. Petit, C.; Diakhaté, M.; Millien, A.; Phelipot-Mardelé, A.; Pouteau, B. Pavement design for curved road sections: Fatigue performance of interfaces and longitudinal top-down cracking in multilayered pavements. Road Mater. Pavement Des. 2009, 10, 609–624. [Google Scholar] [CrossRef]
  35. Ktari, R.; Millien, A.; Fouchal, F.; Pop, I.-O.; Petit, C. Pavement interface damage behavior in tension monotonic loading. Constr. Build. Mater. 2016, 106, 430–442. [Google Scholar] [CrossRef]
  36. Ragni, D.; Graziani, A.; Canestrari, F. Cyclic interlayer testing in bituminous pavements. In Proceedings of the 7th International Conference Bituminous Mixtures and Pavements, Thessaloniki, Greece, 12–14 June 2019; pp. 207–212. [Google Scholar] [CrossRef]
  37. Canestrari, F.; Attia, T.; Di Benedetto, H.; Graziani, A.; Jaskula, P.; Kim, Y.R.; Maliszewski, M.; Pais, J.; Petit, C.; Raab, C.; et al. Interlaboratory test to characterize the cyclic behavior of bituminous interlayers: An overview of testing equipment and protocols. In Proceedings of the RILEM International Symposium on Bituminous Materials, Lyon, France, 14–16 December 2020. [Google Scholar]
  38. Romanoschi, S.A.; Metcalf, J.B. Characterization of asphalt concrete layer interfaces. Transp. Res. Rec. J. Transp. Res. Board 2001, 1778, 132–139. [Google Scholar] [CrossRef]
  39. Diakhaté, M.; Phelipot, A.; Millien, A.; Petit, C. Shear fatigue behaviour of tack coats in pavements. Road Mater. Pavement Des. 2006, 7, 201–222. [Google Scholar] [CrossRef]
  40. Donovan, E.P.; Al-Qadi, I.L.; Loulizi, A. Optimization of tack coat application rate for geocomposite membrane on bridge decks. Transp. Res. Rec. J. Transp. Res. Board 2000, 1740, 143–150. [Google Scholar] [CrossRef]
  41. Cho, S.H.; Safavizadeh, S.A.; Kim, Y.R. Verification of the applicability of the time–temperature superposition principle to interface shear stiffness and strength of GlasGrid-reinforced asphalt mixtures. Road Mater. Pavement Des. 2017, 18, 766–784. [Google Scholar] [CrossRef]
  42. Safavizadeh, S.A.; Kim, Y.R. DIC technique to investigate crack propagation in grid-reinforced asphalt specimens. J. Mater. Civil Eng. 2017, 29. [Google Scholar] [CrossRef]
  43. Raab, C.; Arraigada, M.; Partl, M.N.; Schiffmann, F. Cracking and interlayer bonding performance of reinforced asphalt pavements. Eur. J. Environ. Civ. Eng. 2017, 21, 14–26. [Google Scholar] [CrossRef]
  44. Arraigada, M.; Perrotta, F.; Raab, C.; Tebaldi, G.; Partl, M.N. Use of APT for validating the efficiency of reinforcement grids in asphalt pavements. In The Roles of Accelerated Pavement Testing in Pavement Sustainability; Aguiar-Moya, J., Vargas-Nordcbeck, A., Leiva-Villacorta, F., Loría-Salazar, L., Eds.; Springer International Publishing: Cham, Switzerland, 2016; pp. 509–521. [Google Scholar] [CrossRef]
  45. Canestrari, F.; D’Andrea, A.; Ferrotti, G.; Graziani, A.; Partl, M.N.; Petit, C.; Raab, C.; Sangiorgi, C. Advanced interface testing of grids in asphalt pavements. In Testing and Characterization of Sustainable Innovative Bituminous Materials and Systems, RILEM State-of-the-Art Reports; Partl, M., Porot, L., Di Benedetto, H., Canestrari, F., Marsac, P., Tebaldi, G., Eds.; Springer International Publishing: Cham, Switzerland, 2018; pp. 127–202. [Google Scholar] [CrossRef]
  46. NF EN 13285. French Standards for Unbound Mixtures–Material Specifications.
  47. NF EN 13108-1. French Standards for Bituminous Mixtures–Material Specifications–Part 1: Asphalt Concrete.
  48. Petit, C.; Lesueur, D.; Millien, A.; Leguernevel, G.; Dopeux, J.; Picoux, B.; Allou, F.; Terhani, F. Smart geosynthetics for strain measurements in asphalt pavements. In Proceedings of the 13th International Conference on Asphalt Pavements, Fortaleza, Brazil, 19–21 June 2018. [Google Scholar]
  49. Petit, C.; Lesueur, D.; Millien, A.; Leguernevel, G.; Dopeux, J.; Picoux, B.; Allou, F.; Terhani, F. Des géosynthétiques intelligents pour renforcer et suivre les déformations de chaussées bitumineuses. In Proceedings of the 12th Rencontres Géosynthétiques, Nancy, France, 11–13 March 2019. [Google Scholar]
  50. EN 12697-6. European Standards for Bituminous Mixtures–Test Methods for Hot Mix Asphalt–Part 6: Determination of Bulk Density of Bituminous Specimens.
  51. Ragni, D.; Takarli, M.; Petit, C.; Graziani, A.; Canestrari, F. Use of acoustic techniques to analyse interlayer shear-torque fatigue test in asphalt mixtures. Int. J. Fatigue 2020, 131, 105356. [Google Scholar] [CrossRef]
  52. Ragni, D.; Ferrotti, G.; Petit, C.; Canestrari, F. Analysis of shear-torque fatigue test for bituminous pavement interlayers. Constr. Build. Mater. 2020, 254, 119309. [Google Scholar] [CrossRef]
  53. Shen, S.; Lu, Z. Energy based laboratory fatigue failure criteria for asphalt materials. J. Test. Eval. 2011, 39, 313–320. [Google Scholar] [CrossRef]
  54. Reese, R. Properties of aged asphalt binder related to asphalt concrete fatigue life. J. Assoc. Asphalt Paving Technol. 1997, 66, 604–632. [Google Scholar]
  55. Leutner, R. Untersuchung des schichtenverbundes beim bituminosen oberbau. Bitumen 1979, 41, 84–91. [Google Scholar]
  56. prEN 12697-48. European Pre-Standard for Bituminous Mixtures–Test Methods for Hot Mix Asphalt–Part 48: Interlayer Bonding.
  57. Boudabbous, M.; Millien, A.; Petit, C.; Neji, J. Energy approach for the fatigue of thermoviscoelastic materials: Application to asphalt materials in pavement surface layers. Int. J. Fatigue 2013, 47, 308–318. [Google Scholar] [CrossRef]
  58. Di Benedetto, H.; De la Roche, C.; Baaj, H.; Pronk, A.; Lundström, R. Fatigue of bituminous mixtures. Mater. Struct. 2004, 37, 202–216. [Google Scholar] [CrossRef]
  59. Pérez-Jiménez, F.; Botella, R.; López-Montero, T.; Miró, R.; Martínez, A.H. Complexity of the behaviour of asphalt materials in cyclic testing. Int. J. Fatigue 2017, 98, 111–120. [Google Scholar] [CrossRef]
  60. Diakhaté, M.; Millien, A.; Petit, C.; Phelipot-Mardelé, A.; Pouteau, B. Experimental investigation of tack coat fatigue performance: Towards an improved lifetime assessment of pavement structure interfaces. Constr. Build. Mater. 2011, 25, 1123–1133. [Google Scholar] [CrossRef] [Green Version]
  61. Collop, A.C.; Sutanto, M.H.; Airey, G.D.; Elliott, R.C. Development of an automatic torque test to measure the shear bond strength between asphalt. Constr. Build. Mater. 2011, 25, 623–629. [Google Scholar] [CrossRef]
  62. Corte, J.-F.; Goux, M.-T. Design of pavement structures: The French technical guide. Transp. Res. Rec. J. Transp. Res. Board 1996, 1539, 116–124. [Google Scholar] [CrossRef]
Figure 1. Distribution of vertical stress: (a) unreinforced pavement; (b) reinforced pavement.
Sustainability 12 04381 g001
Figure 2. Detail of the installed geosynthetics: (a) CF carbon fiber geogrid; (b) FG glass fiber geogrid.
Sustainability 12 04381 g002
Figure 3. Full-scale trial section: (a) installation of CF carbon fiber geogrid; (b) installation of FG glass fiber geogrid; (c) completed trial section; (d) cross-section of the trial section.
Sustainability 12 04381 g003
Figure 4. (a) Detail of the trial section after coring; (b) cored specimen.
Sustainability 12 04381 g004
Figure 5. Shear-torque fatigue test.
Sustainability 12 04381 g005
Figure 6. Determined failure point by different criteria: (a) material modulus approach; (b) phase angle approach.
Sustainability 12 04381 g006
Figure 7. Initial norm of the complex shear modulus | G * | 0 vs. applied shear stress amplitude τ m a x , 0 .
Sustainability 12 04381 g007
Figure 8. Evolution of normalized norm of complex shear modulus | G * | n and phase angle φ of specimen FG_7 during the shear-torque fatigue test at 10 Hz and 10 °C.
Sustainability 12 04381 g008
Figure 9. Evolution of normalized norm of complex shear modulus | G * | n of FG interface at various torque amplitudes T 0 during the shear-torque fatigue test at 10 Hz and 10 °C.
Sustainability 12 04381 g009
Figure 10. Evolution of phase angle φ of FG interface during the shear-torque fatigue test at 10 Hz and two temperatures (10 and 20 °C).
Sustainability 12 04381 g010
Figure 11. Failure mechanism of FG reinforced specimens at the end of shear-torque fatigue test.
Sustainability 12 04381 g011
Figure 12. Interlayer shear fatigue curves for UN interface type at 20 °C.
Sustainability 12 04381 g012
Figure 13. Interlayer shear fatigue curves for CF interface type at 20 °C.
Sustainability 12 04381 g013
Figure 14. Interlayer shear fatigue curves for FG interface type at 20 °C.
Sustainability 12 04381 g014
Figure 15. Interlayer shear fatigue curves for FG interface type at 10 °C.
Sustainability 12 04381 g015
Figure 16. Interlayer shear fatigue curves for all interface types.
Sustainability 12 04381 g016
Figure 17. τ 6 values for all interface types.
Sustainability 12 04381 g017
Figure 18. Average interlayer shear strength ( τ p e a k ) from static Leutner tests at 10 and 20 °C for UN and FG specimens with a diameter of 150 mm (error bars provide the variability of the results).
Sustainability 12 04381 g018
Table 1. Testing program.
Interface
Type
Diameter (mm)Shear-Torque Fatigue Test Replicates (#)Static Leutner Test Replicates (#)
20 °C; 10 Hz10 °C; 10 Hz20 °C; 50.8 mm/min10 °C; 50.8 mm/min
UN1005---
150--33
CF1004---
FG10053--
150--33
Total14366
Table 2. Parameters a and b for all interface types according to Equation (8).
Interface TypeTemperature (°C)Failure CriterionabR2
UN20 N 50 1.124−0.1520.987
N 70 1.000−0.1370.981
N φ m a x 1.028−0.1390.979
CF20 N 50 1.259−0.1620.986
N 70 1.355−0.1660.988
N φ m a x 1.280−0.1620.991
FG20 N 50 0.712−0.1580.874
N 70 1.018−0.1840.911
N φ m a x 0.937−0.1760.889
FG10 N 50 0.861−0.1050.984
N 70 0.900−0.1070.991
N φ m a x 0.909−0.1080.992
Table 3. Cyclic–static shear ratio resistance (C2S2R) parameter.
Interface TypeTemperature (°C) τ 6   ( MPa ) τ p e a k   ( MPa ) C2S2R (-)
UN200.151.310.12
FG200.080.760.11

