Article

Key Factors Influencing Purchase or Rent Decisions in Smart Real Estate Investments: A System Dynamics Approach Using Online Forum Thread Data

by
Fahim Ullah
and
Samad M. E. Sepasgozar
*
Department of Construction Management and Property, Faculty of Built Environment, University of New South Wales Sydney, Kensington NSW 2052, Australia
*
Author to whom correspondence should be addressed.
Sustainability 2020, 12(11), 4382; https://doi.org/10.3390/su12114382
Submission received: 12 May 2020 / Revised: 21 May 2020 / Accepted: 21 May 2020 / Published: 27 May 2020

Abstract

:
The real estate sector is receiving mix responses throughout the world, with some countries like USA receiving lesser and European and Asia Pacific markets receiving more transactions in recent years. Among the concerning factors, post-purchase regrets by the real estate owners or renters are on the rise, which have never been assessed to date through scholarly research. These regrets can further increase in the time of lockdowns and bans on inspections due to Corona Virus Disease 2019 (COVID-19) and social distancing rules enforced by various countries such as Australia. The current study aims at investigating the key post-purchase regret factors of real estate and property owners and renters over the last decade using published literature and online threads. Based on pertinent literature, 118 systematically identified and text-mined articles, and four online threads with 135 responses, the current study develops system dynamics models to assess and predict the increase in consumers’ regrets over the last decade. Further, a user-generated thread with 23 responses involving seven real estate managers and five agents with more than 20 years of experience, 10 buyers with at least three successful rentals or purchases, and a photographer with more than 10 years of experience, is initiated on five online discussion platforms whereby the respondents are involved in a detailed discussion to highlight the regret reasons specific to real estate purchases based on online information. General architecture for text mining (GATE) software has been utilised to mine the text from both types of threads: Published and user generated. Overall, the articles and threads published over the last decade are studied under two periods: P1 (2010–2014) and P2 (2015–2019) to highlight the post-purchase or rent-related regret reasons. The results show that regret levels of the real estate consumers based on published post-purchase data are at an alarmingly high level of 88%, which compared to 2015, has increased by 18%. Among the major cited reasons, complicated buy–sell process, lack or accuracy of information, housing costs, house size, mortgages, agents, inspections, and emotional decision making are key reasons of regret. Overall, a total of 10% and 8% increases have occurred in the regrets related to the buy–sell process and lack of inspections, respectively. On the other hand, regrets related to agents and housing costs have decreased drastically by 40% mainly due to the good return on investments in the growing markets. However, based on the current trend of over reliance on online information and more powers to the agents controlling online information coupled with lack of physical inspections, the situation can change anytime. Similarly, lack of information, housing size, and mortgage-related regrets have also decreased by 7%, 5%, and 2%, respectively, since 2019. The results are expected to encourage policy level changes for addressing the regrets and uplifting the real estate industry and moving towards a smart and sustainable real estate sector. These results and pertinent discussions may help the real estate decision makers to uplift the current state, move towards a smart real estate, and avoid futuristic regrets, especially in the COVID-hit environment where most of the industries are struggling to survive. Careful attention is required to the top regret factors identified in the study by the real estate managers, investors, and agents to pave the way for a more managed real estate and property sector whereby the consumers are more satisfied with the value they receive for their money. This win–win situation will enhance the property business and remove the stigmas of intentional and deliberate withholding of information by managers and agents from the property and real estate sectors that can help boost the business through more purchases and satisfaction of its customers.

1. Introduction and Background

The real estate sector is evolving and adding considerable fortune to the global economy. A report by Morrison and Phillips [1] states that global real estate transaction for commercial properties is valued at $873 billion in 2017 with a 6% rise in Asia Pacific and 8% rise in European markets. Such a rise is offsetting the decline in the US market. Similarly, a total of $375.6 billion has been invested through transactions greater than $10 million in the US during 2017 depicting an 8% decline as compared to 2016 with the second consecutive yearly recession. The slowdown is associated with increasing prices throughout the year in the major cities as well as the three-times revised and raised interest rates. According to Statista [2], following the financial crises in 2008 where the prices fell dramatically, housing sales have been rising since 2009 until 2015. However, 2016–2017 observed a decline in the trend, with the overall investments decreasing from $549 in 2015 to $499 in 2016 and $467 in 2017. Of the many reasons involved in the lack of real estate investments, the existing house owners’ or renters’ regrets are influencing other investors’ decision to invest [3,4]. Such regrets can exponentially increase in current times due to the lockdowns and ban on inspections in countries such as Australia where renters and buyers are asked to virtually inspect the properties to comply with social distancing rules and regulations, which is expected to bring further decline in the property and real estate markets in a COVID-hit environment. Thus, in the era of virtual visits and home-based properties sections, the regrets related to the quality of the information provided through online sources can only increase if not addressed promptly, smartly, and diligently. Therefore, it is imperative for real estate managers and investors to address the service consumers’ (buyers or renters) regrets if the sector aims at moving towards a sustainable and smart real estate where the disruptions to business are minimum, if not eliminated [5]. Owing to this gap, the current study aims at assessing the prevalent regrets by real estate consumers using literature published over the last decade and online threads. The objectives are to identify the pertinent regrets related to real estate rent or buy decisions from the consumers’ perspective and present mitigation measures based on existing literature and online threads.
Regret is a negative and cognitive emotion experienced by a person when they realise or imagine that their current situation would have been better had they decided differently. It is thought to be the second most frequent and the most intense negative emotion experienced by product consumers [6]. Regrets are generally experienced when a product or service does not meet the expectation of a customer [7]. In the era of globalisation and continuous striving for sustainability in various sectors, it is imperative to eliminate or at least minimise the regrets related to various aspects of services and products, and the real estate sector is no exception to this. As such, the aspects of cultural inclusions in residential buildings and resorts for smart real estate development and urbanisation [8], energy-efficient and green technologies introduction [9], development of sustainability indices for real estate projects [10], and a “no regret” policy for moving towards smart and sustainable societies [11] are some of the merging points for sustainability in real estate, which requires elimination of the consumers’ regrets. According to Chia et al. [12], the gap between buyers’ expectations and product attributes information provided by the real estate seller, and agents decrease the customers’ satisfaction that in turn increases their post-purchase regrets. Such dissatisfaction leads to customers regretting their purchases, and resultantly, there is a high volume of regrets related to real estate purchase or rent decisions, which is bad for the businesses in the longer run and require attention if the aim is to be sustainable and long-lasting. These regrets must be minimized, if not eliminated, if the real estate sector wants to transform into a globally sustainable and smart real estate [5,13,14]. Among the decision regrets, 25% of people regret their decisions mainly due to neighbourhood information, parking and transportation issues, renovation ambitions, price, and lenders’ requirements [15,16]. Similarly, other regrets sources include emotional attachments to locality, poor quality or lack of information about the property, the need to know the neighbourhood, lack of inspections, poor organizations and bad real estate agents, hidden housing fees and costs, house design, size, and layouts [6,17,18,19,20,21,22,23]. Although the aforementioned researche highlight some of the prominent regrets relevant to customers’ purchase or rent decisions in general, specific real estate purchase or rent regret factors in the form of holistic temporal research, do not exist to date. Thus, taking this as an opportunity, the current study through help from online articles, published literature, web pages, threads, and blogs and meta-analysis follows a holistic approach to highlight, analyse, and discuss the key factors related to real estate consumers regrets over the last decade. As such, a total of eight key regret factors have been focused on in this study that include not enough information (NEI), complicated buy/sell process (BS), house size (HS), housing costs (HC), mortgage (MT), emotion (EM), agents (AG), and inspection (IP), which are subsequently discussed.

1.1. Not Enough Information (NEI)

According to the leading real estate website Trulia [24], based on a survey of 2264 US adults, as much as 44% of American house owners have regrets about the purchase decisions or the process of selection and investment due to poor quality or lack of information provided to them. Also, 9% of parents of children below 18 years versus 6% with children above 18 wished they had more information about the neighbourhood, whereas 13% of parents of school-aged children wished they had chosen a neighbourhood with better school. Bloom [25] links the lack of information to the unsuitability of the property for the need resulting into bad investments. According to Woodruff [26], 14% of homeowners wished they should have vetted their neighbourhood more, and 15% wished they had picked one closer to work. Geffner [27] reports 25% of homebuyers wished to have researched their new neighbourhood or neighbours whereas 14% wished they had researched local schools. Similarly, according to Leigh [28], 15% of homeowners wish they had chosen a home with a shorter commute to work whereas 21% homeowners wish they had shopped around more before making a decision on a house.
According to the study of Chen et al. [29], lack of effort in decision accounted for large part of cases concerning housing regret (45%). This include sales service quality issues (13.9%) and engineering quality (5.9%). Heffter [30] states that 25% of the people with regrets said they do not like their neighbourhood and wished they had more information about it before deciding to buy or rent. Similarly, Of the 24% who cited lessons learned related to lack of information, 12% wished for bigger yards, and 12% wished they had easier yards to maintain. Further, nearly 17% of first-time buyers with regrets wished they had a different parking situation and having more information about it. According to Ullah and Sepasgozar [31], information technology and disruptive digital technologies can help mitigate most of these regrets. The need for high-quality information has become more and more important in the era of sustainable development and focus on sustainability. Companies around the globe are required to disclose or present their sustainability-related information to the governments. Such sustainability-related non-financial information is increasingly deemed value relevant and widely sought after by investors globally to have wider business options [32]. Many investors have proposed the mandatory disclosure of sustainability information in the form of environmental, social, and governance data to address the regrets of potential customers [33]. Further, such information may help motivate the consumers to resume the purchase or rent process amid the COVID-19 imposed restrictions on property inspections.

1.2. Complicated Buy/Sell Process (BS)

Complicated and tricky buy/sell process (BS) is another highly reported source of real estate regrets. Researchers have reported BS to be stressful, complicated, and intimidating [34]. Twenty percent of homebuyers have regrets about some aspect of the home buying process [35]. A total of 44% of Americans have regrets about their current home or the process they went through when choosing it [24]. Kolko [36] reports 52% of people regret something about their current home or the process of choosing it. This includes 56% of renters versus 50% of homeowners. According to Kearns [34], if they were to go through the home-buying process again, nearly half of American homeowners (49%) would do something differently. Similarly, roughly three in five millennials (57%) and Gen X (61%) homeowners indicated having regrets, saying they would do things differently the next time around in the home-buying process, in comparison to only 38% of baby boomers. Further, 16% respondents reported that they would do more research on the home buying process.
Not only is the BS complicated, but it usually takes a lot of time as highlighted by Marte [7]. The author states that among millennials, 19% of homeowners were surprised by how long it took to buy a house. Another article states 80% of homebuyers have a major regret about their new home because of the mismanaged process [27]. Similarly, according to Leigh [28], 38% of homeowners wished they had a better grasp on the buying and selling process when purchasing their home. Further, 55% of home buyers wish they would have purchased a home sooner to avoid wasting money on rent. The author insists to ensure that you are well versed on the intricacies of making a real estate purchase before you get pressured into a deal. Shimizu et al. [37] distribute BS process into four key steps consisting of the property listing, offer placement, post mortgage price approvals, and associated registry prices. Hidden costs and problems are encountered during these steps that often induce regrets. Nelson [38] states premature buying as a key reason to regretting the purchase in terms of the buying process. According to Chen et al. [39], the BS-process-related regrets can be considerably reduced through proper promotions and performances of the functional, investments, and financial alternatives. Similarly, Sangkakoon et al. [40] highlight the role of recommendations, friends, and family, specifically spouse, children, and elders, being influential in real estate BS process. The group acts as an influencer to the decision and dictates the majority of it. Children are the most influential followed by spouses, elders, and friends. Such emotional dictations incline the buyers to oversee some problems associated with the BS process eventually ending up regretting their decisions. In the current times where the BS process is abruptly changing to adopt the new normal based on social distancing and restrictions, the regrets may increase due to the complexities, nascency, and lack of clarity involved in the new BS process. This requires intelligent and smart handling of the BS process by the real estate agencies and managers. Introduction of guidelines, explanations on the usage of online sources and tools, and access to contact the owners and agents of the properties through distance-based approaches such as over the phone access may help curtail the BS regrets. Further, in the era of increased sustainability demands and more sustainability-conscious consumers, it is imperative to make the BS process more user friendly and easy to use [41]. The BS process can be made more sustainable and interesting by adding sustainability-related information and video tutorials on usage mechanisms that can help promote local business sustainability by promoting sales and rents of local products and buildings [42]. Such information can help potential consumers make better and more-informed rent or buy decisions based on high-quality data and easier purchase process, which can reduce the consumers’ regrets [3].

1.3. House Size (HS)

House size (HS) has been one of the oldest concerns whereby people regret their dream home selection after some time due to lack of space [23]. As Marte [7] states, when it comes to HS, “on not pigeonhole yourself into one area”. Similarly, Beltrame [43] highlights that 54% of first-time buyers want a single, detached home, which is often impractical. One in five high-income Americans (20%) wished they had a larger (16%) or smaller (4%) home [24]. Similarly, 20% of Gen X homeowners, like millennials (19%), wished they purchased a bigger home whereas 12% said the amenities/features they valued when they purchased their home were no longer worth the price today [34]. Forty-two percent say that they picked a place to live that was either too large (9%) or too small (33%) [44]. Nearly 16% said their home was too small whereas more than 9% said their home did not have enough storage or closet space [27]. Heffter [30] reports that 62% of respondents wished their homes were bigger or laid out differently. They wish they had bigger kitchens, more storage space, or just more space in general. Similarly, according to Kolko [36], 39% of renters regret choosing a smaller home.
HS influences the demographics and residential housing decisions. According to Omagwa and Aduda [45], HS is one of the key search parameters during property hunting, followed by funding constraints, location of the house, and choice of neighbourhood. Similarly, Viggers et al. [46] highlight that the larger houses are built to cope with the market demands that may present challenges to its owners. These include paying higher mortgages, greater energy consumptions and bills, greater renovation costs, more carbon footprints, and eventually compromising the occupants’ health. The authors suggest a balance between size and affordability. Similarly, criticising the overly large HS in New Zealand, Khajehzadeh and Vale [47] argue that in eight-bedroom houses, the space allocated is usually 1.3 times more to the bedrooms, 1.8 times to sanitary, and 3.64 times to circulations as compared to four bedrooms house. This space is seldom used and usually goes unoccupied. In the face of growing efficient resource utilisation and related sustainability concerns, it is imperative to take the usability and sustainability into account in house sizes. As such, property features related to sustainability must also be disclosed along with the house size and details in the information made available to the prospective buyers or renters. Currently, as stated by Wong et al. [48], Australian real estate agents are more focused on promoting general housing features (i.e., house size) but not actively promoting sustainability features to the potential sellers/buyers. As such, features such as water sustainability [49], environmentally friendly materials, solar panels, and smart electric gadgets [50] and other sustainability features, if added to property details, can help minimize their regrets. Similarly, another important aspect that needs to be handled with dexterity is the photographic manipulation and virtual furnishing of properties. For example, the agents, with the help of expert photographers and virtual furnishing experts, place furniture in properties that are not practical in the dimensions of the room or space. The customers are motivated by such furnishings and expect to place similar items in the space, end up finding the space too small for such furniture after purchasing or renting it, which increases the regrets related to house size and space. This can further enhance in the COVID-hit environments where physical inspections are banned, and the customers must rely on online information, thus making them more vulnerable to such manipulations.

1.4. Housing Costs (HC)

Housing costs (HC), like HS, has been traditionally regretted by the buyers [21]. According to Nelson [38], a key reason for regretting real estate purchase decision is buying a home you cannot truly afford. The homeownership rate fell to 63.4% in 2017, marking the 12th consecutive year of declines as prices in many markets have continued to go up but wages have not [25]. The situation is expected to worsen due to COVID-19 and to cause significant job losses. Among the surveyed people, 62% believe housing costs have become less affordable since 2012—of which 26% say it is much less affordable [24]. According to Kearns [34], 11% of millennial homeowners said they no longer felt financially secure after purchasing their home. Similarly, 28% said they should have saved more money before buying whereas 18% said they should have shopped around more for a home loan. Marte [7] reports that 41% of homeowners said they were not aware of all their loan options. About 15% said they were surprised by hidden fees. According to Leigh [28], 60% of new home buyers wish they had made a bigger down payment, which would likely require more time to save before getting locked into a mortgage. Heffter [30] reports that 40% of first-time buyers with regrets said they either paid too much or should have put more money down on their new homes. More than one-third (38%) said they were surprised by how much it costs to maintain their new homes, and 20% were surprised by the cost of closing the deals. Similarly, 29% of those surveyed said they did not budget for ongoing costs, such as maintenance and utilities. According to Beltrame [43], one in eight respondents said they overlooked some of the one-time fees associated with buying, such as inspection and legal fees, title insurance, and land transfer taxes, depending on the home price. Willets [51] comments on the poor housing affordability state and highlights that only 1 in 10 couples under 40 with children can afford to buy a home. Of those who could afford a house, 80% of first-time buyers under 30 had help from their families. Overall, the houses have become 50% less affordable. Similarly, talking about the sellers, 57% reduced the asking price at least once while their home was listed [52]. In the times of lockdowns and serious job losses in many countries such as Australia where the government have introduced financial packages to assist people who are mostly affected by job losses due to COVID-19, fair pricing for houses cannot be overstressed. Fair pricing, a significant component of the economic aspect of sustainability can help minimise the real estate consumers regrets. Further house owning or renting costs such as transaction costs and hidden fees [3], operational costs such as energy optimisations [19], green materials usage [53], and transparency of associated costs by the agencies such as legal fees and rental bonds [3,54] can help eliminate or minimise the cost-related regrets of the consumers to help establish and continue a more sustainable and smart real estate business.

1.5. Mortgage (MT)

Increasing mortgage (MT) is another concern and regret source for real estate consumers [22]. A total of 27% of millennial homeowners reported borrowing at a mortgage rate they thought they could afford when they purchased their current home [34]. Of their lessons learned about costs, 20% wish they had negotiated more on price, and 14% wish they had shopped around more for a reasonable mortgage [30]. According to Willets [51], a 25% increase has occurred in mortgages over the last couple of years. Thus, 60% of new home buyers wish they should have made a bigger down payment, which would likely require more time to save before getting locked into a mortgage [28]. Similarly, 20% of people reported getting the wrong mortgage [35]. Beltrame [43] reports 60% surveyed people not putting down a bigger down payment, and not thinking hard enough about the associated costs of home ownership. Cerutti et al. [55] distribute mortgages into various types based on loan to value, maturity term, interest type, funding model, degree of lender recourse, and tax interest. Further, the mortgage distribution is linked to house affordability and seven-year mortgage in Turkey is compared to 45 years in Sweden by the authors. The authors argue that a median mortgage of 25 years hinders home affordability and promotes real estate price booms. Further, by comparing 56 countries, the authors conclude that mortgages are variable in 30, fixed in 12, and mixed in 14 countries. This inconsistency increases the risks and promotes real estate price booms thereby increasing consumers regrets.
Glaeser et al. [56] highlight high interest rates and lesser down payments as key home buyers’ regrets in China. Further, the banks are motivated to discourage house purchases by the government thereby providing adjusted mortgage rates that increase the consumers’ regrets. Comparing it with the US market, the authors argue that US policies encourage mortgage-based purchase whereas the Chinese policies discourage it. However, it is surprising to see far higher growth in Chinese housing markets as compared to other countries [57]. Similarly, in their study for Switzerland, Basten and Koch [58] concluded that with higher house prices, the mortgages also increase and vice versa. However, such an increase does not increase the loan to value ratio as the value usually increases with prices. In the current times, where businesses are suffering and some are forced to shut down to avoid or minimise face-to-face interactions between people in the COVID-hit environment, it is necessary to devise strategies that are long term and sustainable as the end time for lifting of the imposed restrictions is not foreseeable in the near future. The banks and lending institutions may need to provide additional supports and lesser interest rates for people to be able to keep up with the payment schedules, thus making the business more sustainable. As such, researchers have discussed various aspects such as the financial sustainability and mortgage affordability for senior homeowners [59], private and charity enterprise financing for tackling mortgages [60], and cost savings or finance generations through sustainable features of properties such as bitcoin houses [5] and other means that can offset the burdens of mortgages and help eliminate the consumers regrets. Further, steps such as easing of mortgages and pausing repayments for six months that can be paid in easy interest-free instalments at a later time are some positive steps by the Australian government in the direction of helping real estate business and consumers fight the global pandemic and help rise above the effects of COVID-19-induced financial struggles.

1.6. Emotion (EM)

Emotion (EM) and emotional attachments have been reported recently to play their part in promoting real estate regrets [61]. According to Bloom [44], a key reason for increasing regrets is that people make decisions based on emotions (90%) rather than investment attraction (10%). Due to emotional attachments, there may be a trade-off between sustainability characteristics and functional performance of products and services. The choice, given this trade-off, depends upon the degree to which consumers value sustainability that, in turn, is mediated by consumers’ feelings of confidence and guilt [62]. However, the roles of emotions may not always be negative; instead, in some cases, it can help in promoting sustainable communities as well [63]. In a survey conducted by Herbertson [64], it is reported that 33% of respondents fell in love with property and missed the details to later regret their decisions due to emotional decision-making. Similarly, 11% of people were impatient and tired of looking around for properties and made emotional decisions. Kearns [34] reports that out of the regretful people, 10% thought they should have waited longer before buying a home. Besbris [65] observed the relation between real estate buyers and agents for 27 months and highlight three processes through which emotions are evoked in the buyers. These include individualised matching, highlighting, and sequencing of the market scarcity to the buyers by the agents. The intermediary agencies play a crucial role in inducing and ensuring that these emotions are sustained for continued economic transactions. However, for the consumers, such emotions are not always positive and may induce poor decisions leading to regrets. Similarly, Clark et al. [66] discusses the place attachment and neighbourhood affiliation factors leading to emotional attachments. People, when developing such emotions, tend to pay more for the specific neighbourhood. This is sometimes manipulated by the agencies and the buyer may end up paying more than the recommended price thereby inducing regrets. Similarly, the contexts of safety, social interactions, and living closer to the friends and family also induces emotional attachments to specific neighbourhoods that may lead to an emotional decision [67]. Such emotional decision making can be increased in the era of COVID-19 where people wanting to stay closer to family members, sticking to a specific neighbourhood, and the inability to inspect the properties physically are prone to making emotional and ill-informed decisions, relying solely on information fed to them through online means, which can increase the regrets.

1.7. Agents (AG)

Agents (AG) play an important role in ensuring proper inspections, supporting the consumers, and linking the sellers and buyers. According to Mayfield [52], 83% of consumers would use their agent again due to their support and help. Similarly, the sellers using agents did not need to lower their demand prices and their houses were sold at 96% of the list price compared to others who had to reduce the price too much. However, on the other hand, if the agents are not good, it can lead to additional costs and dissatisfaction. According to Leigh [28], 9% of the interviewed regretting homeowners wish they had spent more time researching and interviewing real estate agents and agencies before selecting one. A recent boom of real estate agents has flooded the industry with many inexperienced agents that reduce purchase efficiency and increases regrets. Barwick and Pathak [68] argue that such entries reduce the average service quality provided to the consumers and, as a result, regrets are on the rise. The authors suggest reducing the commissions by 50% for a 73% increase in average agents’ transactions and 33% social savings to uplift the real estate industry. Similarly, talking about the moral hazards associated with company-owned agents, Munneke et al. [69] argue that due to the involvement of the stakes of company, associated agents may face moral hazards that result in elevated prices and liquidity for consumers that can promote regrets. Further, externally hired agents enjoy superior selling abilities and the moral hazards can be offset since there are no personal stakes involved. Besbris [65] concludes that the clustering of agents around certain neighbourhoods promotes assets and place inequality. The prices are generally elevated, and houses are upsold, which creates regrets among buyers. In terms of sustainability, agents can play a significant role. When launching new real estate products, the investors, developers, and estate agents are challenged to “think outside the box” for promoting sustainability and business innovativeness. The attitude of agents not actively promoting sustainability features may affect potential sellers/buyers not realising the importance of choosing a home with sustainability features [70]. In this context, policy measures such as the mandatory disclosures of sustainability policy by the Queensland State Government in Australia are positive steps towards promoting a smart and sustainable real estate sector that can increase homebuyers awareness about sustainability and help them make better and informed decisions [71]. Further, in the current times of restrictions on physical inspections and social distancing, most of the control and information disclosure powers are in the hands of the agents, who can manipulate the data fed to consumers. The consumers based on such manipulated data and the inability to physically inspect the properties may end up making poor decisions that can promote regrets. In this context, initiatives such as mandatory disclosure of owners contact details to the potential renters and buyers started in April 2020 by the New South Wales government in Australia are positive steps towards strengthening the consumer owner relation and reducing the dictating and controlling powers enjoyed by the agents. This may help reduce the post-purchase or rent regrets as the customers can get in touch directly with the owner and decide on certain aspects before a deal is finalized.

1.8. Inspection (IP)

Inspection (IP) is another important aspect contributing to real estate purchases or rent regrets. According to Herbertson [64], once they found their property, 58% of the respondents spent less than 60 min checking out the property they eventually purchased. This lack of proper inspection resulted in one-quarter of consumers discovering issues later and regretting their decisions. The main post-purchase complaints included paintwork, construction quality, gardens and fences, and fittings and chattels. In total, 41% people said they would have paid less for the property had they discovered the problems earlier, and 23% said they experienced a degree of ‘buyers regret’ following the purchase. Similarly, according to Leigh [28], 15% of homeowners regretting their decisions reported a lack of inspection when purchasing their home. Gatzlaff et al. [72] investigated the effects of inspections on house prices to highlight that the effects of the visible and hidden features on price differ significantly. Further, the inspection information significantly increases the implicit price of the hidden features of the house. However, interestingly, the inspection was found to increase the visible implicit feature price, suggesting a more transparent disclosure and verification to the potential buyers that will bring more business. Sir et al. [73] proposed a capacitated inspection mechanism for multiple units as compared to periodic inspection. The authors argue that such inspections will not only reduce the related costs, but also facilitate the multi-unit inspections and associated maintenance. While the importance of inspections cannot be overstressed, it has become increasingly challenging in current times especially in countries such as Australia where physical inspections are banned due to the potential spread of COVID-19. In this context, virtual inspections are becoming more and more important, which brings its own set of challenges. However, as suggested by Felli et al. [74], 360 videos and mobile laser measurements can help the potential costumers inspect their properties virtually and make better rent or buy decisions. Similarly, other techniques for addressing the challenges of virtual inspections include provisions of more accurate and detailed online information [4], 3D scanned models [75,76,77], virtual and augmented reality-based immersive visualisations [74], and smart gadgets and drone-based virtual visits and pictures [3]. Such virtual visits can not only provide more and detailed information to the customers, but also help promote sustainability due to savings on paper works, energy consumed during inspections, and reduction of carbon footprints due to reduced transportation requirements. Such initiatives may help the industry rise above the effects of COVID-19-based reductions in business and help it transform into a smart and sustainability industry.
Another key regret source is the decision dilemma of rent versus buy. As reported by Trulia [24], 41% of renters regret renting instead of buying. Similarly, in the Australian context, according to Pawson et al. [18], people regret renting due to the fact that there would be no inheritance for the children and its implications of poverty induction due to higher costs in older age. Such feelings are consistent with the levels of anxiety expressed by parents in their own and their children’s context. This, based on a position in the real estate market, indicates a perception of enhanced intergenerational inequality. Additional factors related to decision regrets highlighted in a report by Kearns [34] are the buying process (stressful (42%), complicated (32%), and intimidating (21%)), mortgage affordability (27%), housing costs (28%), house size (20%), house features (12%), impatience (10%), and better organization of data by the real estate agencies and agents (14%).
Overall, there are many factors contributing to real estate regrets, but the current study, based on the reviewed and discussed literature, focuses on NEI, BS, HS, HC, MT, EM, AG, and IP. Based on the pertinent literature review, the real estate consumers’ regrets over the last decade are modelled and synthesized using system dynamics modelling. Additionally, contrary to the existing research methods, this study incorporates online articles, including web blogs and threads, into its method of analysis to make the analysis more rigorous and statistical. This is adopted since there are very few research articles available on real estate regrets to date. The online articles and blogs are mostly published by people associated with real estate business or process who may not be academic and able to draft research articles. The aim of this paper is to identify and analyse the purchase or rent regrets of real estate consumers over the last decade using published literature and online sources. This study can help the real estate managers, agents, and businessmen to develop a holistic system and approach, keeping in view the UpToDate consumers’ demands and boost the business by reducing or possibly eliminating the regrets, which can only increase in the COVID-19-induced lockdowns and closures of business. Based on the pertinent literature review involving published articles, web blogs, and research, this paper first identifies real estate regrets related to purchase or rent decisions over the last decade. Second, it conducts different temporal analysis to investigate the development of these regrets over time. Third, it models the data based on a systems dynamics model to show the trend of regrets over time. Additionally, the study is supported by starting and analysing online threads published over different websites and blogs for verification purposes. The data are analysed to highlight the key aspects and factors that increase real estate related to consumers’ regrets.

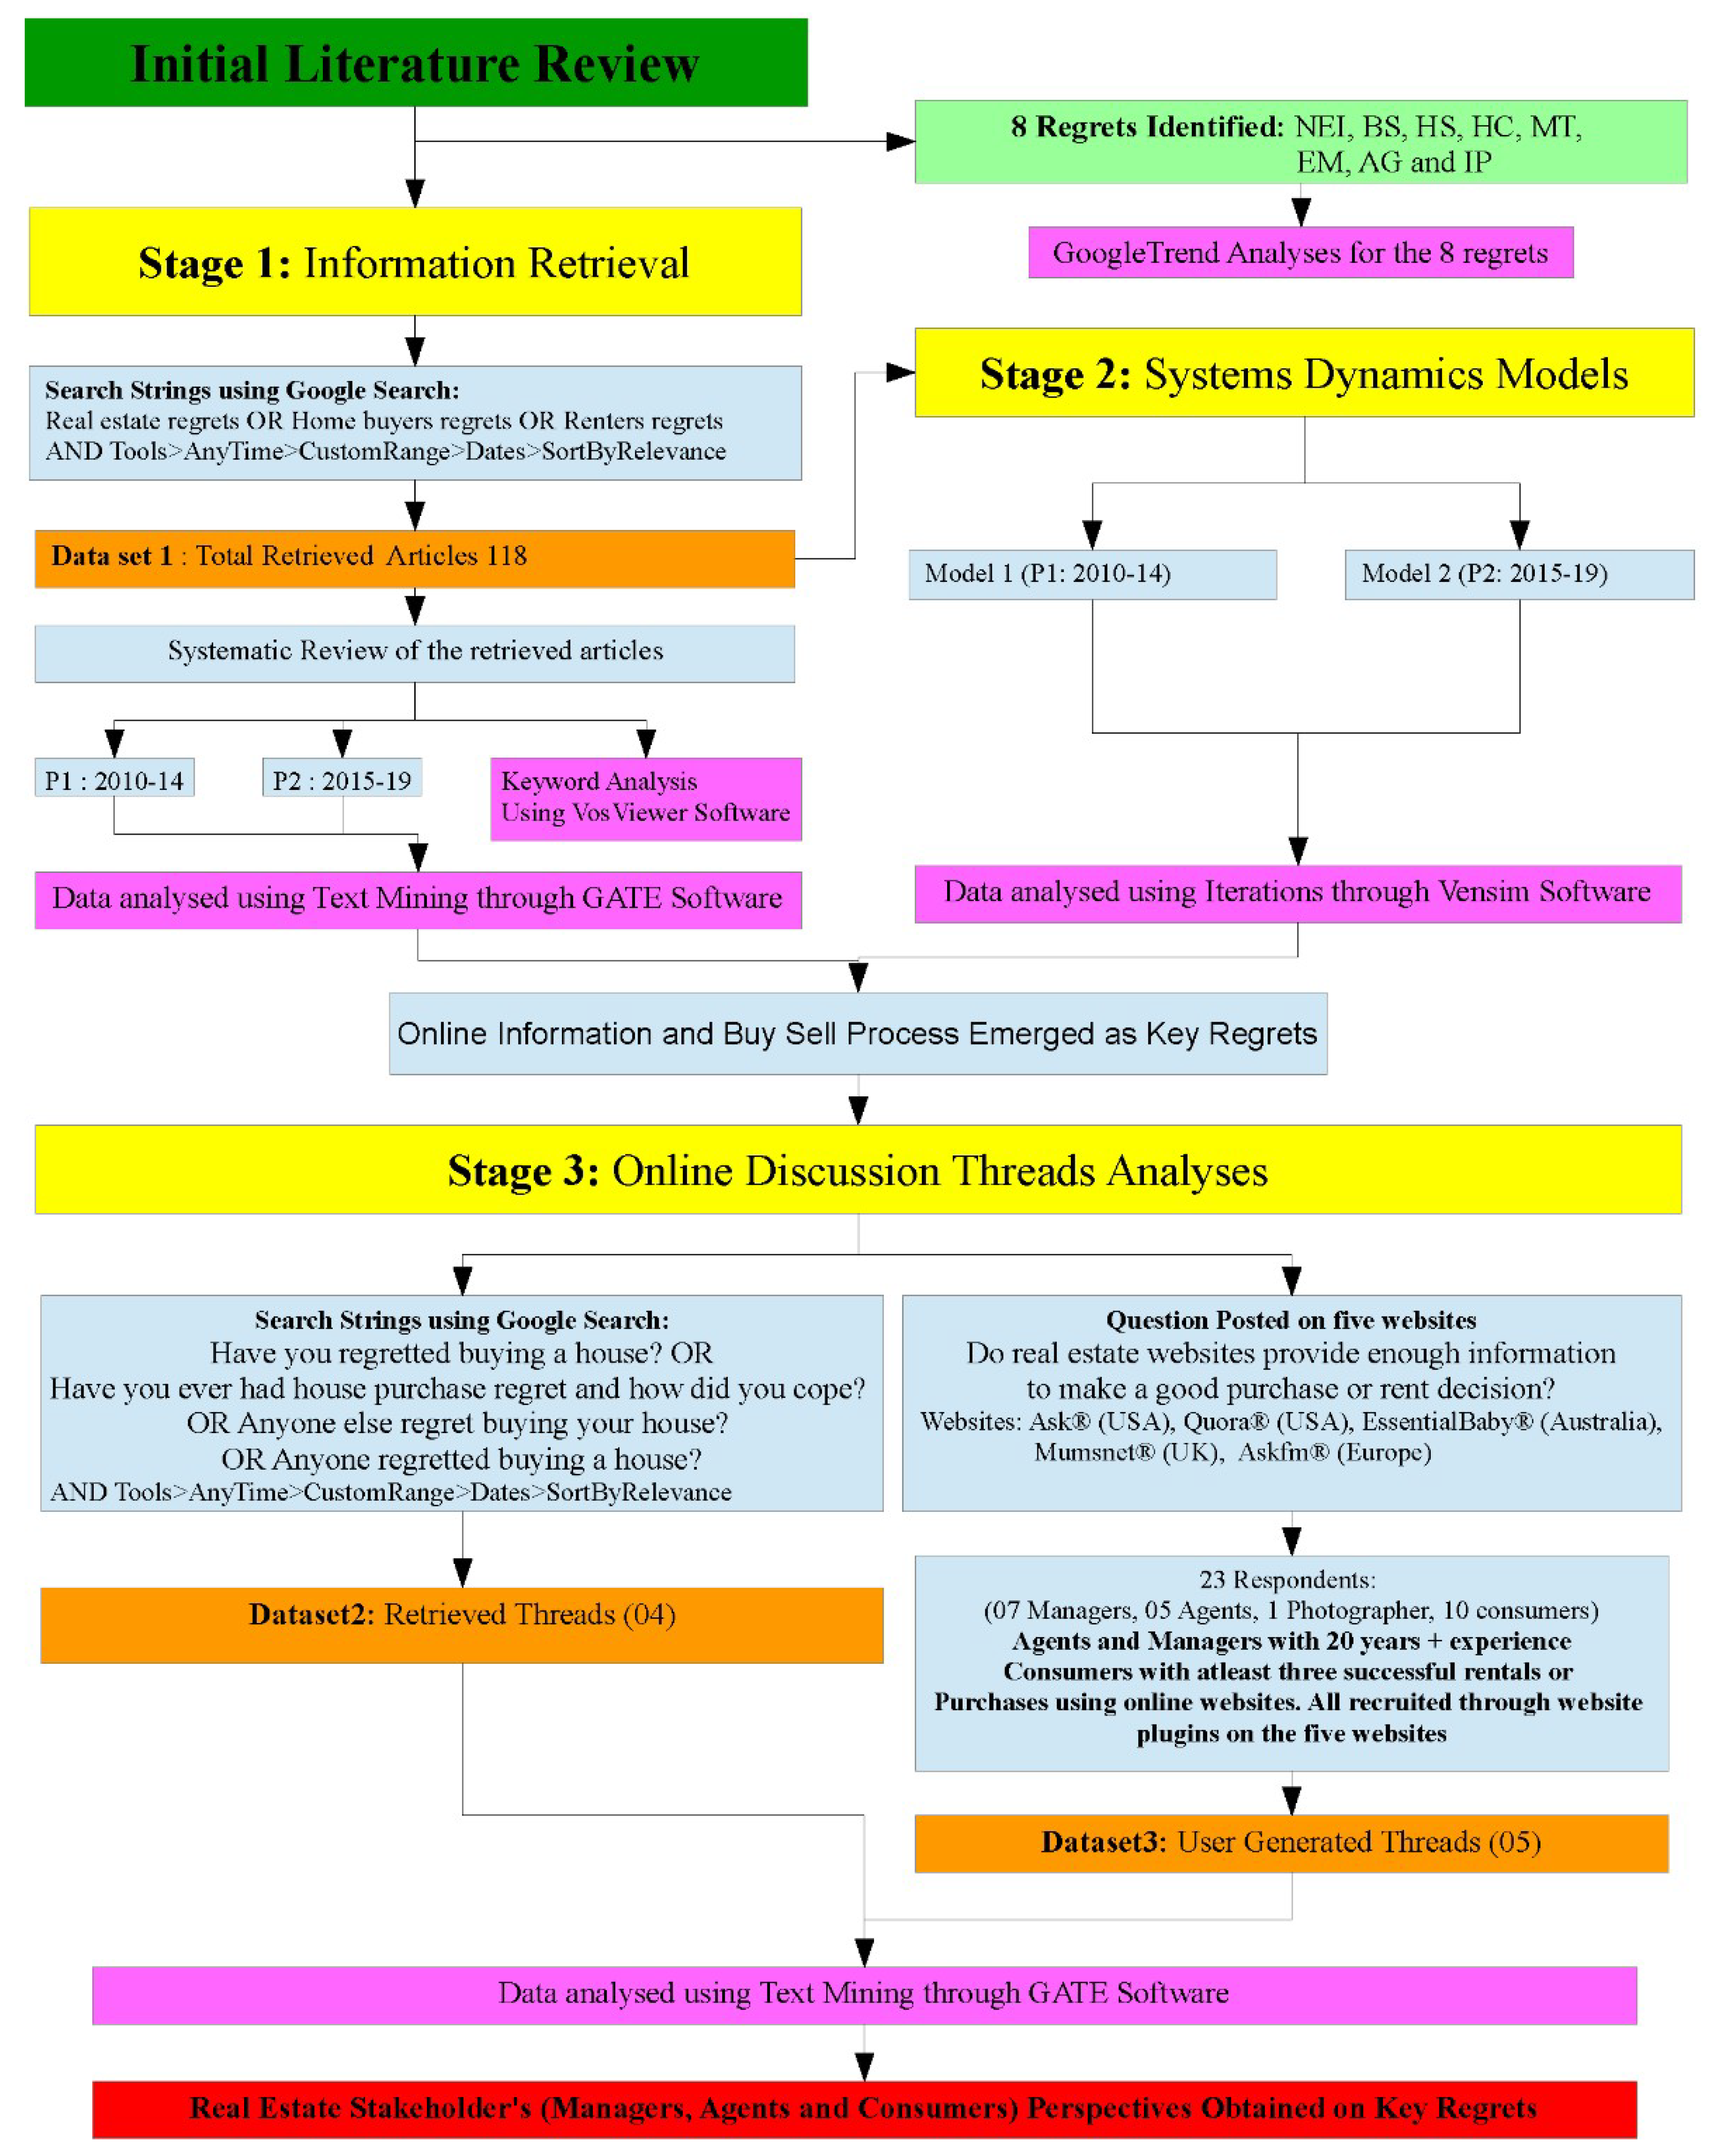
2. Materials and Methods

The methodology of this paper was comprised of key parts of information retrieval and associated analyses based on systems dynamics and text mining from published literature and online threads. The study was conducted in three stages as shown in Figure 1 where after the initial literature review, information was retrieved in stage 1. This retrieved information was divided into two time periods for the last decade P1 (2010–2014) and P2 (2015–2019) for systematic analyses. The retrieved articles for these two periods were investigated through text-mining techniques using general architecture for text mining (GATE) software to investigate the prevalent regrets. Similarly, the most repeated keywords in the retrieved articles were highlighted using VosViewer software. Further, in stage 2, system dynamics models were developed for the two periods where changes were observed over the last decade in the prevalent regrets to highlight the topmost present regrets. Once the top regrets were identified, online threads related to these regrets were investigated, and five threads were started by the authors to investigate the real estate stakeholders’ (managers, agents, and consumers) perspectives on the top regrets identified in the current study.
Information was retrieved through a systematic literature review that was analysed using modern text-mining analyses for the last decade (2010–2019). The top factors identified were subjected to systems dynamics-based predictive modelling to see how the state of regrets has changed over the last decade. It has been supported through the addition of online published discussion threads and author generated threads. The reviewed literature and systems analyses gave the top regret factors for real estate consumers and their variations over the last decade, whereas the threads were used to analyse and investigate the regrets reported by real estate stakeholders, including the managers, agents, and consumers for currently present regrets. The data from both sources i.e., published literature, including websites, online articles and blogs, and online threads, were triangulated to highlight the key factors focused on these studies. A total of eight regret factors were shortlisted after the initial literature review, where seven factors emerged as positive influencers and one had a negative influence on the real estate regrets considering the reviewed literature and threads. The data triangulation technique is widely adopted by construction and property management studies whereby data from two distinct sources are matched, and common results are obtained due to various assessments, thus validating the results [78].
Based on the method discussed, the study utilised three distinct datasets for generating results and presents pertinent discussions, as shown in Figure 1. The dataset 1 consisted of 118 systematically retrieved articles from published online literature and webpages that were used to generate two different systems models over two periods in the last decade (P1 and P2). This distribution was done to divide and analyse the data in spans of 5 years each; thus, comparing the data from the first half of the decade with the second half to ease the analyses process. Datasets 2 and 3 were retrieved using online discussion threads. Specifically, dataset 2 consisted of 135 discussions across four published discussion threads that were systematically retrieved. Similarly, dataset 3 consisted of user-generated threads across five famous and free to access and post online platforms (websites). These include Ask® (USA), Quora® (USA), EssentialBaby® (Australia), Mumsnet® (UK), and Askfm® (Europe). The shortlisting criteria for these forums were the presence of at least 0.7 Million active users.
The system dynamics models generated from dataset 1 were used to predict the regrets pattern and trends over the last decade. Similarly, the articles from dataset 1, and the discussion threads from datasets 2 and 3, were systematically studied using text-mining techniques to retrieve the major regrets over the last decade based on keywords-based assessments and analyses. A triangulation technique helped in getting the top factors whereby the major regret factors from both sources were matched and the common ones were shortlisted based on the three-staged study. Overall, the three datasets provided key regrets among real estate consumers based on their purchase or rent decisions.

2.1. Information Retrieval

This study retrieved relevant online articles and web-based information published over the last 10 years (1 January 2010–31 December 2019) based on carefully designed systematic search strings. For ease of understanding and comparison, the time was divided into two parts: P1 (2010-14) and P2 (2015-19). Thus, all the retrieved articles were limited to the last decade. The purpose of retrieving the articles for the last decade was to keep a recent and new focus and highlight articles investigating the latest and up-to-date trends related to real estate consumers’ regrets. Additionally, the data were sorted using the “relevance” filter of the google search engine. The language was limited to English language only. Further, any video, images, descriptions, app details, and non-statistical articles or blogs were excluded from the search. The search key words were limited to “real estate regrets”, “homebuyers regrets”, and “renters regrets”. Table 1 provide details of the search process and subsequent results. A total of 118 most-relevant online articles were systematically retrieved and analysed. This includes 57 articles from P1 and 61 articles from P2.
The text mining component is an integral part of information retrieval in the current study. It is an approach through which high-quality information is derived from the text [79]. It has been used to extract useful text-based information in various fields of science such as disease control and prediction in the medical field, market prediction in the services industry, understanding hotel customer satisfaction, and general literature review [80,81]. Similarly, in the real estate field, it has been used for estimation of the investment potential of real estate properties, mining real-estate listings based on decision systems over the ontological graph, predicting real estate prices, and predicting real estate markets based on twitter language [82,83]. A key advantage of the text mining technique is analyses of published and online reports. For this purpose, it has been used to extract data from industrial service portfolios of 10-K annual articles, logistics service design for cross-border e-commerce based on online content analyses, and bug report classification [84,85]. Various types of software are available that can be used to conduct the text mining process, including but not limited to general architecture for text engineering (GATE), Rapid Miner, KH Coder, Textable, and other free software. However, according to PredictiveAnalytics [86], the top-rated software among 27 free available software is GATE, which was utilised in the current study.
For text mining purposes, all 118 articles were downloaded as portable document formats (PDFs) and analysed using the GATE software package. The search strings were limited to the keyword “regret” and the default annotation stacks of “person” and “percentage”. For this purpose, “regret” was inserted as a new annotation text and added to the search strings in the software. Thus, the 118 articles were scrutinized for the phrases containing regrets having some personal pronouns and the associated percentages. Additionally, to make the search strings comprehensive and inclusive, recognition words for NEI, HC, HS, BS, IP, AG, EM, and MT were added to the search strings. For example, the search string for NEI contained keywords such as information, quality, details, knowledge, and neighbourhood insights. Similarly, HS contained size, layout, small, large, and extension as keywords. HC contained cost, pay, finance, investment, and renovation as keywords. Also, EM contained pressure, hurry, and emotion as keywords; BS contained buy, sell, and rent as keywords; whereas the string for regrets consisted of the keywords regret, mistake, and repent. Others such as agents, mortgages, and inspections were used themselves as keywords for search strings of AG, MT, and IP, respectively. Thus, developing holistic search strings was ensured in order for the text mining software to highlight important keywords. Further, the highlighted keywords were read in the context of the sentence and ignored if the meaning conveyed was different than the one intended in this study. The software systematically displayed the items containing the search criteria among each of the investigated documents. The default coding mechanism of the software “ANNIE” was utilised, and the default processing resources of the ANNIE were used as shown in the screenshot in Figure 2.
The 118 articles were used as the input corpuses to the GATE software, and the ANNIE coding was run to give the result for each article. The eight major identified regret sources were added as the annotation stacks for the software to systematically search for it and highlight the count using inbuilt text mining codes. The process for importing files and running ANNIE is shown in Figure 3.

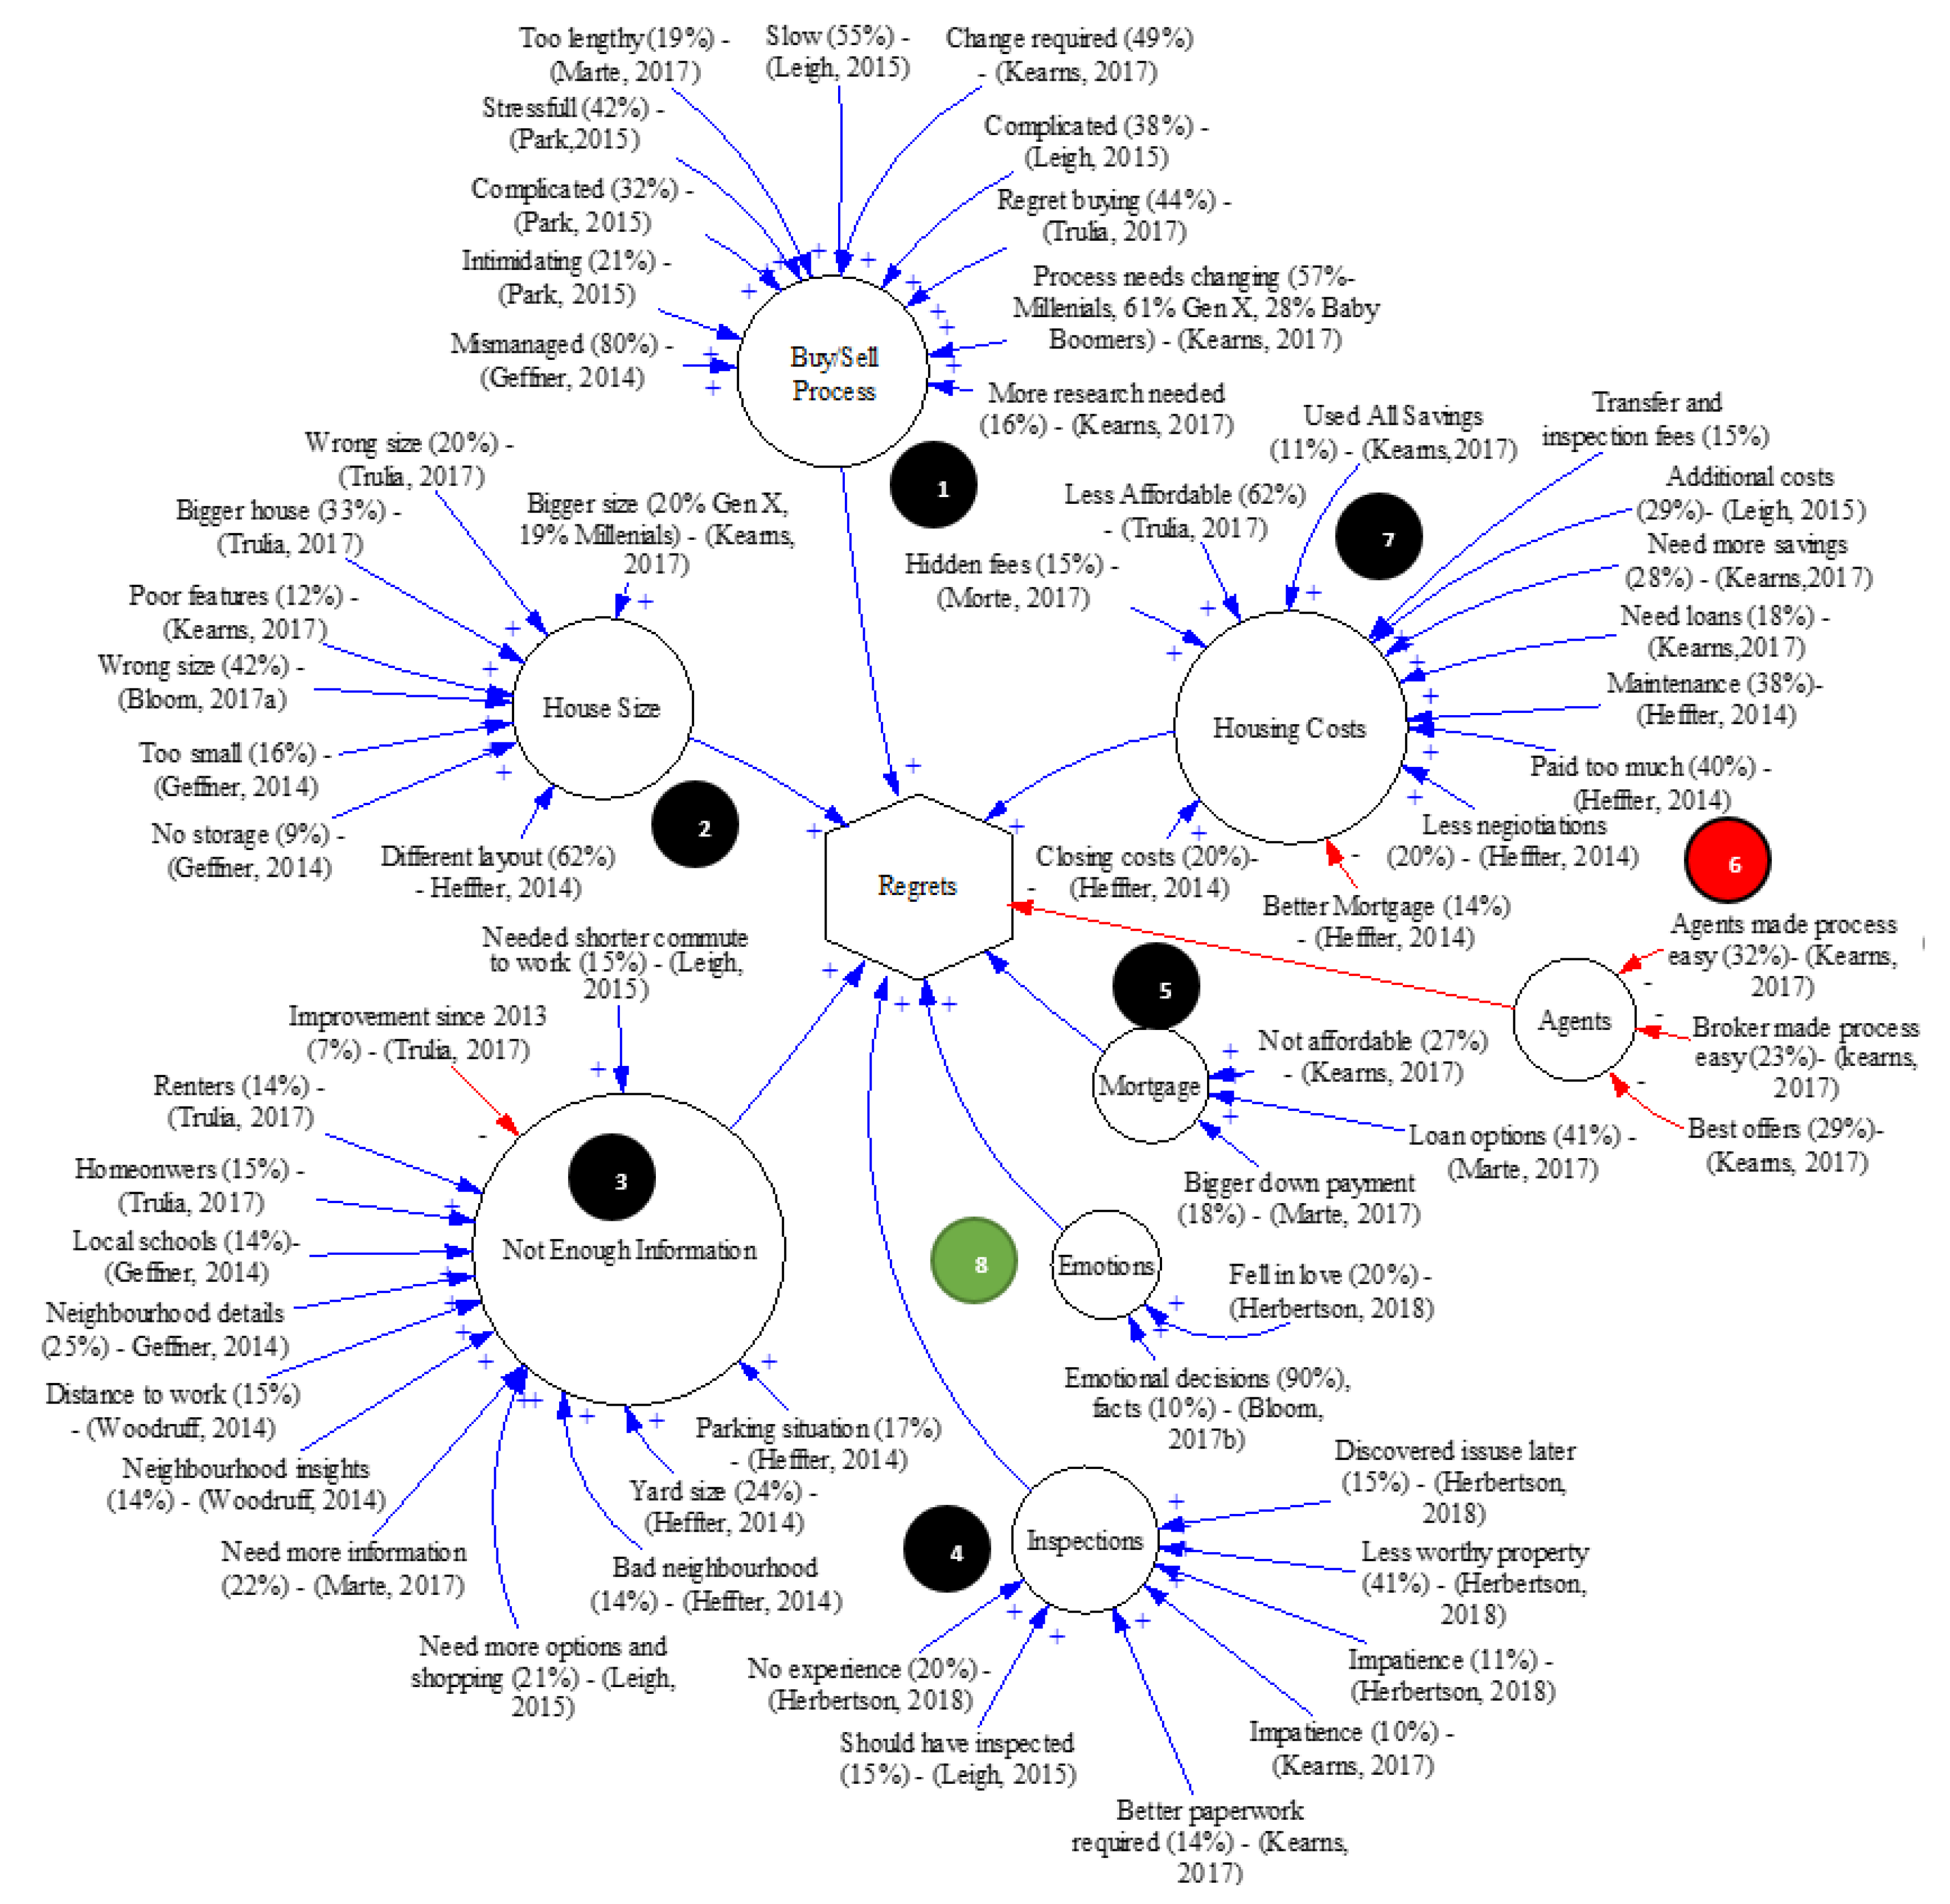
2.2. System Dynamics Models

System dynamics is an approach that models dynamically changing variables over a certain period of time [87]. Originally introduced by Forrester [88], it has been widely applied in construction and project management fields [89]. It has been recently used by Ullah et al. [90] for implementing and dynamically assessing six sigma in the construction industry of Pakistan. Similarly, Ding et al. [91] utilised it for reducing waste at the design and construction stages of projects. However, when it comes to using systems dynamics for real-estate-related studies, its applications are almost non-existent. Among the very few related studies, Robin [92] used systems thinking, and application of system dynamics, for real estate value performance. The authors used the case of King’s Cross Central (London) redevelopment and explored the influence of real estate developers on the production and use of urban expertise in the context of planning that shapes the plans and built environment within cities. Thus, the complicated relationship between the expertise of politics and performativity coined due to real estate values carried by real estate developers was investigated using the systems thinking approach. However, to date, no study has focused on the visualisations of real estate consumers regrets. Specifically, no applications of system dynamics exist for understanding and predicting real estate consumers’ regrets over time. This provides a research gap and an incentive for utilisation of system dynamics in the current study. Thus, the method was utilised to analyse the data, and two models were formulated using the Vensim® software that is used for systems dynamics modelling and analyses. Based on the data extracted from the 118 articles mentioned in the information retrieval section, a systems model each was developed for the two periods (P1 and P2) using Vensim PLE ® Software. The key factors, subsequent regret percentages, and references were added to the model shown in Figure 4 for P1. Further, based on the influence, polarity was added to the arrows: The negative arrows (Red) show a factor reducing regret whereas a positive one (Blue) show regret enhancers as per the studied articles. The size of the circles of the factors that contributed to the criteria was enlarged to show the criticality of the criteria. Thus, the highest effective criterion was HC followed by NEI and the BS process. Since the articles were relevant to regret-enhancing criteria, almost all the factors increased regrets except a few related to the agents’ criteria. In agents’ criteria, customers reported a reduction in regrets as evident by 83% people saying that they will use the agents’ services again and 96% quoting a reduction in price due to the involvement of agents. Thus, the regrets were negatively influenced by good and informed agents.
Similarly, Figure 5 shows the systems model for P2. Interestingly, as compared to the previous period, the HC regrets were reduced. This is associated with people getting a greater return on properties in the form of resale value and better mortgages. Further, the BS process and IP criteria grew, showing an increase in overall regrets. The NEI criterion was almost the same with a 7% decrease since 2014, but the ratio was still very high. Following the previous trends, the agents’ criteria reduced regrets. After obtaining these models through the Vensim software package, mathematical formulae were introduced in the software to iterate the models and give meaningful results.
Another key aspect was that of emotions, which were previously missing in P1 model. It was during this time period that people realised the role of emotional decision making that resulted in increased regrets as per the reviewed literature. Thus, the total factors considered in the P2 model had eight factors instead of seven as it included emotions as a new factor into account. This does not mean that emotions were irrelevant before 2015; rather, the literature review mechanism adopted in the current study may not be exclusive and hence the term emotion was not found in the investigated articles dating before 2015 in P1.
The mathematical equations used for the systems analysis are shown in Equations (1) and (2).
R = i n i C i
where R shows the value of regrets, i is the coefficients for all criteria in terms of its contributions. and C i are the criteria for regrets. Further, the negativity or positivity of the arrow determines the sign of the coefficient. For example, in both models, the value of agents to regrets is negative, whereas inspections are positive. Additionally, Equation (2) determines the value of criteria that is fed into Equation (1) for analysis.
C = i n φ i F i
where C is the criteria value, φ i is the normalised coefficient values of the factors, and F i shows the values of factors. As an example, to explain the working of the model, consider the mortgage from Figure 4. Here, we have three factors contributing to it with a value of 20%, 60%, and 25%, respectively in P1, which are mentioned against given values for period 1 (GP1) in Table 2. So, the corresponding normalized values for period 1 (NP1) are 0.19, 0.57, and 0.24, accordingly. To show the working of the equations, the corresponding values are put into Equation (2). Thus, the criteria (C) and regrets (R) can be calculated as follows:
C = ( 0.19 20 ) + ( 0.57 60 ) + ( 0.24 25 ) = 56
This value, when inputted into Equation (1) gives:
R = ( 0.0536 56 ) = 3.0016
Thus, the contributions of mortgage to the regrets based on P1 assessments are 3%. The same method is used directly by the software package to calculate individual regrets and then sum it to get an overall view of the total regrets at the end of each assessment period.
Table 2 shows the given and normalised individual factor values for all factors and their contributions that are inputted into Equations (1) and (2). Further, given values for period 2 (GP2) and normalized values for period 2 (NP2) are also provided. Thus, all the values, when put into Equations (1) and (2), are used to predict the overall values of regrets for both years using systems thinking. As previously mentioned, EM was not found in the articles studied during P1; thus, the table shows not applicable (NA) against it.

2.3. Online Discussion Threads

After having the idea about key criteria and their influencing factors over time, the poor quality or lack of online information and complicated buy–sell process emerged as main concerns or regret sources among real estate consumers. Keeping this in view, a discussion thread was started on the top five online platforms based on the google ranking (based on the number of users of the specific service) as shown in Figure 6. This was aimed at verifying the results of the articles and online threads based on the responses of real estate consumers, experts, and agents. The researchers asked a single question on all platforms to have uniformity and comparability in the answers. The question was, “Do real estate websites provide enough information to make a good purchase or rent decision?”. Further, in the description section, details were added to keep the respondents on track and seek only relevant answers. The details included phrases such as “This thread is aimed at assessing real estate regrets”, and “Please reply only if you have recently used a real estate website or online information for purchase or rent”. The aim of this exercise was to get independent opinions related to the online real estate information for avoiding regrets. Further, since most of the articles are published by organisations with stakes involved in the business, an independent assessment is necessary to avoid and eliminate the authors’ bias.
In total, 23 successful discussion threads were initiated with 13 real estate professionals, including seven managers, five agents, and a real estate photographer. Further, 10 real estate consumers were also part of the discussion threads. Since the online platforms provided the option of manually requesting the respondents to answer, it was ensured that all real estate professionals (agents and managers) had at least 20 years of experience to get useful insights. The consumers had at least three successful purchases or rental agreements for inclusion in the shortlist. Further, the responses were restricted to experts within Australia, UK, and the US only. The respondents’ profiles are given in Table 3.
Additionally, the method as specified in the information retrieval section was repeated to highlight and investigate similar threads initiated by others during the last decade. Based on the set criteria and searching, a total of four similar threads were highlighted that were posted on various web platforms. These threads were restricted to respondents from Australia, UK, and the US in line with the previous setup to ensure coherence in views and were analysed temporally to investigate the regret factors reported in different times. T1 started and concluded in 2010, T2 in 2016–2019, T3 in 2010–2019, whereas T4 lasted from 2013–2014. Thus, the whole range of years was covered through these threads. Table 4 shows the details of these studied threads. These threads were downloaded as PDFs, and GATE software was used to search for the key words as described in the information retrieval section. Further, to ensure whether the keywords were used for displaying regret or happiness, the articles were read multiple times and highlighted with different colours pertinent to regret or happiness. Thus, the year of thread start, the discussion dates per each individual respondent, the keywords used in the discussion, and the sense of using the keywords regarding regret or happiness were recorded for subsequent analysis.

3. Results and Discussions

First of all, the search trends for real estate regrets were analysed using the google trends plugin as shown in Figure 7 (a,b). The results show that there was a spike in information quality concerns related to housing size, costs, agents, and rents. Google trend was started in 2004, and hence the results are available from 2004 onwards. Further, in line with the financial crisis of 2007–2008, depressions can be seen in the trends, which started to take off post 2011–2012. The trend lines are shown for all the eight key factors previously identified and housing rent in addition. The results in Figure 7a show that factors such as house information were a key concern during 2004, which is seemingly settling down due to the availability of more information and uses of online sources for getting the desired information. Previously, the customers had to visit the agent’s offices and were vulnerable to data manipulations or feeding of selected information, which is addressed through the availability of data on multiple websites. The figure further shows that concerns related to house size are increasing. This may be associated with manipulative pictures of the property and lack of consideration of future family extensions, such as having more children. This regret can further be increased in the COVID-hit environment where physical inspections are limited, and the customers must rely more on online information, which is subject to manipulation by the agents. For example, the virtual furnishings in the photos of properties may not fit in the physical space, which can mislead the customers to opt for a property and later on regret the decision when their furniture cannot fit into it. To tackle this issue, virtual- and augmented-reality-based inspection coupled with mobile laser measurements and 3D scanning can be used, as highlighted by Felli et al. [74], where the customers can take precise measurements of the room size or property features and make informed decisions from the comfort of their houses. Other regrets such as house costs and buy/sell process remain constant.
Similarly, Figure 7b compares five regrets related to mortgage, agents, emotions, inspections, and rents. The trend lines show that regrets related to real estate agents were common from 2004 to 2006, which settled in the following years and are on the rise recently. This is due to the fact that from 2004 to 2006, the use of online media and the internet for property marketing and buy/sell was not too common, which left the customers at the discretion of the manipulative agents that often ended in a regret related to the property. The same issue is faced by the customers these days where, due to inspection restrictions and social distancing rules, customers cannot inspect the properties in person, which again leave them to decide based on the online information related to the properties provided by the agents that may not be well regulated by independent third party or government policies. Thus, a rise in agents-related regrets can be seen in recent times. In terms of other regrets such as mortgages, the regrets seem to be settling down due to the financial support initiatives launched by governments throughout the world in the COVID-19 times, such as the Australian government initiative of relaxing the mortgage payments for six months. Other regrets such as rent, inspection, and emotion remain constant.

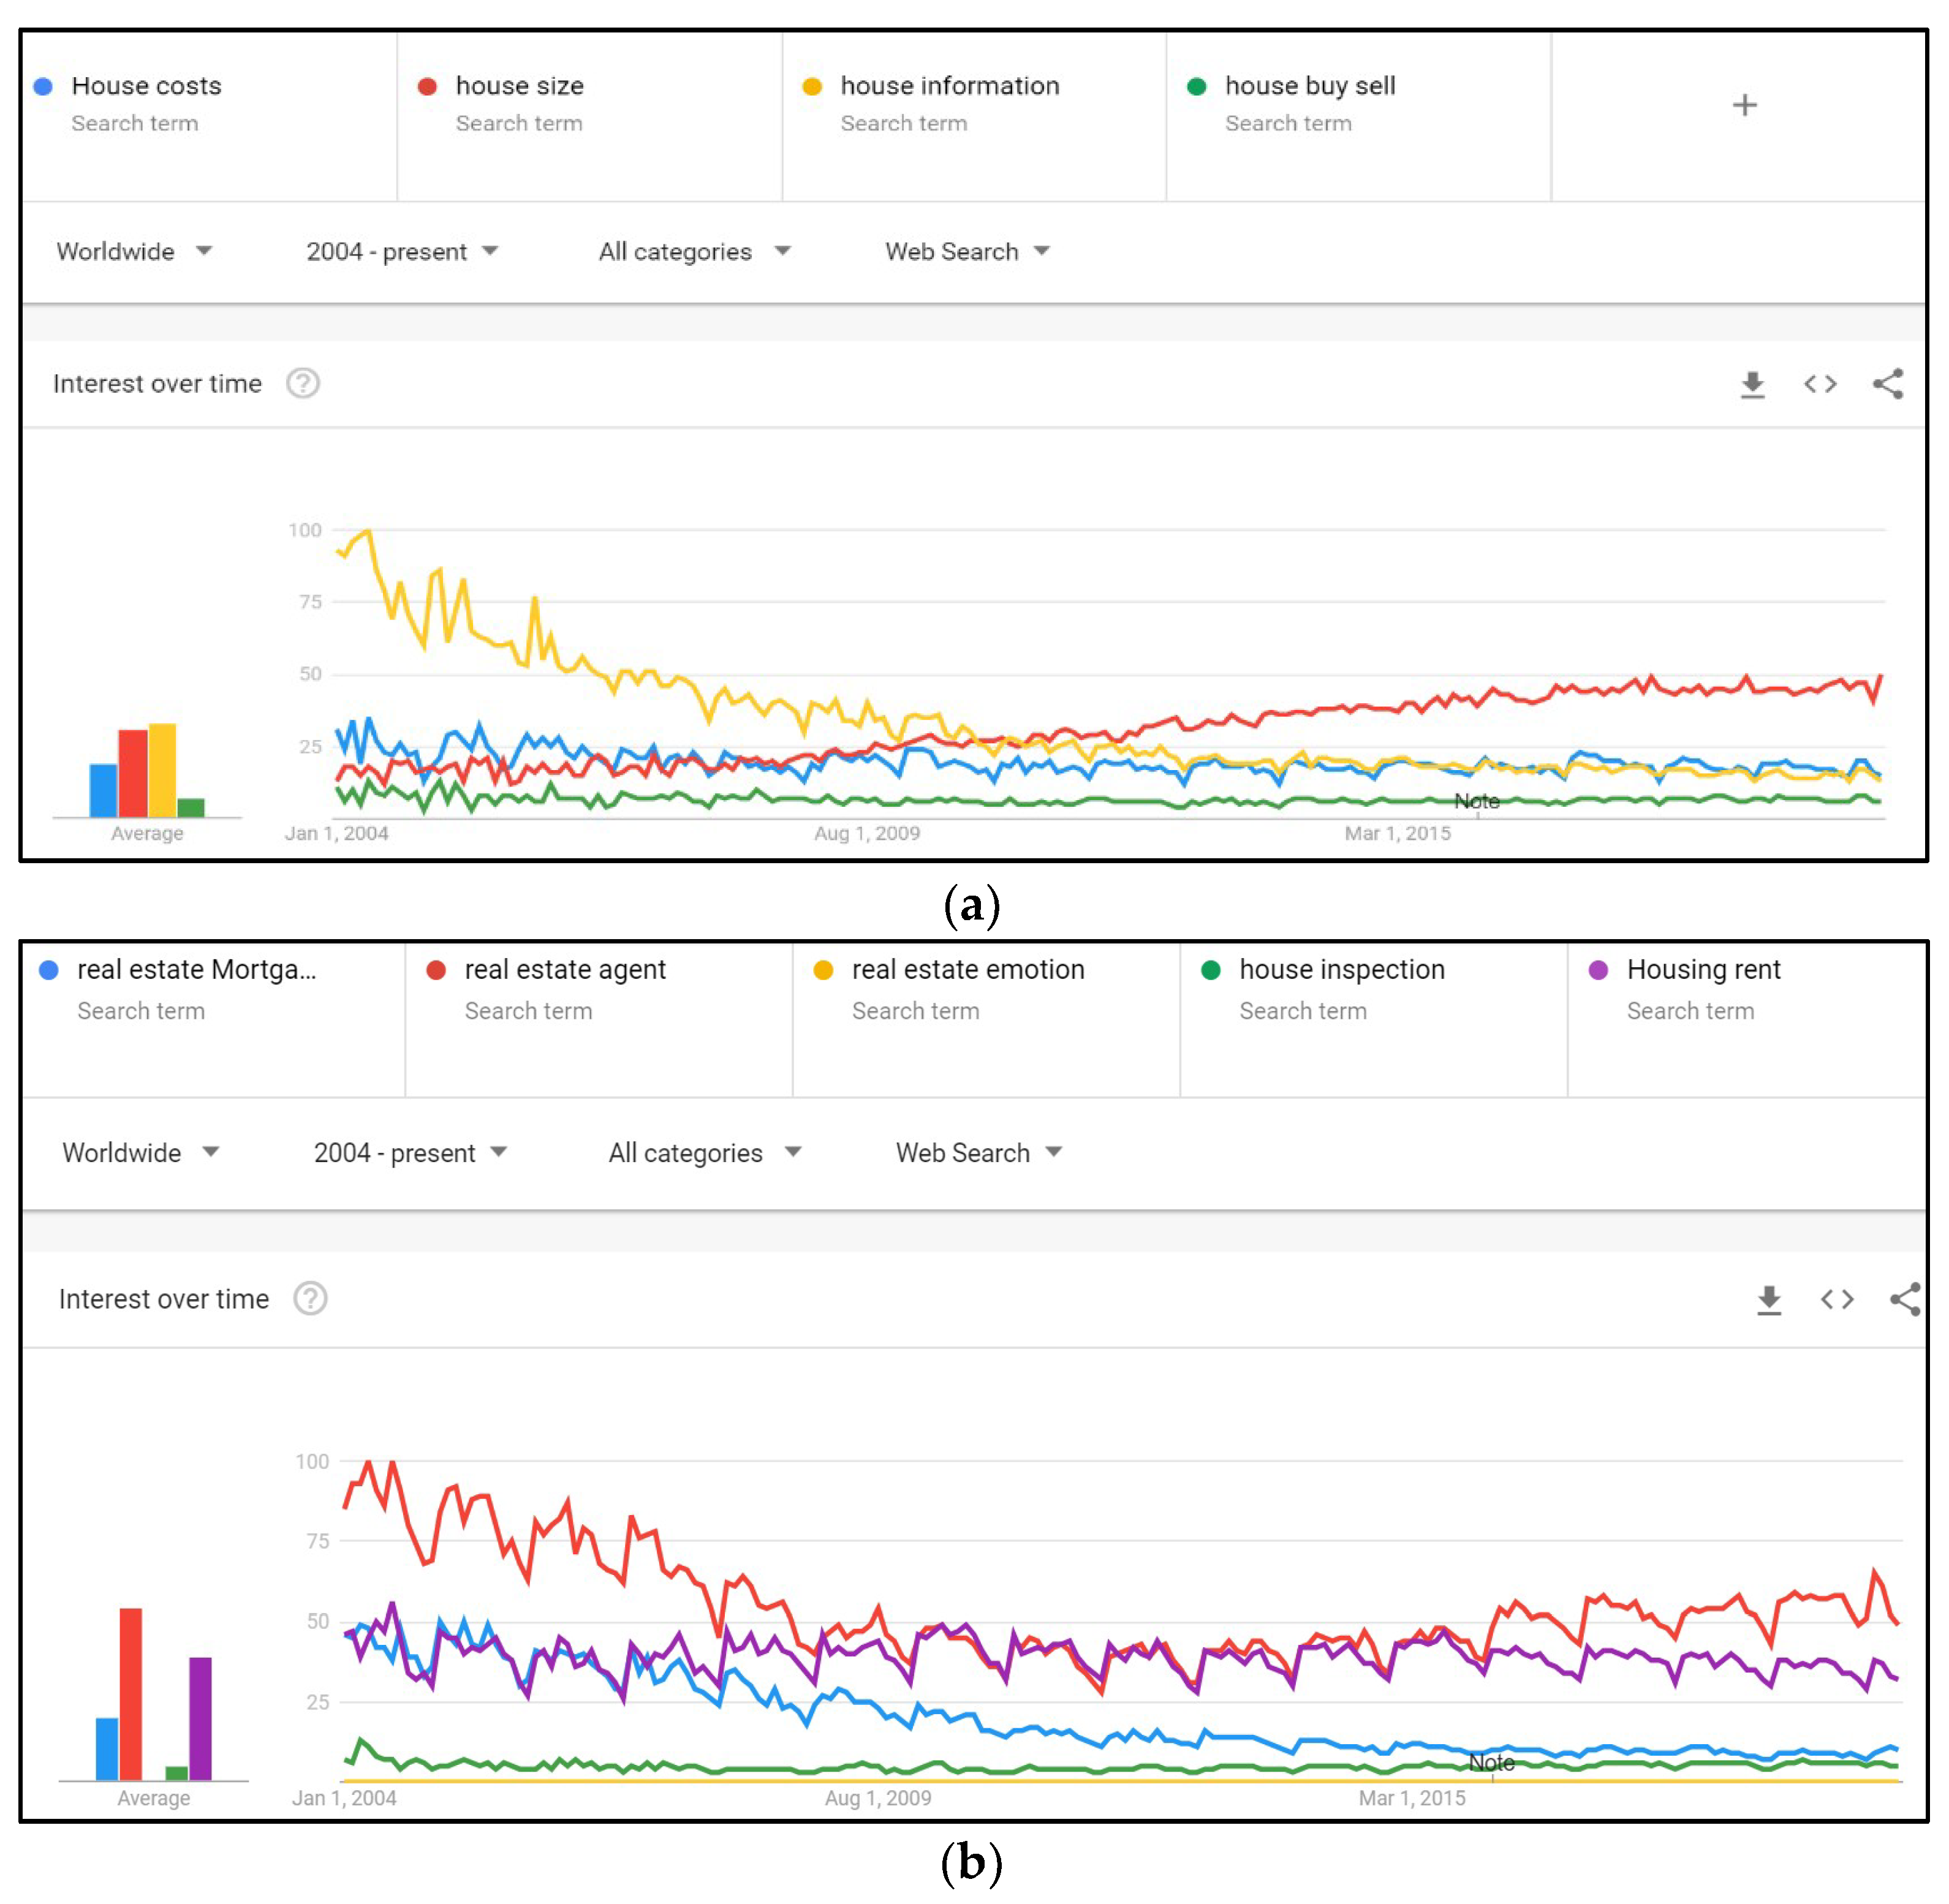
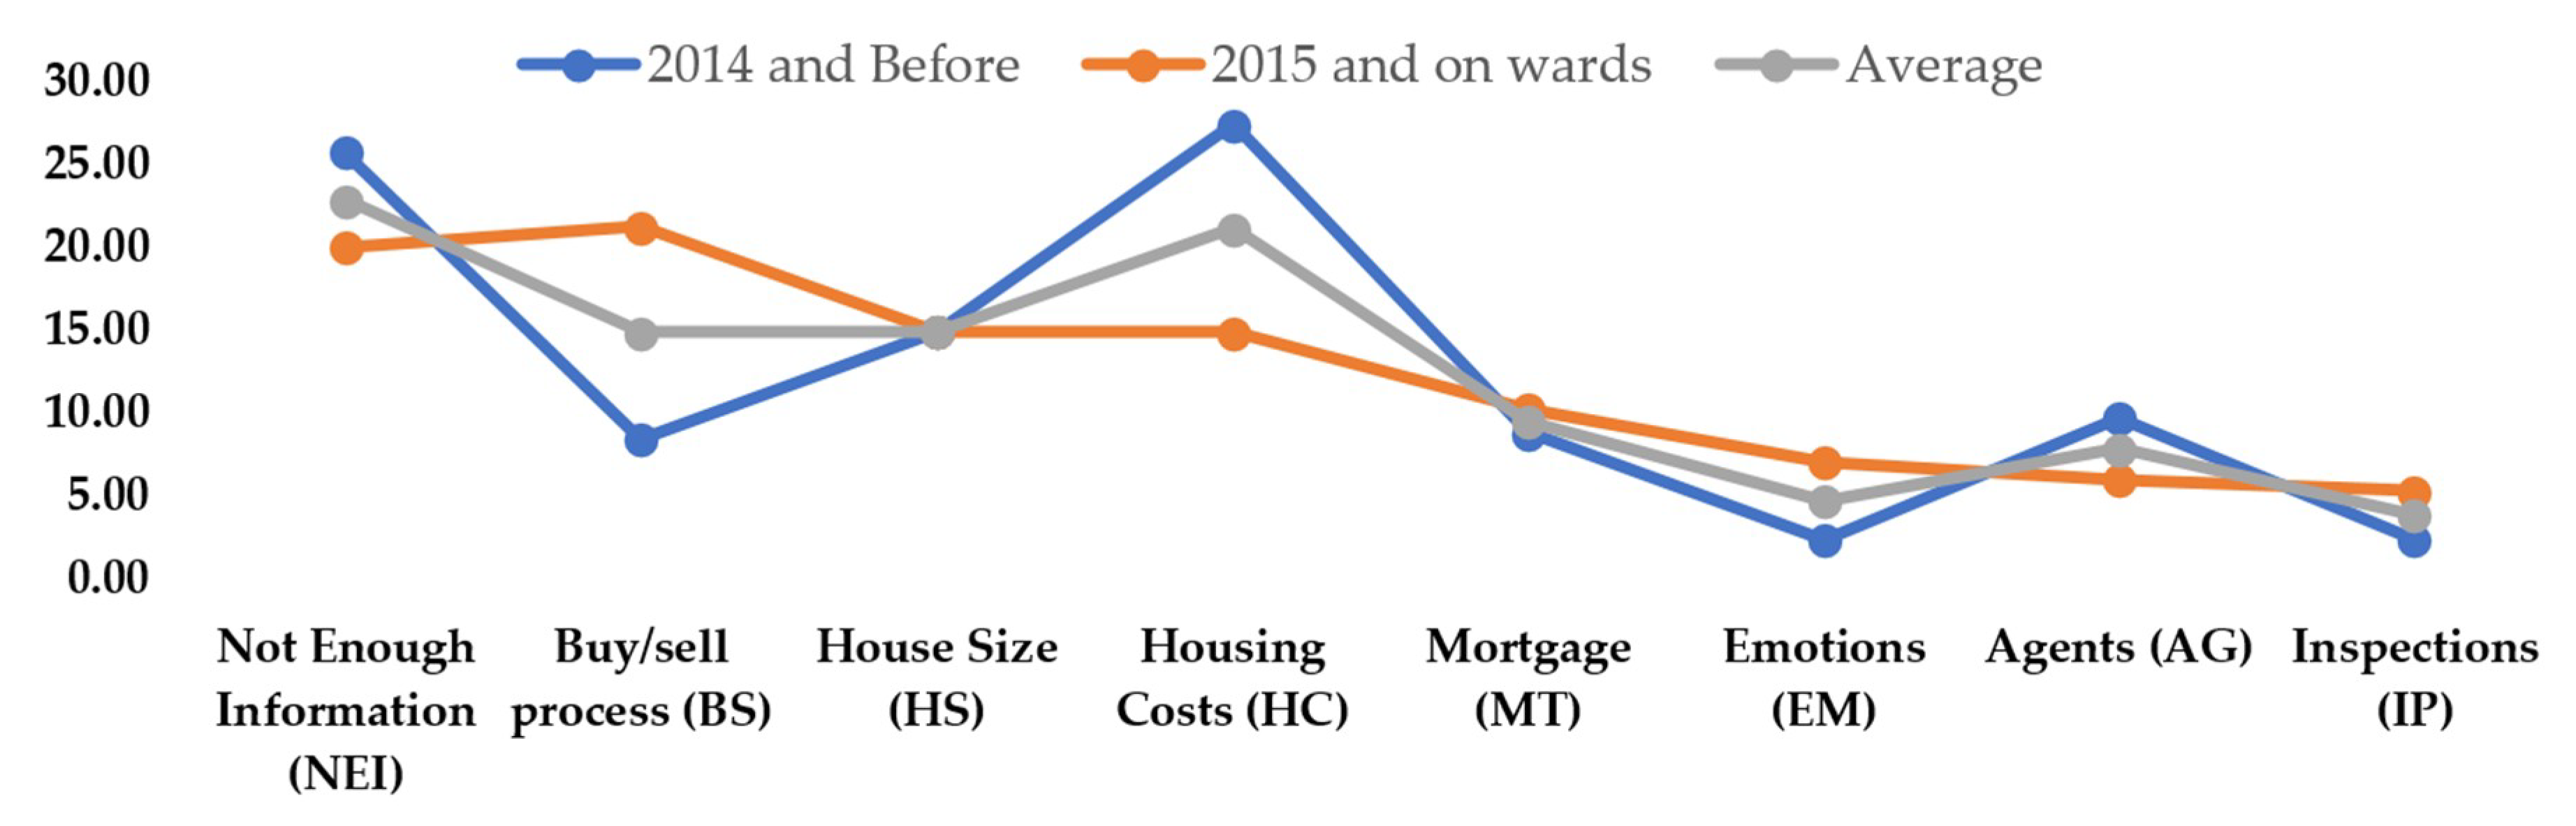
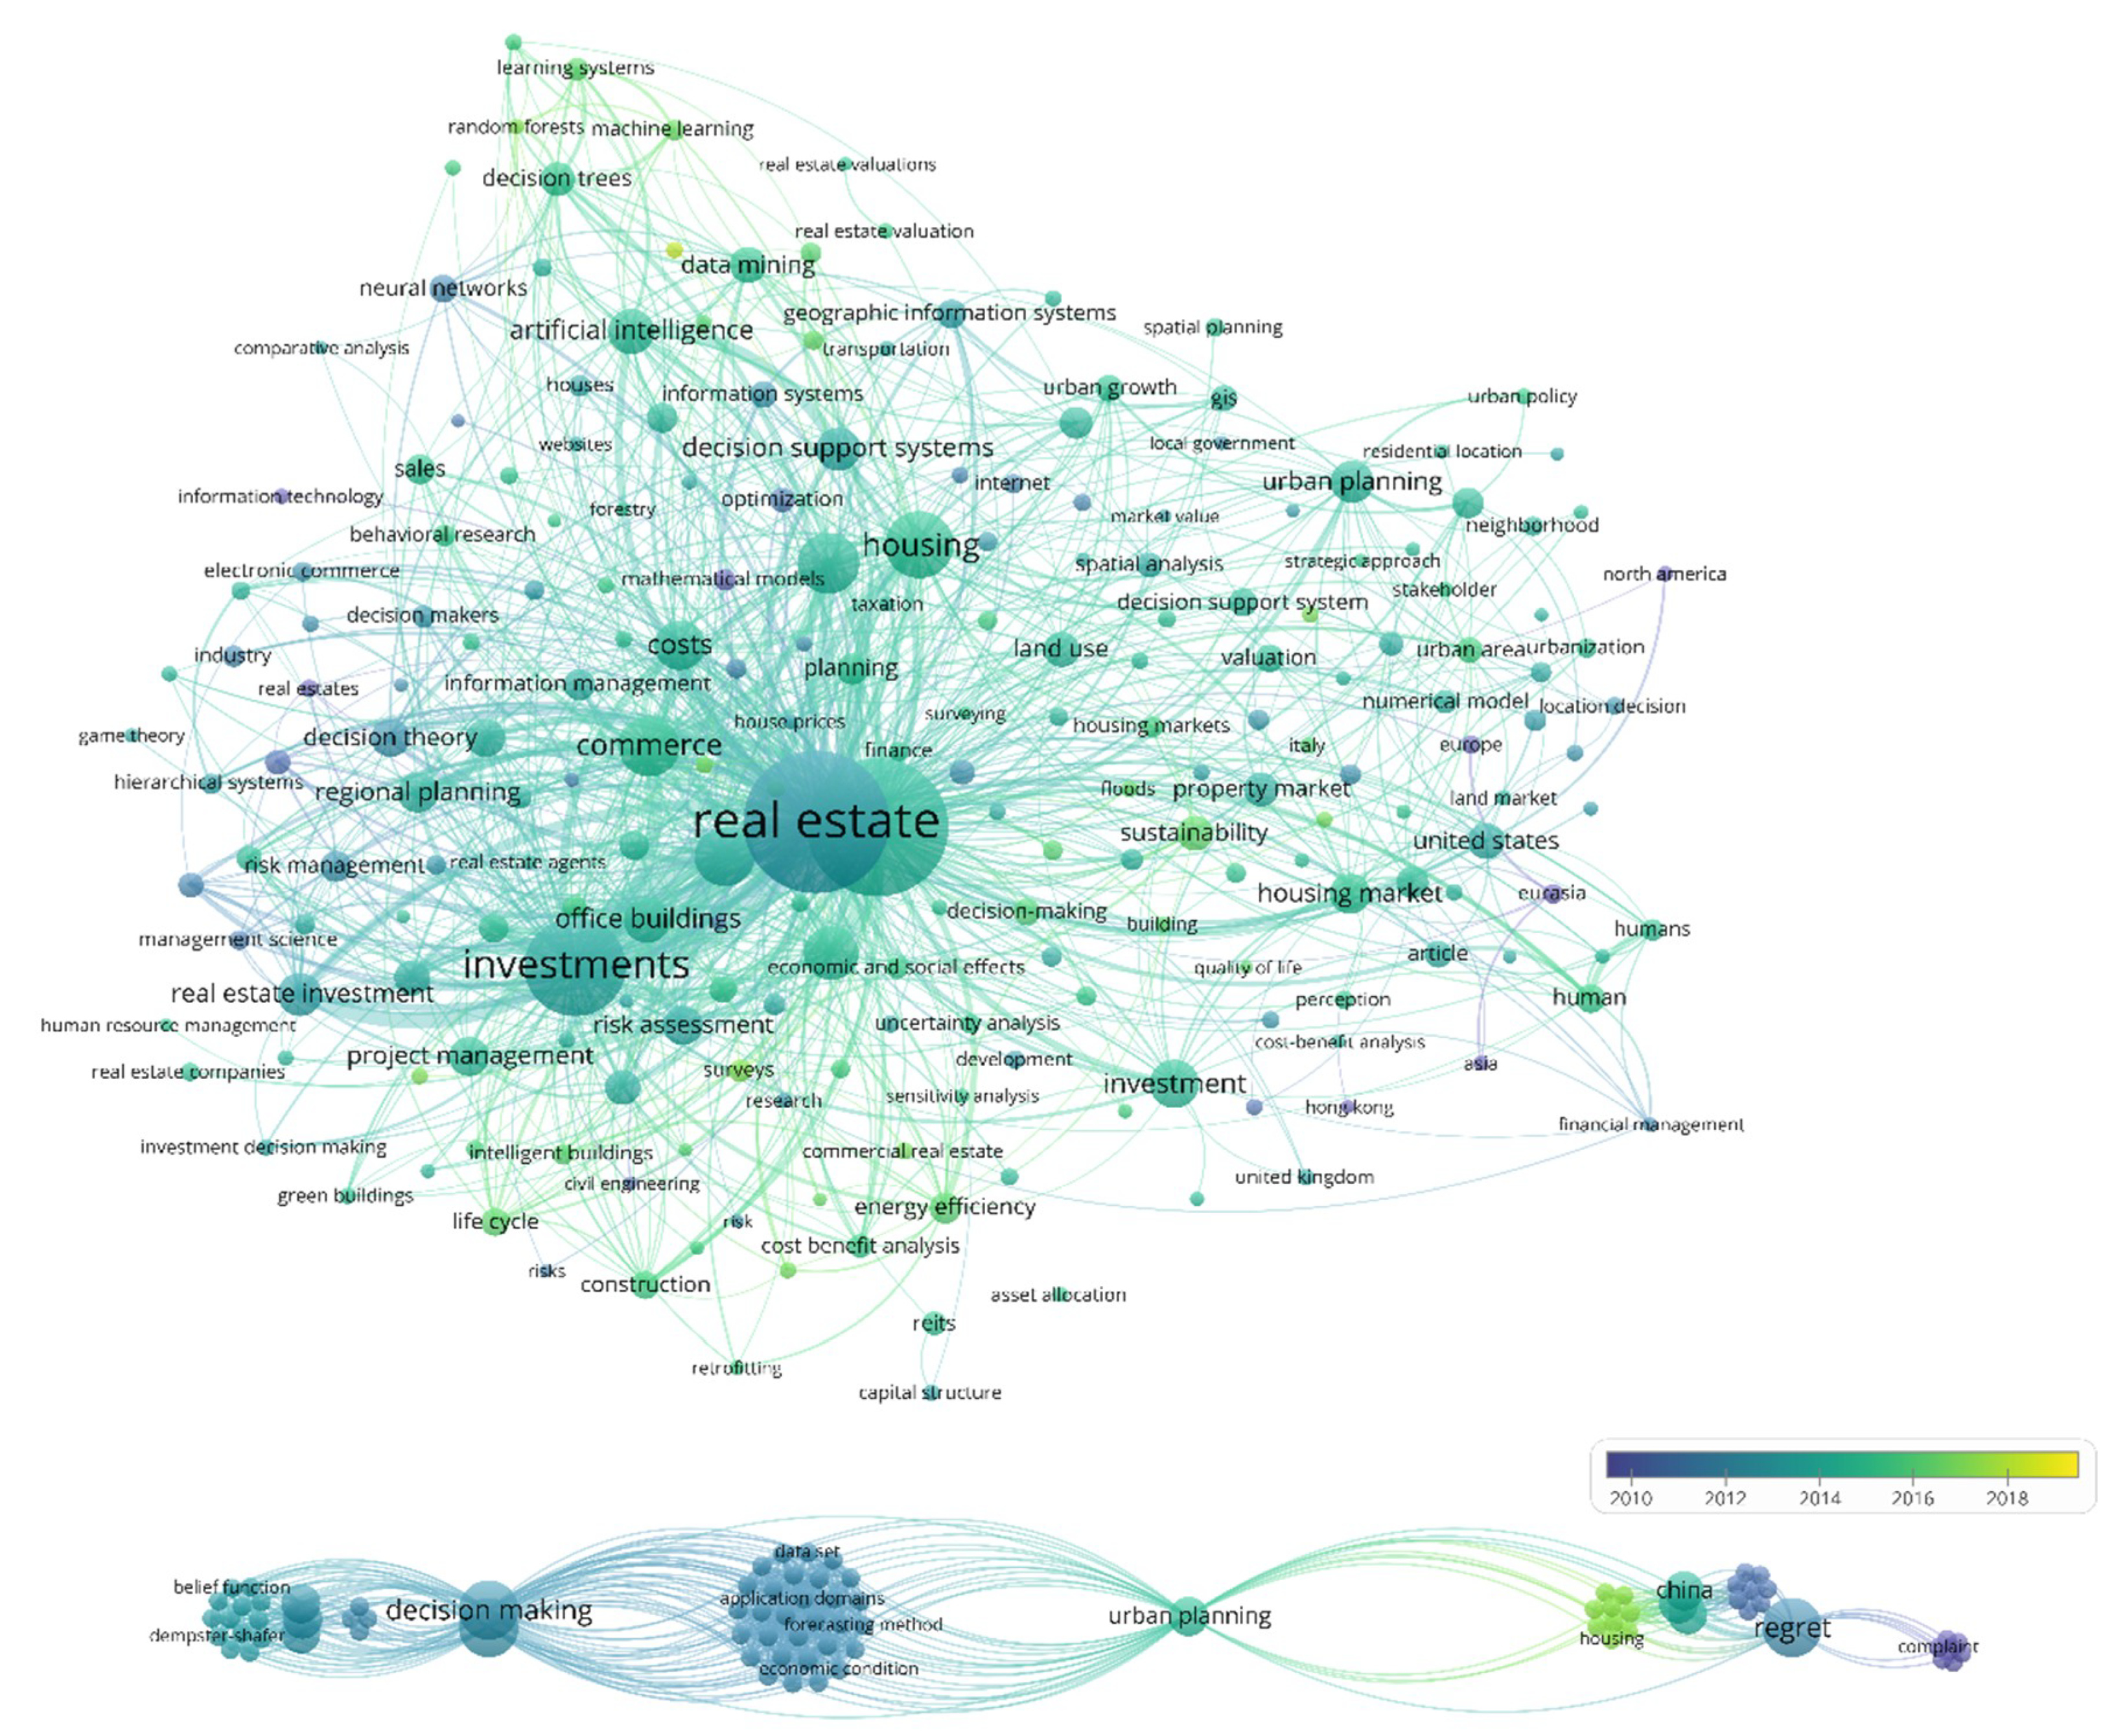
3.1. Information Retrieval Results

Based on the systematic review of the retrieved articles, criteria-wise analyses were performed on the data. The results in Figure 8 show that in P1, the regrets were dominated by HC and NEI with a contributing percentage of 27% and 26%, respectively. The emotional decision-making and inspection related regrets were minimum with 2% contribution to the overall regrets. On the contrary, in 2019 as per P2, things considerably changed with the BS getting an uplift with an increase of 12% regrets from 9% to 21%. A reduction of 12% was observed in HC. Similarly, IP-related regrets increased from 2% to 6% over the years, whereas the HS regrets remained constant.
The trend lines as shown in Figure 9 indicate the average values of the regrets and compares the scenario for both time periods (P1 and P2). As per the graph, NEI regrets dropped by 6% and currently stands at 20%. BS increased by 12%, EM and IP by 4%, and MT by 1%. Similarly, HC, and AG dropped by 12% and 4%, respectively. Although there have been drops in certain criteria and increases in others, the overall effects cannot be inferred from these data unless, and until, iterated continuously over time. As the currently provided data are one point in time, the missing dynamics limit the generalisation of overall regret status. Therefore, the authors used and designed a system dynamics modelling to show the overall state of regrets.
When the articles were reviewed in detail, it became evident that the traditional focus was associated with HC and NEI with factors such as affordability, ongoing costs, and rework, making most of HC. Similarly, information related to defects and quality of services dominated NEI. Most of the recent studies focus on BS with as high as 95%, 93%, and 80% of customers’ regrets associated with the complexity and tricky nature of BS only. Similarly, NEI still remain at large due to the high frequency of reporting; although the percentage is not necessarily high, the fact that almost all articles have mentioned NEI makes it critical. These two critical aspects are mainly associated with information management and subsequent decision making. This investigation motivated the researchers to restart the previously mentioned threads and investigate whether the current real estate organisations provide enough information to make a good purchase or rent decision. The choice of adding word “online” comes from the fact that today majority of the people search for information online rather than depending on hard published articles. Further, in the COVID-19 times, online information may be the only source of collecting data related to the properties for a foreseeable future. As reported by Ullah et al. [54], as much as 86% of people search for their homes online. According to the authors, the state of online information inclines the consumers to use or otherwise select alternate service. The state of online information based on its accuracy and completeness is crucial to decision making. Thus, the NEI and BS were investigated based on online information. Further, such online information and their qualities have become more and more important in current times where working from home, bans on property inspections, and advice to minimise travels are focused due to the global pandemic of COVID-19.
The text mining results of GATE software are shown in Table 5, which presents the count of the search strings of keyword “regrets” and the key identified regret sources such as NEI, HS, and others. For example, 55% respondents highlighted that they have regrets due to the house size, which means that the regrets column will also have one addition (due to the keyword regret in the sentence). Accordingly, in the above sentence, there is a mention of house size, which falls under HS, so one count is added to the HS column. Thus, all the major regret sources were added as annotation stacks to the software and searched for using the ANNIE application and inbuilt coding to highlight the count of each search item in the retrieved 118 articles.
Table 5 shows that a total of 11,660 words were mined from the reviewed literature. Among these, the highest reported regrets relate to the buy-sell process with a count of 3585 words making almost 31 per cent of the total. This was closely followed by the keyword “regret” with a count of 3201. Since these articles are mainly authored by people related to the information or finance sectors, the key focus was found to be on information, buy-sell process and mortgages. Whereas the terms pertinent to consumers such as size, costs and inspections were less mentioned. However, this is not the case in terms of the percentage contributions that have been used in the systems model and shown in Table 2. For example, although less mentioned, the term house costs have a significant impact in terms of the percentages, so the count should not be confused with the impact or contribution of the words to real estate regrets. Also, the least mentioned regret is that of inspections. This can be attributed to the fact that the majority of these articles are authored by the real estate agencies and their representatives whose major task is selling the properties and arranging inspections. This may give rise to conflict of interest; hence factors such as inspections and role of agents may have been glorified and less criticized in the retrieved articles. However, in the face of academic honesty, the facts and figures have been presented in Table 5 as they relate to the extracted keywords based on text mining without any modifications or authors’ influence. Nevertheless, to answer the possibility of exclusion of certain regrets due to the reviewed literature authors’ affiliations, the current study uses threads involving consumers’ opinions to give them a fair share of say and compare the results with the ones published and retrieved. Further to the text mining, VosViewer software was used to visualise the keywords repeated throughout the reviewed articles from 2010 to 2019, as shown in Figure 10.
Figure 10 shows that the most repeated keywords in the reviewed literature are that of real estate, investments, housing, commerce, decision support systems, sustainability, and others. Further, in terms of the articles linkage, the results further highlight three main connectors for all articles, which are decision making, urban planning, and regrets. Other sub connectors include belief functions, datasets, housing, complaints, forecasting, and others. The figure further shows a key focus on real estate regrets during the 2014-2016 period where the focus is mainly based on investments, decision support systems, and housing markets.

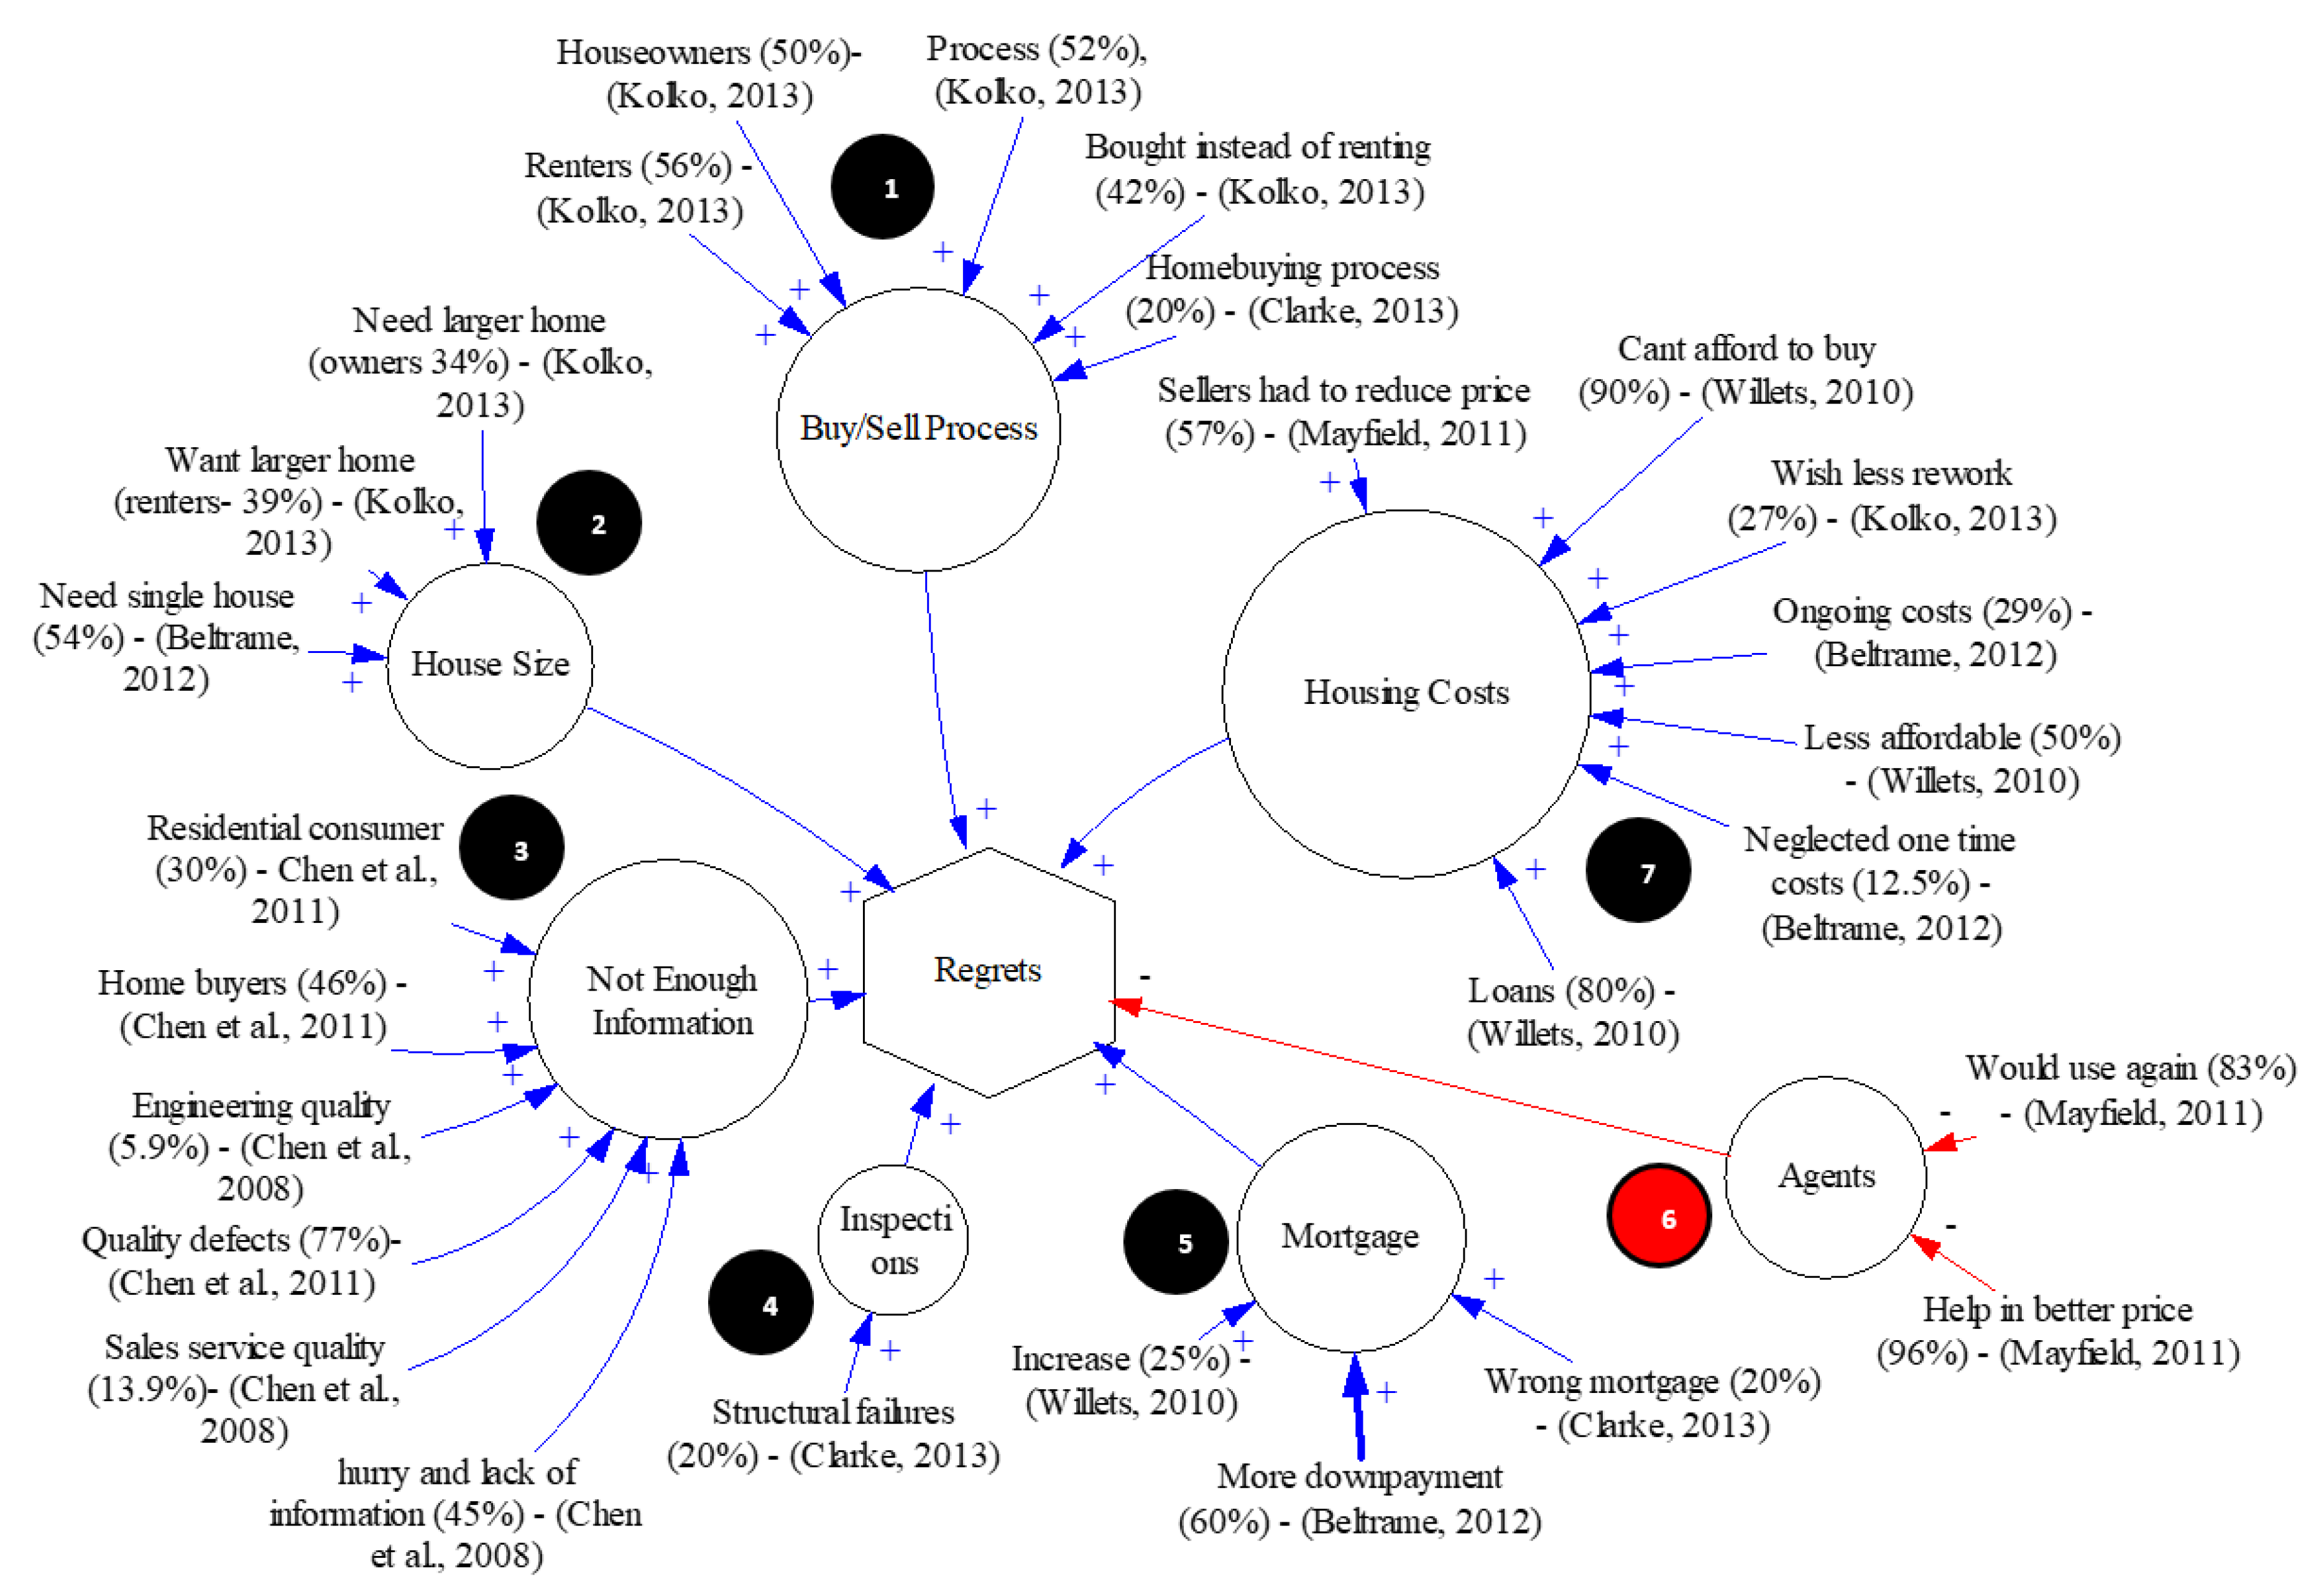
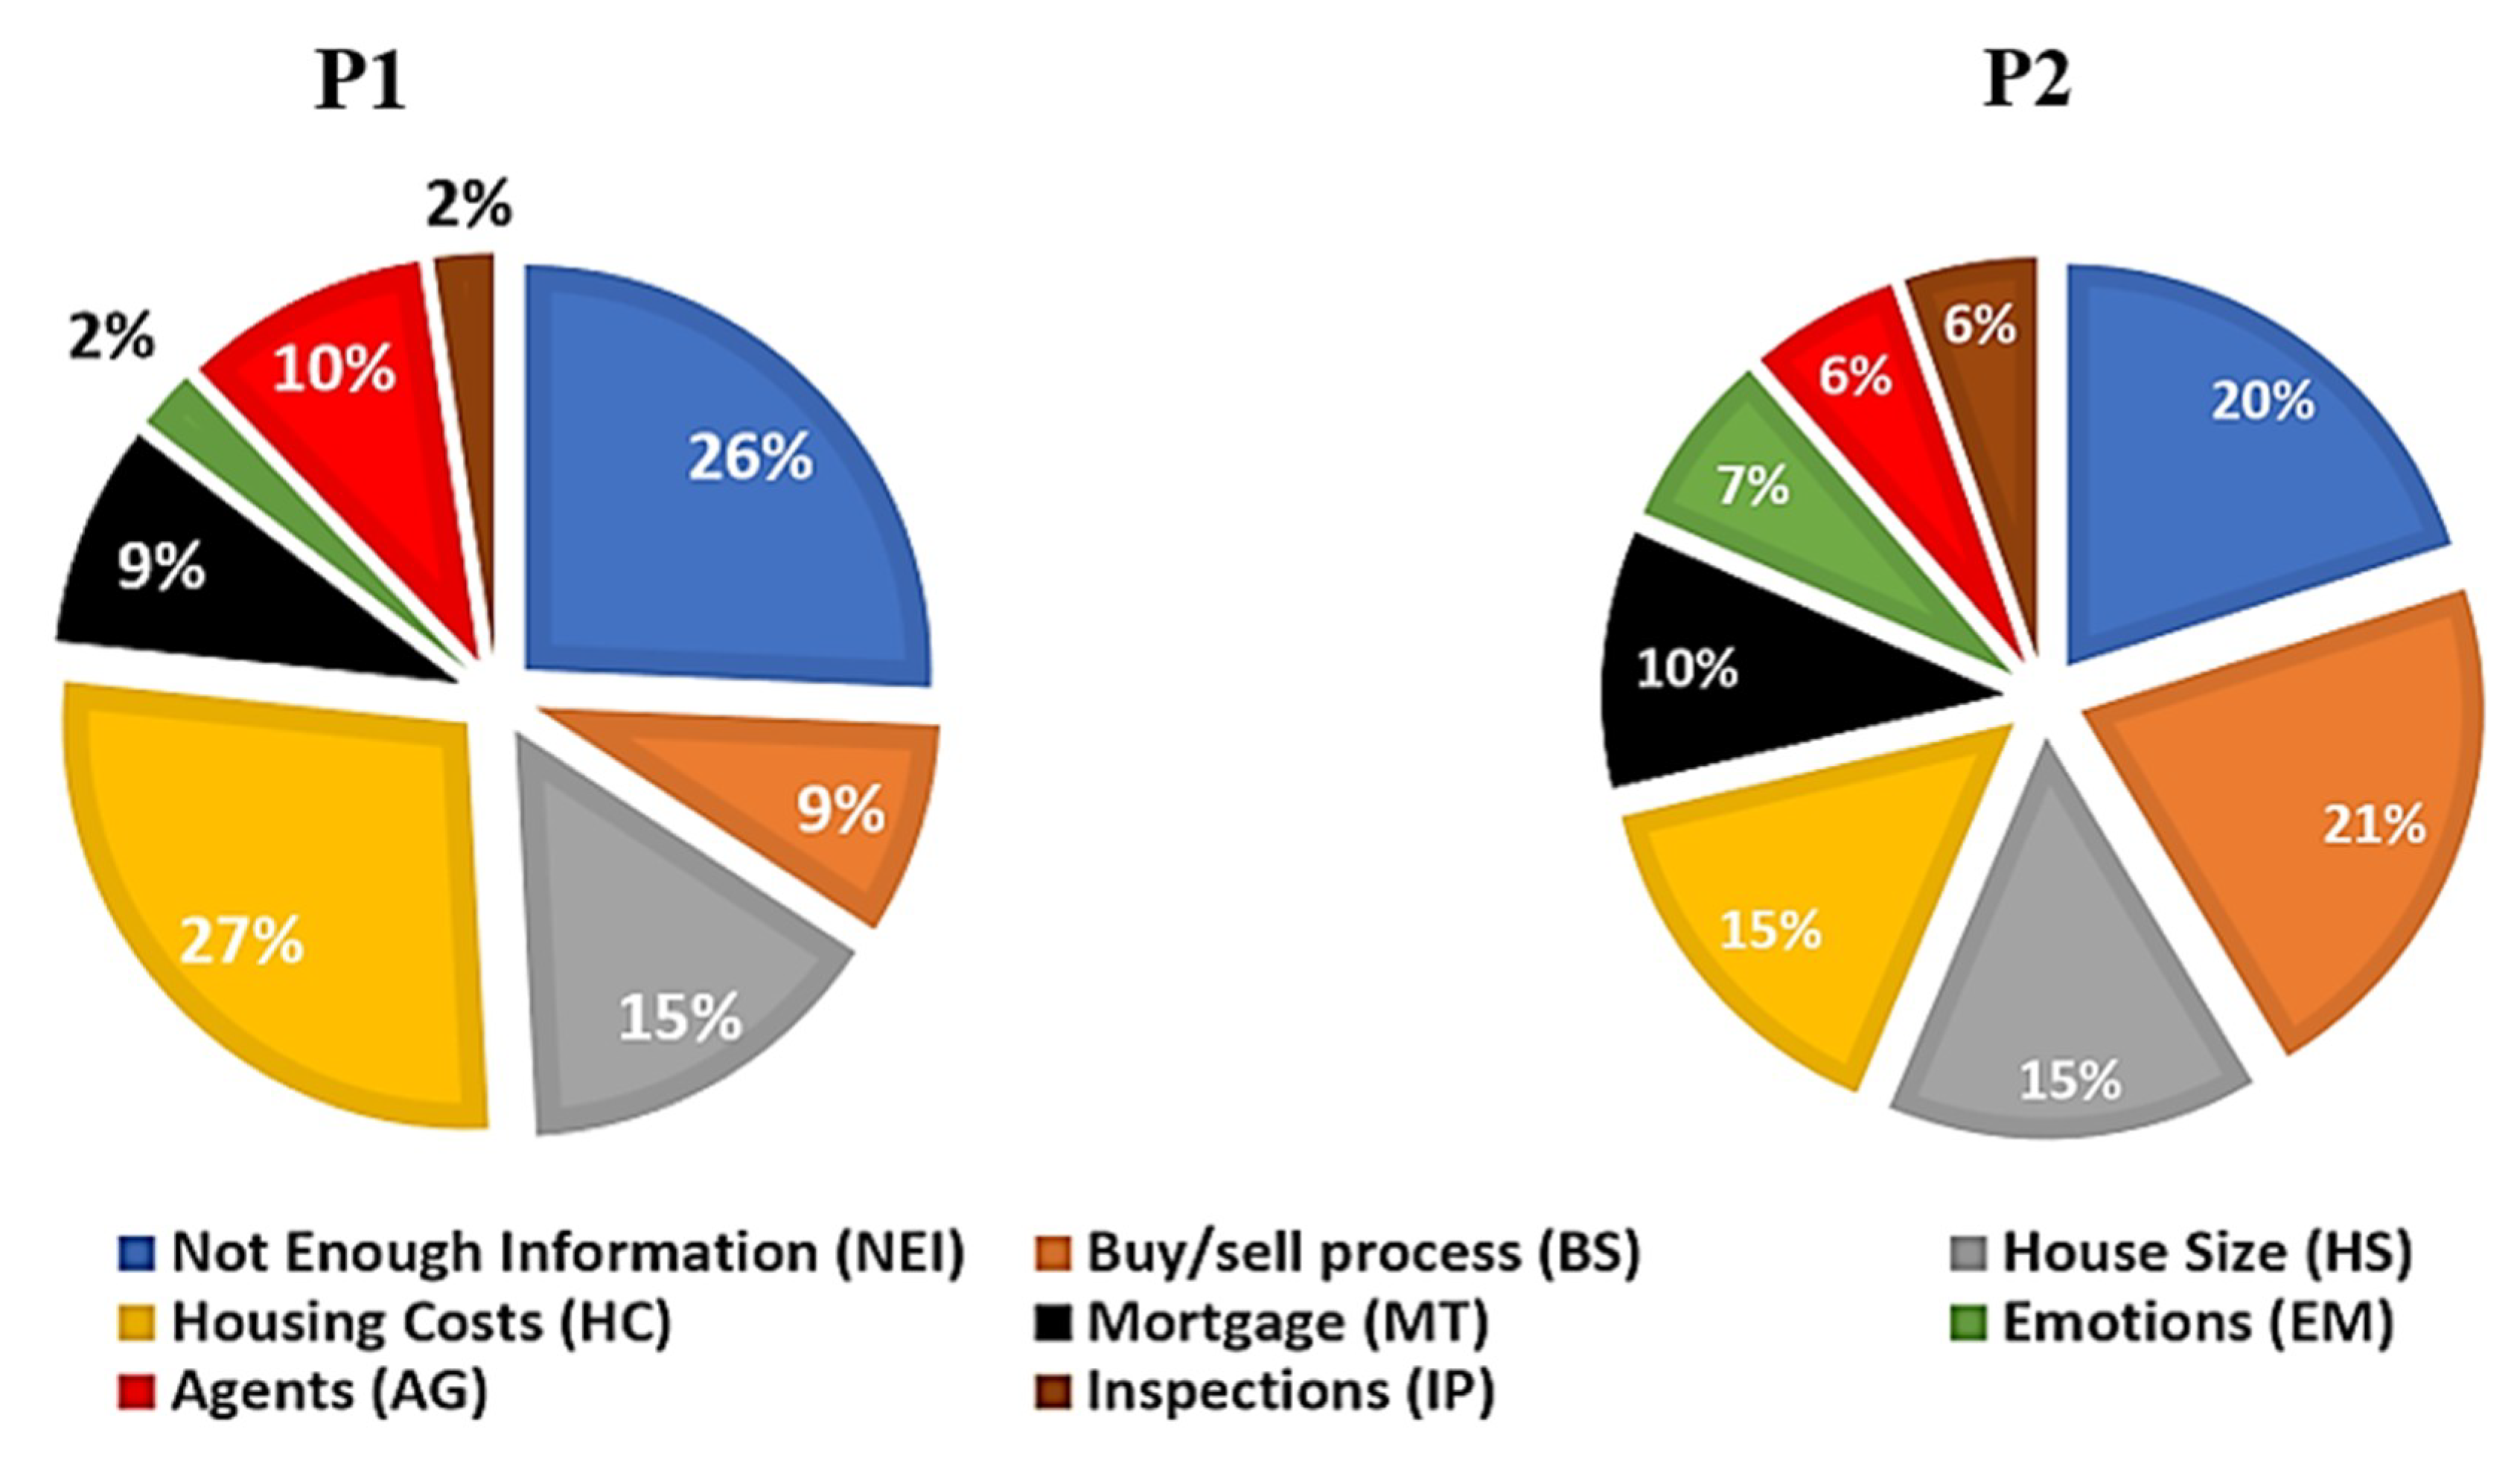
3.2. Systems Dynamics Analyses

Once the data were extracted from the articles, two systems models were developed for the two periods of investigation (P1 and P2). The extracted data were normalised and added to the systems models using Table 2 values as inputs. The values were iterated using Equations (1) and (2) in the model to display the overall status of regrets to date. As previously explained, the data were one point and cannot be generalised to predict the changing status over time, the systems models provide a solution for this. The data is iterated over 10 years from 2010 to 2019 using the distributions and normalised data given in Table 2 for P1 and P2. The iterations for P1 highlighted the regrets to be at 70% based on the input data at the end of the analysis period (2014). These 70% were taken as the baseline value for P2 starting in 2015 and similar iterations were performed to highlight the regrets percentage in 2019 as 88%. Thus, an overall increase of 18% was observed in P2 highlighting more disappointments in the customers. These regrets can only increase in the current times due to bans on inspections and more reliance on online data if not handled smartly. The model dynamically assigns values to the criteria based on its distributions and reports the trend with the bottom and peak values to date as shown in Figure 11. The x-axis in Figure 11 displays time in years, whereas the y-axis shows percentages for regrets. Similarly, in the case of the seven criteria, the y-axis shows normalized increase or decrease in values. The graph shows an overall increase of 10% in BS and 8% in IP. On the other hand, criteria such as AG, HS, HC, MT, and NEI are showing a decrease. The impact of BS is quite high in terms of its contribution and the fact that it dictates the whole process of buying and selling, thereby inducing an overall increase in the regrets. Emotions-related regrets cannot be iterated due to the absence of their articles in the first period of investigation (P1).
The results show an increase in regrets related to BS and IP. The same has been reported in the graphs generated from the retrieved 118 articles. This clearly shows that over the years, a considerable increase has occurred in regrets due to lack of understanding of the process of buying and selling. This includes using and extracting online information, the hidden costs, experience, how the agents work, and others. Similarly, in terms of other regrets, lack of inspecting the properties in person and over-reliance on online information that is perhaps unreliable and inaccurate to make better decisions are reported. However, looking at the recent trends where there are bans on physical inspections, virtual methods such as 360 videos, mobile laser scanners, virtual and augmented realities, and gadgets-based immersive inspections may be the way forward [3,13,20,74]. Further, the anomaly in the results of published literature and the systems model is due to the fact that the model considers all possible factors contributing to the criteria that are iterated continuously from 2010 to 2019 using P1 and P2 whereas the articles only present one-point data in a specific period; therefore, minor anomalies exist in terms of values. Further, the system-dynamics-generated graphs take the dynamic behaviour into account whereby a criterion and its factors can have variable values depending upon the number of iterations. Thus, a smoother transition is observed over the years compared to the values in studied articles. Also, as compared to the article from Trulia [24], who state the regret percentage to be 44%, the current model reports double the value. This is due to two reasons. First, Trulia’s article is limited to USA only, whereas the current model is developed based on 118 different articles with much larger respondents’ pool from the US, UK, and Australia. Second, Trulia’s regrets are limited to home selection process (BS) only, whereas the current model considers seven other dynamic variables, therefore predicting the much larger level of regrets.

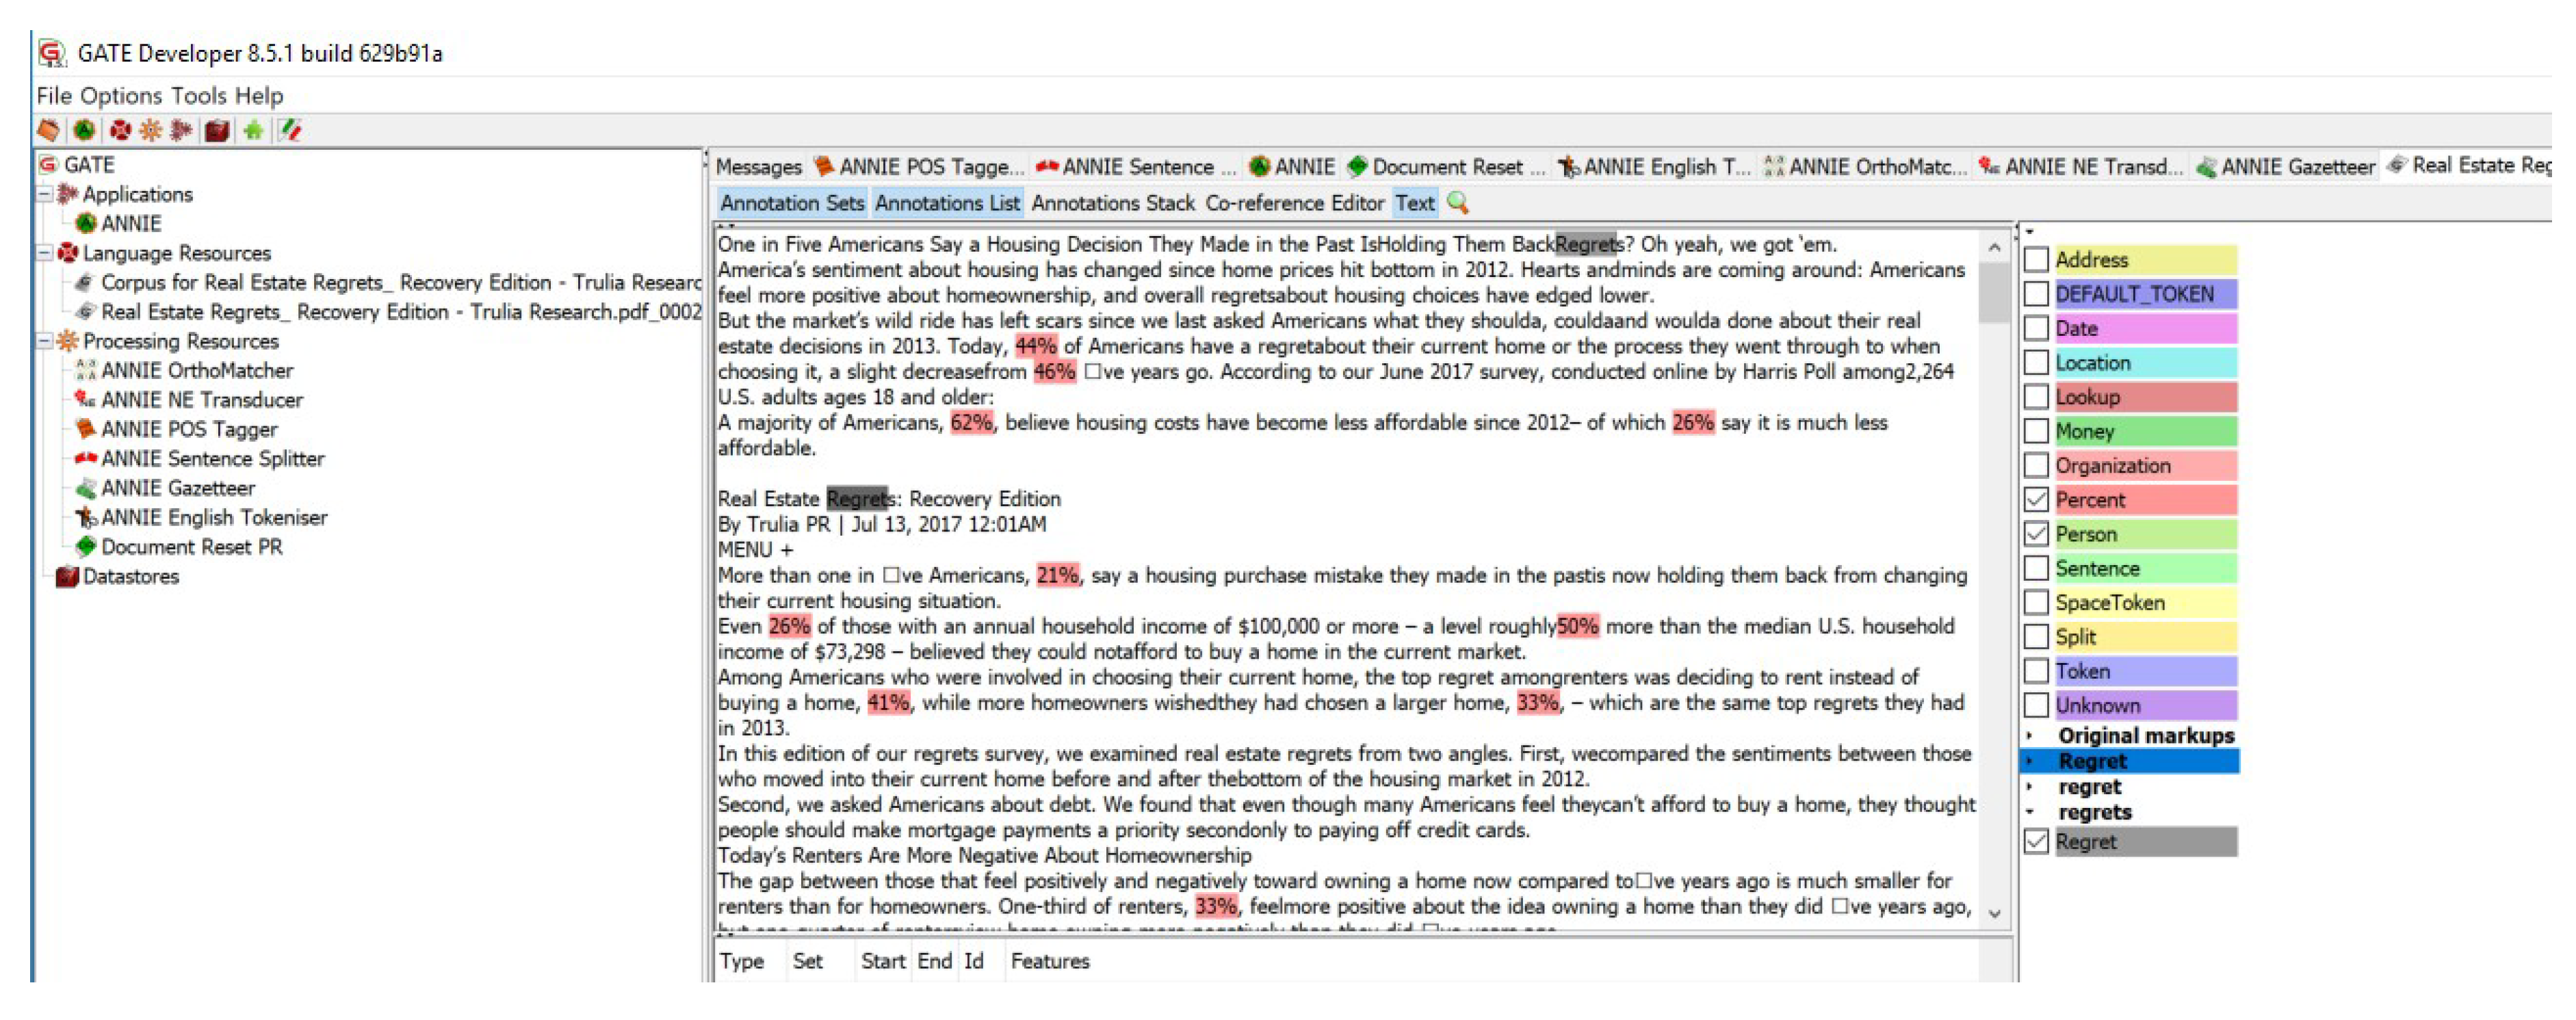
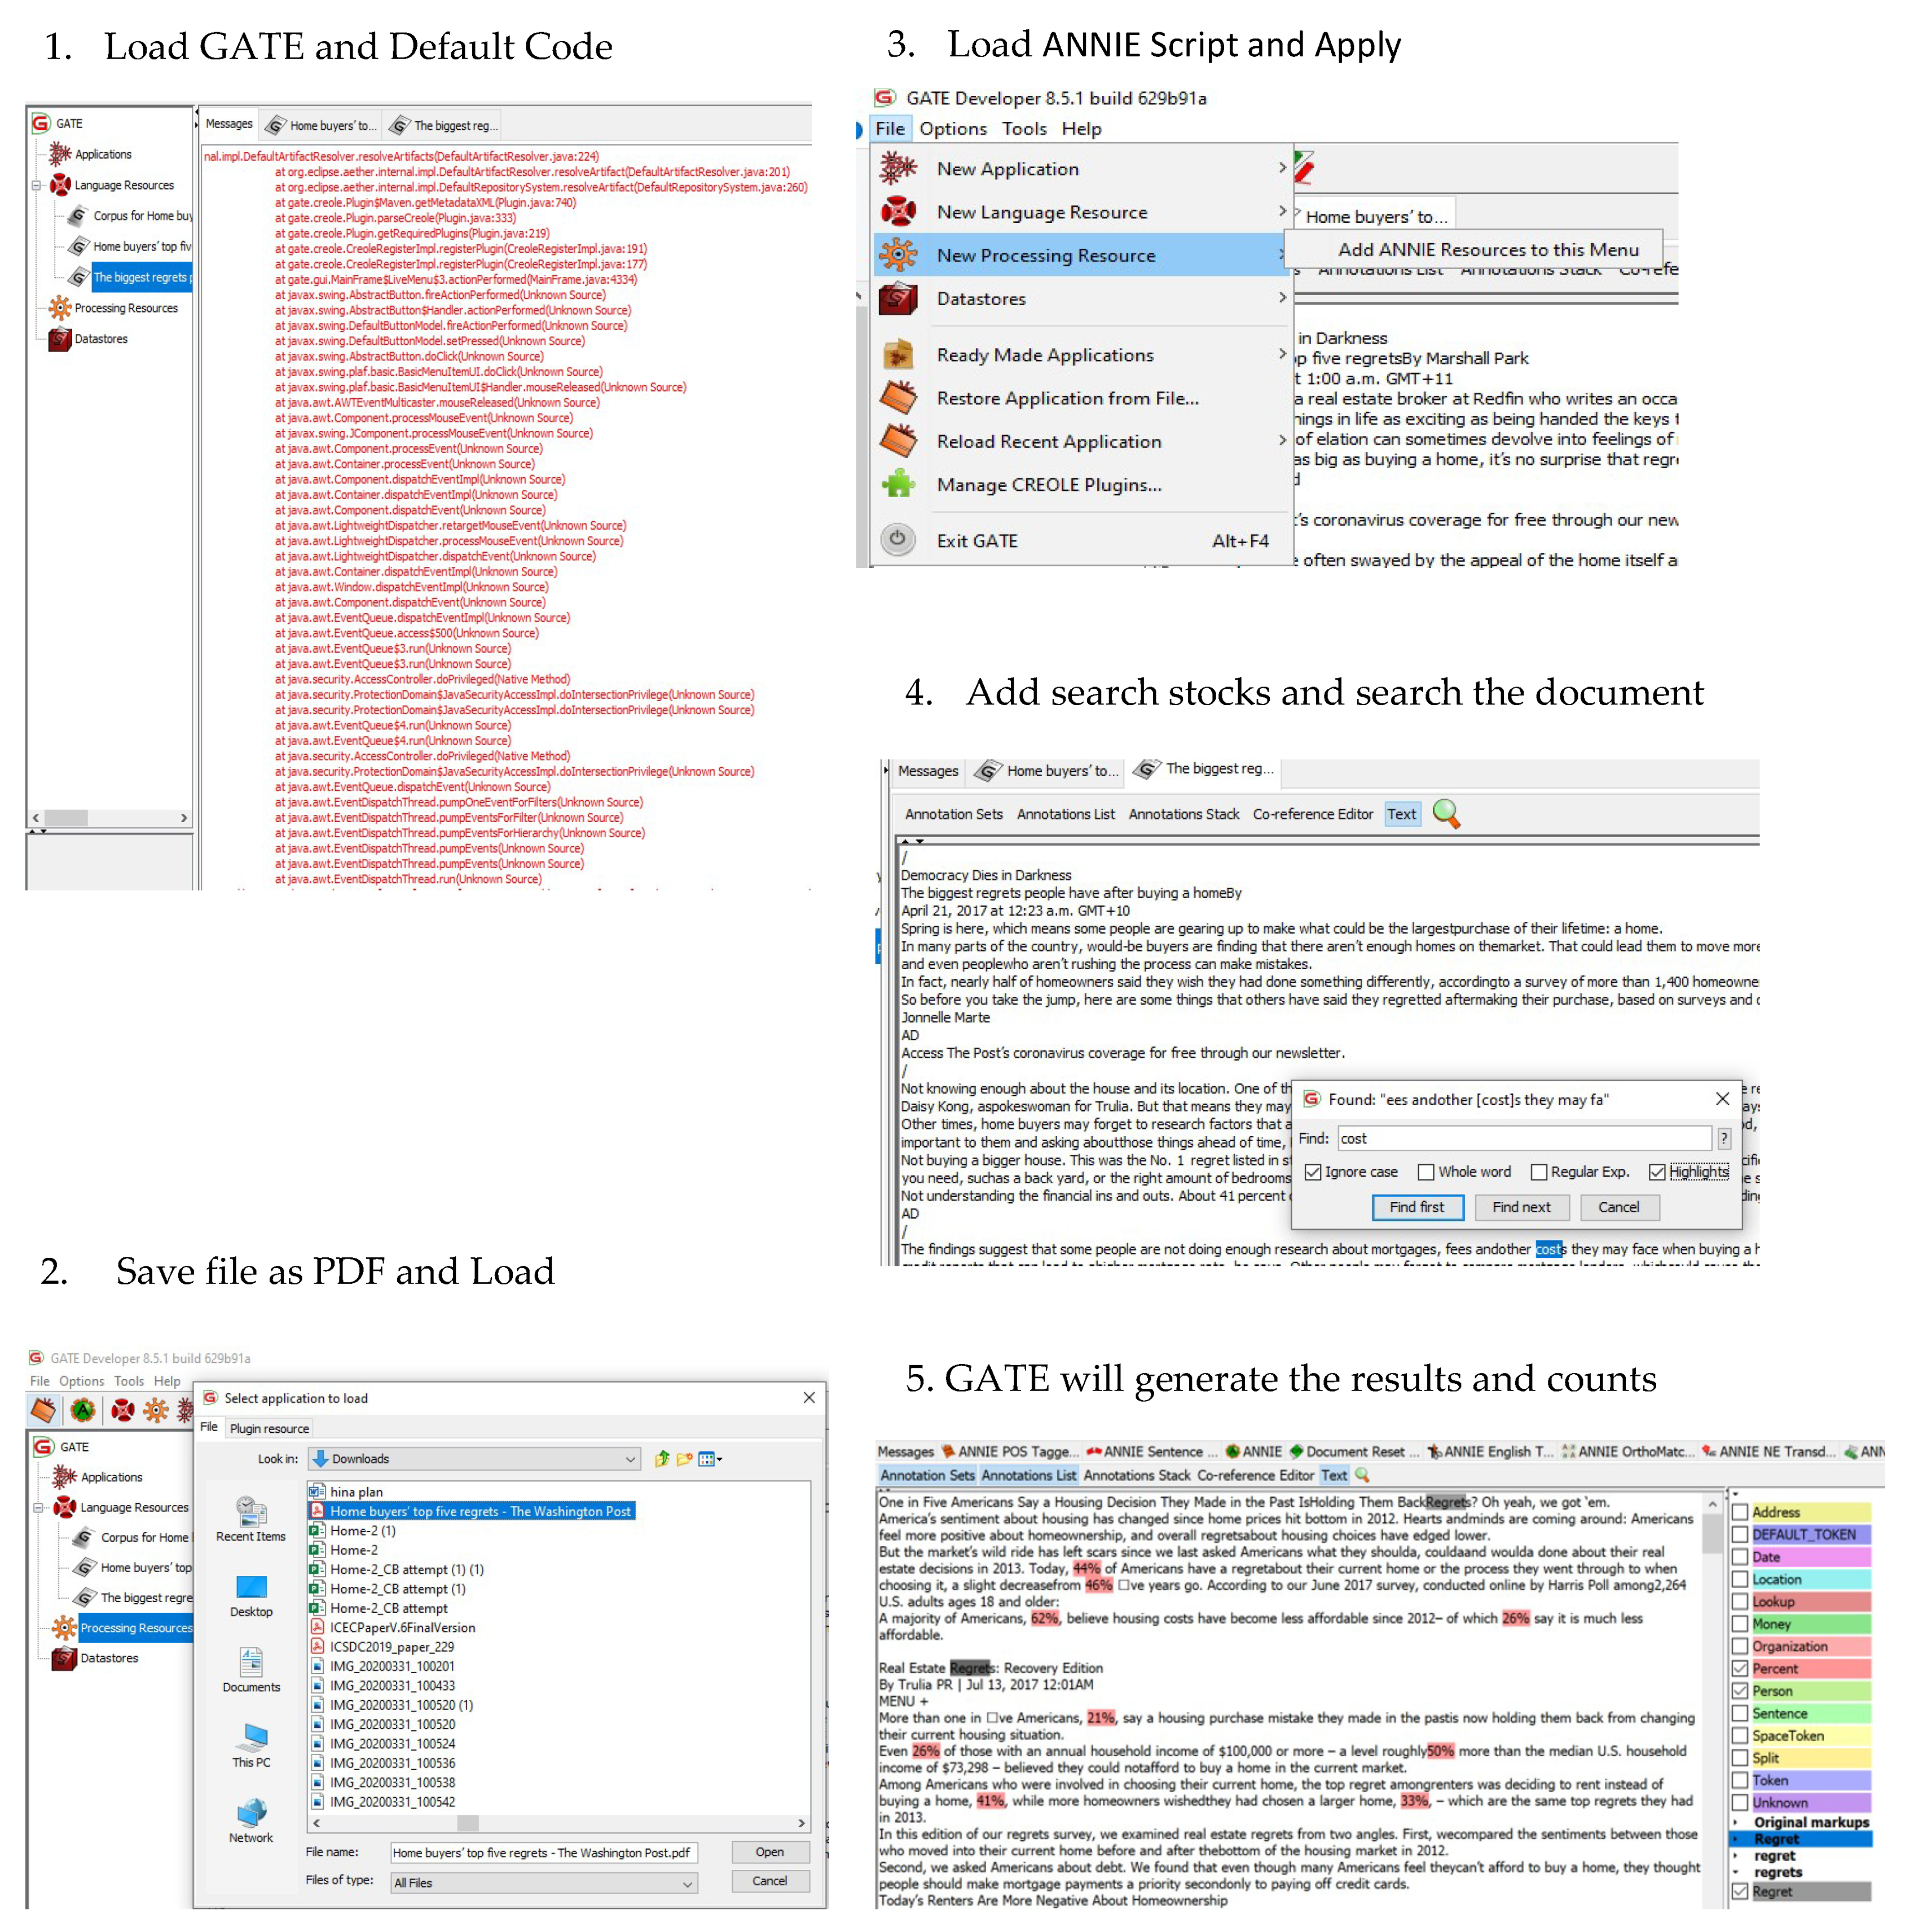
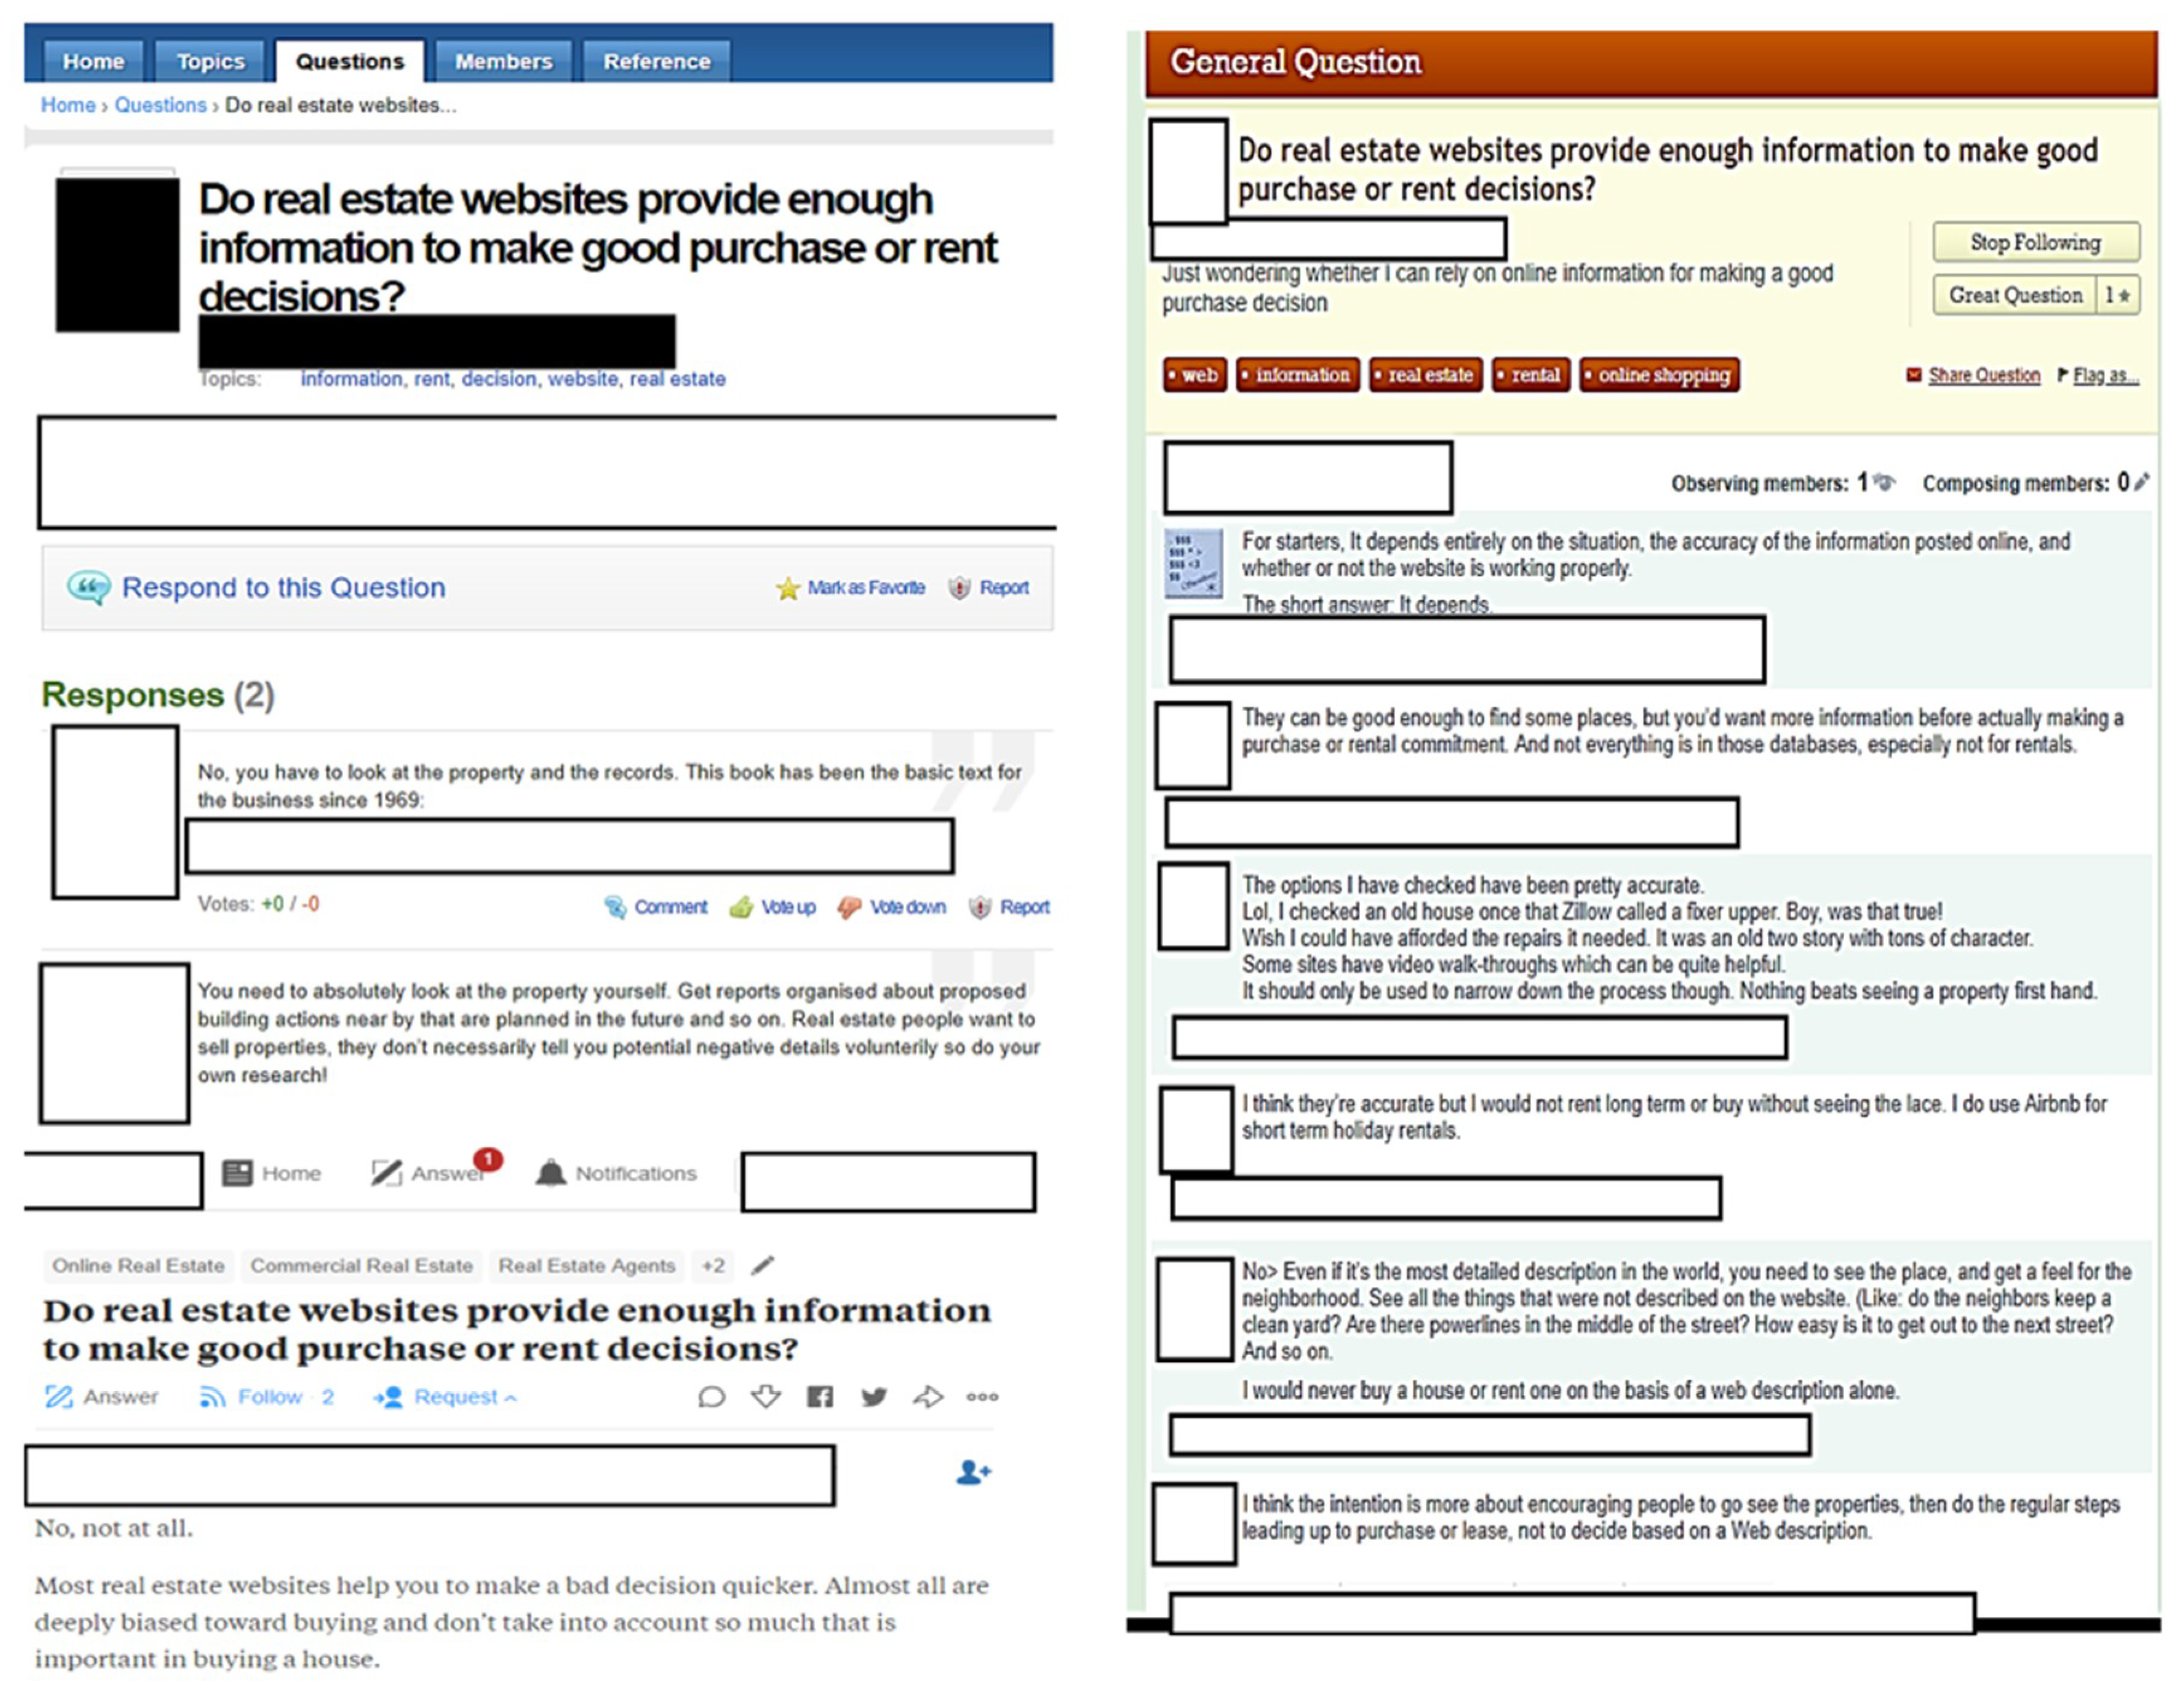
3.3. Online Discussion Threads Analyses

As mentioned in the thread sections of the method, multiple discussion threads were investigated as part of the study. Four threads were utilised from already published data and five threads (one each on five websites) were started in the current study to get recent and very specific data. In terms of the previous threads, a total of 135 discussions existed along four threads since 2010. Table 6 shows the results obtained from the text mining analysis based on keywords and excel sheets. It shows the reported regrets (R) and happiness (H) as per the systematically analysed threads. It further shows that in both P1 and P2, the R are much more than H. However, compared to P2, the H are much more in P1. As reported by the majority of the people during that time, the investments were made in the early 2000s and 1990s before the housing market boom hit the market, thereby the regrets were lower, especially for Australian respondents. The regrets related to costs and expenses were very low due to the high return on investments. A respondent from Perth admits buying a house in 1999 for $130K and selling it in 2004 for $335K making $205K profit in five years. Similarly, another respondent stated purchasing an old house in 2003 before the Brisbane boom and selling it after two years for double the price. Keeping in view the financial boom of the market, people purchasing in early 2000s enjoyed the fruits and were reportedly happier as compared to the people entering the market lately. Overall, by comparison of P1 and P2, it is evident that regrets have slightly increased from P1 to P2. However, the level of satisfaction and happiness have gone down significantly over the two periods of analyses and must be addressed and investigated for uplifting the state of real estate. The state of regrets, if not addressed smartly and with dexterity, may reduce the chances of swiftly recovering from the effects of COVID-19 on the property markets where the business is observing significant losses and reductions in revenues. Further, in terms of the eight previously identified regrets groups, the highest reported regrets are that of NEI followed by BS, HS, and HC. In terms of satisfaction and happiness, it seems that BS happiness is increasing with people becoming more and more aware of the buying and selling process; however, the issues with NEI still remain at large with more regrets and less happiness. The revised BS process as the new normal in COVID-19 and post COVID era may increase the regrets of customers if not addressed timely.
Overall, in the 135 discussions, 183 regrets were mentioned as compared to 54 happy purchases. In terms of individual criterion weights, renovation and transaction costs lead Table 6 with 31 and 32 reports, respectively. Similarly, house size, neighbourhood details and information, lack of information, house design, and impatience in the decision are other notable regrets enhancers during the study period as per the text mining results of reviewed threads. Renovation requirements is one of the regret enhancers. A respondent in the reviewed thread argues that after buying a house, they discovered a huge need for renovation due to quality and structural defects that have been covered during the inspections and in the presented pictures. They spent huge sums on it until they had no money left for renovating bathrooms and kitchen, which did not make them feel positively. They even put it for sale for 18 months, but no one showed, and as a result, they are stuck living in a place they do not like. Another respondent indicates the house design and layout as a regret source. She argues that even knocking down the walls and moving stuff into the basement did not work for them. The house’s lack of space and an odd layout made them regret their purchase decision. She argues that since they had a sale on the weekend, which they could not afford to lose due to time constraints and family commitments, they decided to move into the house without putting much thought into it. Thus, the impatience and pressure to move in made them select the wrong house and are therefore regretting it.
House size and neighbourhood details are important aspects of the house when it comes to post-purchase regrets. A respondent in the reviewed threads indicated that house size is usually not considered from a futuristic perspective. She argues that they initially planned two children, but once they changed their mind and had four children, the place was never enough, and they have regretted it ever since. Further, adding a room to the congested house cost much more than adding two rooms in a large house so it was far beyond their budgets. Additionally, the garage was converted into a laundry room due to lack of space, forcing them to park their cars on the street, thus creating safety risks and proneness to theft. A respondent indicated checking the neighbourhood details before buying a house as she bought a house later to discover a train track nearby, therefore regretting buying instead of renting. Another respondent indicated the same about the importance of neighbourhood details and argue that they moved into a neighbourhood that was famous for drugs and crimes and were consequently raided five times in six months. Eventually, they moved out with huge financial losses. A respondent indicated moving in too quickly and without any research, leading them to much higher costs and unaffordable mortgages. She expressed that if she could go back in time, that it would be a priority decision to revise. Similarly, another respondent indicated the lack of natural light in their house and indicated the inability to cope up with it even after four years of residing there. They decided to move out eventually and find a better-illuminated place. Since physical inspections are not currently possible, a way to get the neighbourhood information and know-how can be using personal transport sources for checking the neighbourhood without interactions with others, in line with social distancing rules. Further, more information about the neighbourhood, distances to amenities, interactive maps, virtual- and augmented-reality-based 3D models, 360 and drone-based videos of the neighbourhood, and other digital sources may help the customers deal with neighbourhood requirements in COVID-19 times [3,13,74].
To verify the results of text mining and previously published threads, multiple threads were started by the authors in 2019 as mentioned in the method section. The process involved the real estate consumers, experts including managers and professionals, and agents. A total of 23 responses comprised of seven managers (M1 to M7), a photographer (P), five agents (A1 to A5), and 10 consumers (C1 to C10) were received where these respondents were involved in the discussions on five different website threads generated by authors of the current study as shown in Table 7. The results based on text and keywords mining show that more than half of the respondents (60.8%) insisted on proper inspections to avoid regrets based on online real estate information-related purchases. This, although hard to pull off in the COVID-19 era, may be achieved through provisions of more and accurate online information and adoption of disruptive digital technologies. M1, a consultant at an organization in Florida with more than 40 years of experience, highlighted the importance of inspection and indicated walking and inspecting the land as a must for good decision making. He further adds to review at least five years of financials of the commercial property to know the real worth and not to trust the salesman’s words or website information to be true. Similarly, M5, a Cambridge-based expert with more than 30 years of experience, insisted that online information only pushes you to make a bad decision quicker. He argues that there should be much more to the buying process than simple figures such as opportunity costs, freedoms, crimes, stability, children, etc. Additionally, for the information to be reliable, he suggests adding features such as community lifestyles, commuting costs, the investment term attractiveness, number of children, the overheads, and cashflows. These key aspects are in line with the results of the articles studied in this paper and can be clustered into the two top regret reasons of BS and NEI. A new category of web information (WI) can be seen in the Table 7 as most of the responses indicated the accuracy, reliability, and presence of web-based information.
P1 admitted to the fact that real estate photos are intentionally tuned and captured at angles that show the best features only and are never intended to show the full story. For instance, if the house looks fantastic except for one of the bathrooms that have “pepto bismol” pink fixtures and wallpaper from the 1970s, the listing will leave out pictures of that bathroom. Or, there may be a water tower behind the house. It is fraudulent to “photoshop” the water tower out of a picture of the house; that is a major no-no. However, it is not fraudulent to take a picture of the house at an angle where the water tower does not appear. He further explains that the purpose of real estate photography is to make you go and check the property and then decide, thus making decisions based on mere photos and insufficient online information often ends in regrets. Nevertheless, the practice of virtual furnishings and virtual features of the properties is widely used by top-ranked agents and agencies and can be misleading sometimes. He further added that the valuation at such online platforms is usually wrong, which has also been argued by M5 as well as Hanan [93], Kucharska-Stasiak [94], and Poursaeed et al. [95]. Hanan [93] argues that instead of reproducing concrete values, Zillow (one of the leading real estate websites in USA) produces home value by virtue of the site’s linguistic organisation. In other words, by immaterially articulating itself to the material structure of the home, Zillow’s existence guarantees the home cannot be valued through their presentational framework that it proposes to operate within. Similarly, Kucharska-Stasiak [94] argue that the valuation reports generated by online platforms and websites are generally based on market value rather than the market average and overlooks the typical transaction prices in the investment market or in the rental market because they do not clean the market information by removing the extreme values, which renders most of the valuations wrong and impractical. To address these shortcomings, Poursaeed et al. [95] proposed a novel method that re-estimates the value of properties based on luxury levels of properties using deep convolutional neural networks on a large dataset of photos of home interiors and exteriors to highlight that such systems outperforms Zillow’s estimates. In similar lines, P1 explains the case of Zillow’s CEO Spencer Rascoff selling his own home for much lesser than the “Zestimate” feature offered by Zillow. Hence, the market analysis should be carried out with proper research before making a good decision based on the real value of the property instead of relying on the online estimation tools or websites. He concluded that there is no good shortcut for a full comparative market analysis (CMA). Realtors do a CMA for sellers, to determine a good valuation of their property for sale, but they also do it for buyers to determine a good offer price on property to buy. Thus, it is better to leave the job to a professional agent or realtor than trusting websites. In the current times, with restrictions on large gatherings and bans on inspections, this can still be achieved through online means such as team meetings or phone calls.
All the agents indicated inspections as the main factor following the online data. It is obvious since it is in line with their job specialties. A1, an agent at a San-Antonio-based firm, stressed the lack of information and its accuracy on online platforms. She indicated that the truth and information is manipulated in a way that suits the purpose of the website and information providing company and may not be a real representation of the ground realities. A5, another US-based agent, stressed the need for checking and organising the property records and nearby planned actions by the state or local councils’ in conjunction with inspections. Further, he stressed the need for more information and doing research on your intended property before taking a decision. A2, a Texas-based agent with 20 years of relevant experience, highlighted the estimation error by real estate online information provider. According to him, the valuation based on real estate websites is often wrong. Further valuation, such as Zillow’s Zestimate, has been proven to be 7%-10% off since the involved people usually do not view and inspect the home properly for true pricing and generally base their pricing on word of mouth or market trends. Such a lack of valuation tools and associated errors have been reported in the reviewed articles and threads, thereby validating the results. Likewise, A3, while accepting an abundance of information on online real estate websites, stated that there is a lot of information on real estate sites, however, to get accurate information before making a decision, hire a realtor as a buyer’s agent, no charge, and they will do the research to ensure a good investment.
For the consumers, the top factor in line with the previous discussion was also inspections. Five out of 10 consumers reported the need of inspections to make good decisions. Further, such inspections are more critical these days due to the lockdowns and lack of physical inspections. Virtual inspections are prevalent these days in many countries, including Australia, where the agents are using videos and more pictures to deal with physical inspection requirements. However, such pictures are prone to manipulation, therefore the digital tools such as virtual and augmented realities, 360 videos, laser measurements and 3D scanning, and digital gadgets and drones must be utilised to deal with the consumers regret related to physical inspections [3,13,20,74]. The second most reported factor is website reliability and reputation. C1, a US-based buyer, indicated the accuracy of online information, the speedy results, and reliability of the website as key to making better decisions. Similarly, C5, another US-based consumer, indicated the accuracy of the information and the need to visit and see the neighbourhood firsthand as key factors for making good decisions. As an example, she highlighted the need to observe the neighbourhood and see whether neighbours keep a clean yard. Other investigations may include questions such as “Are there any powerlines in the middle of street and how easy it is to travel to and from the location?” Such inspections can be made through personal cars without needing to get off the car and interact with people, which can help prevent the transfer of COVID-19 in line with the social distancing rules where at least 1.5m distance must be kept between people. She concluded it by stating that she would never buy a house or rent one based on a web description alone. C3 supports this and mentions that the intention of real estate websites is more about encouraging people to go see the properties, then do the regular steps leading up to purchase or lease. They should not decide based on a web description alone. However, the physical inspections are not possible in COVID-hit environments, and alternate digital tools and sources must be utilised for inspections.
Similarly, C8 recalls a story where a couple bought a house with a snake den under it. After getting rid of the 15th snake and consulting the professionals, they concluded that there was no way of removing it, so they had to move and leave the place with huge losses as no one would purchase it. Such information is usually hidden from the consumers and must be shared with the potential renters or buyers if the trust is to be restored and enhanced among real estate businessmen and consumers to help make the business more transparent and sustainable. This was complemented by C9 who states that inspection is very important and websites tend not to cover the stuff that inspections cover anyway. C10 augments it by stating that unless you are on-site, you cannot see how a space or a neighbourhood feels. All the other responses are shown in Table 7. Overall, the highest influential factor is inspection, followed by less information and accuracy of the information for making good decisions to rent or buy a property based on online information. These are in line with the key highlights of the studied articles whereby the NEI and BS emerged as key regret sources associated with the real estate consumers’ rent or buy decisions.
However, it is easier said than done in the current times where physical inspection is almost impossible to conduct due to COVID-19 induced lockdowns. The adoption of rigorous measures and technologies are required to help uplift the real estate industry to a more tech-oriented and digital industry for moving towards a smart and sustainable real estate sector. Extensive measures from all stakeholders, including the government, consumers, agents, and real estate managers, are required to initiate and adopt sustainability measures in the industry. In the era of lockdowns, bans on inspections, and increased sustainability concerns, virtual inspections based on gadgets and 3D scanning, 360 videos, virtual and augmented realities, and drone-based inspections can help reduce, if not eliminate, the real estate consumers’ regrets [3,13,20,74]. Sharing and disclosing more and high-quality information, sustainability disclosures in line with the latest initiatives such as the Queensland government sustainability disclosure policies, and financial assistance or funding made available to the real estate consumers may help uplift the industry, reduce the regrets, and help transform into a smart and sustainable real estate industry.

4. Conclusions

This study analysed 118 articles published over the last decade supported by pertinent literature and online discussion threads to highlight and observe the trend of real estate consumers’ regrets over the last decade and how things can be handled or improved in the COVID-19 era. A total of eight influencing factors have been highlighted that contribute to these real estate regrets, which are NEI, BS, HC, HS, MT, AG, EM, and IP. Based on a system dynamics model and subsequent analyses, a total increase of 18% occurred in the post-purchase regrets among house owners and renters and is currently at an alarmingly high level of 88%. Among the main reasons, the lack of understanding of the BS process and inspections have increased considerably (10% and 8%, respectively) over the last decade. Similarly, NEI regret, though recently reduced, is still at large at a percentage of 20%. Overall, the HC-related regrets have reduced over the last decade mainly due to investors getting a profitable return on their money due to escalated house prices. Similarly, the external agents helping with inspections have reduced the agent-related regrets. Additional emotional decision making is promoting EM-related regrets that are mainly associated with family and friends’ pressure and neighbourhood affiliations. The keyword and text mining-based analyses of the retrieved articles show that most online published articles are using the terms BS, MT, and NEI as keywords. Further, more than half of the user generated threads’ result point to the lack of, or improper, inspections that later escalate into regrets and promotes unhappiness or discontent with the purchase or rent decision. Things can only go downhill from here in the COVID-hit environment if not handled with dexterity and smartly.
It must be noted that regarding regrets, all housing decisions are based on a bundle of attributes. The combination of these bundles determines the price that buyers are willing to pay. This means that for most people, housing decisions will always involve trade-offs; that is, something that is wanted is not part of the final bundle chosen, which can be a source of regret but does not fundamentally alter the decision at the point. Similarly, our evaluation of the bundle changes as circumstances change (income, job, family circumstances, etc.) post decision so that the weighing of the bundle will therefore change, which can also be a source of regret—but does not necessarily fundamentally alter the decision at the point of purchase. Most decisions are constrained decisions. From the behavioural literature, we know that losses often loom larger than gains so that minor deviations post-purchase will generate asymmetric feelings of positive and negative surprises. Therefore, post-purchase regrets are common among almost all types of consumers. The current study in this context provides a mechanism for investigating the real estate consumers’ regrets and points the direction for futuristic studies whereby the consumer behaviour related to real estate decisions can be investigated. This study contributes to the body of knowledge by highlighting major regret sources of homebuyers and renters. The lack of information, the buying and selling process, and lack of inspections are key sources of regrets along with the costs, hidden fees, and renovation requirements. Coping mechanisms may be devised for addressing these key concerns of real estate consumers. For real estate consumers, it provides the list of factors and aspects they should look at when buying or renting a property. Similarly, for real estate professionals, agents, and online information providers, the study provides the opinions, preferences, and desires of real estate consumers to be taken into account for enhancing their service quality. These concerns, if addressed properly, may help the industry rise from the COVID-19-based recessions and loss of business and be a leader in resumption of business and revenue generation.
In the era of the global push for sustainability and smart utilisations of resources and materials, it is about time that real estate business and investors take sustainability into account. In this context, initiatives such as the Queensland government’s mandatory sustainability declaration during real estate rents or purchases may help the industry focus more on sustainability initiatives, green materials usage, and enhancing consumers awareness about using and demanding sustainable houses and apartments to help the industry transform into smart and sustainable real estate. The current study is the first step in quantifying and empirically investigating real estate regrets over the last decade. It is limited to online literature (articles, blogs, and threads). In the future, the scope can be increased to include country-specific audiences and professionals interviewed in person, and a comprehensive framework that takes real estate valuation into account can be developed. In the current state, a value-based framework is missing and should be introduced to address the regrets based on the value offered by the investments. Further, the current study becomes ever so important in the era of bans on inspections and lockdowns due to COVID-19 and presents strategies for dealing with the inspection requirements of real estate consumers. These inspection strategies, including virtual- and augmented-realities-based virtual inspections, 360 videos and mobile laser measurements, 3D scanning and GIS-based location systems, and gadgets and drones-based inspections, are an insight into the futuristic domains of research and practice, which must be investigated in detail if the real estate sector wants to remain sustainable during pandemic times and transform into a smart real estate sector. Further, aspects of sustainability in real estate business and deals including mandatory sustainability declaration, incentives by the government to use sustainable materials, and methods such as using solar energy and green building materials are potential research areas to explore sustainability initiatives and their impacts on the business to help globalize the real estate business and transform to a more smart and sustainable real estate.

Author Contributions

Conceptualization, F.U. and S.M.E.S.; methodology, F.U. and S.M.E.S.; software, F.U.; validation, F.U. and S.M.E.S.; formal analysis, F.U. and S.M.E.S.; investigation, F.U.; resources, F.U. and S.M.E.S.; data curation, F.U. and S.M.E.S.; writing—original draft preparation, F.U.; writing—review and editing, F.U. and S.M.E.S.; visualization, F.U.; supervision, S.M.E.S.; project administration, F.U. and S.M.E.S.; funding acquisition, S.M.E.S. All authors have read and agreed to the published version of the manuscript.

Funding

This research received no external funding.

Conflicts of Interest

The authors declare no conflict of interest.

References

  1. Morrison, D.; Phillips, M. The Global Outlook for 2018. In Emerging Trends in Real Estate®; Morrison, D., Ed.; PWC and ULI: Washington, DC, USA, 2018; p. 32. [Google Scholar]
  2. Statista. Transaction Volumes in the Real Estate Market in the United States from 2005 to 2017 (in billion U.S. dollars). Available online: https://www.statista.com/statistics/245103/real-estate-capital-flows/ (accessed on 8 June 2018).
  3. Ullah, F.; Sepasgozar, S.; Wang, C. A Systematic Review of Smart Real Estate Technology: Drivers of, and Barriers to, the Use of Digital Disruptive Technologies and Online Platforms. Sustainability 2018, 10, 3142. [Google Scholar] [CrossRef] [Green Version]
  4. Ullah, F.; Shinetogtokh, T.; Sepasgozar, P.S.; Ali, T.H. Investigation of the users’ interaction with online real estate platforms in Australia. In Proceedings of the 2nd International Conference on Sustainable Development in Civil Engineering (ICSDC 2019), Jamshoro Pakistan, 5–7 December 2019; MUET: Jamshoro Pakistan, 2019; p. 81. [Google Scholar]
  5. Munawar, H.S.; Qayyum, S.; Ullah, F.; Sepasgozar, S. Big Data and Its Applications in Smart Real Estate and the Disaster Management Life Cycle: A Systematic Analysis. Big Data Cogn. Comput. 2020, 4, 4. [Google Scholar] [CrossRef] [Green Version]
  6. Chen, J.; Hui, E.C.; Wang, Z. Perceived risk, anticipated regret and post-purchase experience in the real estate market: The case of China. Hous. Stud. 2011, 26, 385–402. [Google Scholar] [CrossRef]
  7. Marte, J. The Biggest Regrets People have after Buying a Home. Available online: https://www.washingtonpost.com/news/get-there/wp/2017/04/20/the-biggest-regrets-people-have-after-buying-a-home/?noredirect=on&utm_term=.79bc863bc842 (accessed on 8 June 2018).
  8. Duboeuf, T. Local power and land-use strategies in mountain resorts: Sustainability of local tourism development and the challenges of governance. Revue de Géographie Alpine 2006, 94, 42–51. [Google Scholar] [CrossRef]
  9. Hobson, K. Consumption, environmental sustainability and human geography in Australia: A missing research agenda? Aust. Geogr. Stud. 2003, 41, 148–155. [Google Scholar] [CrossRef]
  10. Dobrovolskienė, N.; Tamošiūnienė, R.; Banaitis, A.; Ferreira, F.A.; Banaitienė, N.; Taujanskaitė, K.; Meidutė-Kavaliauskienė, I. Developing a composite sustainability index for real estate projects using multiple criteria decision making. Oper. Res. 2019, 19, 617–635. [Google Scholar] [CrossRef]
  11. Daily, G.C.; Ehrlich, P.R. Socioeconomic equity, sustainability, and Earth’s carrying capacity. Ecol. Appl. 1996, 6, 991–1001. [Google Scholar] [CrossRef]
  12. Chia, J.; Harun, A.; Kassim, A.W.M.; Martin, D.; Kepal, N. Understanding factors that influence house purchase intention among consumers in Kota Kinabalu: An application of buyer behavior model theory. J. Technol. Manag. Bus. 2016, 3, 2. [Google Scholar]
  13. Ullah, F.; Sepasgozar, P.S.; Ali, T.H. Real Estate Stakeholders Technology Acceptance Model (RESTAM): User-focused Big9 Disruptive Technologies for Smart Real Estate Management. In Proceedings of the 2nd International Conference on Sustainable Development in Civil Engineering (ICSDC 2019), Jamshoro Pakistan, 5–7 December 2019; MUET: Jamshoro Pakistan, 2019. [Google Scholar]
  14. Tomal, M. Moving towards a Smarter Housing Market: The Example of Poland. Sustainability 2020, 12, 683. [Google Scholar] [CrossRef] [Green Version]
  15. Park, M. Home Buyers’ Top Five Regrets. Available online: https://www.washingtonpost.com/news/where-we-live/wp/2015/01/27/home-buyers-top-five-regrets/?utm_term=.88b73d31c991 (accessed on 25 April 2018).
  16. Chica-Olmo, J.; Cano-Guervos, R.; Chica-Rivas, M. Estimation of housing price variations using spatio-temporal data. Sustainability 2019, 11, 1551. [Google Scholar] [CrossRef] [Green Version]
  17. Waldron, R.; Redmond, D. “We’re just existing, not living!” Mortgage stress and the concealed costs of coping with crisis. Hous. Stud. 2017, 32, 584–612. [Google Scholar] [CrossRef]
  18. Pawson, H.; Hulse, K.; Morris, A. Interpreting the rise of long-term private renting in a liberal welfare regime context. Hous. Stud. 2017, 32, 1062–1084. [Google Scholar] [CrossRef]
  19. Ali, Q.; Thaheem, M.J.; Ullah, F.; Sepasgozar, S.M. The Performance Gap in Energy-Efficient Office Buildings: How the Occupants Can Help? Energies 2020, 13, 1480. [Google Scholar] [CrossRef] [Green Version]
  20. Munawar, H.S.; Hammad, A.; Ullah, F.; Ali, T.H. After the Flood: A Novel Application of Image Processing and Machine Learning for Post-Flood Disaster Management. In Proceedings of the 2nd International Conference on Sustainable Development in Civil Engineering (ICSDC 2019), Jamshoro Pakistan, 5–7 December 2019; MUET: Jamshoro Pakistan, 2019; pp. 52–61. [Google Scholar]
  21. Lin, Y.; Ma, Z.; Zhao, K.; Hu, W.; Wei, J. The impact of population migration on urban housing prices: Evidence from China’s major cities. Sustainability 2018, 10, 3169. [Google Scholar] [CrossRef] [Green Version]
  22. Fang, L.; Tian, C.; Yin, X.; Song, Y. Political cycles and the mix of industrial and residential land leasing. Sustainability 2018, 10, 3077. [Google Scholar] [CrossRef] [Green Version]
  23. Barreca, A.; Curto, R.; Rolando, D. Housing vulnerability and property prices: Spatial analyses in the Turin real estate market. Sustainability 2018, 10, 3068. [Google Scholar] [CrossRef] [Green Version]
  24. Trulia. Real Estate Regrets: Recovery Edition. Available online: https://www.trulia.com/blog/trends/regrets-2017/ (accessed on 25 April 2018).
  25. Bloom, E. The 3 Biggest Mistakes Anyone can make when Buying a High-End Home. Available online: https://www.cnbc.com/2017/06/13/the-biggest-mistakes-people-make-when-buying-million-dollar-properties.html (accessed on 8 June 2018).
  26. Woodruff, M. 1 in 4 Homeowners Regrets Buying a House. Available online: https://finance.yahoo.com/news/homeowners-regrets-buying-a-house-redfin-163113390.html (accessed on 8 June 2018).
  27. Geffner, M. Real Estate Regrets: 80 Percent of Homebuyers want a do-over. Available online: https://www.hsh.com/finance/real-estate/homebuyer-regrets.html (accessed on 8 June 2018).
  28. Leigh, A. Top 10 Most Common Real Estate Regrets. Available online: https://www.knockoutmortgages.com/index.php/articles/viewarticle/1247/top-10-most-common-real-estate-regrets (accessed on 8 June 2018).
  29. Chen, J.; Hui, E.C.; Wang, Z. Service quality, homebuyers’ regret and dissatisfaction in China real estate market. In Proceedings of the IEEE International Conference on Industrial Engineering and Engineering Management, Singapore, 8–11 December 2008. [Google Scholar]
  30. Heffter, E. Rookie Mistakes: Learn From First-Time Home Buyers’ Biggest Regrets. Available online: https://www.zillow.com/blog/first-time-home-buyer-regrets-152757/ (accessed on 8 June 2018).
  31. Ullah, F.; Sepasgozar, S.M. A Study of Information Technology Adoption for Real-Estate Management: A System Dynamic Model. Innov. Prod. Constr. Transform. Constr. Emerg. Technol. 2019, 469. [Google Scholar] [CrossRef]
  32. Reimsbach, D.; Hahn, R.; Gürtürk, A. Integrated reporting and assurance of sustainability information: An experimental study on professional investors’ information processing. Eur. Account. Rev. 2018, 27, 559–581. [Google Scholar] [CrossRef] [Green Version]
  33. Grewal, J.; Hauptmann, C.; Serafeim, G. Material sustainability information and stock price informativeness. J. Bus. Ethics 2020, 1–32. [Google Scholar] [CrossRef]
  34. Kearns, D. Home Buyer Reality Report 2017. Available online: https://www.nerdwallet.com/blog/mortgages/2017-home-buyer-reality-report/ (accessed on 8 June 2018).
  35. Clarke, W. One in Five Britons Regrets House-Buying Mistakes. Available online: https://www.telegraph.co.uk/finance/personalfinance/borrowing/mortgages/10078336/One-in-five-Britons-regrets-house-buying-mistakes.html (accessed on 8 June 2018).
  36. Kolko, J. Woulda Shoulda Coulda: Real Estate Regrets to Avoid. Available online: https://www.trulia.com/blog/trends/trulia-real-estate-regrets-survey/ (accessed on 8 June 2018).
  37. Shimizu, C.; Nishimura, K.G.; Watanabe, T. House prices at different stages of the buying/selling process. Reg. Sci. Urban Econ. 2016, 59, 37–53. [Google Scholar] [CrossRef] [Green Version]
  38. Nelson, T.-N. Top 5 homebuyer regrets. Available online: https://www.inman.com/2012/08/27/top-5-homebuyer-regrets/ (accessed on 8 June 2018).
  39. Chen, J.; Hui, E.; Wang, Z. More promotion-focused, more happy? Regulatory focus, post-purchase evaluations and regret in the real estate market. Urban Stud. 2017, 54, 251–268. [Google Scholar] [CrossRef]
  40. Sangkakoon, P.; Ngarmyarn, A.; Panichpathom, S. The influence of group references in home purchase intention in Thailand. In Proceedings of the 21st Annual European Real Estate Society Conference, Bucharest, Romania, 25–28 June 2014. [Google Scholar]
  41. Balderjahn, I.; Peyer, M.; Seegebarth, B.; Wiedmann, K.-P.; Weber, A. The many faces of sustainability-conscious consumers: A category-independent typology. J. Bus. Res. 2018, 91, 83–93. [Google Scholar] [CrossRef]
  42. Testa, F.; Russo, M.V.; Cornwell, T.B.; McDonald, A.; Reich, B. Social Sustainability as Buying Local: Effects of Soft Policy, Meso-Level Actors, and Social Influences on Purchase Intentions. J. Public Policy Mark. 2018, 37, 152–166. [Google Scholar] [CrossRef]
  43. Beltrame, J. To Avoid Home-Buyers’ Regret, Do Your Homework. Available online: https://www.theglobeandmail.com/real-estate/mortgages-and-rates/to-avoid-home-buyers-regret-do-your-homework/article4484879/ (accessed on 8 June 2018).
  44. Bloom, E. This Is the No. 1 Thing Buyers Regret about Purchasing a Home. Available online: https://www.cnbc.com/2017/07/17/this-is-the-no-1-thing-buyers-regret-about-purchasing-a-home.html (accessed on 8 June 2018).
  45. Omagwa, J.; Aduda, J. The Mediating Effect of Housing Search on the relationship between Demographics and Residential Housing Decisions amongst Apartment Households in Nairobi County, Kenya. Adv. Manag. Appl. Econ. 2015, 5, 105. [Google Scholar]
  46. Viggers, H.; Keall, M.; Wickens, K.; Howden-Chapman, P. Occupancy inefficiency of larger detached houses. In Proceedings of the 7th International Conference on Energy and Environment of Residential Buildings, Brisbane, Australia, 20–24 November 2016. [Google Scholar]
  47. Khajehzadeh, I.; Vale, B. How house size impacts type, combination and size of rooms: A floor plan study of New Zealand houses. Archit. Eng. Des. Manag. 2017, 13, 291–307. [Google Scholar] [CrossRef]
  48. Wong, S.Y.; Susilawati, C.; Miller, W.; Mardiasmo, D. Perspectives of Australian property practitioners on sustainability features in residential property. J. Hous. Built Environ. 2020, 1–23. [Google Scholar] [CrossRef]
  49. Forrest, N.; Stein, Z.; Wiek, A. Water-independent residential properties as a transformational solution to achieve water sustainability in desert cities? J. Clean. Prod. 2019, 214, 1038–1049. [Google Scholar] [CrossRef]
  50. Li, X.; Lim, M.K.; Ni, D.; Zhong, B.; Xiao, Z.; Hao, H. Sustainability or continuous damage: A behavior study of prosumers’ electricity consumption after installing household distributed energy resources. J. Clean. Prod. 2020, 121471. [Google Scholar] [CrossRef]
  51. Willets, D. No Place Like Home: The Generation Who Can’t Afford to Buy. Available online: https://www.independent.co.uk/property/house-and-home/no-place-like-home-the-generation-who-cant-afford-to-buy-1921781.html (accessed on 8 June 2018).
  52. Mayfield, J.D. Real Estate Statistics: Why You Should Know the Data. Available online: http://realtormag.realtor.org/for-brokers/feature/article/2011/08/real-estate-statistics-why-you-should-know-data (accessed on 8 June 2018).
  53. Ahmad, T.; Thaheem, M.J.; Anwar, A. Developing a green-building design approach by selective use of systems and techniques. Archit. Eng. Des. Manag. 2016, 12, 29–50. [Google Scholar] [CrossRef]
  54. Ullah, F.; Speasgozar, S.M.E.; Siddiqui, S.Q. An Investigation of Real Estate Technology Utilization in Technologically Advanced Marketplace. In Striving Towards Resilient Built Environment, Proceedings of the 9th International International Civil Engineering Congress (ICEC-2017), Karachi, Pakistan, 22–23 December 2017; Arif, S.H.L.F., Sangi, A.J., Eds.; Institute of Engineers Pakistan & NED University: Karachi Pakistan, 2017; pp. 173–183. [Google Scholar]
  55. Cerutti, E.; Dagher, J.; Dell’Ariccia, G. Housing finance and real-estate booms: A cross-country perspective. J. Hous. Econ. 2017, 38, 1–13. [Google Scholar] [CrossRef] [Green Version]
  56. Glaeser, E.; Huang, W.; Ma, Y.; Shleifer, A. A real estate boom with Chinese Characteristics. J. Econ. Perspect. 2017, 31, 93–116. [Google Scholar] [CrossRef] [Green Version]
  57. Wang, X.-Q.; Hao, L.-N.; Tao, R.; Su, C.-W. Does money supply growth drive housing boom in China? A wavelet-based analysis. J. Hous. Built Environ. 2019, 35, 1–17. [Google Scholar] [CrossRef]
  58. Basten, C.; Koch, C. The causal effect of house prices on mortgage demand and mortgage supply: Evidence from Switzerland. J. Hous. Econ. 2015, 30, 1–22. [Google Scholar] [CrossRef] [Green Version]
  59. Szymanoski, E.J.; Lam, A.; Feather, C. Financial Sustainability and the Home Equity Conversion Mortgage: Advancing Fiscal Soundness and Affordable Financing for Senior Homeowners. Cityscape 2017, 19, 47–72. [Google Scholar]
  60. Li, S.; Gao, N. Housing price and enterprise financing: Does mortgage effect exist? China Financ. Rev. Int. 2019, 9, 137–152. [Google Scholar] [CrossRef]
  61. Małkowska, A.; Uhruska, M.; Tomal, M. Age and Experience versus Susceptibility to Client Pressure among Property Valuation Professionals—Implications for Rethinking Institutional Framework. Sustainability 2019, 11, 6759. [Google Scholar] [CrossRef] [Green Version]
  62. Luchs, M.G.; Brower, J.; Chitturi, R. Product choice and the importance of aesthetic design given the emotion-laden trade-off between sustainability and functional performance. J. Prod. Innov. Manag. 2012, 29, 903–916. [Google Scholar] [CrossRef]
  63. Tanner, K.J. Emotion, gender and the sustainability of communities. J. Community Inform. 2005, 1, 2. [Google Scholar]
  64. Herbertson, L. Australians only Spending one Hour to Buy a Home. Available online: https://www.news.com.au/finance/real-estate/perth-wa/australians-only-spending-one-hour-to-buy-a-home/news-story/d2cd80ee981a2d0a02b3edfc317193d1 (accessed on 8 June 2018).
  65. Besbris, M. Romancing the home: Emotions and the interactional creation of demand in the housing market. Socio-Econ. Rev. 2016, 14, 461–482. [Google Scholar] [CrossRef]
  66. Clark, W.A.; Duque-Calvache, R.; Palomares-Linares, I. Place attachment and the decision to stay in the neighbourhood. Popul. Space Place 2017, 23. [Google Scholar] [CrossRef]
  67. Phillimore, J. Housing, home and neighbourhood renewal in the era of superdiversity: Some lessons from the West Midlands. Hous. Stud. 2013, 28, 682–700. [Google Scholar] [CrossRef]
  68. Barwick, P.J.; Pathak, P.A. The costs of free entry: An empirical study of real estate agents in Greater Boston. RAND J. Econ. 2015, 46, 103–145. [Google Scholar] [CrossRef] [Green Version]
  69. Munneke, H.J.; Ooi, J.T.; Sirmans, C.; Turnbull, G.K. Real estate agents, house prices, and liquidity. J. Real Estate Financ. Econ. 2015, 50, 1–33. [Google Scholar] [CrossRef]
  70. Wong, S.Y.; Susilawati, C.; Miller, W.F.; Mardiasmo, D. Understanding Australian real estate agent perspectives in promoting sustainability features in the residential property market. In Proceedings of the 7th International Conference on Energy and Envrionment of Residential Buildings, Brisbane, Australia, 20–24 November 2016; Queensland University of Technology: Queensland, Australia, 2016. [Google Scholar]
  71. Bryant, L.; Eves, C. Home sustainability policy and mandatory disclosure. Prop. Manag. 2012, 30, 29–51. [Google Scholar] [CrossRef] [Green Version]
  72. Gatzlaff, D.; McCullough, K.; Medders, L.; Nyce, C.M. The impact of hurricane mitigation features and inspection information on house prices. J. Real Estate Financ. Econ. 2015, 4, 1–26. [Google Scholar] [CrossRef]
  73. Sir, E.S.; Pariazar, M.; Sir, M.Y. Capacitated inspection scheduling of multi-unit systems. Comput. Ind. Eng. 2018, 120, 471–479. [Google Scholar]
  74. Felli, F.; Liu, C.; Ullah, F.; Sepasgozar, S. Implementation of 360 videos and mobile laser measurement technologies for immersive visualisation of real estate & properties. In Proceedings of the 42nd AUBEA Conference, Singapore, 26–28 September 2018. [Google Scholar]
  75. Shirowzhan, S.; Sepasgozar, S.M.; Li, H.; Trinder, J.; Tang, P. Comparative analysis of machine learning and point-based algorithms for detecting 3D changes in buildings over time using bi-temporal lidar data. Autom. Constr. 2019, 105, 102841. [Google Scholar] [CrossRef]
  76. Shirowzhan, S.; Sepasgozar, S.M.; Ullah, F.; Minhas, P.S. Implication of a Construction Labour Tracking System for Measuring Labour Productivity. Innov. Prod. Constr. Transform. Constr. Emerg. Technol. 2019, 1. [Google Scholar] [CrossRef]
  77. Sepasgozar, S.; Lim, S.; Shirowzhan, S.; Kim, Y.; Nadoushani, Z.M. Utilisation of a new terrestrial scanner for reconstruction of as-built models: A comparative study. In Proceedings of the International Symposium on Automation and Robotics in Construction, Oulu, Finland, 15–18 June 2015; IAARC Publications: London, UK, 2015. [Google Scholar]
  78. Sepasgozar, S.; Davis, S. Construction technology adoption cube: An investigation on process, factors, barriers, drivers and decision makers using NVivo and AHP analysis. Buildings 2018, 8, 74. [Google Scholar] [CrossRef] [Green Version]
  79. Weiss, S.M.; Indurkhya, N.; Zhang, T. Fundamentals of Predictive Text Mining; Springer: Berlin, Germany, 2015. [Google Scholar]
  80. Moro, S.; Cortez, P.; Rita, P. Business intelligence in banking: A literature analysis from 2002 to 2013 using text mining and latent Dirichlet allocation. Expert Syst. Appl. 2015, 42, 1314–1324. [Google Scholar] [CrossRef] [Green Version]
  81. Pletscher-Frankild, S.; Pallejà, A.; Tsafou, K.; Binder, J.X.; Jensen, L.J. DISEASES: Text mining and data integration of disease–gene associations. Methods 2015, 74, 83–89. [Google Scholar] [CrossRef] [PubMed]
  82. Zamani, M.; Schwartz, H.A. Using Twitter Language to Predict the Real Estate Market. In Proceedings of the 15th Conference of the European Chapter of the Association for Computational Linguistics, Valencia, Spain, 3–7 April 2017; Volume 2. Short Papers 2017. [Google Scholar]
  83. Gan, V.; Agarwal, V.; Kim, B. Data mining analysis and predictions of real estate prices. Issues Inf. Syst. 2015, 16, 30–36. [Google Scholar]
  84. Zhou, Y.; Tong, Y.; Gu, R.; Gall, H. Combining text mining and data mining for bug report classification. J. Softw. Evol. Process 2016, 28, 150–176. [Google Scholar] [CrossRef]
  85. Hsiao, Y.-H.; Chen, M.-C.; Liao, W.-C. Logistics service design for cross-border E-commerce using Kansei engineering with text-mining-based online content analysis. Telemat. Inform. 2017, 34, 284–302. [Google Scholar] [CrossRef]
  86. Predictive Analytics. General Architecture for Text Engineering- GATE. Available online: https://www.predictiveanalyticstoday.com/general-architecture-text-engineering-gate/ (accessed on 18 April 2020).
  87. Sterman, J.D. Learning in and about complex systems. Syst. Dyn. Rev. 1994, 10, 291–330. [Google Scholar] [CrossRef] [Green Version]
  88. Forrester, J.W. Counterintuitive behavior of social systems. Theory Decis. 1971, 2, 109–140. [Google Scholar] [CrossRef]
  89. Ullah, F.; Thaheem, M.J.; Sepasgozar, S.M.; Forcada, N. System dynamics model to determine concession period of PPP infrastructure projects: Overarching effects of critical success factors. J. Legal Aff. Disput. Resolut. Eng. Constr. 2018, 10, 04518022. [Google Scholar] [CrossRef]
  90. Ullah, F.; Thaheem, M.J.; Siddiqui, S.Q.; Khurshid, M.B. Influence of Six Sigma on project success in construction industry of Pakistan. TQM J. 2017, 29, 276–309. [Google Scholar] [CrossRef]
  91. Ding, Z.; Zhu, M.; Tam, V.W.; Yi, G.; Tran, C.N. A system dynamics-based environmental benefit assessment model of construction waste reduction management at the design and construction stages. J. Clean. Prod. 2018, 176, 676–692. [Google Scholar] [CrossRef]
  92. Robin, E. Performing real estate value (s): Real estate developers, systems of expertise and the production of space. Geoforum 2018. [Google Scholar] [CrossRef]
  93. Hanan, J.S. Home is where the capital is: The culture of real estate in an era of control societies. Commun. Crit. Cult. Stud. 2010, 7, 176–201. [Google Scholar] [CrossRef]
  94. Kucharska-Stasiak, E. Reproduction of Real Estate Valuation Methodology in Practice. An Attempt at Identifying Sources of Divergences. Real Estate Manag. Valuat. 2014, 22, 67–79. [Google Scholar] [CrossRef] [Green Version]
  95. Poursaeed, O.; Matera, T.; Belongie, S. Vision-based real estate price estimation. Mach. Vis. Appl. 2018, 29, 667–676. [Google Scholar] [CrossRef] [Green Version]
Figure 1. Research flowchart and methods used to retrieve the data and analyse the data. Note: P1 refers to the period of 2010–2014; P2 refers to the period of 2015–2019.
Sustainability 12 04382 g001
Figure 2. Screenshot of the general architecture for text engineering (GATE) software and the resources utilised.
Sustainability 12 04382 g002
Figure 3. Article import and ANNIE code results in the GATE software.
Sustainability 12 04382 g003
Figure 4. System dynamics model for regret criteria and factors for Period 1 (2010-14).
Sustainability 12 04382 g004
Figure 5. System dynamics model for regret criteria and factors for P2.
Sustainability 12 04382 g005
Figure 6. Snapshots of online threads initiated by the authors over different web platforms.
Sustainability 12 04382 g006
Figure 7. Google Trend results for real estate regrets components. (a) Comparison of real estate information, buy sell decision, house size, and cost; (b) comparison of the mortgages, agents, emotions, inspections, and rents related to real estate.
Sustainability 12 04382 g007
Figure 8. Criteria-wise analyses and comparisons for the two periods. Note: P1 refers to the from 2010–2014 period and P2 refers to the 2015–2019 period.
Sustainability 12 04382 g008
Figure 9. Trend lines and average value of both time periods based on proposed criteria.
Sustainability 12 04382 g009
Figure 10. Keyword analyses for the articles using VosViewer Software.
Sustainability 12 04382 g010
Figure 11. Systems model output showing the trends of criteria over the two periods.
Sustainability 12 04382 g011
Table 1. Search process, strings used, and retrieved articles from 2010 to 2019 through google search engine.
TimeStrings UsedArticles RetrievedDuplicates
UnrestrictedReal estate regrets OR Homebuyers regrets OR Renters regrets18,400,000
P1 (2010-14)AND Tools>AnyTime>CustomRange>1Jan2010-
31Dec2014>SortByRelevance287
Remove Duplicates 24047
ENGLSIH Language only limit 212
AND NO Videos, Images, Descriptions162
AND NO non-statistical articles57
P2 (2015-19)AND Tools>AnyTime>CustomRange>1Jan2015-
31Dec2019>SortByRelevance337
Remove Duplicates 27562
ENGLSIH Language only limit 237
AND NO Videos, Images, Descriptions193
AND NO non-statistical articles61
Total Articles Retrieved118
Table 2. Key factors, their values in the investigated time periods (p1 and p2), and their given and normalized seed values used in the system dynamics model based on retrieved reports.
CriteriaValuesIndividual Factor Values (Given and Normalised)Total CountContribution
NEIGP2221415251415141571724142121713.53
NP20.100.060.070.120.060.070.060.070.030.080.110.060.10
GP130465.97713.945 217.819.20
NP10.140.210.030.350.060.21
BSGP28021324219554938446116 45728.49
NP20.180.050.070.090.040.120.110.080.10.130.04
GP15650524220 22019.40
NP10.250.230.240.190.09
HSGP2629164212332020 21413.34
NP20.290.040.070.20.060.150.090.09
GP1543934 12711.20
NP10.430.310.27
HCGP2156211152928184038202014 31019.33
NP20.050.20.040.050.090.090.060.130.120.060.060.05
GP1579027295012.580 265.523.41
NP10.210.340.100.110.190.050.30
MTGP2412718 865.36
NP20.480.310.21
GP1256020 1059.26
NP10.240.570.19
EMGP29020 1106.86
NP20.820.18
GP1NA NA
NP1
AGGP2322329 845.24
NP20.380.270.35
GP18396 17915.68
NP10.460.54
IPGP215411110141520 1267.86
NP20.120.330.090.080.110.120.16
GP120 201.76
NP11
Note: NEI means not enough information, BS means buy–sell process, HS means house size, HC means housing costs, MT means mortgage, EM means emotions, AG means agents, IP means inspections. GP2 and NP2 refers to the given values and normalized values respectively in period 2 (2015–2019). Similarly, GP1 and NP1 refers to the same in period 1 (2010–2014).
Table 3. Respondents’ profiles.
RespondentCodeProfessionExperienceCountry
1M1Real Estate
Managers
41 YearsUSA
2M222 YearsAustralia
3M320 YearsUSA
4M430 YearsAustralia
5M538 YearsUK
6M620 YearsUSA
7M720 YearsAustralia
8A1Real Estate
Agents
22 YearsUSA
9A227 YearsAustralia
10A342 YearsUK
11A425 YearsUSA
12A530 YearsAustralia
13P1Photographer12 YearsUSA
14C1Real Estate
Consumers
3 PurchasesUSA
15C25 RentalsAustralia
16C33 PurchasesAustralia
17C48 RentalsUK
18C54 PurchasesUSA
19C66 RentalsUK
20C73 RentalsAustralia
21C83 PurchasesAustralia
22C94 RentalsUK
23C1012 RentalsAustralia
Table 4. Threads started over different times during the study period and number of responses.
ThreadQuestion TitleRunning PeriodResponsesSub Classification
T1Have you regretted buying a house?P150All responses in P1
T2Have you ever had house purchase regret and how did you cope?P214All responses in P2
T3Anyone else regret buying your house?P1, P24416 in P1, 28 in P2
T4Anyone regretted buying a house?P127All responses in P1
Table 5. Text mining results for the word counts in the reviewed articles.
Article TopicRegretsNEIBSHSHCMTEMAGIPTotal
Homebuyers’ Regrets78050941000596101450
House Affordability141127726301090290496
Regrets and Post-purchase experience25673572106111701301066
Real Estate Statistics01073510000670525
Avoiding Home buyers Regrets7228229131008307022617
Home buying Mistakes88019011870100215
Real Estate Regrets to avoid565312538472290001034
Real Estate regrets: do-over135121167483873000582
First Time Buyers regrets21010919141401231570691
Home buyers regrets733313001028171741349
Top 10 real estate regrets1072917018295602827464
Home Buyers Regrets102992111137120389519
Biggest mistakes in house buying47239991002500213
House Purchase regrets882710020110000246
Home buyers’ reality report106694321291037185001742
Regrets after buying a house7741178072610011440
Real Estate Regrets46210369514862000795
Australian House buying19219600017063216
Total320114343585332598166023744017311,660
Table 6. Analyses result of the threads based on keywords over the last decade.
Regret GroupFactorsP1P2TRTHTGRTGH
RHRH
NEINeighbourhood Information12271193457
Less or little Information6081141
Travel time to amenities502070
Natural Sunlight 113041
Social Life100010
Security Issues020002
HSHouse Size91111202365
House Design50102152
Garden and Greenery 001111
BSTransaction Costs161816032184130
Sale Losses61032912
HCRenovation Required145170315315
MTMortgage Payments8670156156
IPInspections01404141
EMImpatient Decisions4060100100
AGBad Agents00101010
Yearly Total87469681835418354
Sample Size8055135
Note: R means regrets, H means happy, TR means total regrets, TH means total happy. TGR means total group regrets and TGH means total group happiness. *The sample size may be less than the Total R as some people reported multiple regrets.
Table 7. Results and keywords reported by the respondents in 2019–2020 based on authors’ generated threads.
GroupsKeywords M1M2M3M4M5M6M7P1A1A2A3A4A5C1C2C3C4C5C6C7C8C9C10Total
IPInspection** * ****** ** ***14
NEILess or little Information * ** * * * * ** 9
Property Records * ** 3
Neighbourhood Information * * 2
Financial History* * 2
Video Walk throughs * 1
WIInfo Accuracy ** ** * *** 8
Website Reliability * ** * 4
Speed & Results * 1
BSPrefer Renting * * 2
Hidden Costs * 1
Wrong Valuation * * 2
AGReliable Agents* * * 3
EMPatience* 1
Count4211421532223322122422153

