1. Introduction
The United Nations’ Intergovernmental Panel on Climate Change (IPCC) estimates that human populations have until 2030 to prevent global temperatures rising by 1.5 °C, beyond which the worst impacts of climate change, such as severe droughts, floods, and consequent surges in the flow of climate refugees, increase substantially [
1]. Most reliable estimates place livestock’s share of global greenhouse gas (GHG) emissions between 12–18%, while food systems in their entirety are estimated to contribute between 19–29% of global emissions [
2,
3,
4,
5,
6]. Demand-side policies aimed at promoting behavioral change are critical to mitigating the impacts of climate change [
7]. One such behavioral change being recommended by recent reports is a dietary shift towards reduced meat intake [
8,
9]; meat alternatives are a promising market-based solution that caters to this goal.
Meat alternatives—also known as meat analogues, meat substitutes, faux meat, mock meat, or imitation meat—emulate the textural, aesthetic, and chemical characteristics of meat products [
10]. They are made from plants (plant-based) or artificially replicated in a lab (cell-based). Since next-generation plant-based meat (e.g., the Beyond Meat and GoodDot Meat) and cell-based meat are relatively new product categories, it is critical to understand consumers’ willingness to pay (WTP) for these meat alternatives relative to conventional meat, if the new products will indeed play a role in reducing the environmental impact of food consumption. While there is limited research on consumer acceptance and preferences towards meat alternatives, none of the research estimates the willingness to pay for meat alternatives. Furthermore, there is scant research on developing countries. This gap in the literature is problematic, since the growing demand for animal-based proteins from populous developing countries poses a substantial threat to global environmental resources [
11,
12]. India and China, specifically, have been recognized as hotspots where little is known about consumer preferences towards meat alternatives [
13].
The focus of this study is India, the second most populous country in the world, projected to be the most populous within the next decade. Home to approximately 1.3 billion people, 80% of whom follow Hinduism, India is often misperceived to be majority vegetarian; in fact, upwards of 70% of Indians consume meat at least occasionally [
14]. India’s growth rates for chicken, mutton (goat/sheep meat), and fish consumption are among the highest in the world [
15,
16]. Increases in animal agriculture have the potential to drastically increase India’s GHG emissions and worsen water scarcity [
17,
18]. Aside from the environmental impacts, there are substantial health-related, and food security concerns associated with India’s growing meat consumption [
19,
20,
21]. Several studies suggest that plant- and cell-based meat alternatives provide considerable environmental and nutritional savings compared to animal-based meat [
22,
23,
24,
25]. Regardless of the suggested benefits, it is not clear whether consumers are willing to adopt these meat alternatives.
To help address the knowledge gap about the viability of meat alternatives, we conducted a study aimed at estimating Indian consumers’ WTP for meat alternatives via a discrete choice experiment (DCE) where survey participants considered four alternative sources of protein: Conventional animal-based meat, plant-based meat, cell-based meat, and chana (which is the Hindi word for chickpeas, a popular legume that contains 20 g of protein per 100 g). Primary data were collected using a multi-language face-to-face survey (n = 394) in Mumbai, India, in December 2018. We analyzed the survey data using a latent class model to identify the variation in consumers’ WTP for protein alternatives across market segments. Our results identify four latent market segments with considerable variability in preferences between segments.
We address three primary research questions: (1) What is the WTP for meat alternatives in India; (2) what is the heterogeneity in WTP across consumer segments; and (3) what types of consumers are most likely to pay for meat alternatives? To the best of our knowledge, this study is the first to estimate and report WTP for both plant- and cell-based meat alternatives. It is also one of the first studies to assess consumer preferences for simulated meat in the context of a developing country. The plant-based meat market in India is small, while the market for cell-based meat does not exist at all, which provides an ideal setting for stated preference research. As interest in this area of food technology grows, our results will prove beneficial for entrepreneurs, marketers, and policymakers trying to encourage meat substitution in the Indian subcontinent.
We use the term “clean meat” to describe cell-based meat based on consumer perceptions research done by the Good Food Institute [
26]. Additionally, in following the nomenclature set in Slade 2018 [
27], hereon, we will refer to plant-based and clean meat alternatives collectively as “simulated meat”. It is also important to note that there are no commonly used Hindi counterparts for these terms. Conventional animal-based meat was translated to “saadharan maans”, plant-based meat “paudhon pe aadharit maans”, and clean meat “saaf maans”, which are near-literal translations.
Our research adds to work on the consumer acceptance of clean meat, since the in-vitro technology’s proof-of-concept [
28]. Verbeke, Sans, and Van Loo [
29] first analyzed the consumer acceptance of clean meat using a survey in Belgium, finding low levels of unaided awareness but high levels of acceptance. Our sample similarly displayed low levels of unaided awareness of meat alternatives; this is relevant because higher levels of consumer awareness have been shown to be associated with higher willingness to pay for sustainable products [
30]. More recently, four important studies, Apostolidis and McLeay [
31], Slade [
27], Bryant, Szejda, Parekh, et al. [
11], and Anderson and Bryant [
32], shape the current research in this space. Apostolidis and McLeay [
31], the closest study to ours in terms of subject and methodology, use a latent-class, discrete choice experiment to assess consumer preferences for meat and meat substitutes in the U.K. Our study differs from their work in three primary capacities: First, we include clean meat in our analysis and provide respondents with a traditional vegetarian alternative; second, we report WTP estimates; and third, our work is based in a developing country with considerably different preferences to the UK. Slade [
27] explores consumer preferences towards conventional, plant-based, and clean beef burgers in Canada, but does not report WTP estimates.
Bryant, Szejda, Parekh, et al. [
11] is the only study that directly explores current consumer perceptions of plant-based and clean meat alternatives in developing countries. Based on online surveys in USA, China, and India, they find that 10.7% of Indians were not at all likely to purchase clean meat; 37.7% were somewhat or moderately likely; and 48.7% were likely or extremely likely. The respective statistics for the likelihood of purchasing plant-based meat were 5.5%, 31.7%, and 62.8%. Our questionnaire was partly based on the survey instrument used in this study, enabling us to make some direct comparisons with their results. Finally, Anderson and Bryant [
32] attempt to estimate the WTP of clean meat simply by asking customers what monetary amount they would be willing to pay for clean meat relative to varying price levels of conventional meat. While they do not provide monetary estimates of WTP derived from a choice experiment, they conclude that consumers are willing to pay premiums for clean fish, chicken, and beef in certain scenarios. We improve on the prior work in India by using preference elicitation metrics consistent with utility theory. Overall, we contribute to the literature by providing the first WTP estimates for meat alternatives in a developing country, as well as identifying underlying sources of heterogeneity.
2. Background on Meat Alternatives in India
A predominantly Hindu country, India is often inaccurately assumed to be majority vegetarian: An estimated 64–74% of the population consumes some form of animal-based meat, at least occasionally [
14]. Vegetarianism in India often takes the form of a lacto-vegetarian diet, i.e., most vegetarians consume some form of dairy products [
33]. A handful of academic articles document the dynamics of meat consumption in India [
34,
35,
36,
37]. Sathyamala [
34] and Staples [
35], specifically, provide deeper insight into the politics of eating meat in India, discussing the recent impacts of religious attitudes towards beef consumption under the rule of the Bharatiya Janta Party (BJP).
While religious affiliations constrain the growth of beef consumption, demand for animal-based meat, in general, is rising. In India, the most popular forms of animal protein are chicken, mutton, and fish [
37]. In a recent systematic review of studies projecting future dietary trends in India, Alae-Carew, Bird, Choudhury, et al. [
38] find that all eleven included studies project an increase in meat consumption, regardless of projection methodology.
India made up 6.55% of global GHG emissions in 2016, making it the third-largest contributor to anthropogenic GHG emissions [
39]. The Indian livestock sector, specifically, is considered a significant emitter of GHG emissions [
40]. Agriculture accounted for over 21.7% of India’s total GHG emissions in 2016 [
39,
41], of which three-quarters come from the livestock sector [
18]. Green et al. [
17] find that diets with animal-based meat have the highest embedded carbon emissions and water footprints, and Rehkamp and Canning [
42] show synergies between healthy diets and lower water footprints through smaller intakes of animal protein. Freshwater scarcity is a severe problem faced by Indians [
43]. A recent exhibition of this scarcity took place in Chennai, one of the largest cities in India, which ran out of drinking water in June of 2019 [
44]. In addition to carbon and water externalities, livestock contributes to biodiversity loss on land and in our oceans [
45,
46], nutrient pollution [
47], and land use [
48].
Several studies have focused on the environmental and food security benefits of consuming less meat and adopting plant-based diets [
49,
50,
51,
52,
53,
54]. A meta-analysis of agricultural products by Nijdam, Rood, and Westhoek [
55] finds that animal-based proteins produce higher emissions and require more land than vegetal sources of protein. Reducing meat consumption is also seen as the most important step to ensuring biodiversity conservation [
46]. While we are focused on the environmental consequences of food choice, the health benefits of plant-based diets have been widely documented, too [
56,
57].
A handful of studies focus specifically on the scope of meat substitutes on environmental outcomes. Ritchie et al. [
22] showed that meat substitutes have a large potential for reducing GHG emissions in high-income nations (up to 583 MtCO2e per year). Furthermore, California-based manufacturer Beyond Meat’s popular Beyond Burger produces 90% less GHG emissions, requires 93% less land, 46% less energy, and has a 99% lower impact on water security than a quarter-pound U.S. beef burger [
23]. A 2011 study of clean meat technology found that it would require 7–45% lower energy use, 99% lower land use, 82–96% lower water use, and produce 78–96% lower GHG emissions [
24]. However, more recent analyses suggest complex tradeoffs and consequent uncertainty in the environmental impacts of in-vitro technology [
58,
59].
3. Survey Methodology
We collected primary data via a face-to-face survey in December 2018 in Mumbai, India. Participants were monetarily compensated for taking part in the survey. The survey instrument was written in English and translated to Hindi by a co-author, and the survey tablets displayed the instrument in both English and Devanagari scripts. Graber, Narayanan, Alfaro, et al. [
60] conducted a discrete choice experiment in rural India to estimate the WTP for solar microgrids—their published Hindi survey instrument was used as a guide for designing our Hindi questionnaire. The questionnaire contained the following sections: an introduction; a section on dietary behavior; three consecutive sections assessing consumer perceptions towards conventional meat, plant-based meat, and clean meat; a section containing the choice experiment; and a concluding section on demographic information. Respondents took an average of 15 min to complete the survey in both languages.
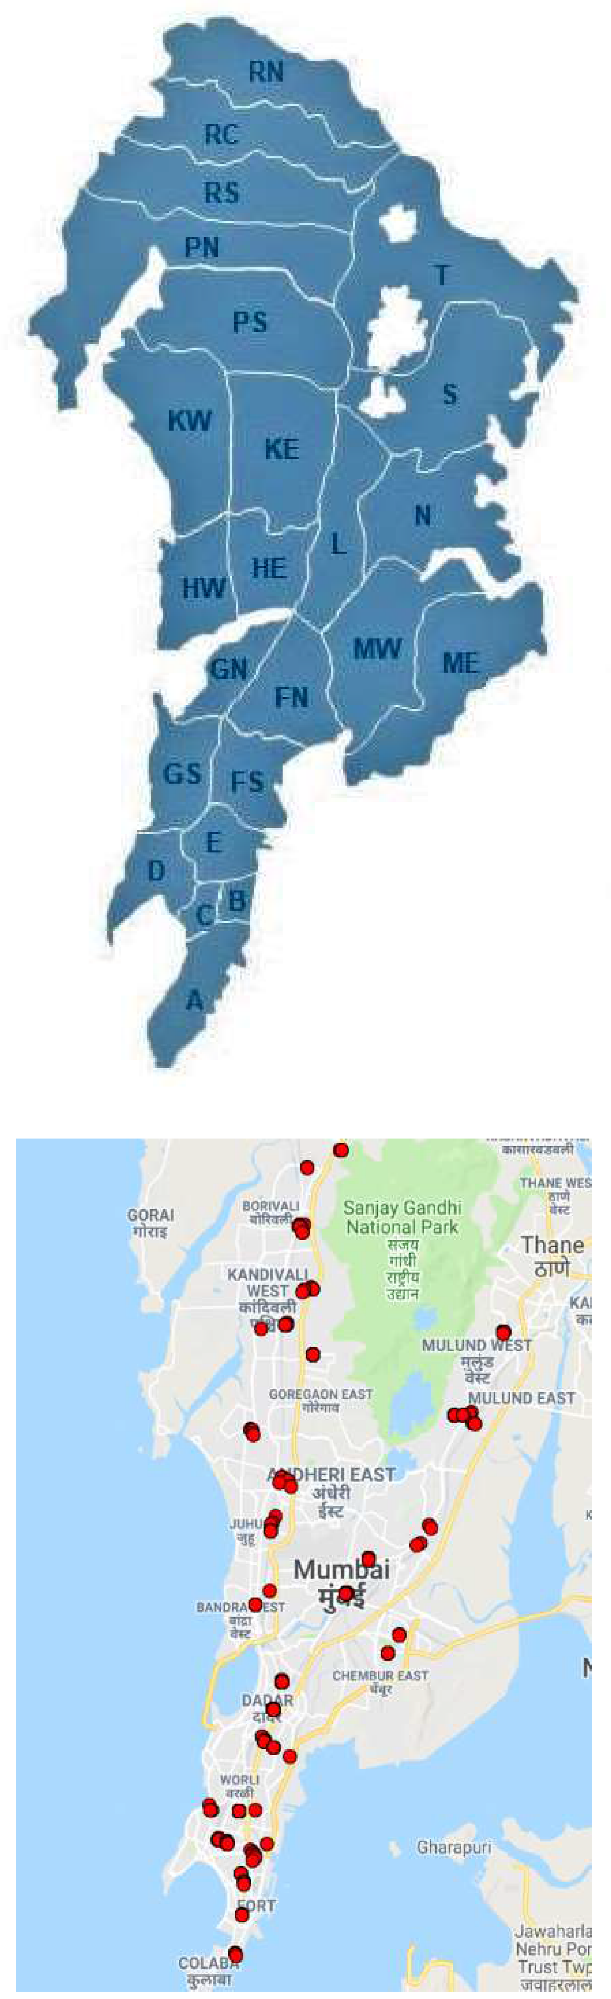
The city of Mumbai is divided by a zonal ward system where six zones, containing three to five wards each, make up the urban conglomerate referred to as Greater Mumbai. The minimum sample size was determined using the rule of thumb determined by Johnson and Orme [
61]—beyond that, we essentially maximized the sample size conditional on our budget constraint. We conducted 424 interviews across 24 wards—averaging 18 interviews per ward—to get a representative sample.
Figure 1 contains a map of Mumbai by ward, and a map of the locations in which interviews were conducted.
In each ward, we recruited respondents in two locations: (1) Near the local railways that are complemented by open-air markets (sabzi mandis) frequented by less affluent population; and (2) a shopping mall or a supermarket tailored to wealthier shoppers. This sampling strategy aimed to obtain a diverse sample of respondents in terms of income and background. To minimize selection bias, we used a systematic sampling technique in which surveyors randomly selected participants using a randomization app installed on their tablets. Two rounds of pre-testing were conducted to evaluate the survey instrument, first in the U.S. in English, and second in Mumbai in Hindi. We dropped 30 of the 424 participants, due to incomplete responses leading to a working sample of 394.
4. Methods
To assess consumer preferences for protein alternatives, this study employed a labeled discrete choice experiment (DCE) that provided respondents with four alternatives (labels):
conventional meat, plant-based meat, clean meat, and
chana. The purpose of including chana was to test whether vegetarians would opt for a meat alternative over an existing, familiar vegetarian option. Thus, the survey did not include an “opt-out” option. See Campbell and Erdem [
62] and Veldwijk, Lambooij, de Bekker-Grob, et al. [
63] for papers that discuss the effectiveness of using an opt-out option. Our DCE is considered labeled because the alternatives have specific names attached to them, rather than unlabeled titles with attributes defining all relevant characteristics of the alternative. For example, in this DCE, respondents would see an option in their choice sets as “Conventional Meat” as opposed to “Alternative 1” with “Conventional” described as an attribute pertaining to the type of meat. Our objective was to estimate the WTP for the perceived set of attributes associated with each protein option.
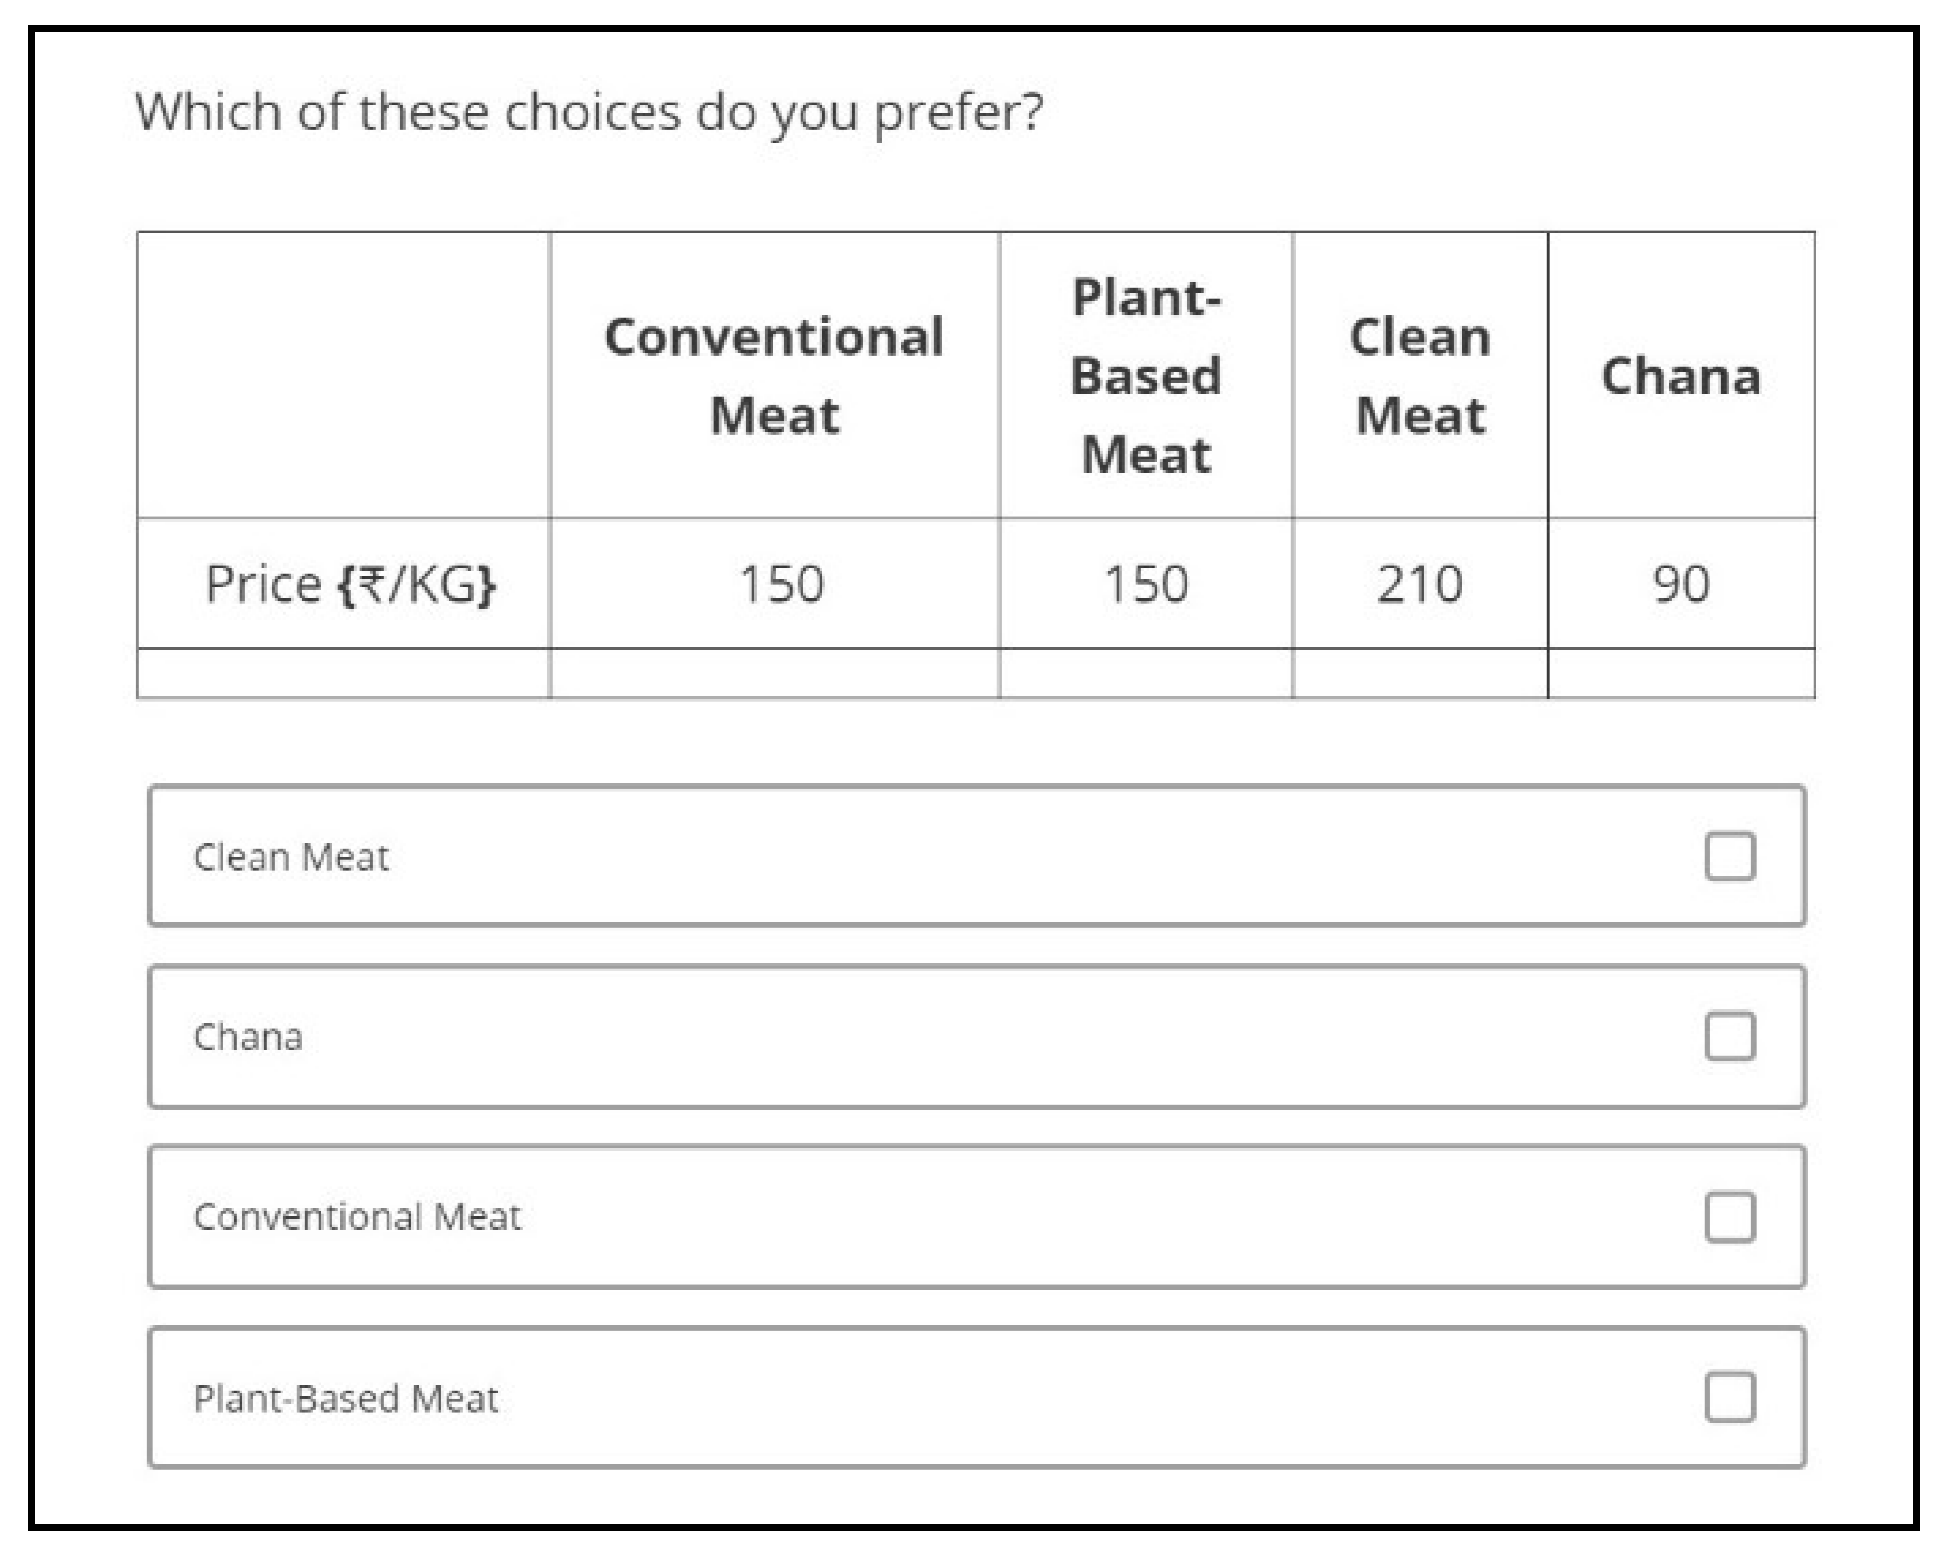
This choice experiment is unconventional in the sense that only one attribute, the price of the good, is varied. While Apostolidis and McLeay [
31], assess preferences for meat substitutes across several attributes in their DCE, Veldwijk, Lambooij, de Bekker-Grob, et al. [
63] point out to the importance of keeping DCEs simple and accessible for participants. Accounting for factors (such as the respondents’ expected unfamiliarity with choice experiments), the novel nature of the subject matter, diverse levels of literacy in the population affecting the survey’s comprehensibility, our desire to collect information on peripheral subjects of interest, and our interest in keeping the survey time under 15 min, we limited the attributes to price only. Each respondent chose between the four alternatives on four different choice occasions, with no two choice occasions having the same price levels for all alternatives. The order in which respondents saw selection-options was randomized to reduce primacy or recency bias.
Figure 2 contains a sample choice occasion.
To obtain effective estimates of WTP, our pricing structure had to meet a few criteria. First, we needed a range of price levels, since commodity prices in the marketplace fluctuate due to myriad factors. Second, we needed the prices to reflect reality to some extent so that they seem plausible to respondents. Price spreads did not need to match reality exactly, but they had to be believable and not lead to protests from respondents. Bearing this in mind, we designed the pricing structure displayed in
Table 1, where the range of prices contain the current market prices for chana and chicken, the most consumed plant-based and animal-based proteins in India.
Given the price levels in
Table 2, a full factorial design would require 81 (i.e., 3
4) choice sets. Recognizing the impracticality of asking respondents to make 81 choices, we instead applied a blocked fractional factorial design to obtain 20 choice sets divided into five blocks of four-choice sets each. The choice sets were determined using a D-optimality criterion that maximizes the determinant of the information matrix of all possible price-level combinations. PASS16 software was used to run 50,000 iterations of the full-factorial design, narrowing the full factorial design down to 5 blocks of 4 choice sets each. Respondents were randomly assigned one block using Qualtrics’ built-in randomization tool; each block was answered approximately the same number of times. The choice blocks and levels can be found in
Appendix A.
Heterogeneity in respondent preferences is seen as a desirable feature of discrete choice modeling since preferences in the real world are not homogenous [
64,
65]. While both mixed logit models and latent class models (LCMs) account for preference heterogeneity [
66], we opt for the LCM because dividing populations into a discrete number of latent classes, or “segments”, where preferences are allowed to vary complements both marketing and “target consumer” approaches. A consumer’s inclination to purchase meat alternatives is a complex construct that could depend on a variety of factors. The LCM allows us to understand how these factors interact towards the outcome of the dependent variable—the purchase decision between four protein alternatives—and accordingly segments the sample into a specified number of groups. The LCM generates separate sets of parameters for different subsets of the sample, which we interpret as consumer segments. When we discuss the different consumer segments generated from the LCM, we will refer to these as “LCM classes”. This is not to be confused with socio-economic class. Hong Il Yoo’s
lclogit2 program in STATA 15.1 was used to estimate the latent class model. Arne Risa Hole’s
wtp program was used to obtain WTP estimates [
67,
68].
DCEs rest on the random utility theory that proposes a probability-oriented approach to understanding consumers’ decision-making in discrete choice situations [
69]. The individual’s true utility,
, consists of two components, the observable (deterministic) component,
, and the unobservable component
, assumed to have a Type 1 extreme distribution.
This generalized setup produces the utility observed by consumer
for alternative
on choice occasion
, from choice set
. Assuming rational behavior, individual
will select
such that their utility is maximized. The utility relationship in (1) can be reinterpreted for an LCM as:
where:
The deterministic (observed) portion
is defined as follows:
is a vector of parameters specific to class
,
is a vector of attributes of choice
on choice occasion
for individual
,
is the alternative-specific constant (ASC) for alternative
specific to class
, and
is the choice set faced by individual
on choice occasion
, and. The error term
is distributed with a Type I extreme value (IID). Therefore, the overall utility function can be specified as:
In this specification,
is the class-specific vector of price coefficients, and
through
are the class-specific coefficients on the ASC dummy variables that for chana, conventional meat, plant-based meat, and clean meat. These coefficients capture the average effect of all non-price factors for a given protein source. We normalize the coefficient for chana to zero; therefore, only coefficients for conventional meat, plant-based meat, and clean meat are reported. The magnitudes of these coefficients should be interpreted as the average effect of all non-price factors on an alternative relative to chana [
70]. In our setting, these coefficient bundle together taste, health, social preferences, and other attitudes towards the given protein source.
The conditional probability of individual
in class
choosing alternative
from a set of
alternatives across
choice occasions is represented by:
The class share—also known as the prior probability of being in a particular class—is driven by the class-membership model and is calculated by:
where
is a vector of socio-economic indicators that help us understand the composition of the LCM classes, and
is a vector of class-specific coefficient parameters for the membership variables in
, with the last class normalized to zero as the reference segment. This is a fractional multinomial logit formulation where the
coefficients tell us whether the given membership variable increases or decreases the probability of an individual belonging to a segment;
is normalized to zero to allow for a reference segment.
WTP is defined as the price at which the consumer is indifferent between purchasing and not purchasing a product and can be estimated using stated preferences. We calculate WTP using the following formula:
Equation (7) produces class-specific estimates of WTP. To calculate the WTP for the entire sample, i.e., the mean WTP across LCM classes, we can use the formula below.
The number of groups to divide respondents into is an important decision in latent class analyses. We use the Bayesian Information Criterion (BIC) and the Consistent Akaike Information Criterion (CAIC) to determine the number of LCM classes [
71].
Table 2 shows these results. For reference, we report the Akaike Information Criterion (AIC) as well.
As we can see in the formulation, the AIC only penalizes the model for its number of parameters, while the BIC and the CAIC include an additional penalty for sample size. The BIC and CAIC are minimized at four classes, while the AIC continues to decrease. The listed BIC, CAIC, and AIC were estimated without class-membership variables. The model with class-membership variables did not converge after seven classes, but we still observed BIC and CAIC minimizing at four classes. We use C = 4 LCM classes in our analysis.
5. Results: Descriptive Statistics
The survey collected demographic information on religion, gender, household income, and education. Respondents were also asked if they identified as vegetarians or non-vegetarians. The descriptive statistics from the survey, as well as relevant statistics from the 2011 Census of India, are reported in
Table 3. The table reports statistics from the 2011 Census of India for those variables that could directly be compared. Income and literacy levels are measured differently in the Census. and are therefore, not reported.
Gender is reported as binary, but respondents were offered an option to specify non-binary gender identity; no respondents selected this option. The 2011 Census of India reports a gender distribution of 51.5% males, 48.4% females, and 0.1% transgender; however, the distribution of gender in Mumbai is 42.6% female to 57.4% male as per the 2011 Census. In comparison, the gender distribution in our sample is highly skewed towards males. Considering the random, systematic nature of our sampling procedure, we suspect the skew is due to female respondents being more cautious of engaging in conversations with strangers. The unwillingness of women to partake in face-to-face surveys in India has been experienced by other researchers [
60]. It could be argued that a potential benefit of this skew in the context of our research is that more men than women consume meat in India; approximately 22% of men are vegetarian, whereas 30% women identify as vegetarian as per the fourth round of the National Family Health Survey [
14].
Of the 394 respondents included in the sample, 35% perceived themselves to be vegetarian. This statistic is close to the figures estimated by several surveys looking at vegetarianism in India [
14]. Juan, Yamini, and Britten [
72] find that 48% of self-perceived vegetarians in the US ate some form of red meat, poultry, or seafood. To assess the prevalence of this pattern in our data, we asked respondents to select the types of foods they had consumed within the last 30 days. Of the self-identified vegetarians in our sample, only 3.5% of respondents indicated consuming poultry, fish, mutton, pork, or beef at least occasionally.
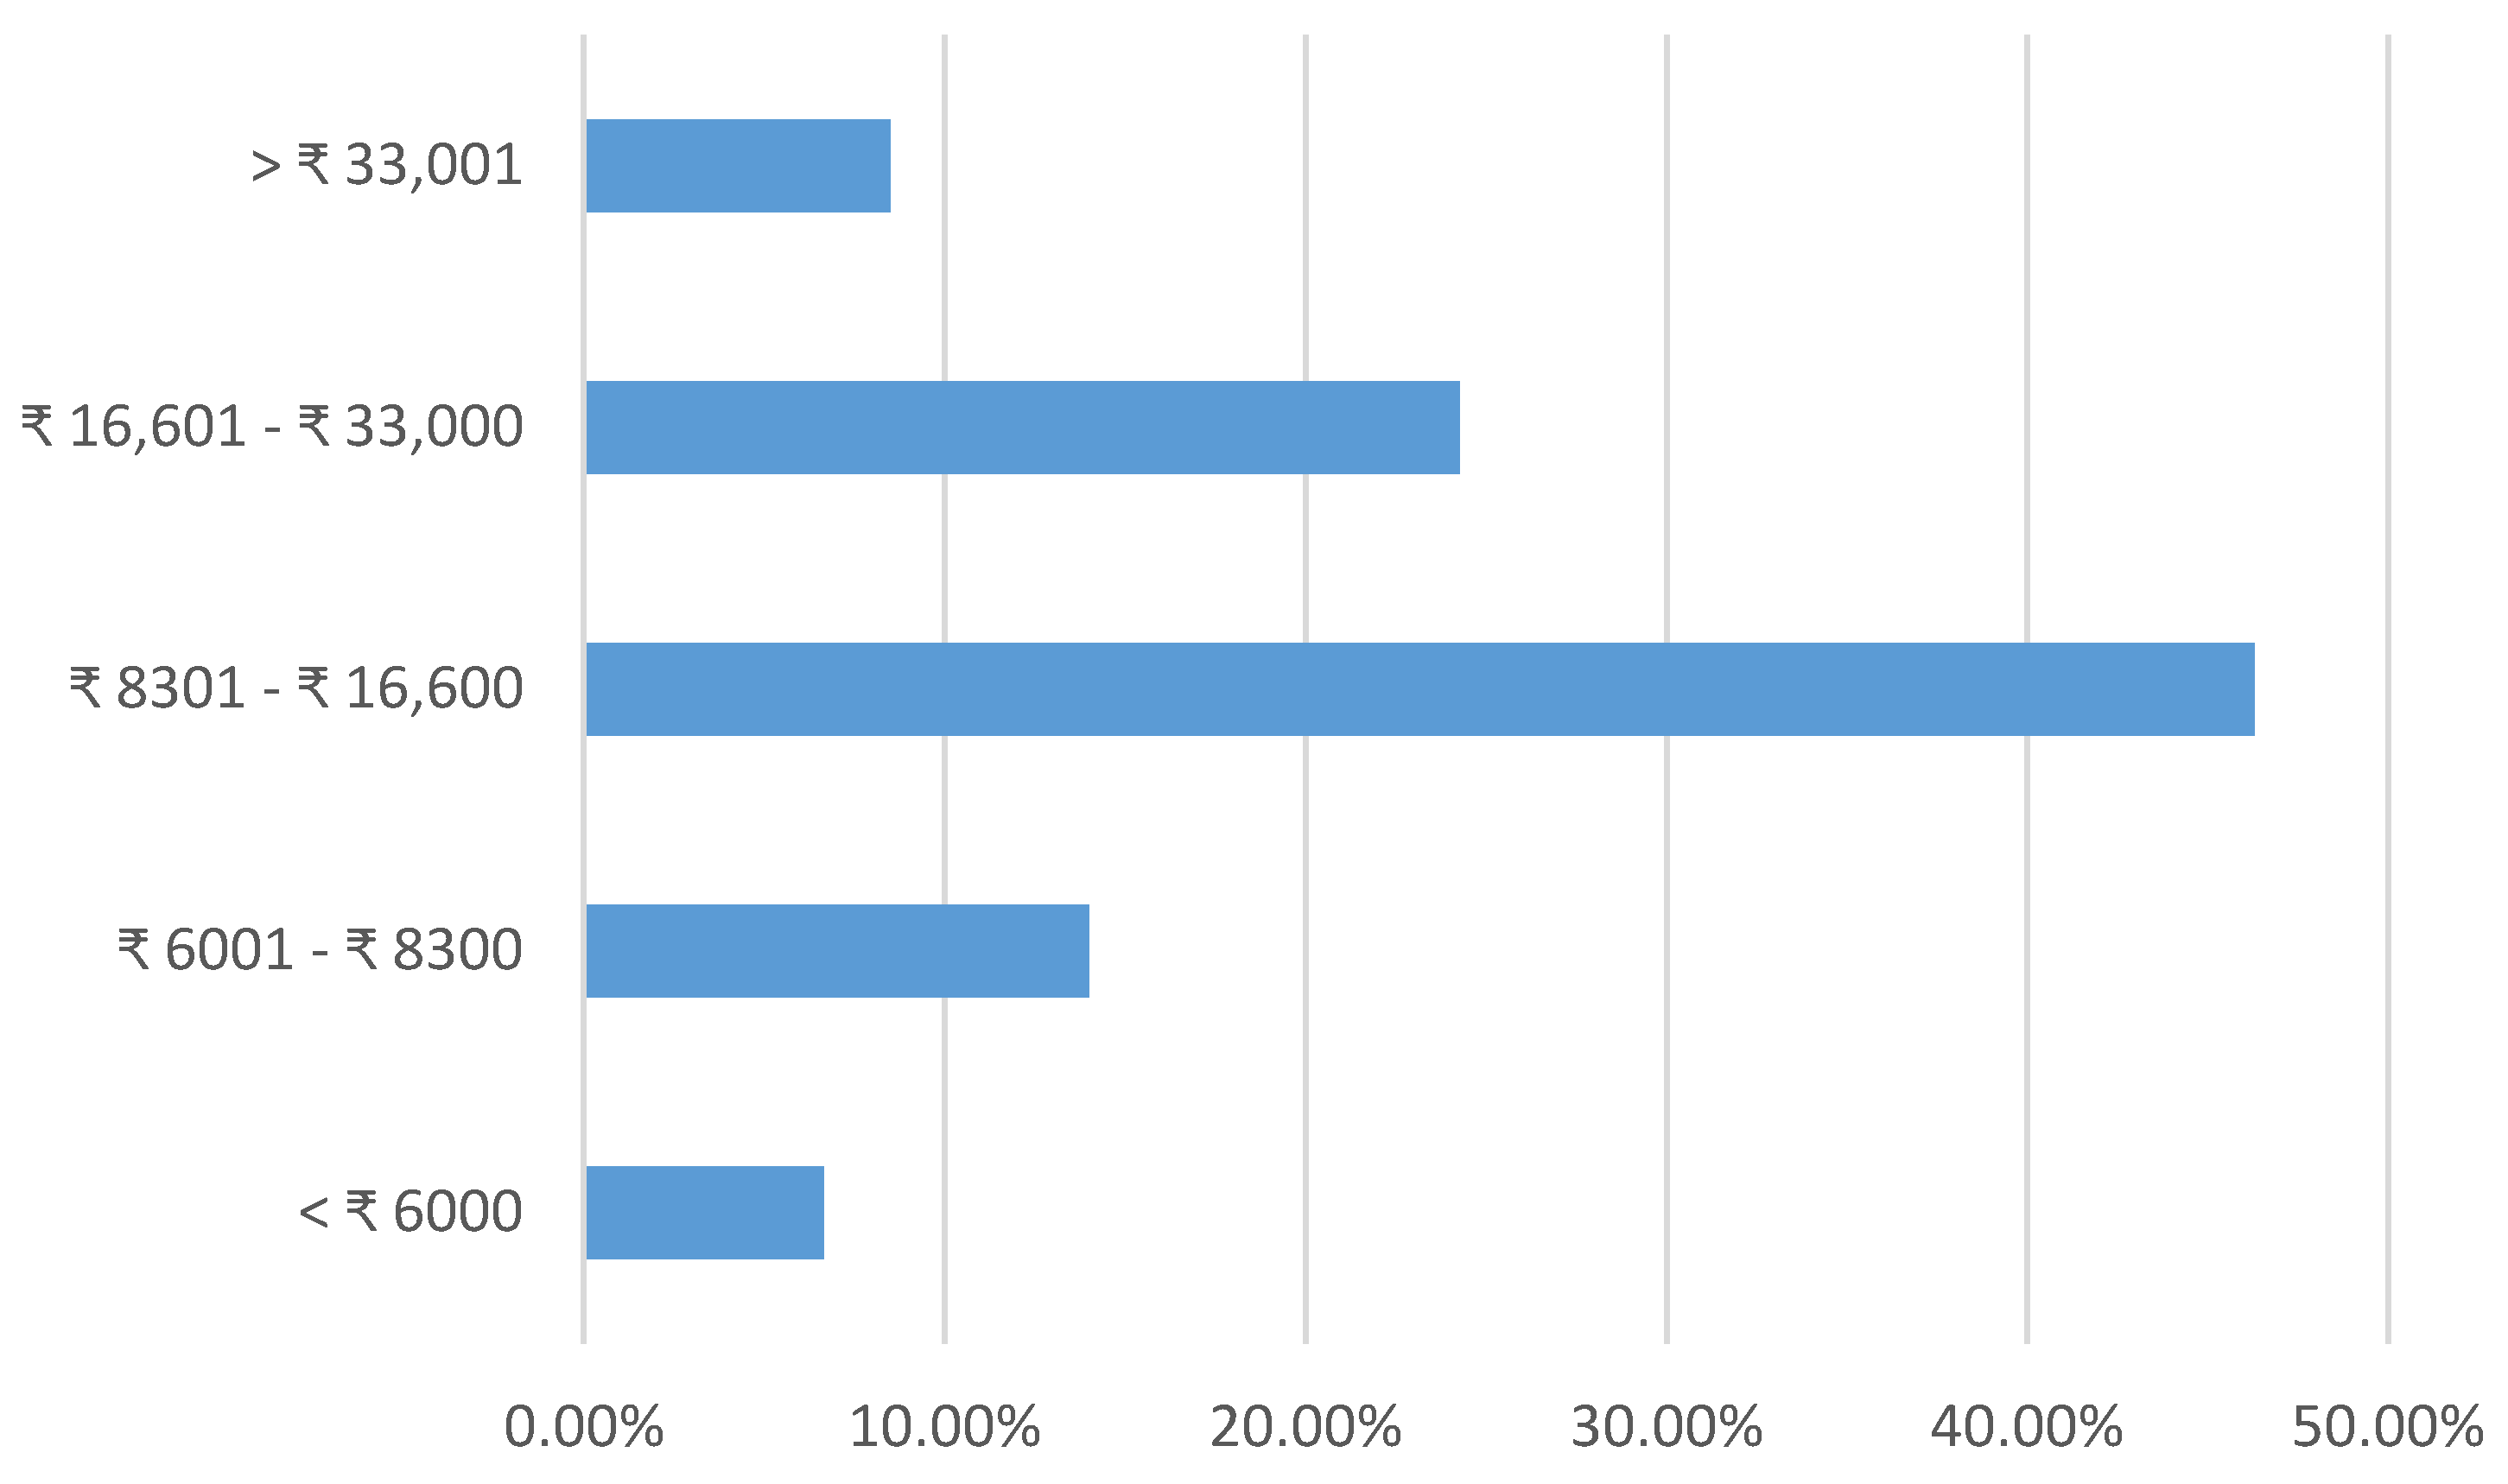
A comparison of the spread of household income between the Bryant, Szejda, Parekh, et al. [
11] survey (conducted online in India) and our survey can be found in
Figure 3. Online surveys in developing countries tend to attract individuals in higher-income brackets. While it may be argued that these higher-income individuals will be the first consumers of meat alternatives, it is important to keep in mind that this paper argues that these newer technologies should be viewed as tools to correct societal problems; in order to fulfil this role, meat alternatives must. Considering the potential for these technologies to be competitively priced with conventional meat [
73], we saw a benefit in not restricting the sample to higher-income brackets. The income distribution in our survey is closer to the national distribution of income in India, as displayed in
Figure 4. Approximately 61% of the participants chose to take our survey in Hindi; hence the provision of a second language is an advantage over the Bryant Survey, which was conducted in English only.
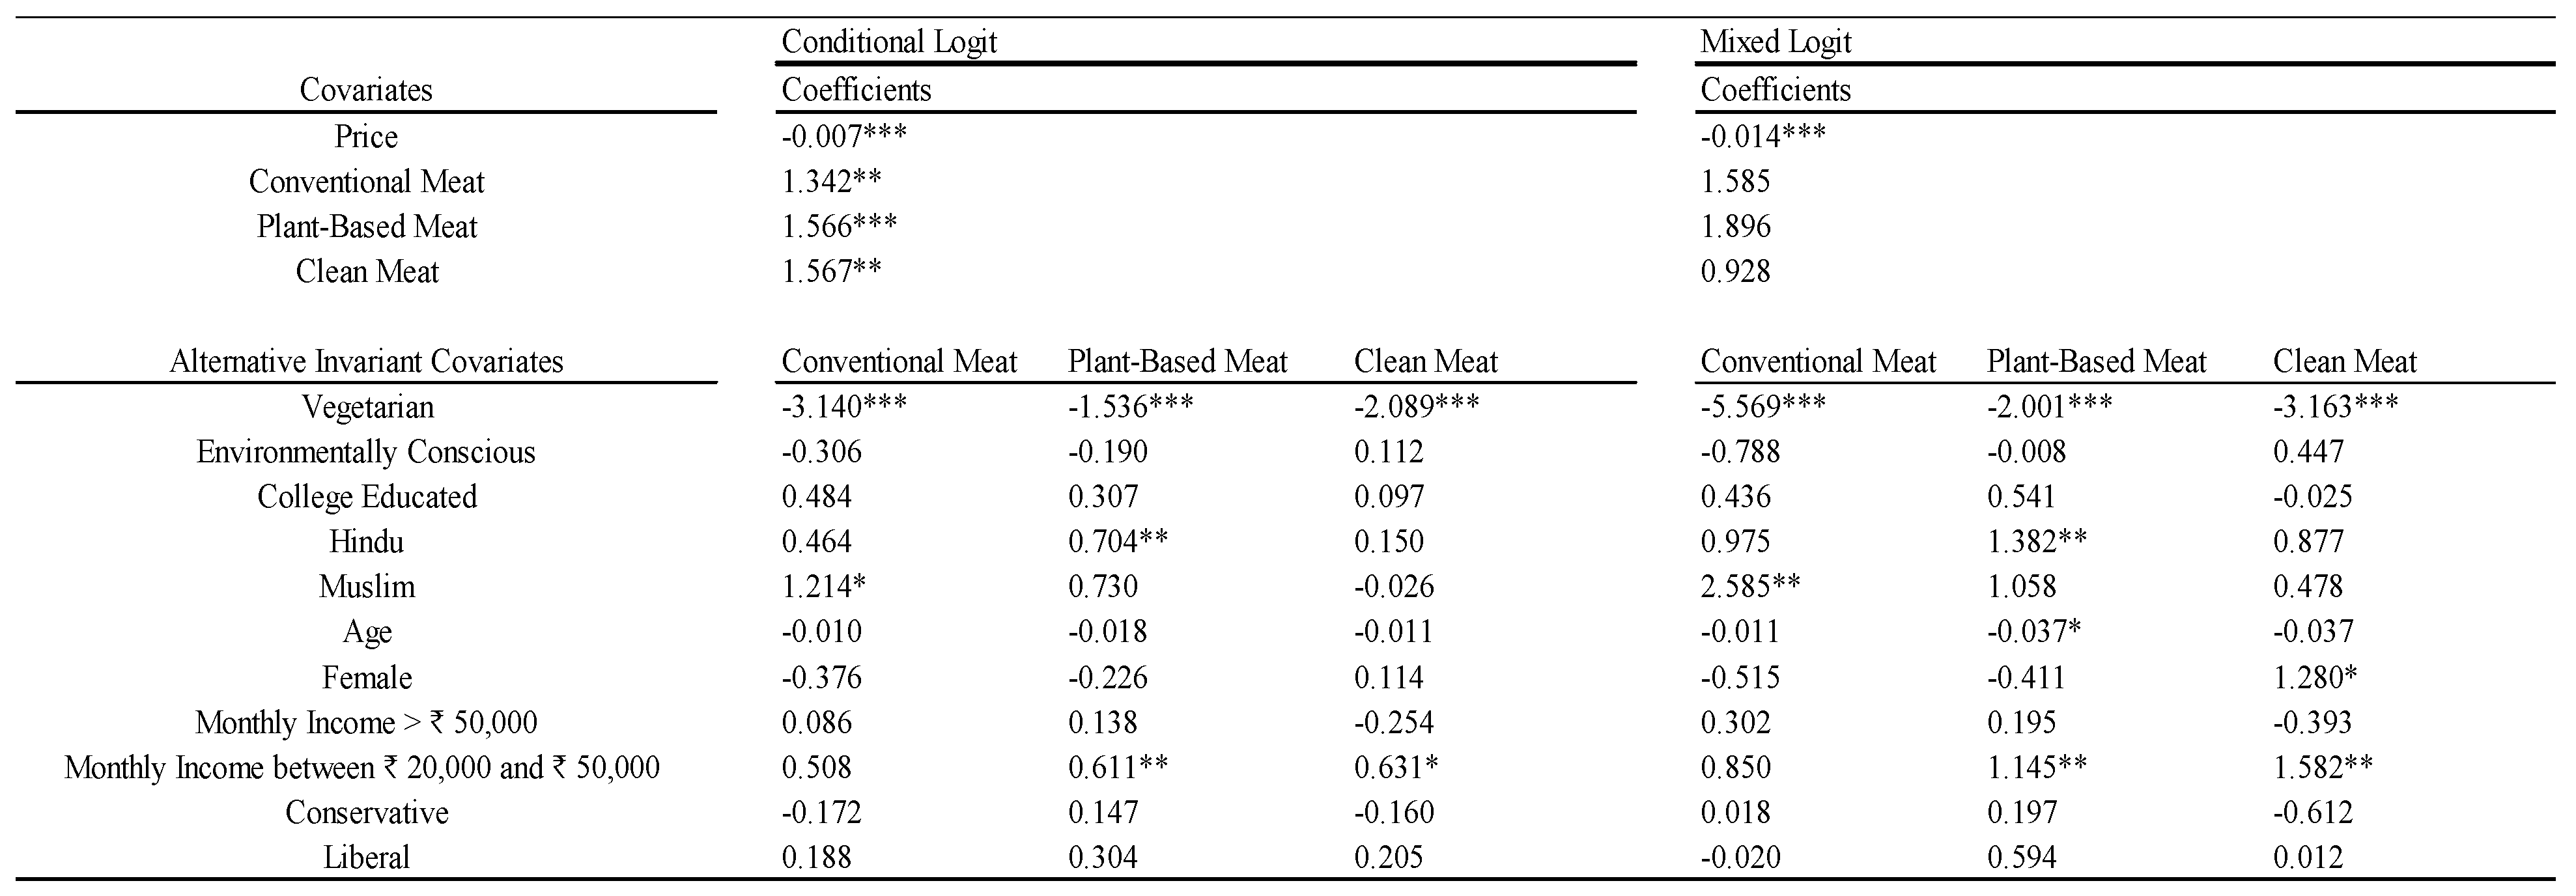
6. Results: Latent Class Model Estimation and Willingness to Pay
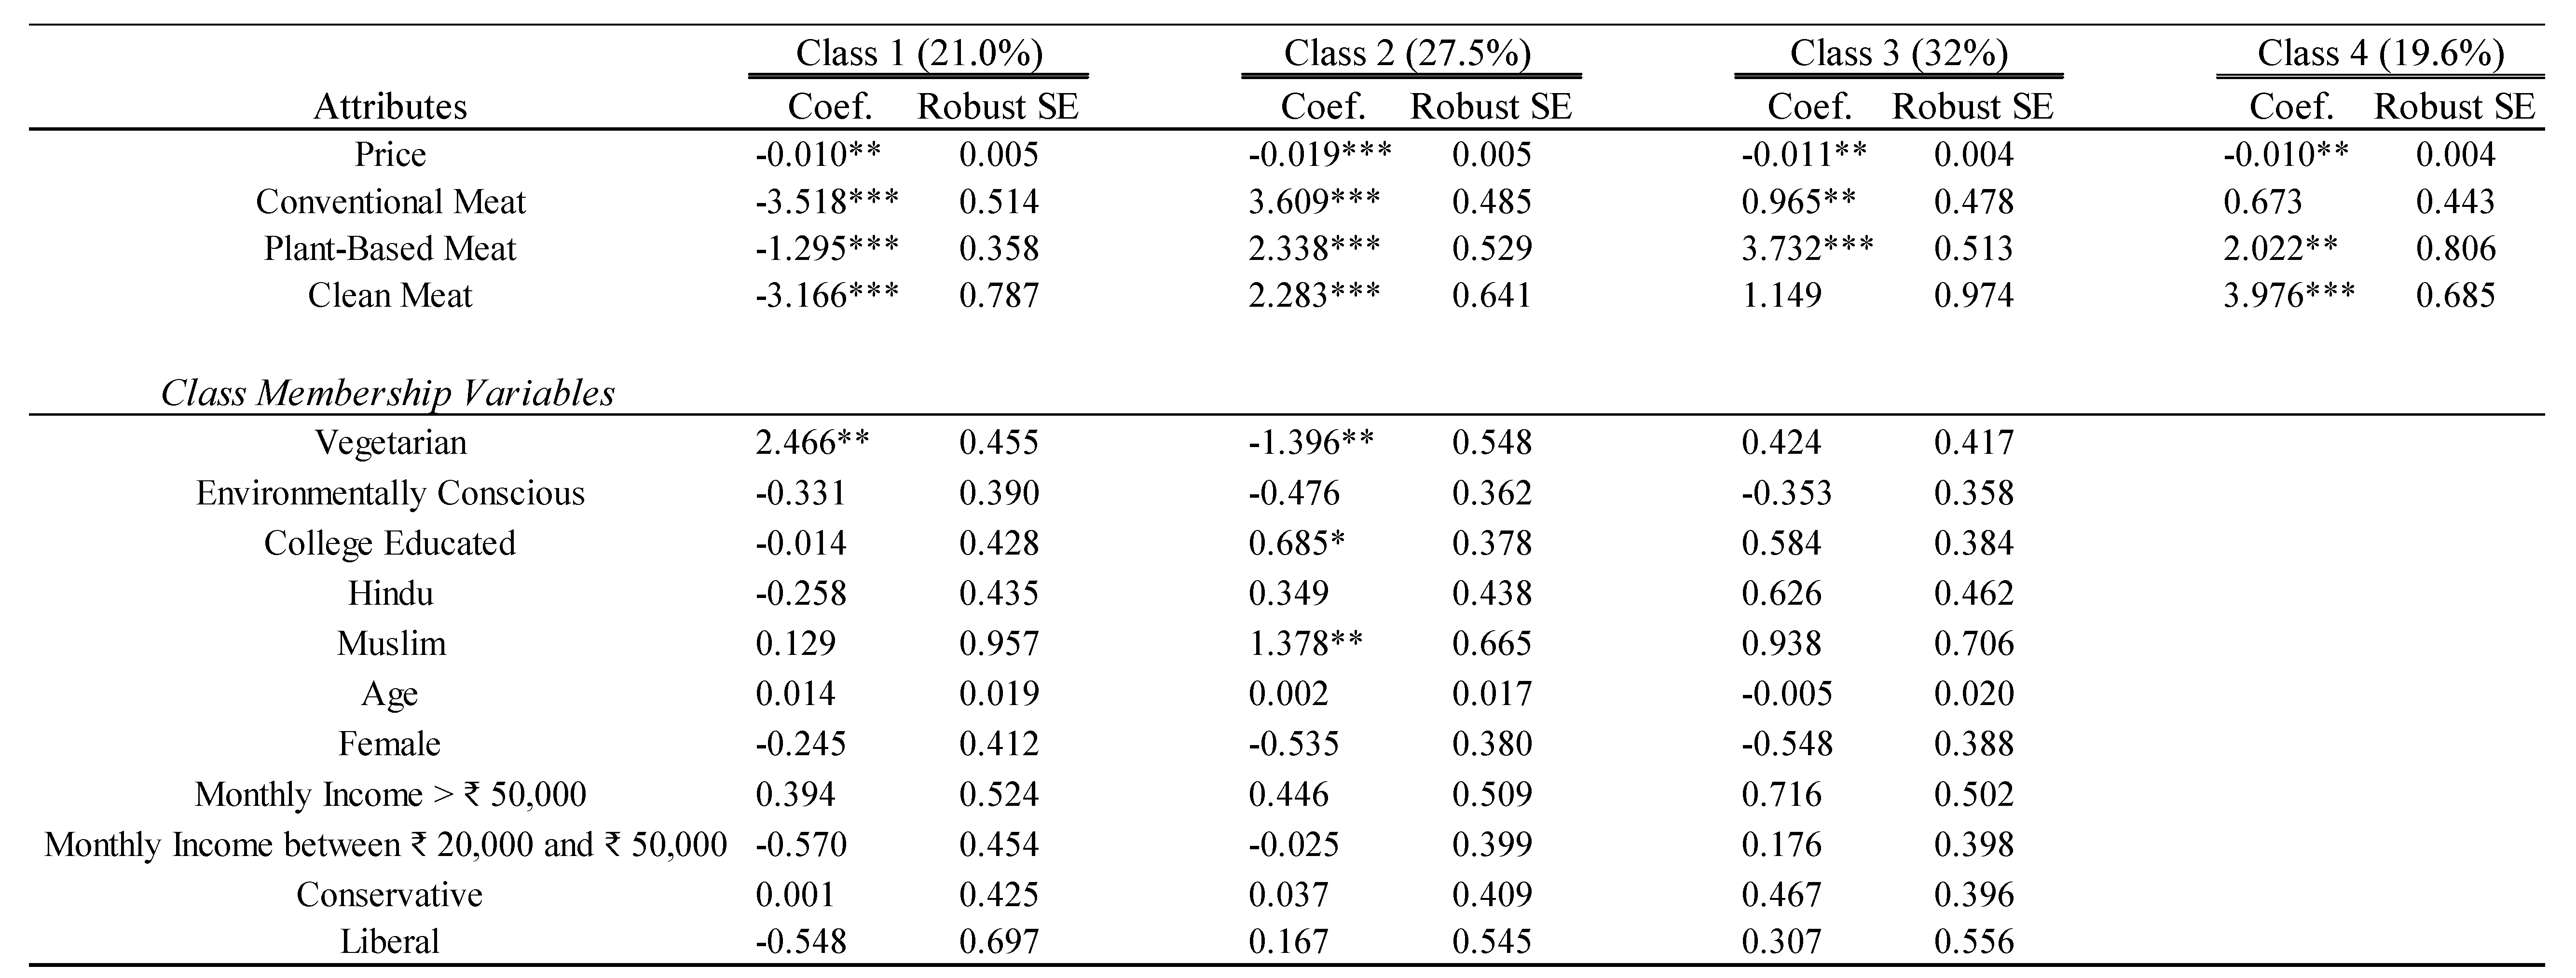
The LCM identified four distinct classes of consumers in our sample.
Figure 5 shows the results of the latent class logit regression, as well as the results of the class-membership model. Since the LCM is an extension of a multinomial logit, we need a reference alternative; therefore, we estimate K-1 sets of coefficients, where K is the number of alternatives. The coefficients for chana are normalized to zero, making it the reference alternative. The reported values are the coefficient estimate, the standard error clustered by respondent ID, and the class shares. The coefficients reflect the direction and strength of the preferences for an attribute. All four LCM classes indicate significant negative coefficients for price, validating the pricing structure and choice set design. Class shares (also referred to as the prior probabilities of class membership) are relatively even, and are listed in the top row of
Figure 5. A class share of 19.6% for Class 4, for instance, indicates that the prior probability of a given individual being in that Class 4 is 0.196.
Class 1 displayed negative and significant coefficients for conventional, plant-based, and clean meat—thus, indicating a strong, positive preference for chana, relative to these alternatives. Comparing the absolute magnitude between alternatives, the coefficient for conventional meat is the largest (in absolute value) and most significant—indicating that this class strongly prefers chana to conventional meat. This result suggests that Class 1 is likely made up of vegetarians, who (as a group) were expected to display strong negative preferences towards conventional meat. Class 2 exhibited the opposite preferences to Class 1—we observed significant positive coefficients for all three meat alternatives with respect to chana, with the coefficient for conventional meat being the largest in magnitude. This result indicates that Class 2 had a strong preference for meat products (particularly conventional meat) compared to chana—suggesting that this class is likely comprised of non-vegetarians.
Class 3 had a large positive significant coefficient for plant-based meat, and smaller positive coefficients for clean and conventional meat. Class 4 exhibited significant and strong positive preferences for clean meat, and comparatively weaker (but still significant) positive preferences for plant-based meat. This class has a positive, but insignificant coefficient, for conventional meat. These choice outcomes indicate that individuals in Class 4 have a strong preference for clean meat. Classes 3 and 4 collectively make up 51.6% of our sample, indicating that over half of our sample exhibited strong, positive preferences towards simulated meat, compared to chana.
Since the new products aim to be alternatives to meat and since WTP is estimated relative to a base case, the WTP estimates are perhaps best displayed with conventional meat as the base alternative. These WTP estimates are presented in
Table 4, with values are reported in Indian rupees (INR) and US dollars (USD).
Class 1 had positive WTP for all proteins relative to conventional meat with the highest WTP for chana and reasonably high WTP for plant-based meat. Class 2 preferred conventional meat to all other protein sources, as shown by the negative WTP estimates, and also had the strongest aversion to chana. Classes 3 and 4, respectively, had the highest WTP for plant-based meat and clean meat, and a negative WTP for chana, relative to conventional meat.
7. Class Membership
A class-membership model allows us to take a deeper look into the make-up of these LCM classes. The estimation results are presented in the lower half of
Figure 5. For details on the fractional multinomial logit specification of the class-membership model, please see Yoo [
67]. All parameters except age were coded as binary dummy variables. Respondents had six tiers of income to choose from. As of March 2019, the average per-capita income in Mumbai is approximately ₹11,783 per month or
$2020 per annum [
75]. Bearing this in mind, we determined those earning more than ₹50,000 per month as high income. Individuals earning in the second-highest tier, between ₹20,001 and ₹50,000 were seen as the middle-income group. Anyone earning less than ₹20,001 was in the low-income category. Environmental consciousness was assessed by asking respondents whether they favored New Delhi Chief- Minister, Arvind Kejriwal’s odd-even rule aimed at curbing air pollution in New Delhi, a policy that was divisive in terms of public opinion when implemented in 2017. Political conservatism and liberalism were assessed by asking respondents which political party they voted for in the 2014 Indian general election. The reason respondents were not directly asked whether they identified as “conservative” or “liberal” is that these words are largely not used to describe ideology within the Indian political discourse, and consequently, there do not exist sensible counterparts for these words in Hindi that would be understood by the layperson. Therefore, those who voted for the historically right-wing Bharatiya Janta Party (BJP) in the previous election were labeled conservative, and those who voted for the historically center/center-left Indian National Congress (INC) were labeled as liberal. The politics of food consumption, however, will likely vary by country [
76].
This class-membership model takes Class 4 as the base class, i.e., Class 4 is normalized to zero during estimation, so the parameter estimates for the other LCM classes should be interpreted relative to Class 4. The parameters were estimated via a fractional multinomial logit model; therefore, the coefficients indicate the log-odds that an individual is in each class relative to Class 4.
There are not many statistically significant predictors of class membership. Class 1 had a positive, significant coefficient for vegetarianism—a result that suggests a higher likelihood of vegetarians being assigned to Class 1 compared to Class 4. This supports our initial hypothesis that this class is made up of vegetarians who have strong negative preferences towards conventional meat. Class 2, who had the highest WTP for conventional meat, is less likely to consist of vegetarians, and more likely to consist of Muslims (who are more likely to eat meat compared to the other religions in India). Income, education, and gender are not typically significant predictors of class membership. The lack of strong predictors of consumer segments creates challenges for targeting information and marketing campaigns aimed at increasing the market share of meat alternatives.
Based on the above results and discussions, we assign the following names to the classes: the
veggie lovers, the
meat lovers, the
plant-based meat enthusiasts, and the
clean meat enthusiasts. While it may be appealing to refer to the
veggie lovers as “the vegetarians” and the
meat lovers as “the non-vegetarians”, such a classification would be misleading because it is not necessary that everyone in Class 1 is a vegetarian or everyone in Class 2 is a non-vegetarian, but it is highly likely that vegetarians will be in Class 1 and non-vegetarians will be in Class 2. Identifying consumer segments is critical for developing policies to increase the adoption of environmentally sustainable diets through traditional pricing policies or normative policies [
77,
78].
9. Discussion of Results
Our latent class analysis identified four unique segments in the Indian market for protein. The
veggie lovers consistently displayed highly significant, negative preferences for all three types of meat—conventional meat, plant-based meat, and clean meat—compared to chana, and had a strong indication of vegetarianism within the segment. However, environmental policies that attempt to target the
veggie lovers may not be effective since this class already prefers a relatively sustainable protein. Instead, interventions aimed at reducing dairy and egg consumption are more relevant to such groups [
18].
Excluding the veggie lovers, we are still left with 79% of the sample and three classes that do prefer meat products to chana: the meat lovers, the plant-based meat enthusiasts, and the clean meat enthusiasts. The key take-away for the two “enthusiast” classes, which together make up over 50% of our sample, is their strong positive preferences for simulated meat products over conventional meat and chana. The individuals in these segments are likely to be the first adopters of simulated meat products in India. The size of these classes and their WTP preferences suggest positive prospects for a simulated meat industry in India. However, both classes also prefer conventional meat to chana, suggesting the availability of meat alternatives may be an important barrier in transitioning away from conventional meat. The meat lovers comprise 27.5% of the total sample. Enticing members of this class to substitute towards meat alternatives will require pricing of simulated meat considerably lower than conventional meat. Put another way, getting meat lovers to forego conventional meat will require the most effort.
To evaluate the relative prospects of plant-based versus cell-based meat, we return to our raw survey data, which contain consumer favorability ratings for each alternative. Consumers perceive simulated meat products to have health-related, environmental, and animal-welfare benefits compared to conventional meat. We find largely positive attitudes towards meat substitutes within our sample, which, alongside the results of the market segmentation, suggests that the Indian market will be receptive to meat substitutes. However, between the two simulated meat alternatives, plant-based meat rated consistently higher than clean meat. The self-reported attitudes for meat alternatives are consistent with choices in the DCE where plant-based meat had a significantly higher mean WTP than clean meat. An enhancement to this receptiveness is that the plant-based meat enthusiasts class was the largest of the four identified segments, making up 32% of our sample. All these factors lead us to our second important conclusion: Of the two simulated meat alternatives, plant-based meat alternatives have stronger prospects in India compared to clean meat.
10. Conclusions
While Indians consume much less meat than Western populations per capita [
79], maneuvering rising demand away from animal-based proteins towards more sustainable, healthier meat alternatives at an early stage has merit from a global, societal standpoint. For instance, the universal adoption of affluent high-meat diets by the Indian population would increase GHG emissions, water footprints, and land by 19–36% [
80]. Even though the dietary guidelines issued by the National Institute for Nutrition (NIN) of India are among the most sustainable in the world [
81], they call for an increase in meat and fish intake, which is seen as beneficial from a lens of food security [
82], but has the aforementioned unintended environmental consequences. These unintended consequences heighten the need for interconnected public policies, as noted by Springmann, Wiebe, Mason-D’Croz, et al. [
56], to meet both health and environmental objectives.
The EAT-Lancet report is a recent example of how frameworks for prioritizing multiple goals can be established. The EAT-Lancet commission predicts that increased consumptions of plant-based diets could reduce GHG emissions by up to 80% [
57], and suggests a 50% reduction in the consumption of unhealthy foods—such as red meat and sugar—to simultaneously meet global environmental and nutritional goals. Two possible price-oriented policy instruments to influence the demand for conventional meat are a tax on conventional meat, and a subsidy on meat alternatives. Based on the unconditional choice probabilities and the marginal effects from our estimated models, we estimate that the price of conventional meat will need to increase by 63% or ₹93 in order to decrease its market share by 50%. Alternatively, we likewise estimate that the price of plant-based meat would need to decrease by 65%, and the price of clean meat would need to decrease by 95%, to increase their respective market shares by 50%. One important consideration in choosing policies is that subsidies for meat alternative will encourage substitution away from vegetarian options, whereas meat taxes more directly target the negative externalities. Our analysis also ignores any income effects that Grabs [
83] shows can be important.
While our study identified four latent classes and found class-specific WTP estimates that could be very useful to emerging companies in the plant alternative meat sector, we acknowledge some limitations of our research. One shortcoming of this survey is its lack of precise specification of the form of meat in question, i.e., chicken, mutton, or fish. For instance, naming the labels plant-based chicken, conventional chicken, and clean chicken may have provided respondents with more context. However, we faced little protest from respondents regarding this lapse. In describing the alternatives, participants were told that simulated meat alternatives could include chicken, fish, mutton, or any other form of conventional animal-based meat. Additionally, the believability of the standardized prompts in our survey could be scrutinized. Respondents were told that these plant-based meat and clean meat had similar taste and texture to conventional meat products. However, Slade [
27] finds that most respondents do not, in fact, believe a prompt of the sort. However, this is a challenge with any research on new technologies or products, especially food tech like meat alternatives.
Future research may also investigate non-meat animal protein, such as milk and eggs. Vetter, Sapkota, Hillier, et al. in 2019 [
18] indicated high contributions to agricultural GHG emissions in India from milk and eggs, and plant-based milks already exist and are gaining popularity in Asia [
84]. Similarly, while we focused more on land-based externalities, there is a lack of research on the economic prospects of simulated fish alternatives and their potential for preventing ecosystem collapse in our aquatic systems. Lastly, in terms of environmental research, our literature review suggests that additional work is needed to explore the impacts of animal-based agriculture on metrics other than GHG emissions and water footprints. These could include nutrient pollution, biodiversity loss, soil health, and others. Specific analyses quantifying the merits of meat substitution on food security in developing countries are also needed.


