Article

Accurate Suitability Evaluation of Large-Scale Roof Greening Based on RS and GIS Methods

1
Aerospace Information Research Institute, Chinese Academy of Sciences, Beijing 100101, China
2
University of Chinese Academy of Sciences, Beijing 100049, China
3
School of Architecture, Tianjin University, Tianjin 300072, China
4
School of Science, Changan University, Xi’an 710064, China
5
School of Geography and Information Engineering, China University of Geosciences (Wuhan), Wuhan 430074, China
*
Author to whom correspondence should be addressed.
Sustainability 2020, 12(11), 4375; https://doi.org/10.3390/su12114375
Submission received: 25 April 2020 / Revised: 14 May 2020 / Accepted: 19 May 2020 / Published: 27 May 2020

Abstract

:
Under increasingly low urban land resources, carrying out roof greening to exploit new green space is a good strategy for sustainable development. Therefore, it is necessary to evaluate the suitability of roof greening for buildings in cities. However, most current evaluation methods are based on qualitative and conceptual research. In this paper, a methodological framework for roof greening suitability evaluation is proposed based on the basic units of building roofs extracted via deep learning technologies. The building, environmental and social criteria related to roof greening are extracted using technologies such as deep learning, machine learning, remote sensing (RS) methods and geographic information system (GIS) methods. The technique for order preference by similarity to an ideal solution (TOPSIS) method is applied to quantify the suitability of each roof, and Sobol sensitivity analysis of the score results is conducted. The experiment on Xiamen Island shows that the final evaluation results are highly sensitive to the changes in weight of the green space distance, population density and the air pollution level. This framework is helpful for the quantitative and objective development of roof greening suitability evaluation.

1. Introduction

In many large cities, due to rapid economic growth and the accelerating urbanization process, the imbalance between the supply and demand of urban land has become increasingly prominent. Urban green space construction is an important means of regulating the lack of ecological space in high-density urban areas. However, in high-density urban areas, not only the urban land that can be developed into green space is limited, but also the existing urban green space is separated by reinforced concrete urban buildings, which cannot give full play to the ecological and climate benefits of urban green space. Roof greening has emerged to further improve the livable ecological environment and to increase the urban green area.
The benefits of roof greening can be divided into the following: environmental benefits, economic benefits, ecological benefits and aesthetic benefits. First, in terms of the environment, roof greening can effectively reduce surface runoff during rainstorms and reduce urban waterlogging because the vegetation and substrate layer can store water, serving as an increasingly important part of water-sensitive cities [1]. References [2,3] show that green roofs have a good ability to reduce runoff and retain storm water. From the perspective of urban heat islands, green roofs have evapotranspiration and shading effects, therefore roof greening is an effective way for urban cooling [4,5,6,7]. With the acceleration of urbanization, many large cities look like “concrete jungles” with dense buildings, intricate road network and overpopulation. These “concrete jungles” generally suffer the heat island effect, due to the large amount of high heat storage materials (such as buildings and roads) and anthropogenic heat. Literature [8] shows green roof generate moderate cooling effect on pedestrian level. Wind, green layout, greening coverage ratio, vegetation height and building height affect the cooling performance. Leaves reduce the direct radiation from the sun, and evapotranspiration converts absorbed solar heat into latent heat, which can lower surface temperatures, reduce the emission of longwave radiation, and lower air temperature [6,9]. Roof greening can also capture dust particles in the air. The research in [10] finds that green roofs can effectively reduce dust drops. At the same time, many studies also prove that roof greening can reduce noise [11,12] and improve the quality of rainwater [13]. Second, regarding economic benefits, green roofs can protect the material of the roof and extend its service life [14]. During the air-conditioning season, the thermal benefits of roof greening mentioned above cause the cooling of buildings, which reduces the energy costs and saves the money for cooling [15,16,17,18]. In some commercial areas, roof greening provides leisure places for people to rest and consume. With the proper selection of vegetables and management, roof greening has also been proven to be helpful in increasing food production [19]. Third, regarding ecological benefits, green roofs can be used as temporary dwelling places for birds or insects, providing a safe place for some urban creatures to live. The study in [20] shows that green roofs can effectively reduce the loss of habitat in urban areas. Finally, there are aesthetic benefits from roof greening. Looking down on a greened roof from other surrounding buildings is evidently more relaxing than looking at a concrete or asphalt roof, as green roofs offer a positive aesthetic response [21]. The above studies verify many different benefits of roof greening.
Although there are many advantages of roof greening, comprehensive roof greening is difficult because it needs to be adapted to local conditions for suitability evaluation. The core reason is local government finance. If there is no difference in green roof retrofitting, some unsuitable roof greening will result in financial waste. From the perspective of implementation, different roof conditions, different roof materials, and even different locations of buildings in a city will cause differences in the suitability of roof greening.
In some related studies on roof greening suitability evaluation, the study in [22] discusses the green roof retrofit potential in Mongkok, Hong Kong, which is densely populated and has obvious heat island effects. Conducting focus group discussions and developing simulation models, the research focused on two variables (exposure to sunlight and roof space) to identify roofs with green retrofit potential. However, due to the existence of subjective qualitative analysis, this method lacked a quantitative description of the suitability of roof greening. Reference [23] proposes a method of building a 3D model with light detection and ranging (LiDAR) data and very high-resolution (VHR) remote sensing (RS) data in Lisbon, Portugal, to extract roofs with greening potential. While this method only identifies the roofs that meet the requirements of roof greening, and does not distinguish the suitability priority of these roofs. In addition, the data used in this literature includes buildings’ footprints obtained in 2006 and a remote sensing image acquired in 2010. There is a problem that the buildings’ footprints are outdated and cannot match with the remote sensing image. A geographic information system (GIS)-based method in [24] uses buildings’ footprints and a digital elevation model (DEM) to calculate the slope of roofs to distinguish buildings that are suitable for roof greening. The method considered four factors, including air quality, biodiversity, the urban thermal climate and storm water retention, to measure the spatial difference in the ecological service of urban roof greening and the priority level of roof greening. However, the resolution of the final overall evaluation unit was 500 m, which is a relatively rough evaluation scale. Furthermore, in both [23] and [24], different criteria are simply spatially overlaid by the GIS method with equal weights, which ignores the different weight values between different criteria. In the studies above, subjective evaluation is hidden behind the simple spatial overlay analysis of green roof suitability evaluation by assuming that the weights of each relative criterion are equal or meet a certain priori proportion. This rough evaluation method relies heavily on the assumption of equal criteria weighting. For the development of urban planning quantification research, how to objectively quantify the evaluation criteria, quantify the evaluation process and the relationship between the evaluation results and their criteria are problems that urgently need to be solved.
Since RS has the ability to quickly and widely acquire basic data from Earth observation images, it can be used for surveys and evaluations to help decision makers and professionals in urban planning [25,26]. In recent years, with the improvement in the spatial resolution of RS images, the geometric shapes of buildings are clear in RS images with submeter resolution. The breakthrough of deep learning in computer vision makes the large-scale and accurate building roof extraction become a research hotspot [27,28,29,30], providing favorable data and technical support for subsequent suitability assessment based on the roof level of the building. Deep learning is a kind of neural network with multi-layer hidden layer. In this paper, it mainly refers to convolutional neural networks (CNNs). Through multi-layer convolution operation, CNNs gradually transform the low-level feature representation such as spectrum and texture into high-level feature representation to complete the learning tasks such as complex image classification (Specifically refers to dividing the remote sensing image into buildings and backgrounds in this paper). As powerful and robust feature learning algorithms, CNNs are increasingly playing an important role in the tasks of target extraction in RS images. CNNs have shined in the ImageNet Large Scale Visual Recognition Competition since 2012 [31,32,33,34,35]. Full convolutional neural networks (FCNs) [36], SegNet [37] and U-net [38] make end-to-end CNNs popular for semantic segmentation. Applying FCNs to the field of RS image recognition makes it possible to detect different types of objects on the ground and predict their shape, such as buildings and road [39,40,41]. Using deep learning method to extract buildings from remote sensing images is essentially a binary semantic segmentation problem, that is, using CNNs to divide images into buildings and backgrounds to achieve the purpose of extracting buildings. In this paper, D-LinkNet [41] is used to extract urban buildings, and its large receptive field can fully identify the context information of building targets.
In this paper, the suitability evaluation criteria of roof greening are considered comprehensively, which involves the building itself, the environment, and social and demographic aspects. First of all, the roof patches of buildings are extracted accurately from the remote sensing image by using the deep learning method, and the roof patches are exactly matched with the remote sensing image. Then we calculate the evaluation criteria quantitatively based on RS, GIS and location-based Internet services technologies. Next, the technique for order preference by similarity to an ideal solution (TOPSIS) method [42] is used in this paper to consider multiple criteria to obtain comprehensive evaluation scores. Monte Carlo simulation (MCS) [43] is used to simulate different weights and repeat TOPSIS method many times to get stable evaluation results. As a well-known multicriteria decision-making analysis method, TOPSIS has been applied in the evaluation of sustainable urban development [44], mineral potential mapping [45], the quantification of the vulnerability of urban landscapes to land use changes [46] and so on. Finally, this paper conducts uncertainty and sensitivity analyses on the evaluation results and quantitatively analyzes the influence of the change in criteria weights on the final evaluation results of roof greening suitability. This evaluation method is not only at the theoretical level but also practical and computable. Multisource data with rich and fine-grained forms are used in this paper to establish a reusable and interpretable evaluation method for roof greening suitability.
The research in this paper focuses on providing a rapid and large-scale quantitative evaluation method for roof greening suitability. The main contributions of this paper are as follows:
  • The semantic segmentation method based on deep learning is used to extract patches of building roofs quickly and effectively, which solves the problem of mismatch between the image and the buildings’ footprints due to different acquisition time. Accurate roof patches lay the foundation for the subsequent suitability evaluation at the building level.
  • This paper comprehensively considers building criteria (roof slope, materials), environmental criteria as well as social and demographic criteria, and expresses them reasonably and quantitatively. Then TOPSIS method is used to realize multicriteria decision-making analysis and its results have the advantages of being quantitative and accurate. Ranking the priority of buildings for roof greening retrofit in the whole study area, changing the fuzzy and qualitative evaluation methods in past urban planning applications.
  • Further, this paper analyzes the uncertainty and sensitivity of the evaluation results, which is helpful for urban planning designers to focus on criteria with higher weight sensitivity.

2. Materials and Methods

2.1. Study Area

Xiamen Island (24°26′46″ N, 118°04′04″ E) is located at the southeast part of Fujian Province, China. It is 13.7 km long from south to north and 12.5 km wide from east to west, covering an area of 155.89 square kilometers, and it is the fourth largest island in Fujian Province. The island is divided into the Siming and Huli districts, which have jurisdiction over 9 blocks and 5 blocks, respectively. As the political, economic and cultural center of the whole city, Xiamen Island has a high population density of more than 10,000 people per square kilometer, resulting in a low per capita green area. The land use situation on Xiamen Island is tense. In the high population density area of the island, the planning and implementation of ecological space extension must take full account of the status of built-up areas. If ecological construction is carried out through simple land requisition, it requires higher transaction costs.
Roof greening can expand new urban ecological space on the roofs of existing buildings, which is a supplement to the existing green space system on urban surface without changing the status of land use. Roof greening is an effective means of expanding the urban green area under the restrictions posed by land resource shortages. As a tourist and garden city, Xiamen has higher requirements for the ecological environment. The government’s policy promotion and advocacy have resulted in good opportunities for the ecological construction and development of Xiamen.

2.2. Materials

The high-spatial-resolution (HSR) RS data for Xiamen Island come from Google Map and were obtained in October 2018, with a resolution of 0.5 m (Figure 1). The data of land use and the number of floors of each building come from the Xiamen Municipal Natural Resources and Planning Bureau. Among them, the land use types are divided into 10 categories (residential area, public management and public service area, commercial area, urban green space, water, industrial area, transportation area, special function area, agricultural and forestry area and other types). The urban green space distribution comes from the land use data and includes main park green space, production protection green space and scenic area green space in the city, which can provide green space for recreation and relaxation. The road congestion data related to urban air pollution sources come from the comprehensive analysis of the 2018 annual road traffic operation report [47] issued by the traffic police detachment of the Municipal Public Security Bureau and the traffic congestion index of intelligent transportation of Baidu Map [48]. Another source of urban air pollution considered in this paper is the list of key air pollution enterprises in 2018 released by the Xiamen Environmental Protection Bureau [49]. The precipitation distribution data come from the Resource and Environment Data Cloud Platform of the Institute of Geographic Sciences and Natural Resources Research, Chinese Academy of Sciences [50]. Landsat 8 data obtained on August 21, 2019 (clear weather in summer) for surface temperature inversion are downloaded from the United States Geological Survey (USGS). The population density data come from the Easygo Heat Map, which are location-based service (LBS) products of a social network-based Chinese technology company named Tencent.

2.3. Methods

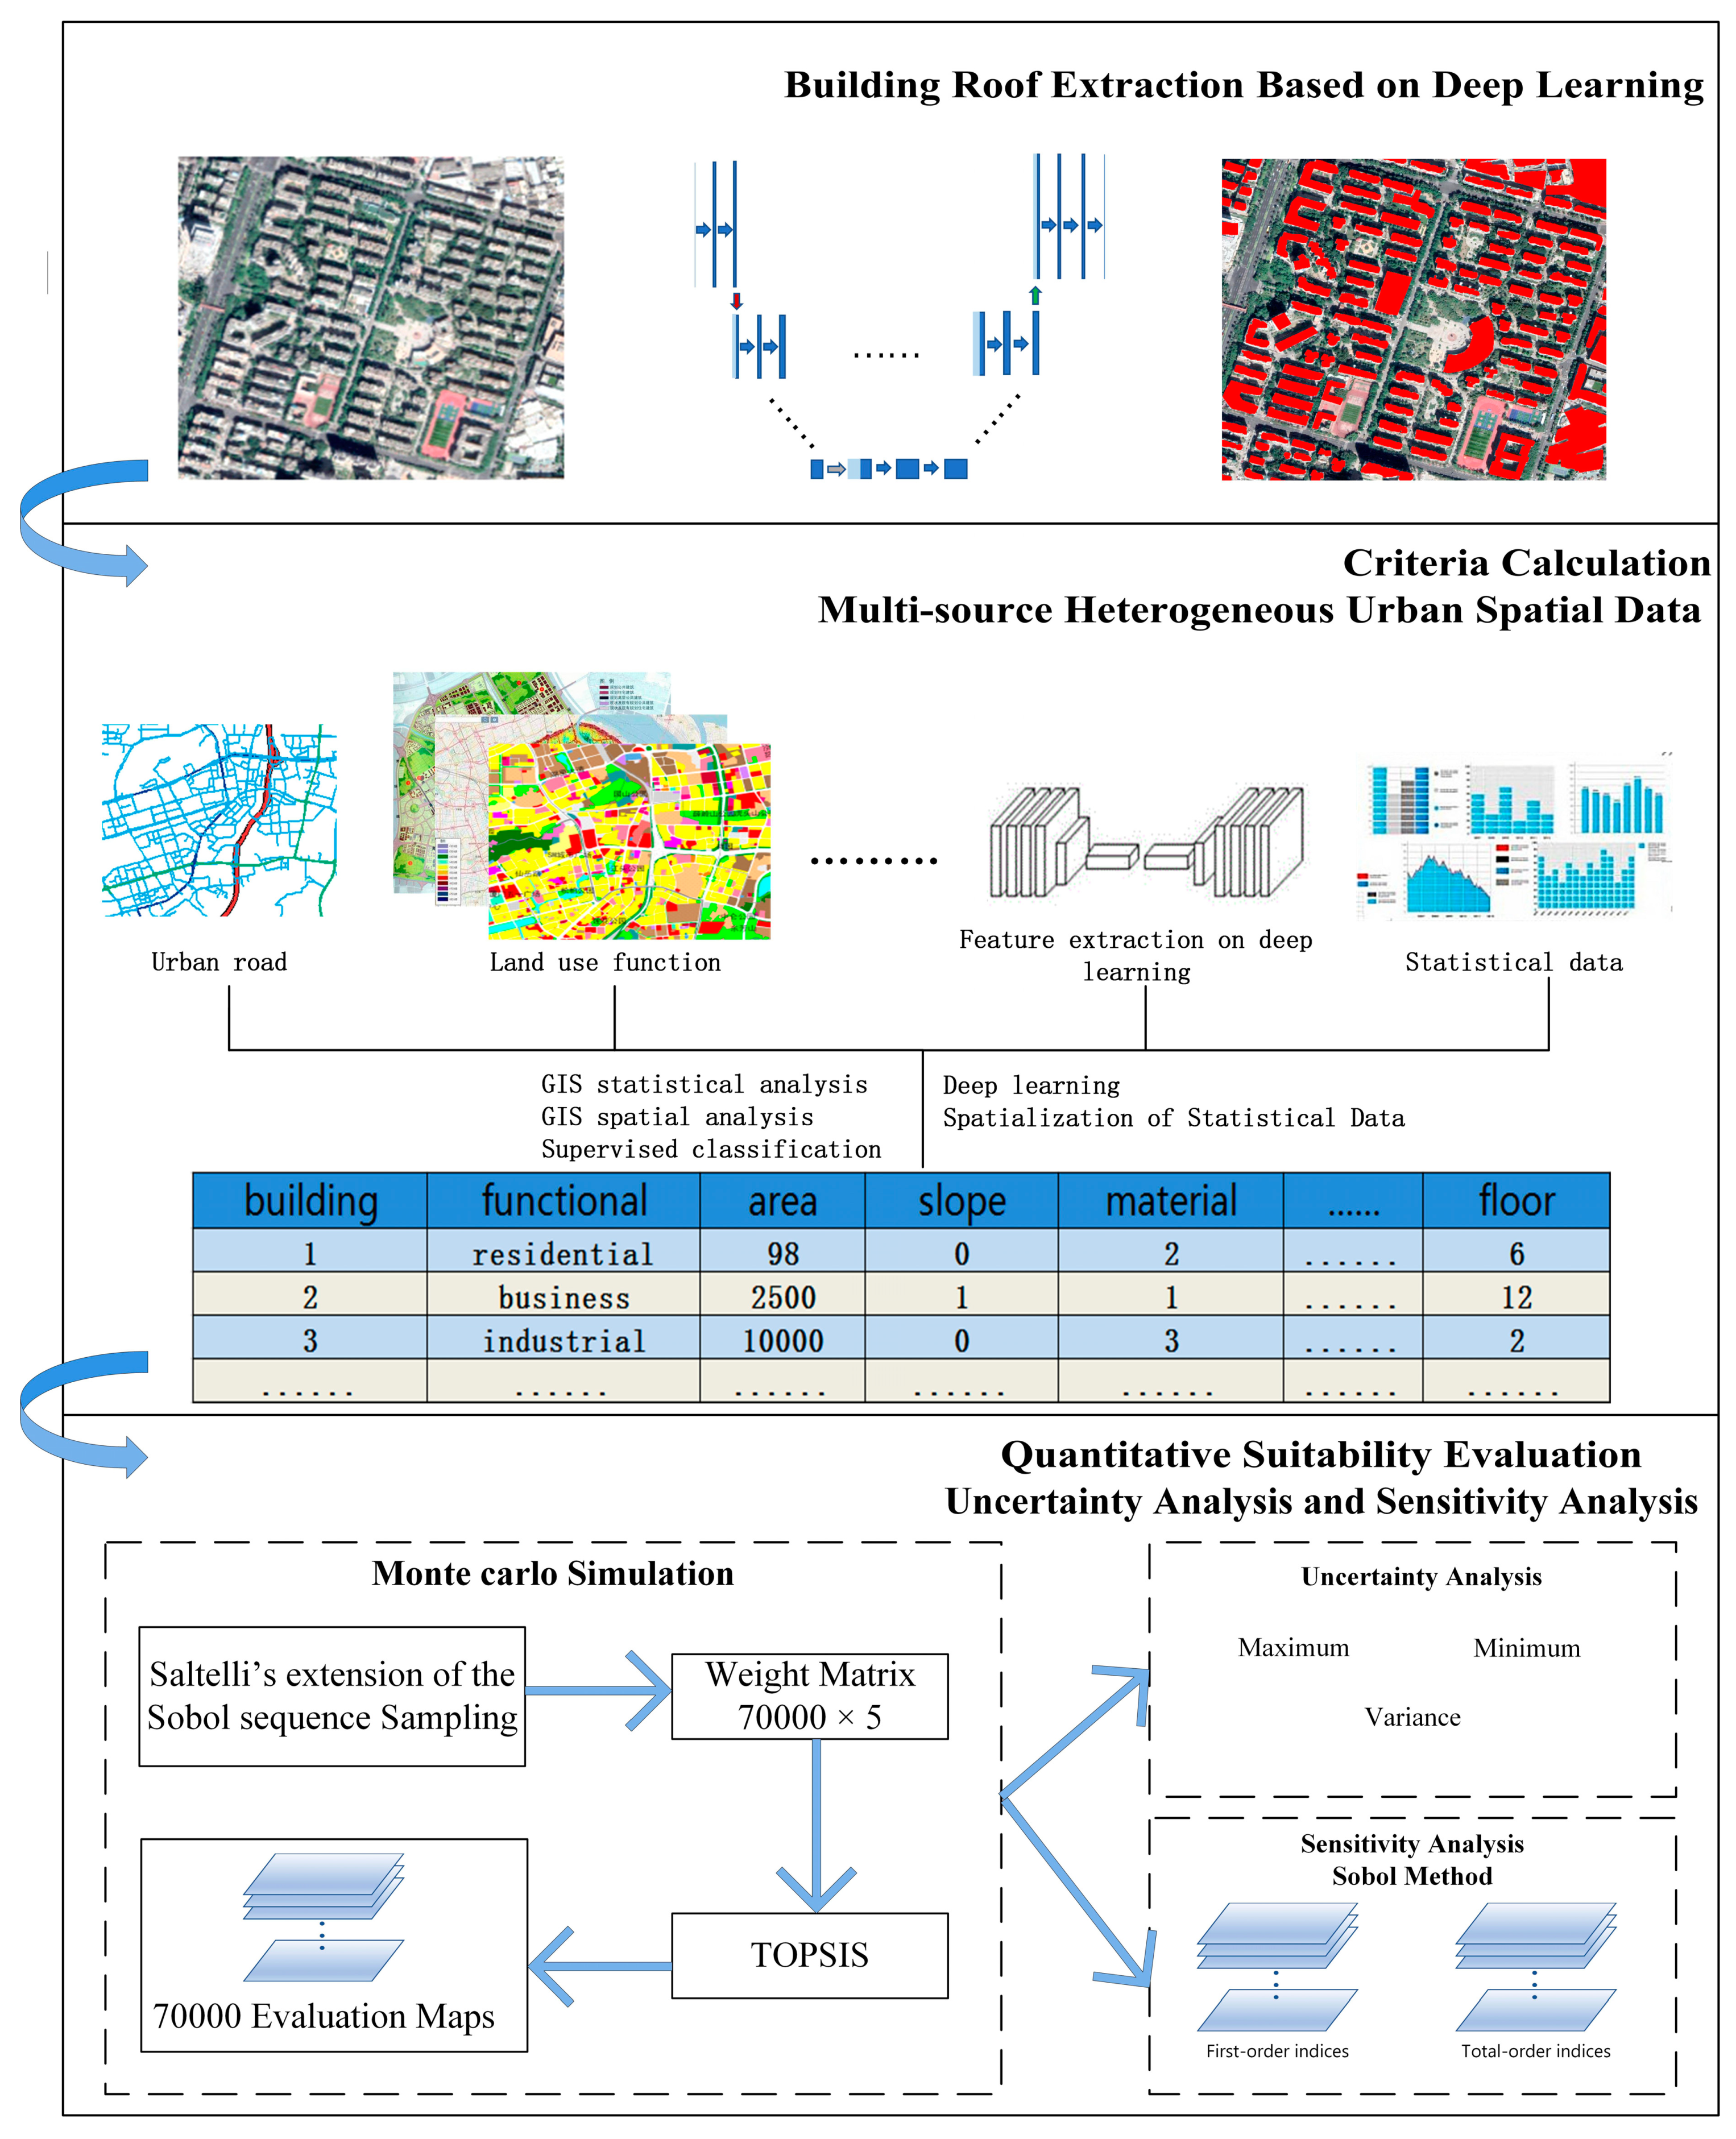
The overall method and technology flow can be roughly divided into three parts: (1) the first part is the extraction of building roofs based on deep learning, and the latest semantic segmentation technology is used to extract the roofs of the research area quickly and accurately. (2) The second part is building roof criteria calculation based on multisource heterogeneous urban spatial data, including building criteria, urban environmental criteria, meteorological criteria, social population criteria and so on. (3) The third part is quantitative suitability evaluation and the accurate mapping of roof greening based on MCS and TOPSIS. On this basis, the uncertainty and sensitivity of the evaluation results are analyzed. The whole research method mainly focuses on the rapid and large-scale extraction of urban building roofs, the quantitative calculation of suitability criteria, multicriteria decision-making and evaluation result analysis. The methodological framework is shown in Figure 2.

2.3.1. Fast Extraction of Building Roofs

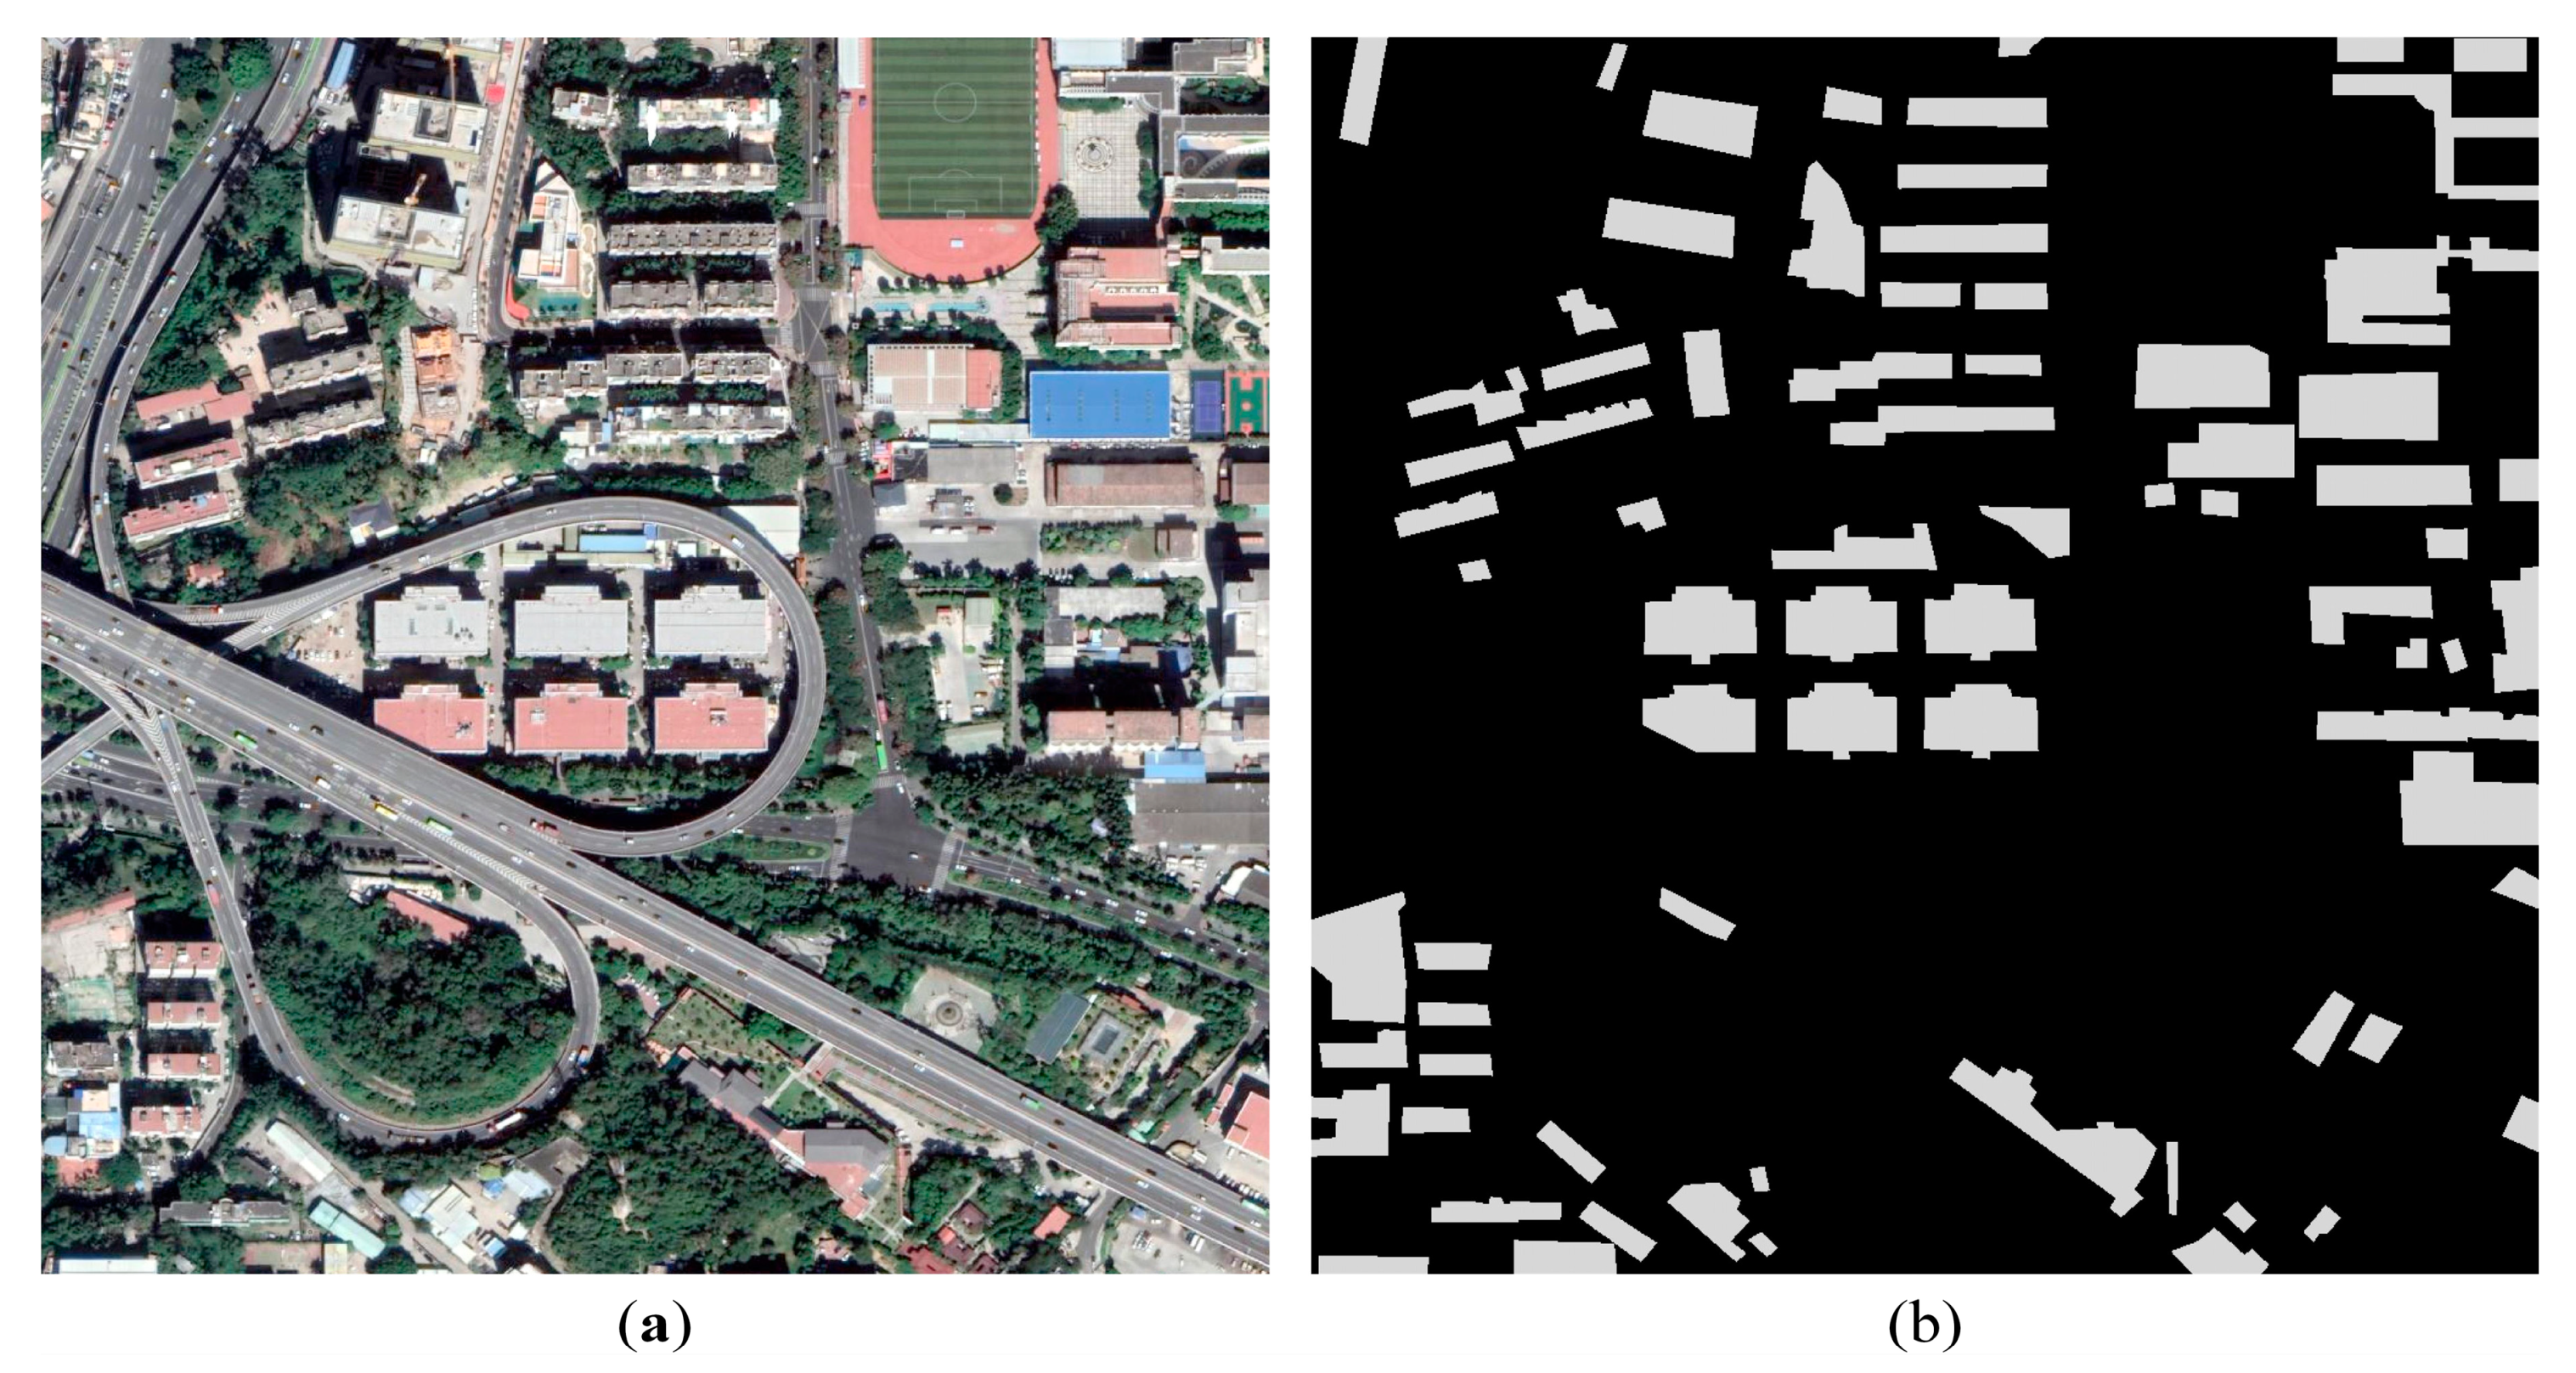
Rapid and accurate extraction of building roofs is the premise of roof greening suitability evaluation. To overcome the disadvantage of artificially designed features in traditional methods that ignore the contextual information in images [51,52,53], this paper used the semantic segmentation in deep learning method to extract the roof profiles of buildings. The specific network structure is D-LinkNet, which includes an encoder-decoder structure, a pretrained encoder and dilated convolution for building roof extraction tasks [41]. First, 27 sample image patches (with the size of each patch being 1000 × 1000 pixels) were selected uniformly throughout the study area. The sample area should include all types of buildings in the study area to the greatest extent possible. One of the original sample images and the corresponding label images are shown in Figure 3a,b. All buildings’ roofs in the sample patches needed to be labeled, and the rest were used as background. In this way, building extraction can be regarded as a binary semantic segmentation task. After semantic segmentation, many attempts were needed to choose the appropriate threshold for binarization and to vectorize the building patches based on the results of binarization. The process of binarization and vectorization could be performed using ArcGIS 10.2 software.

2.3.2. Generation of Suitability Evaluation Criteria

In this paper, the evaluation criteria of roof greening were divided into decisive criteria and non-decisive criteria. The decisive criteria mainly included the roof slope, roof materials and building layers. These three decisive criteria had a one vote veto right to judge whether a roof can be green retrofitted. On the basis that the three decisive criteria met the requirements of roof greening, the other non-decisive criteria more comprehensively reflected the suitability differences in the green roof retrofitting of different roofs.
(1) Rooftop slope
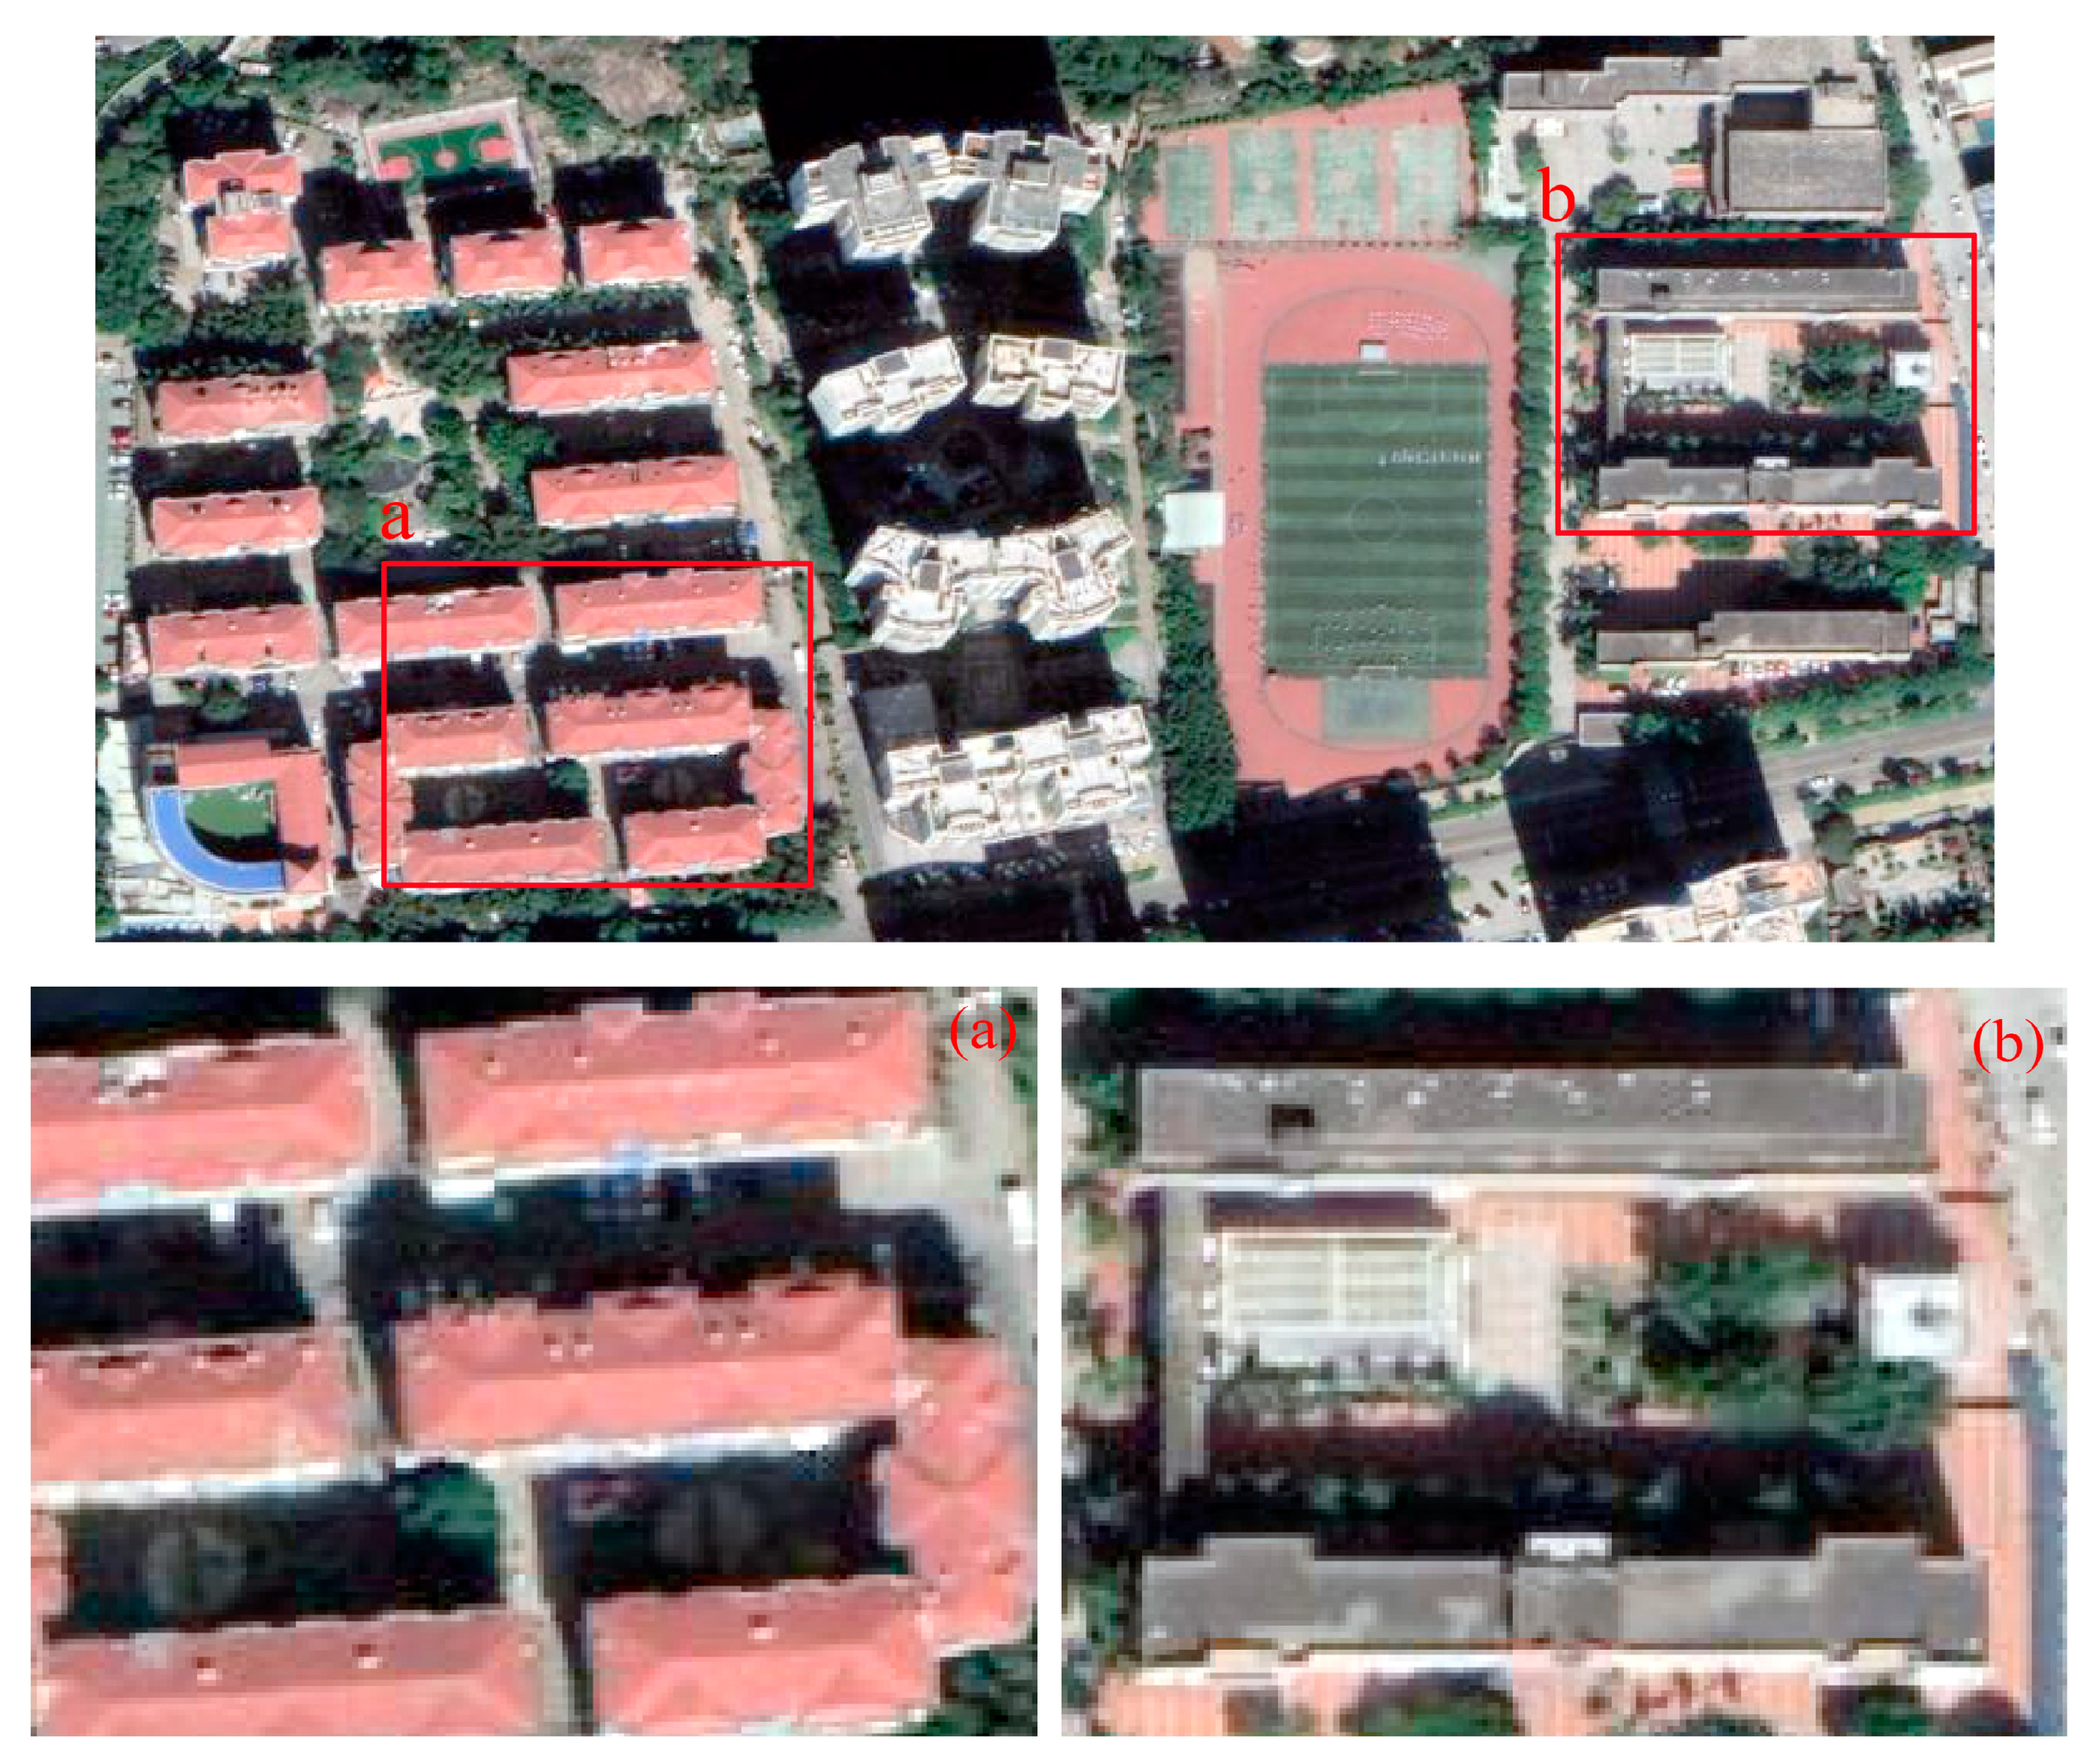
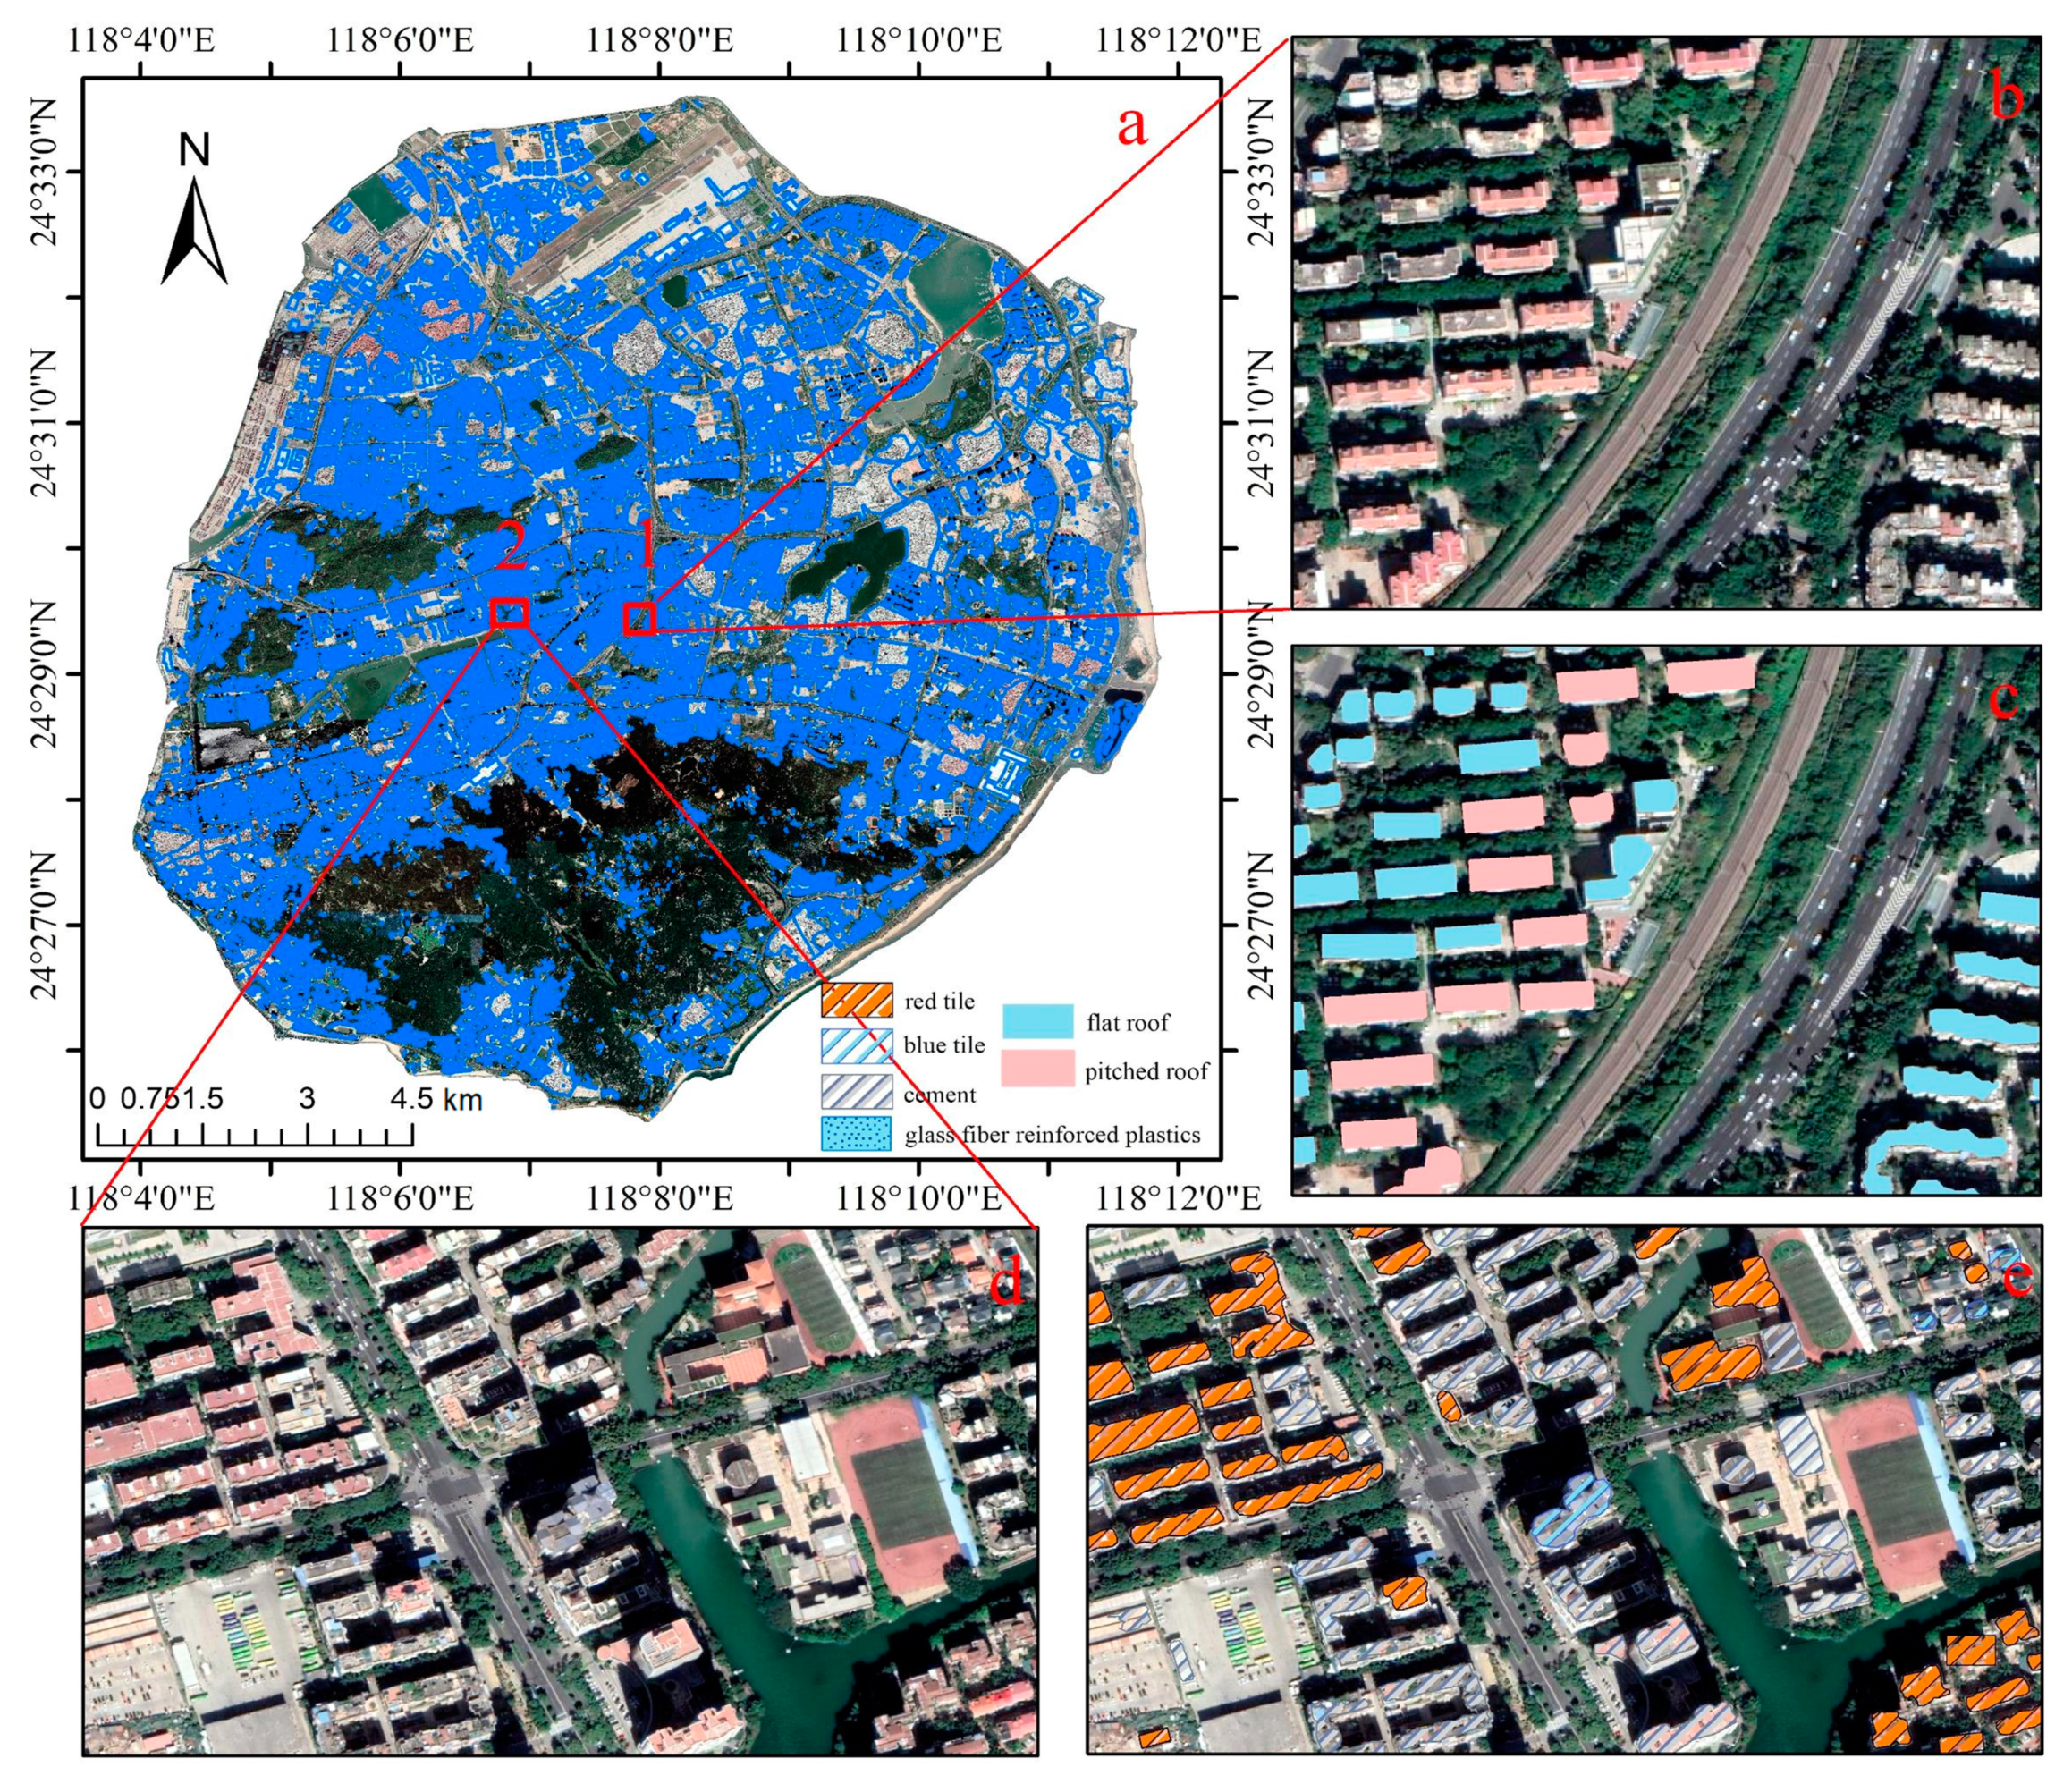
The roof slope is one of the decisive criteria for determining whether a roof can be greened or not. In the two-dimensional image space, it is difficult to calculate the exact roof slope value. However, in a submeter high-resolution image, the ridge in the middle of the pitched roof can be seen clearly, as shown in Figure 4. Furthermore, sloped roofs are usually made of tiles and fiberglass-reinforced plastic, which are obviously different from flat roofs with steel-reinforced concrete structures and parapets. These are important semantic information that can be used to distinguish pitched roofs from flat roofs. Therefore, different semantic segmentation models can be designed to distinguish pitched roofs from flat roofs. The samples used in the aforementioned part on deep learning roof extraction needed to be relabeled. The labeling method was the same; the difference was that only sloped roofs were chosen as the foreground in this part, with others chosen as background.
(2) Roof material extraction
Changes in image spectral characteristics can reflect the difference in roof materials. Thus, unsuitable roof materials can be identified on the pixel scale using the supervised classification method in machine learning. First, roof patches extracted from the deep learning method mentioned above could be used as masks because only the roof areas need to be classified. Then, four different roof materials (red tiles, blue tiles, fiberglass-reinforced plastic, cement) were extracted by the maximum likelihood classification method [54,55] based on the pixel scale. Finally, the zonal statistics of each roof patch were obtained with the constraint of the roof patch boundary. The material type constituting the majority in the pixels in one roof patch was the material type of this roof patch.
(3) Annual rainfall distribution
Influenced by the topography, the precipitation in Xiamen increases steadily from southeast to northwest, as is the case on Xiamen Island. To quantitatively describe the precipitation distribution on Xiamen Island, annual precipitation data, provided by the Resource and Environment Data Cloud Platform of the Institute of Geographic Sciences and Natural Resources Research, Chinese Academy of Sciences, were used. The platform has collected annual precipitation data in China since 1980. Based on daily observation data from more than 2400 meteorological stations across the country, data on the spatial distribution of precipitation in kilometer grids are obtained through collation, calculation and spatial interpolation, and the units are accurate to 0.1 mm [50]. In this paper, the latest spatial interpolation data for precipitation in 2015 were used to quantitatively analyze the increasing distribution of precipitation from southeast to northwest on Xiamen Island. The inverse distance weighted (IDW) [56] method was used to interpolate the precipitation data of the kilometer grids to obtain more precise and more suitable scale of data for buildings.
(4) Spatialization of the demographic data
The ultimate purpose of roof greening is to bring people a more livable environment. Because green roofs are close to the places where people work and live, one of their social effects is that they can provide a green space to relieve pressure for employees who are under work pressure and can provide a place for residents to walk, relax and communicate. Thus, the spatial distribution of population is a factor that must be considered. Population data usually come from statistical yearbooks or census data, which are collected by the census and step-by-step statistics in administrative regions. However, statistical data cannot reflect the spatial distribution characteristics of the population on a fine scale. Therefore, focusing on roof greening, we need to find a more reasonable way to achieve spatialization of the population data. The traditional method, which is to spread the population data over a certain grid size, is mainly divided into the population density gravity model [57,58], area weight method [59], IDW algorithm [60,61], population distribution model under the influence of different land use types [62] and so on. In recent years, the popularity of mobile phones has made some LBSs a new method of acquiring the real-time population density. Easygo is a high-resolution (25 m) user density product of Tencent, one of the Internet enterprises with the largest number of users in China. Its user location information comes from all Tencent platforms, including WeChat, QQ instant messaging, Tencent microvideo, Tencent microblogging, and Tencent Map. In 2018, the monthly active accounts of WeChat reached 1.098 billion, and QQ reached 807 million. The abundant user location data make Tencent Easygo a reliable data source.
This paper collected Easygo data from August 27 to August 29, 2019, at 10:00 a.m. and 9:00 p.m. (all workdays). The land use data from the Xiamen Municipal Natural Resources and Planning Bureau could help identify residential and nonresidential areas on Xiamen Island. Then, the population kernel density of nonresidential areas in the daytime and the population kernel density of residential areas at night were estimated using ArcGIS 10.2. Finally, the daytime and nighttime kernel density maps were divided into five levels. The buildings in nonresidential areas adopted the kernel density level in the daytime, while the buildings in residential areas adopted the kernel density level at night.
(5) Extraction of the urban heat island effect
The urban heat island effect can lead to higher temperatures in urban areas than in surrounding suburbs or rural areas. The composition and allocation of urban landscapes have significant impacts on the heat island effect. Vegetation significantly reduces the heat island effect, while impervious surfaces increase it [63]. Promoting roof greening in built-up areas can reduce the surface temperature and improve thermal comfort [64]. To measure the distribution of the heat island effect on Xiamen Island, an image of Landsat 8 of a sunny summer day in 2019 (the satellite passing time was 10 a.m. local time) was selected, and a practical split-window algorithm was used in this paper to derive land surface temperatures (LSTs) from the Thermal Infrared Sensor of Landsat 8 [65], which can obtain LST products with an accuracy better than 1 Kelvin thermodynamic temperature. The parameters of the algorithm were determined based on a modified split-window covariance-variance ratio method to estimate atmospheric water vapor subranges [66]. Then, the difference between the urban and rural surface temperatures was used to reflect the intensity of the heat island effect.
(6) Urban air quality
The main pollutants of urban air pollution are gaseous and particulate pollutants, which mainly come from transportation vehicles, industry and district heating emissions [24]. Green roofs can absorb air pollutants through deposition on vegetation [67,68,69,70]. Due to the low latitude of Xiamen Island, no district heating is needed. Therefore, the sources of air pollutants mainly include automobile exhaust emissions and industrial air emissions. A traffic count map was used to represent the annual average daily traffic intensity of the urban road network in [24], and finally, the daily vehicle counts were divided into 100 m × 100 m spatial units by spatial overlay. Learning from this kind of experience, this paper divided roads into three levels, urban congestion roads, main roads and general roads, according to the road congestion situation in the peak period of weekdays based on the comprehensive analysis of the official annual road traffic operation report [47] and Internet map intelligent traffic data [48] for Xiamen City. Meanwhile, in light of the list of key air pollution enterprises in 2018 released by the Xiamen Environmental Protection Bureau, the garbage incineration power plant located in the urban area was also identified as an air pollution source. Then, a multilevel buffer based on the distance to air pollution sources was established to describe the impact range and levels of air pollution sources. Finally, the pollution index in the buffer zone was overlaid and reclassified into five levels.
(7) Functional attributes, floors and area of buildings
The number of building floors and land use status come from the official data of the Xiamen Municipal Natural Resources and Planning Bureau. Specifically, the land use function attribute of each building was acquired through spatial join with land use data. The area of each building roof was obtained by calculating the area of the building roof patches. Both spatial join and area calculation could be realized in ArcGIS 10.2.

2.3.3. Suitability Evaluation

TOPSIS is a common multicriteria decision-making analysis method that can integrate multiple conflicting criteria into one evaluation score [71]. This method evaluates the suitability of each item by comparing its distance to the positive ideal solution (PIS) and the negative ideal solution (NIS). The TOPSIS method mainly includes the following steps:
(1)
Create criteria matrix X with m rows ( m indicates the number of building roofs) and n columns ( n indicates the number of criteria), where each element of the matrix X is x i , j , i = 1 , 2 , , m , j = 1 , 2 , , n . Weight vector { w 1 , w 2 , , w n } also be determined for n criteria.
(2)
Construct weight normalization matrix Z , where element
z i , j = x i , j i = 1 m x i , j 2 × w j
(3)
Divide n criteria into benefit criteria and cost criteria (all five non-decisive criteria in this paper are benefit criteria), and determine the PIS and NIS.
(4)
For each z i Z , calculate the Euclidean distance to PIS D i + and NIS D i and the final evaluation results E i , where z j + and z j represent the j-th criterion in the PIS and NIS, respectively:
D i + = j = 1 n ( z i , j z j + ) 2
D i = j = 1 n ( z i , j z j ) 2
E i = D i D i + + D i
In the TOPSIS method, the criteria weights are the only subjective input. To quantify the impact of this subjectivity, the following experiment conducted uncertainty and sensitivity analysis on the suitability evaluation results.

2.3.4. Uncertainty and Sensitivity Analysis

The uncertainty of the criteria weights can propagate to the final evaluation result through the TOPSIS method. In this part, MCS [43] was used to carry out the TOPSIS method multiple times to obtain multiple evaluation scores and finally to obtain the stable ranking results of roof greening suitability in the whole research area by voting. As the only subjective input in TOPSIS, the weight sampling method is very important. In this paper, the weight sampling method was Saltelli’s sampling scheme, which extends the Sobol sequence to reduce the error rate in the sensitivity index calculation [72,73]. The number of samples N generated in this experiment was set to 10,000, and the number of non-decisive criteria n was 5. According to this sampling method, a N ( n + 2 ) × n = 70000 × 5 mixed matrix was generated as the input of the MCS. MCS was performed 70,000 times, and 70,000 TOPSIS evaluation score maps were obtained. The MCS results were applied to perform uncertainty and sensitivity analysis. The Sobol method [74,75] is a global sensitivity analysis method that can quantify the impact of each criteria weight on the final suitability evaluation score. The results of Sobol sensitivity analysis include two indices: the first-order indices and the total-order index. The first-order indices are used to measure the influence of a single input variable on the output variance. The total-order index can measure the total contribution of an input variable to output variance, including the interaction with other variables.

3. Results

3.1. Building Roof Extraction

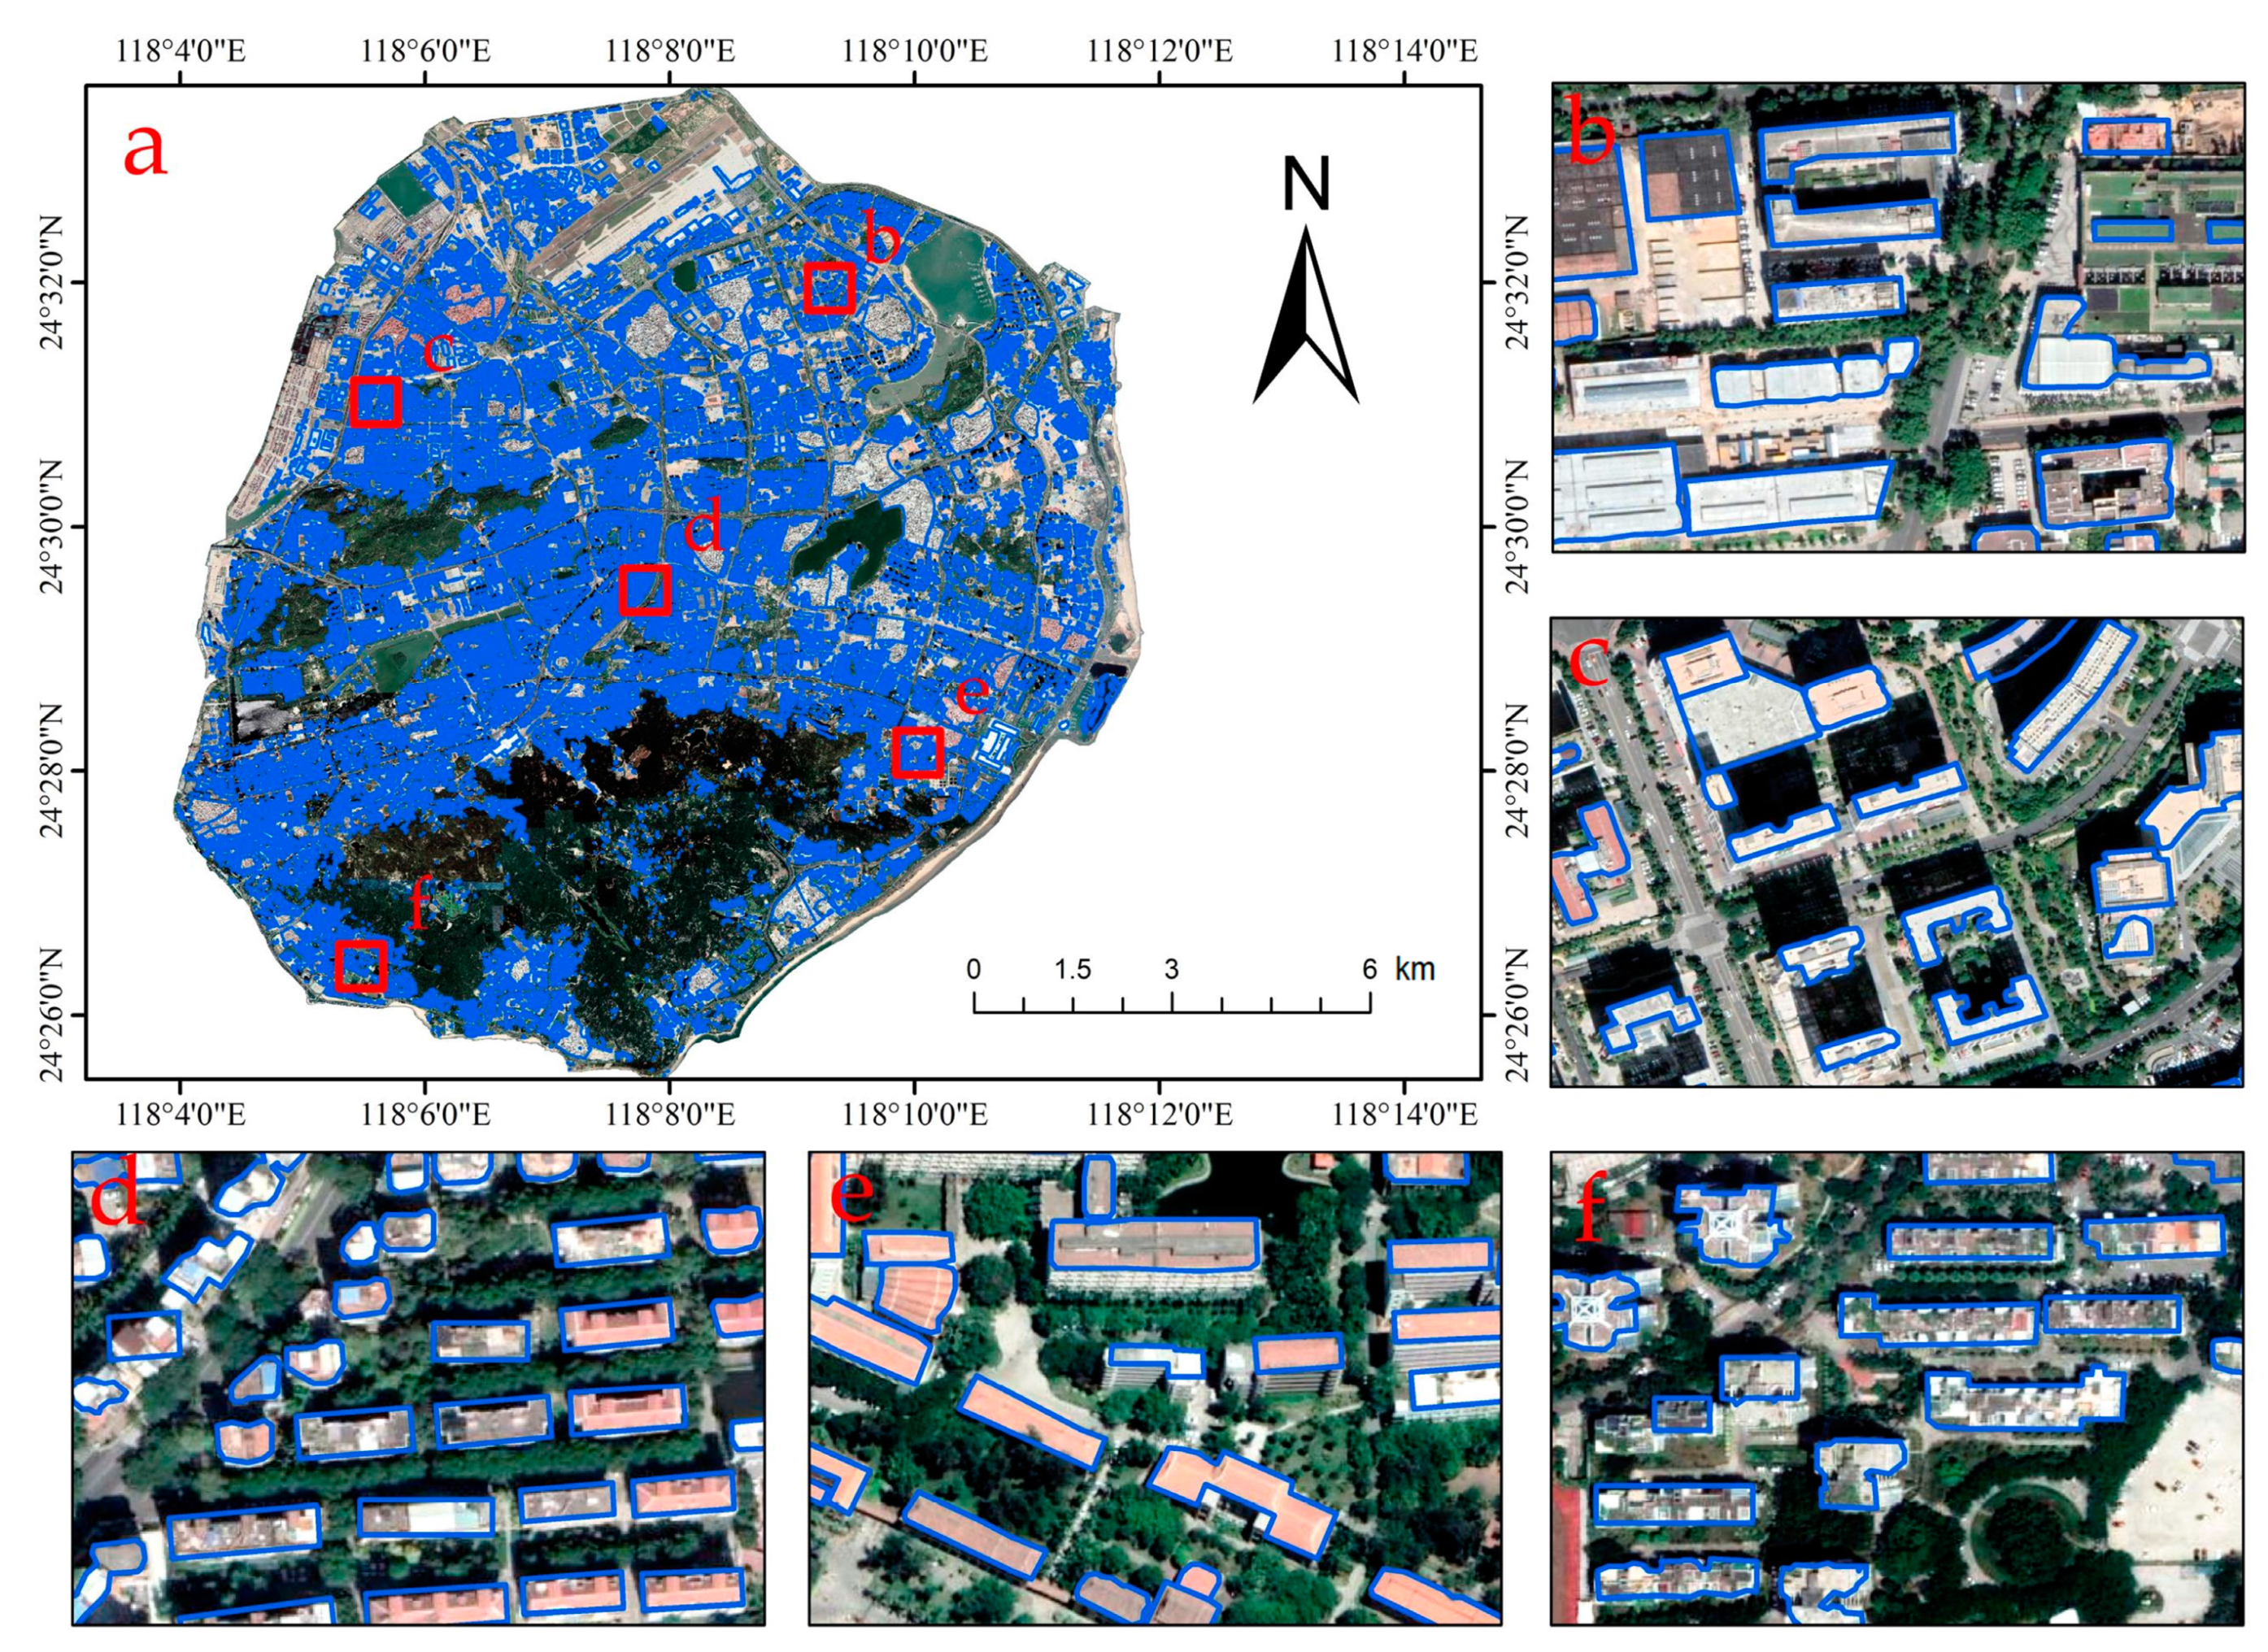
The results of roof extraction are shown in Figure 5. The five randomly selected small areas are shown in subfigures (b–f). The roofs of most buildings could be extracted accurately, which was the premise of subsequent experiments and analyses. To quantitatively reflect the effect of roof extraction, this paper used the intersection over union (IOU) and pixel accuracy (PA) based on a confusion matrix, which are commonly used indicators in computer vision tasks, to evaluate the accuracy of the roof extraction results based on deep learning. Specifically, the IOU was used to reflect the fitting degree between the extracted roof patches and the actual roof patches. The confusion matrix, IOU and PA are defined as follows (Table 1):
I O U = A B A B
P A = T P T P + F P
Five small areas of 400 × 400 size were randomly selected in the whole island for accuracy evaluation. The IOU of these test areas was 80.07%, and the PA was 92.95%. Accurate roof extraction was the basis of subsequent experiments. A few errors of roof extraction caused by shadow and poor image quality in some small areas were corrected manually.

3.2. Extraction Results of Decisive Suitability Criteria

The decisive criteria to be extracted mainly include the slope and material of the roof. The extraction results of the roof slope and material are shown in Figure 6. 2D data cannot accurately extract the accurate slope value of roofs, but they can be used to judge whether a roof is a flat roof or a pitched top through the semantic information of the image. In the whole island, about 5% of the building roofs were randomly selected to verify the results of the slope and material extraction. Compared with the true value obtained by visual interpretation, extraction results of roof slope and material showed good recognition effect. Finally, as some roof structures covered the original roofs, the misclassification caused by these roof coverings was eliminated by manual correction in the whole island. The roof slope and materials were the decisive criteria for roof greening. Good accuracy could ensure the accuracy of subsequent suitability judgment.

3.3. Calculation Results of Non-Decisive Suitability Criteria

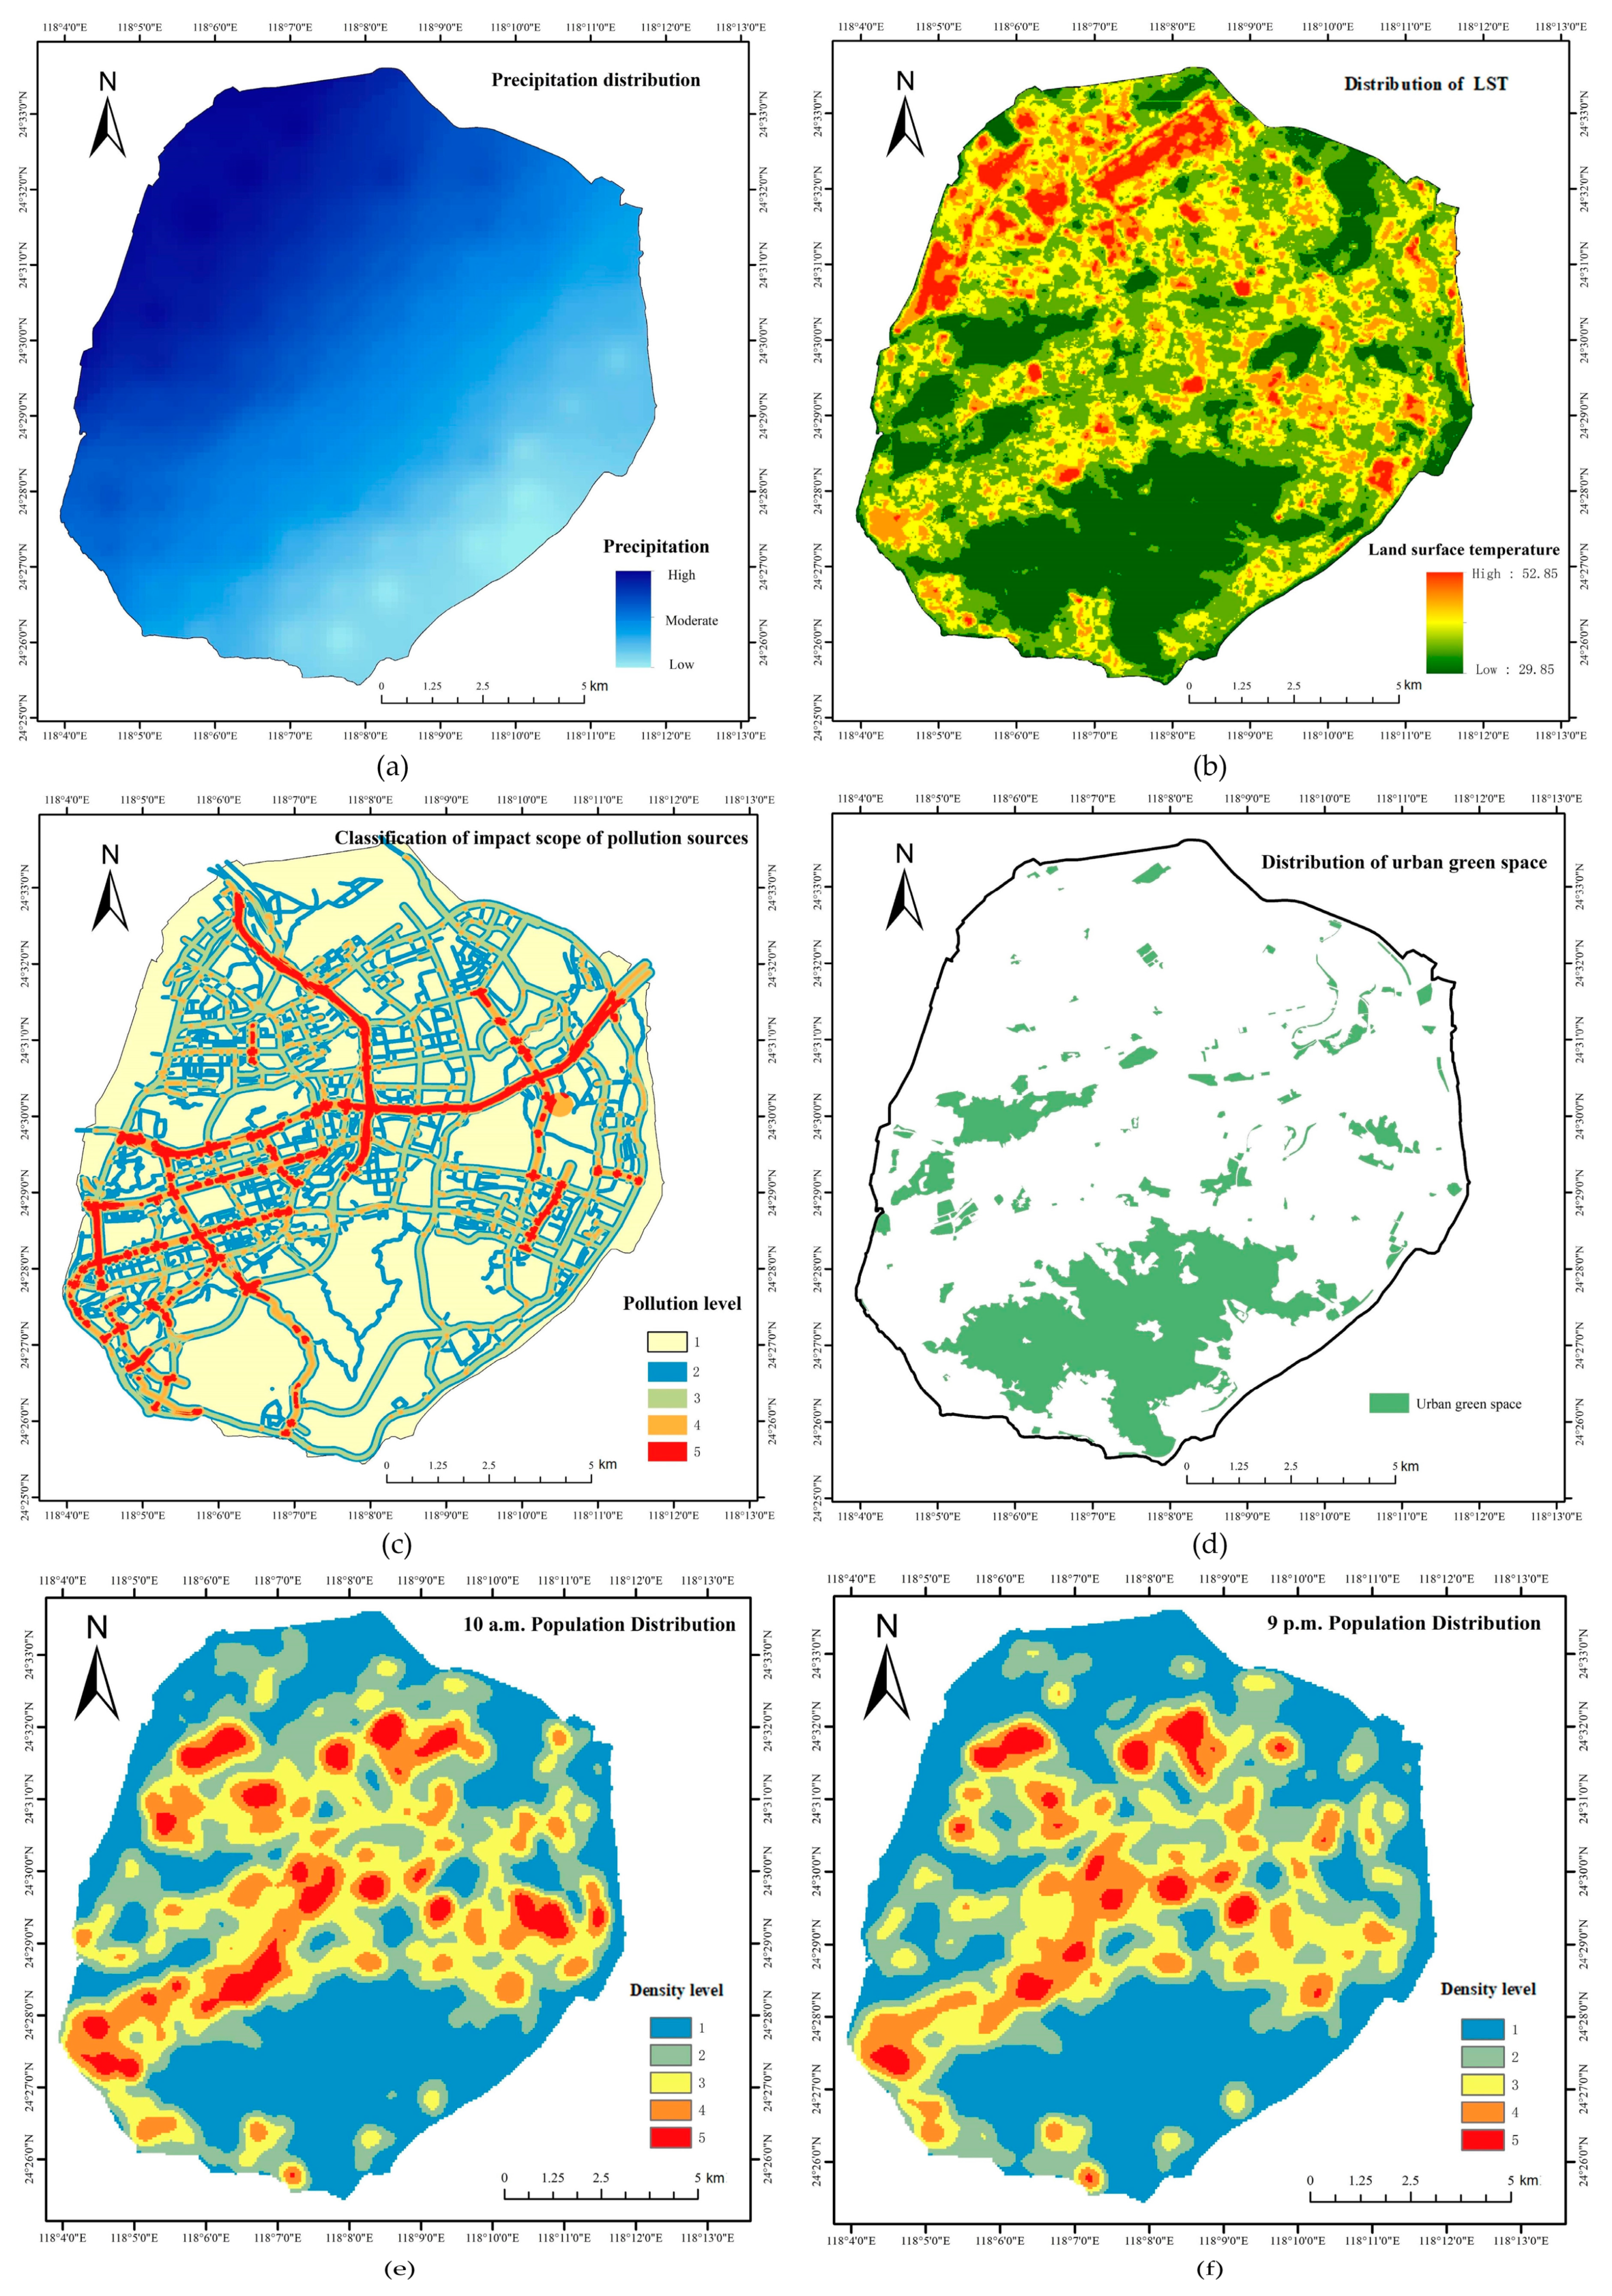
A total of 20,261 roofs were identified by deep learning (the buildings in the shantytown were not considered in this paper because they were too dense and in disrepair), of which 11,153 met the requirements of the decisive criteria for roof greening (a flat roof, cement material, the number of building floors being less than or equal to 12). The number of roofs suitable for roof greening accounts for 55.05% of the total number of roofs and 53.09% of the total roof area. Since municipal construction and retrofitting are usually carried out in batches based on the budget and benefits, the difference in the spatial distribution of the five non-decisive criteria leads to a roof greening suitability difference of 11,153 roofs that meet the conditions for roof greening. The calculation results of the five non-decisive criteria are shown in Figure 7.
The annual rainfall in the Xiamen area generally increases from southeast to northwest [76]. To quantitatively describe the distribution of precipitation, this paper interpolated the precipitation data for 2015. The results show that the annual average precipitation on Xiamen Island changes significantly, and the precipitation interpolation result is shown in Figure 7a.
The RS inversion results of the urban heat island effect are shown in Figure 7b. Overlay analysis of LST product and high-resolution Google image can reveal the heat island distribution characteristics of Xiamen Island. First, the surface temperature of the whole island ranges from 29.85 °C to 52.85 °C. Second, the heat island effect is more serious in the northern part than in the southern part. The surface temperature of the Dongping Mountains area in the south of the island is relatively low, and the heat island effect of Gaoqi Airport in the north of the island is more serious. Third, other areas with serious heat island effects include the wharfs in the northwest of the island, scattered shantytowns, industrial parks dominated by factory buildings and large-scale transportation hubs such as railway stations. The underlying surface of these places is usually a large area of buildings and a concrete or asphalt road, having a large material heat capacity and can store a large amount of solar radiation.
The distribution of urban air pollution is shown in Figure 7c. The distance from pollution sources directly affects the distribution of urban air pollution. A multilevel buffer zone was established, and the final air pollution level was reclassified into five levels based on the congestion conditions of urban roads and the location of the garbage incineration power plant. Air pollution is serious along Xianyue Road, Hubin Middle Road, Hubin North Road, Hubin South Road, Hubin West Road, Chenggong Avenue, Jinshan Road, Lianyue Road, and Lujiang Road and around the garbage incineration power plant.
The distribution of urban green space is shown in Figure 7d. Here, urban green space refers to green space that can provide people with leisure and recreation, mainly including park green space, production protection green space and scenic area green space in the city. Based on the green space distribution, the distance between each building and the nearest green space was calculated.
The population kernel density distribution mainly reflects population aggregation. The population distribution data of 10:00 a.m. and 9:00 p.m. on weekdays were collected in this experiment. The data of 10:00 a.m. were used to reflect the population aggregation of nonresidential areas, while the data of 9:00 p.m. were used to reflect the population aggregation of residential areas. In this experiment, first, the land use attributes of buildings were obtained based on the land use data and could be divided into nonresidential areas and residential areas. Then, the population density levels of buildings in nonresidential areas and residential areas were respectively spatially joined with the population density classification data of 10:00 a.m. and 9:00 p.m. Figure 7e,f show the population density distribution by day and night, respectively. Compared with the Internet map, the population density in the daytime and at night is significantly different in some industrial software parks and some commercial centers, such as the Xiamen Software Park in the east of Xiamen Island and the surrounding areas of the Fuxing International Center.

3.4. Suitability Evaluation and Sensitivity Analysis

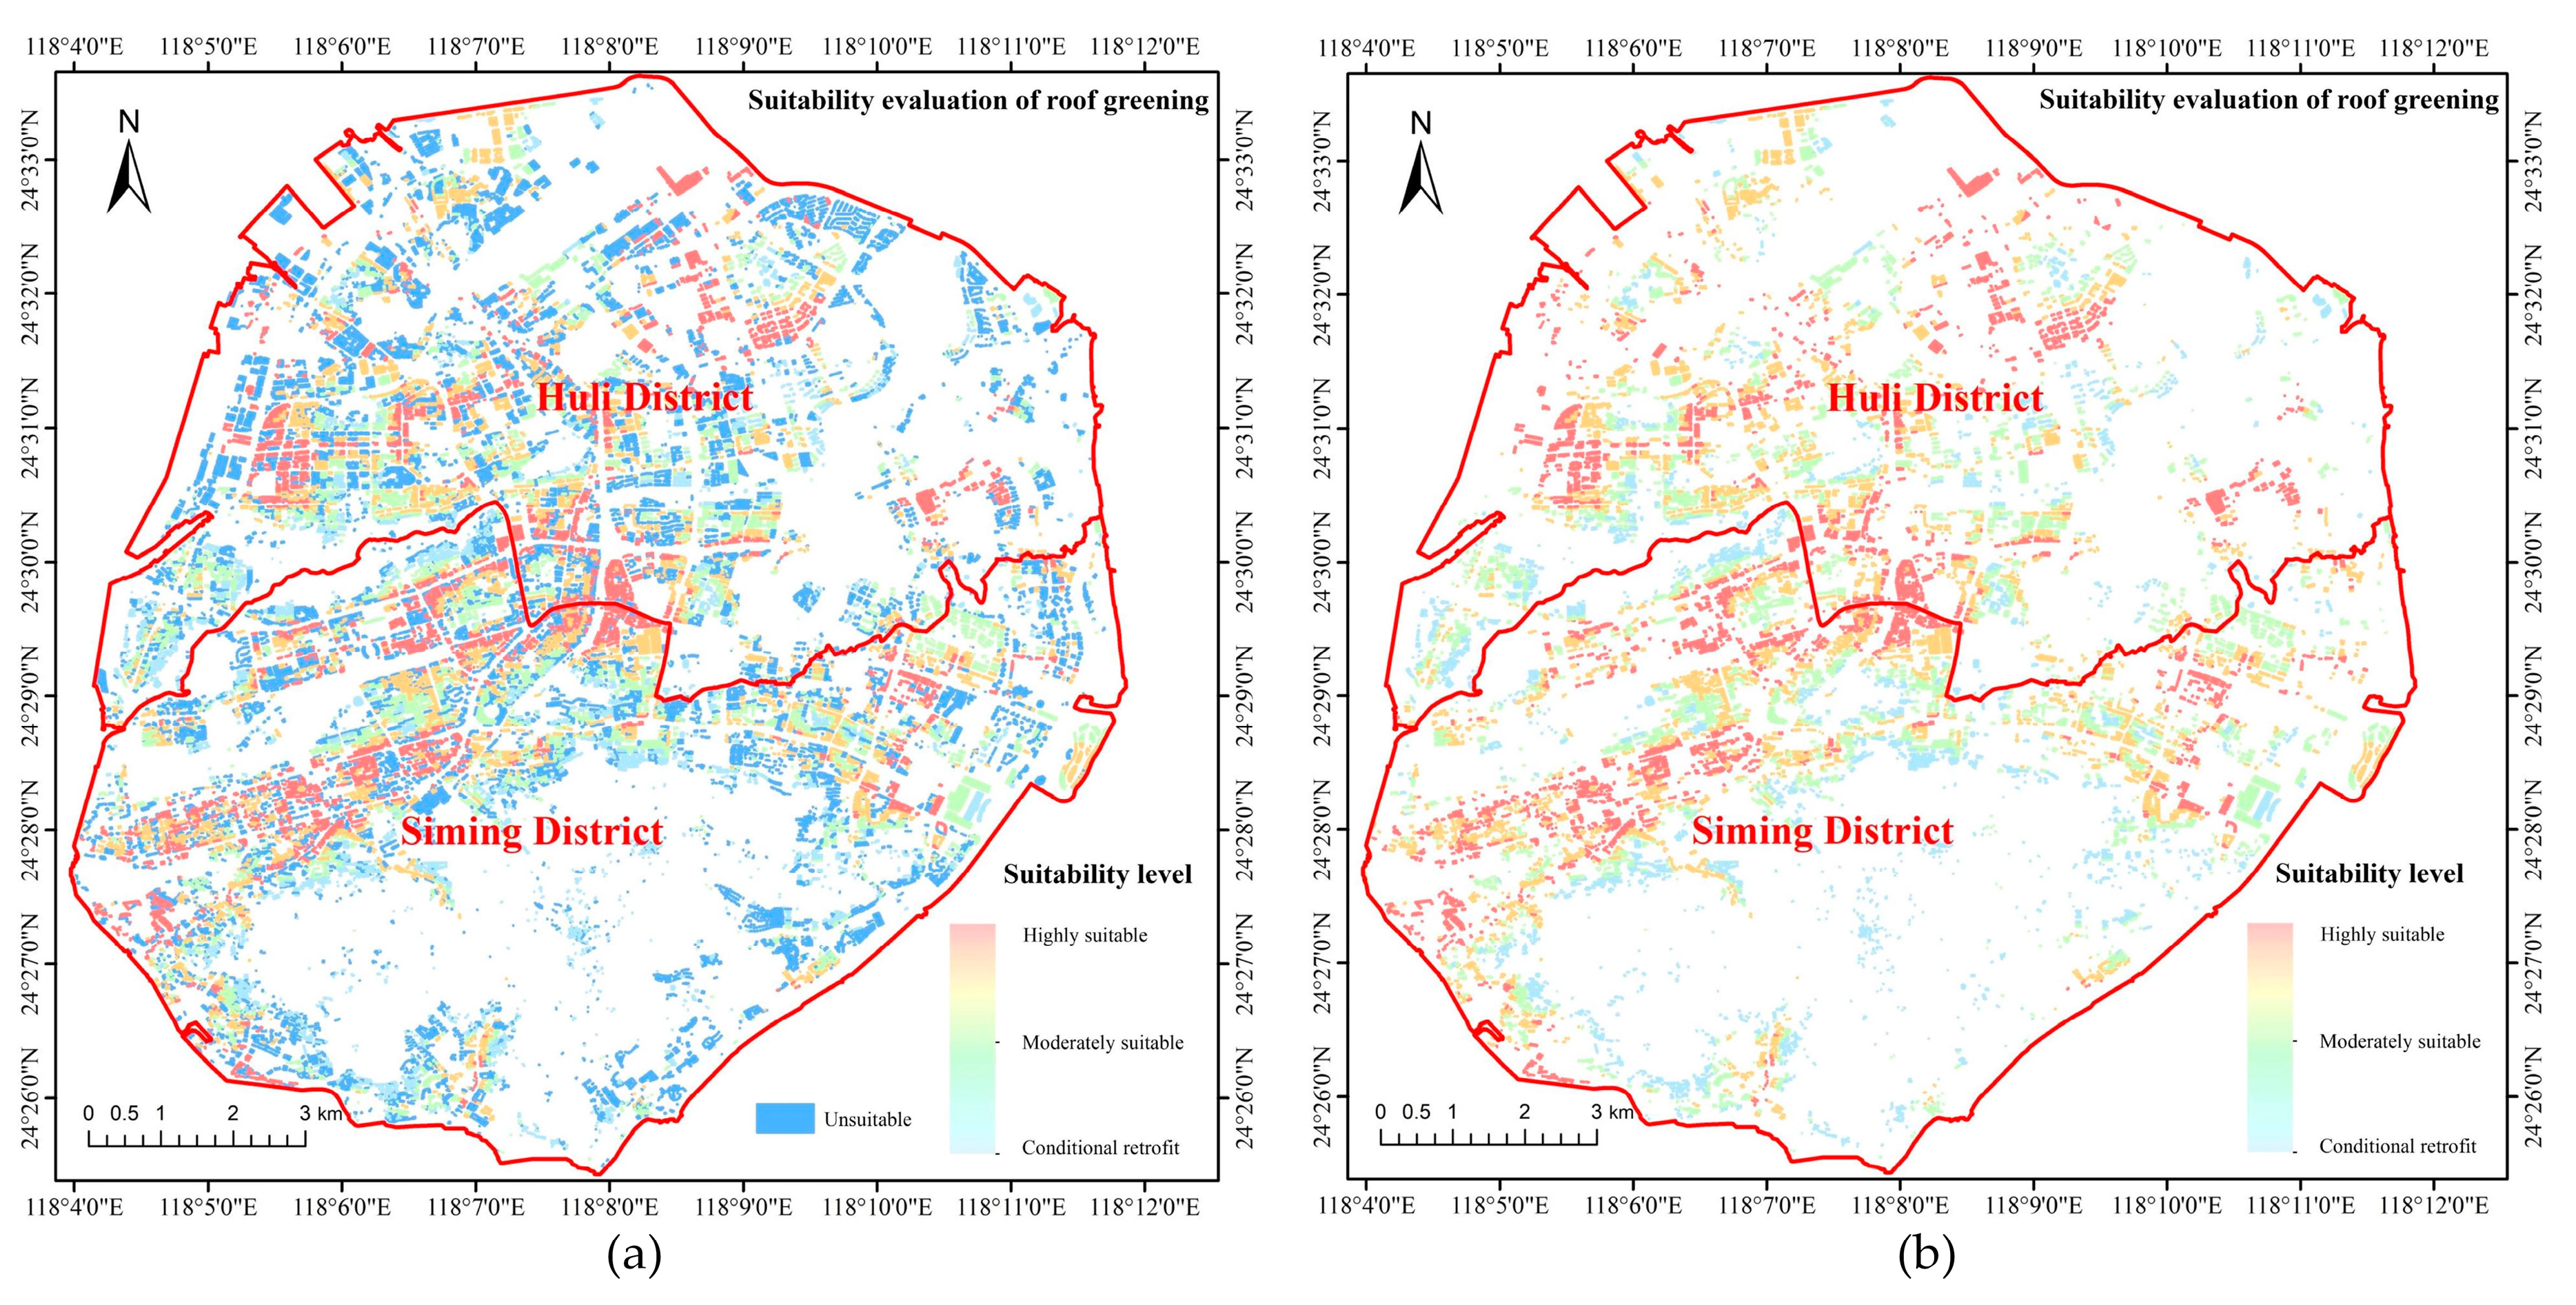
The overall evaluation results of 20,261 roofs are shown in Figure 8a. The evaluation results of 11,153 roofs meeting the decisive criteria are shown in Figure 8b. For each roof that met the decisive criteria, 70,000 MCSs generated 70,000 evaluation scores. For decision makers in urban planning, the relative ranking value of the roof greening suitability of buildings has more significant meaning than the absolute TOPSIS score. Therefore, the average ranking value of 70,000 sorting results of each roof in the experiment was the final suitability ranking value. In this way, the suitability degree of roof greening is quantitatively described, and its ranking value corresponds to the suitability degree of roof greening.
It can be seen from Figure 8b that the buildings with high roof greening suitability are mainly concentrated in the middle of Xiamen Island. Specifically, in Huli District, the following areas and their surroundings have higher roof greening suitability: Lianfa Huamei space, Luling primary school, Wanda Plaza, Huli high-tech industry garden. In Siming District, high suitability buildings are concentrated in south of Bailuzhou Park and near Longxiang road.
The Sobol sensitivity analysis results are shown in Figure 9a,b. The influence of the five non-decisive criteria weights on the final evaluation results is clear at a glance, and the results quantitatively represent the sensitivity of the variance of the evaluation results to the five weights.

4. Discussion

4.1. Criteria Extraction and Analysis

In this paper, the influence criteria of roof greening are divided into two categories: decisive criteria and non-decisive criteria. It is very important to select roofs that can be green retrofitted by decisive criteria before the suitability evaluation, which is the premise of the subsequent suitability evaluation. In the extraction of roof patches, slopes and materials, the selection of samples is very important and must cover the whole research area evenly and cover all kinds of roofs to the greatest extent possible to make the classifier more robust.
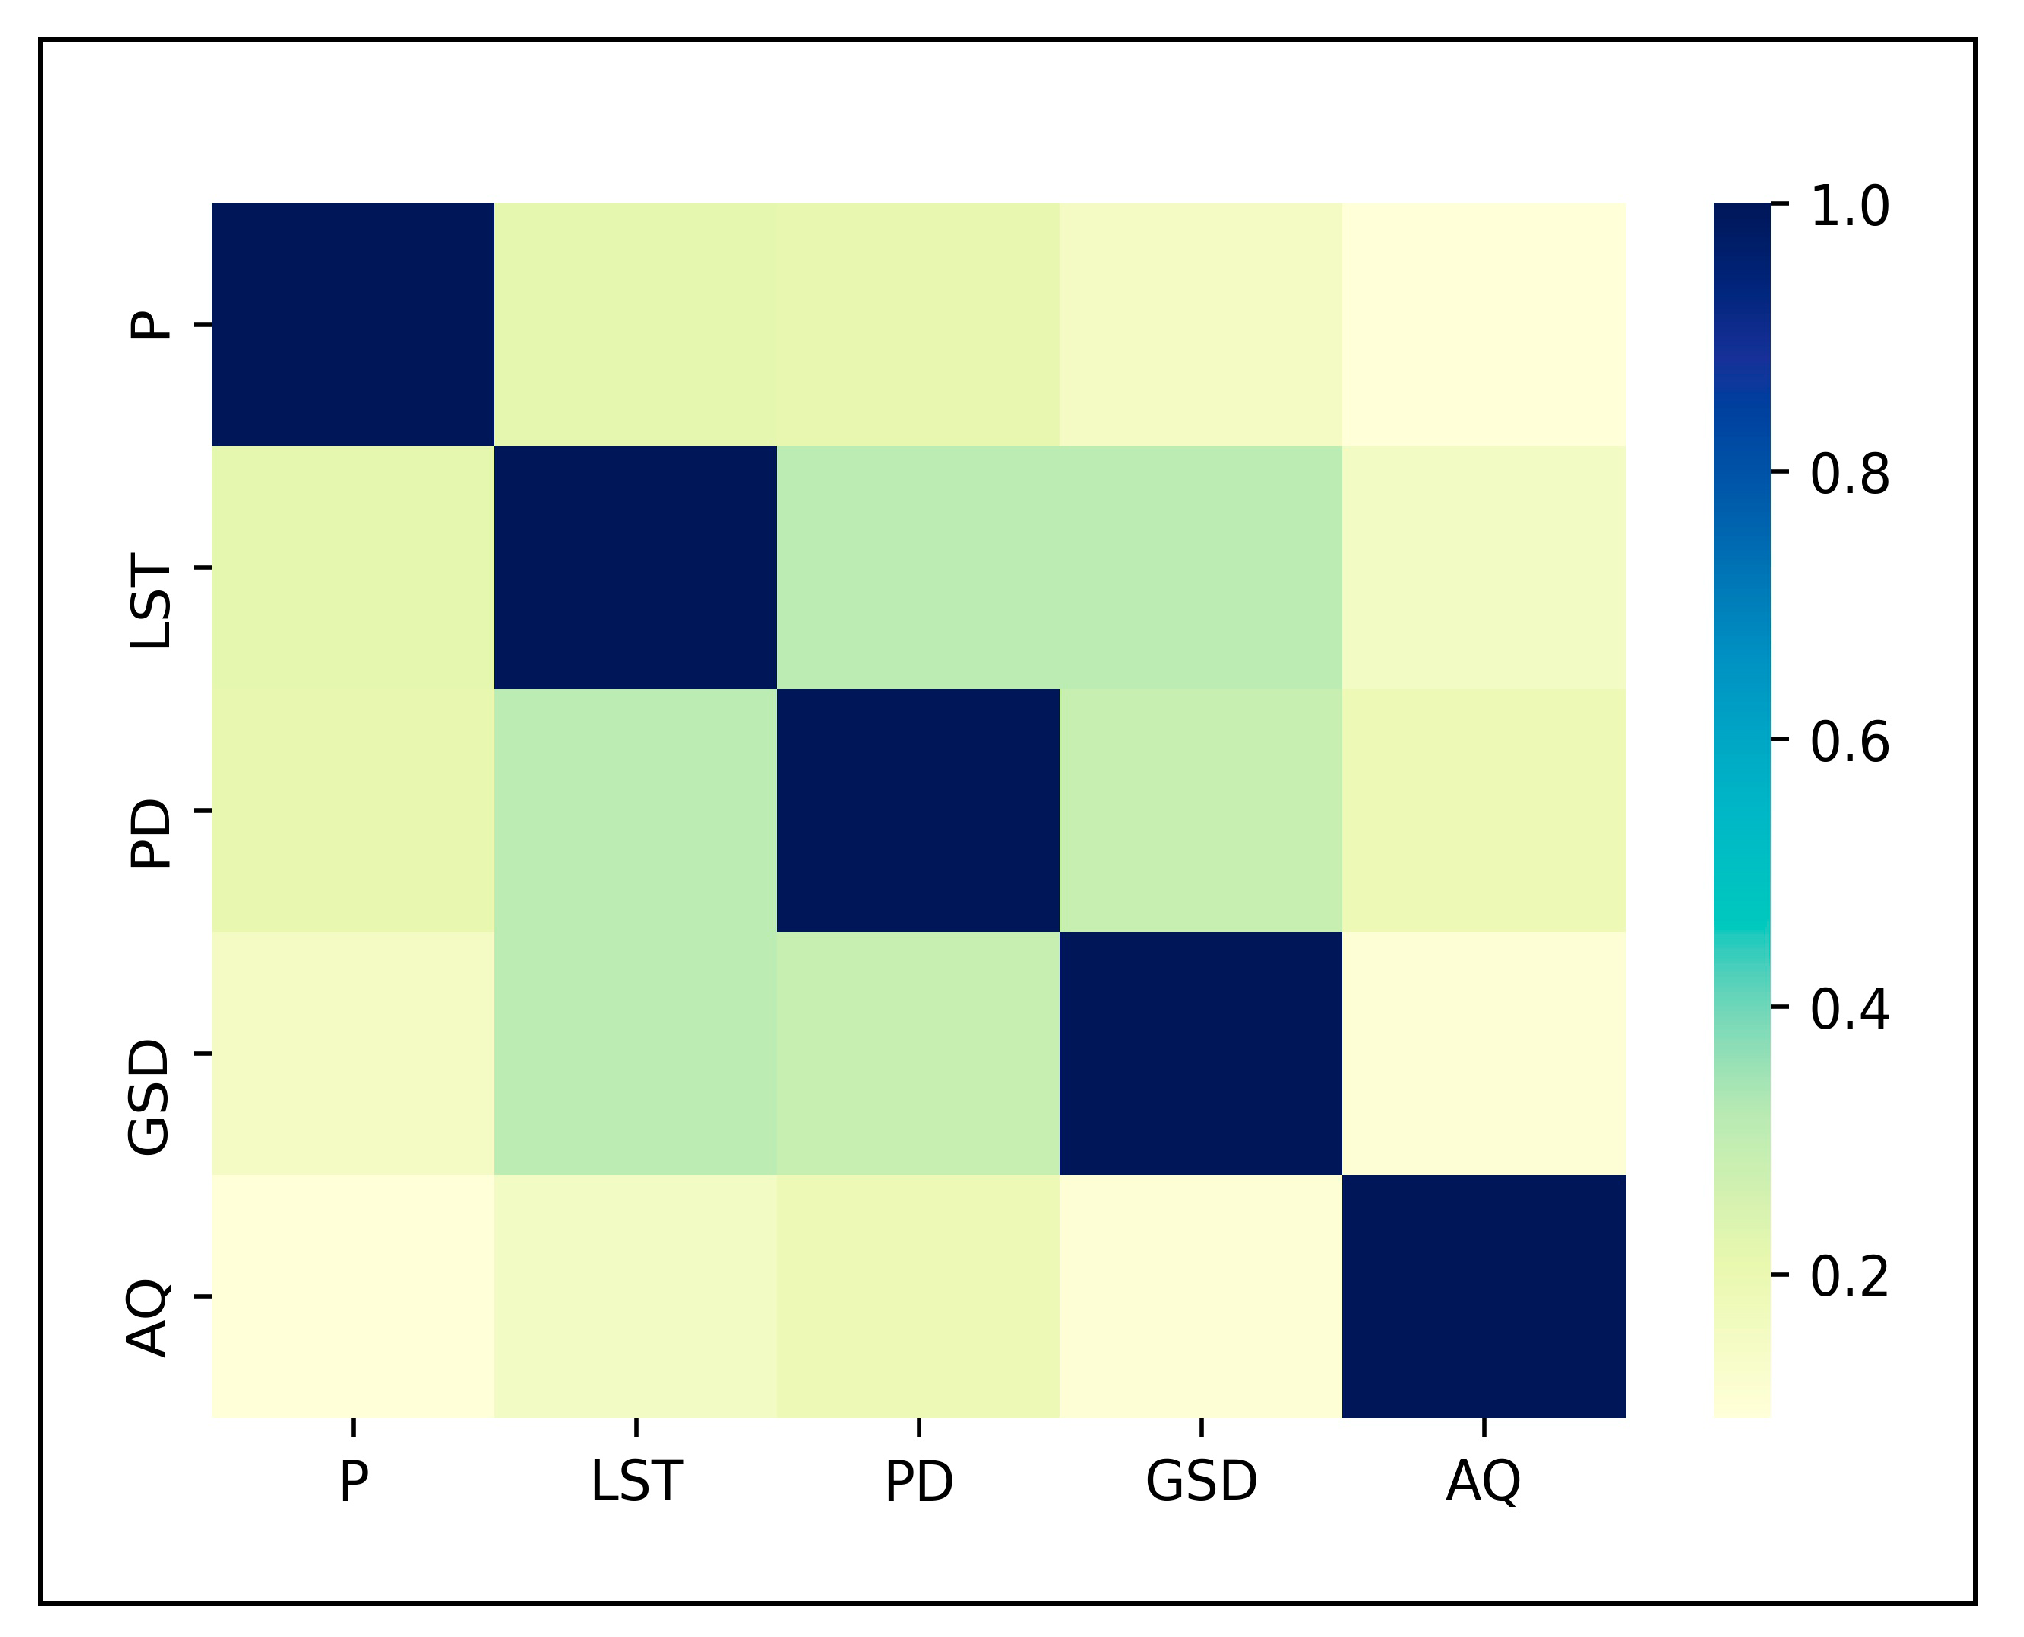
Five non-decisive criteria need to reflect the spatial difference of roof greening suitability of buildings from different aspects. If the correlations between the selected criteria is significant, it means that the criteria are not independent enough, which has an adverse impact on the subsequent sensitivity analysis. Therefore, the correlation analysis between the non-decisive criteria is indispensable. As shown in Figure 10, the absolute values of the correlations between the five non-decisive criteria are all lower than 0.5, which means no significant correlation. This shows that the five criteria are independent in spatial distribution.

4.2. Uncertainty and Sensitivity of the Evaluation Results

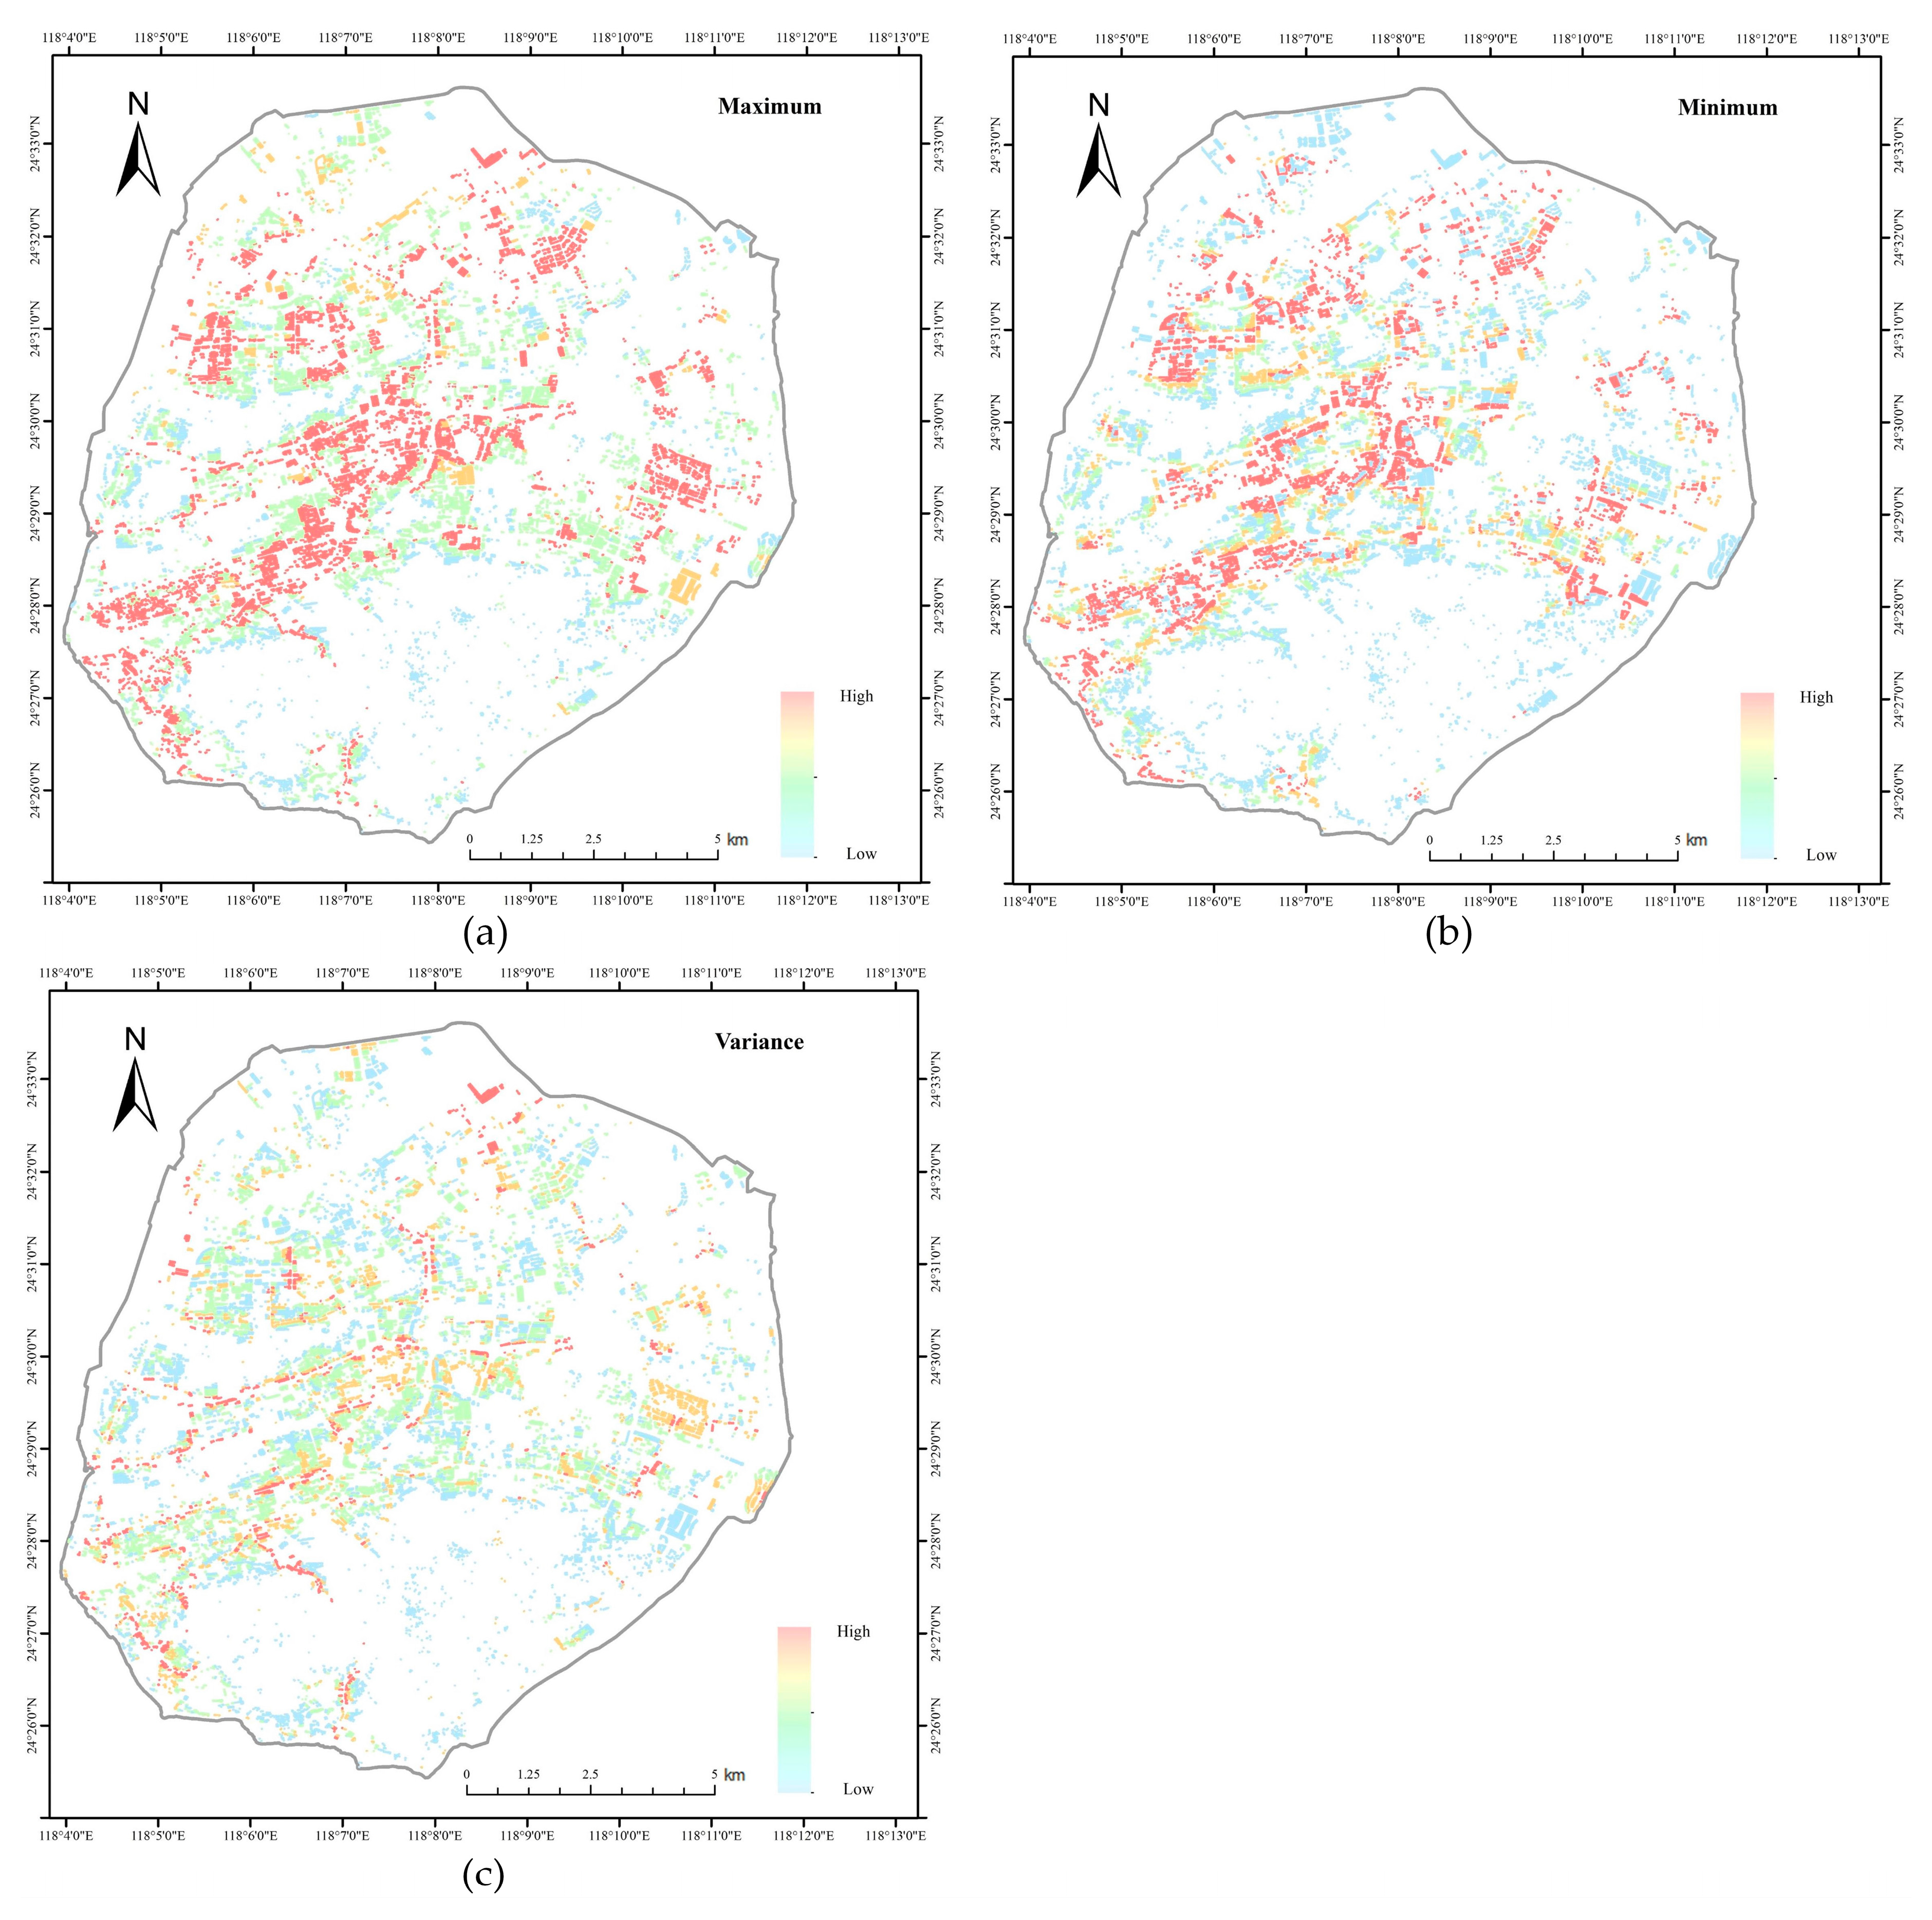
In the study area, 70,000 MCSs were carried out on all roofs that met the requirements of roof greening. In the 70,000 scores for each roof, the statistical indicators of these scores could be calculated. The maximum and minimum scores and the variance of each roof are shown in Figure 11a–c, respectively. In Figure 11a, low-value areas need to be noted because when the maximum value of 70,000 simulations of a building roof is small, this roof has consistently low-value scores. In contrast, in Figure 11b, when the minimum value is large, this roof has consistently high-value scores. The variance of the simulation scores is shown in Figure 11c. Comparing the three figures in Figure 11, we find that the maximum and minimum scores of roofs with small variance usually belong to the high-score part or the low-score part together. The large difference between the maximum and minimum values of a roof with large variance indicates that the score of the roof is uncertain.
The Sobol method [72,73] aims to conduct global sensitivity analysis within the framework of probability and to decompose the variance of the results into each input variable. This experiment decomposes the variance of the final evaluation scores of roof greening suitability to the weights of five non-decisive criteria. As shown in Figure 9a,b, both the first-order indices and the total-order index have a similar performance. The sensitivity of the final TOPSIS scores to the weights of the five criteria ranked in order from strong to weak is: green space distance, air quality, population density, land surface temperature, precipitation. The results of the sensitivity analysis also correspond to Figure 7a–f and Figure 8b. Clearly, In the roofs that meet the requirements of green roof retrofitting, the top ranked roofs show a significant positive correlation with the distribution of the air pollution level and population density and a significant negative correlation with the distance to urban green space. The results of the quantitative suitability evaluation indicate that each roof has a specific score and ranking value, which are the basis for urban planners to carry out roof greening retrofitting in batches. In addition, the sensitivity analysis of the evaluation results clearly suggests that planners should introduce more empirical knowledge to determine the weights of the criteria that are more sensitive. It should be noted that the results of sensitivity analysis are the relative sensitivity of five criteria in the current study area. In different research areas, researchers consider different impact criteria, and the spatial distributions of criteria data are also different, so the results of relative sensitivity analysis between criteria will be different. This is also in line with the idea that roof greening retrofit should adapt to local conditions.

4.3. Advantages of the Framework and Future Improvements

Compared with previous roof greening suitability evaluation methods, this framework is more comprehensive from building roof extraction to the final quantitative suitability evaluation process. Using state-of-the-art deep learning technology to extract roofs effectively reduces the workload of manual roof extraction in the past. At the same time, the previous methods usually stop at the subjective evaluation of suitability based on criteria. On the basis of criteria quantification, this paper goes further and achieves a quantification of the evaluation results and conducts a sensitivity analysis of the evaluation results.
Because of the limitations posed by the data sources, the roof slopes in this paper could be distinguished only as flat roofs or pitched roofs, and accurate values could not be obtained. In fact, some pitched roofs with small incline angles can also be used for roof greening retrofitting [23]. Obtaining accurate roof slope values in the future will depend on the use of high precision LiDAR data [23] or oblique photogrammetry [77,78] modeling technology.

4.4. The Influence of Buildings’ Property Rights on the Implementation of Roof Greening

In practical work, roof greening often meets implementation difficulty because of the buildings’ purposes and property rights [79]. Buildings with different property rights have different priorities for roof greening retrofit. Priority order 1, the public or municipal administration buildings, whose property owners are the government, should be given retrofit priority, because these buildings do not involve too much interest disputes. Priority order 2, the buildings for industries, businesses, and offices are usually owned by some companies or enterprises. For the roof greening retrofit of this type of buildings, the government can give appropriate policy subsidies. Priority order 3, other types of buildings including residences. These buildings belong to individuals or groups. The government needs to strengthen the publicity of roof greening to increase the awareness and enthusiasm of citizens to retrofit the roofs.
As the property information of the buildings are kept confidential and unavailable, we only provide an idea for the implementation to comprehensively use the property right information and the roof greening suitability evaluation results mentioned above. Firstly, according to the property rights, the buildings are divided into different roof greening priority categories. Secondly, in each category, considering the suitability evaluation result (Figure 8a), after excluding the buildings that are not suitable for roof greening, constructors can implement roof retrofit in a certain proportion based on the rank of roof greening suitability.

5. Conclusions

This paper presented a quantitative and reusable evaluation framework for roof greening suitability evaluation. Divided into three parts, namely, building roof extraction, criteria calculation, and suitability evaluation and sensitivity analysis, this framework formed a complete process from the extraction of roof patches to the final analysis of the evaluation results. In the study area of Xiamen Island, the evaluation scores of each roof were calculated by MCSs and the TOPSIS method based on multisource spatial data such as RS data (HSR optical data, land satellite thermal infrared data), Internet location data (thermal map for population density), meteorological data, and urban road traffic data. These multisource data comprehensively described the influencing factors of the differences in roof greening suitability. A total of 70,000 MCS scores helped to select stable, highly suitable building roofs by voting and finally obtained the suitability ranking of all building roofs on Xiamen Island. Subsequently, the Sobol method was used to perform a sensitivity analysis of the MCS results. The experimental results showed that the changes in weight of the three criteria, namely, the distance to green spaces, population density, and the air pollution level, had a relatively greater impact on the final evaluation results. In the future, to obtain more stable evaluation results, more expert knowledge is further required to carefully determine the weights, especially the three weights with relatively greater impact. In conclusion, the framework proposed in this paper can quickly evaluate roof greening suitability in a large-scale area. The main contributions are as follows: (1) Using deep learning technology to extract roof patches accurately and quickly, which avoids the problem of mismatch of the building footprints and the RS image; (2) On the basis of quantitative expression of influencing criteria, TOPSIS and MCS are used to get the accurate score and ranking of roof greening suitability; (3) Further analyses of the uncertainty and sensitivity of the evaluation results are helpful to find stable highly appropriate buildings for roof greening retrofit and find criteria with relatively greater weight impact. The evaluation results of the building roofs in the whole area are ranked and can be used by the relevant government departments and urban designers to carry out reasonable roof greening planning and implementation based on the budget.

Author Contributions

Conceptualization, N.X. and J.L.; Data curation, S.W. and H.L.; Formal analysis, N.X.; Funding acquisition, J.L. and J.Z.; Investigation, N.X.; Methodology, N.X. and J.D.; Project administration, J.L. and J.Z.; Resources, J.L. and J.Z.; Supervision, J.L. and J.Z.; Validation, N.X.; Visualization, N.X.; Writing—original draft, N.X.; Writing—review & editing, X.H. and T.W. All authors have read and agreed to the published version of the manuscript.

Funding

This research was funded by the National Natural Science Foundation of China (Grant No. 41631179) and the National Key Research and Development Program of China (2016YFC0502903).

Acknowledgments

We are grateful to the Xiamen Municipal Natural Resources and Planning Bureau for providing us with valuable data, and we sincerely thank the academic editors and anonymous reviewers for kind suggestions and valuable comments.

Conflicts of Interest

The authors declare no conflict of interest.

References

  1. Stovin, V.; Vesuviano, G.; Kasmin, H. The hydrological performance of a green roof test bed under UK climatic conditions. J. Hydrol. 2012, 414, 148–161. [Google Scholar] [CrossRef]
  2. Bengtsson, L. Peak flows from thin sedum-moss roof. Hydrol. Res. 2005, 36, 269–280. [Google Scholar] [CrossRef]
  3. VanWoert, N.D.; Rowe, D.B.; Andresen, J.A.; Rugh, C.L.; Fernandez, R.T.; Xiao, L. Green roof stormwater retention: Effects of roof surface, slope, and media depth. J. Environ. Qual. 2005, 34, 1036–1044. [Google Scholar] [CrossRef]
  4. Tan, C.L.; Wong, N.H.; Tan, P.Y.; Jusuf, S.K.; Chiam, Z.Q. Impact of plant evapotranspiration rate and shrub albedo on temperature reduction in the tropical outdoor environment. Build. Environ. 2015, 94, 206–217. [Google Scholar] [CrossRef]
  5. Susca, T.; Gaffin, S.R.; Dell’Osso, G.R. Positive effects of vegetation: Urban heat island and green roofs. Environ. Pollut. 2011, 159, 2119–2126. [Google Scholar] [CrossRef]
  6. Cascone, S.; Coma, J.; Gagliano, A.; Pérez, G. The evapotranspiration process in green roofs: A review. Build. Environ. 2019, 147, 337–355. [Google Scholar] [CrossRef]
  7. Santamouris, M. Cooling the cities–a review of reflective and green roof mitigation technologies to fight heat island and improve comfort in urban environments. Sol. Energy 2014, 103, 682–703. [Google Scholar] [CrossRef]
  8. Zhang, G.; He, B.-J.; Zhu, Z.; Dewancker, B.J. Impact of morphological characteristics of green roofs on pedestrian cooling in subtropical climates. Int. J. Environ. Res. Public Health 2019, 16, 179. [Google Scholar] [CrossRef] [Green Version]
  9. Sharma, A.; Conry, P.; Fernando, H.; Hamlet, A.F.; Hellmann, J.; Chen, F. Green and cool roofs to mitigate urban heat island effects in the Chicago metropolitan area: Evaluation with a regional climate model. Environ. Res. Lett. 2016, 11, 064004. [Google Scholar] [CrossRef]
  10. Cook-Patton, S.C.; Bauerle, T.L. Potential benefits of plant diversity on vegetated roofs: A literature review. J. Environ. Manag. 2012, 106, 85–92. [Google Scholar] [CrossRef]
  11. Connelly, M.; Hodgson, M. Experimental investigation of the sound transmission of vegetated roofs. Appl. Acoust. 2013, 74, 1136–1143. [Google Scholar] [CrossRef]
  12. Yang, H.S.; Kang, J.; Choi, M.S. Acoustic effects of green roof systems on a low-profiled structure at street level. Build. Environ. 2012, 50, 44–55. [Google Scholar] [CrossRef]
  13. Hashemi, S.S.G.; Mahmud, H.B.; Ashraf, M.A. Performance of green roofs with respect to water quality and reduction of energy consumption in tropics: A review. Renew. Sustain. Energy Rev. 2015, 52, 669–679. [Google Scholar] [CrossRef]
  14. Tsang, S.; Jim, C.Y. Game-theory approach for resident coalitions to allocate green-roof benefits. Environ. Plan. A 2011, 43, 363–377. [Google Scholar] [CrossRef]
  15. Yan, B. The Research of Ecological and Economic Benefits for Green Roof. In Proceedings of the Applied Mechanics and Materials; Trans Tech Publications: Zurich, Switzerland, 2011; pp. 2763–2766. [Google Scholar]
  16. Wong, N.H.; Chen, Y.; Ong, C.L.; Sia, A. Investigation of thermal benefits of rooftop garden in the tropical environment. Build. Environ. 2003, 38, 261–270. [Google Scholar] [CrossRef]
  17. Getter, K.L.; Rowe, D.B.; Andresen, J.A.; Wichman, I.S. Seasonal heat flux properties of an extensive green roof in a Midwestern US climate. Energy Build. 2011, 43, 3548–3557. [Google Scholar] [CrossRef]
  18. Castleton, H.F.; Stovin, V.; Sbm, B.; Davison, J.B. Green roofs; building energy savings and the potential for retrofit. Energy Build. 2010, 42, 1582–1591. [Google Scholar] [CrossRef]
  19. Whittinghill, L.J.; Rowe, D.B.; Cregg, B.M. Evaluation of vegetable production on extensive green roofs. Agroecol. Sustain. Food Syst. 2013, 37, 465–484. [Google Scholar] [CrossRef]
  20. Francis, R.A.; Lorimer, J. Urban reconciliation ecology: The potential of living roofs and walls. J. Environ. Manag. 2011, 92, 1429–1437. [Google Scholar] [CrossRef]
  21. Jungels, J.; Rakow, D.A.; Allred, S.B.; Skelly, S.M. Attitudes and aesthetic reactions toward green roofs in the Northeastern United States. Landsc. Urban Plan. 2013, 117, 13–21. [Google Scholar] [CrossRef]
  22. Wong, J.K.W.; Lau, L.S.-K. From the ‘urban heat island’to the ‘green island’? A preliminary investigation into the potential of retrofitting green roofs in Mongkok district of Hong Kong. Habitat Int. 2013, 39, 25–35. [Google Scholar] [CrossRef]
  23. Santos, T.; Tenedório, J.; Gonçalves, J. Quantifying the city’s green area potential gain using remote sensing data. Sustainability 2016, 8, 1247. [Google Scholar] [CrossRef] [Green Version]
  24. Grunwald, L.; Heusinger, J.; Weber, S. A GIS-based mapping methodology of urban green roof ecosystem services applied to a Central European city. Urban For. Urban Green. 2017, 22, 54–63. [Google Scholar] [CrossRef]
  25. Patino, J.E.; Duque, J.C. A review of regional science applications of satellite remote sensing in urban settings. Comput. Environ. Urban Syst. 2013, 37, 1–17. [Google Scholar] [CrossRef]
  26. Nielsen, M.M. Remote sensing for urban planning and management: The use of window-independent context segmentation to extract urban features in Stockholm. Comput. Environ. Urban Syst. 2015, 52, 1–9. [Google Scholar] [CrossRef]
  27. Liu, H.; Luo, J.; Huang, B.; Hu, X.; Sun, Y.; Yang, Y.; Xu, N.; Zhou, N. DE-Net: Deep Encoding Network for Building Extraction from High-Resolution Remote Sensing Imagery. Remote Sens. 2019, 11, 2380. [Google Scholar] [CrossRef] [Green Version]
  28. Lu, T.; Ming, D.; Lin, X.; Hong, Z.; Bai, X.; Fang, J. Detecting building edges from high spatial resolution remote sensing imagery using richer convolution features network. Remote Sens. 2018, 10, 1496. [Google Scholar] [CrossRef] [Green Version]
  29. Wu, G.; Guo, Z.; Shi, X.; Chen, Q.; Xu, Y.; Shibasaki, R.; Shao, X. A boundary regulated network for accurate roof segmentation and outline extraction. Remote Sens. 2018, 10, 1195. [Google Scholar] [CrossRef] [Green Version]
  30. Zhang, Z.; Wang, Y. JointNet: A common neural network for road and building extraction. Remote Sens. 2019, 11, 696. [Google Scholar] [CrossRef] [Green Version]
  31. Krizhevsky, A.; Sutskever, I.; Hinton, G.E. Imagenet Classification with Deep Convolutional Neural Networks. In Proceedings of the NIPS, Lake Tahoe, CA, USA, 3–6 December 2012; pp. 1097–1105. [Google Scholar]
  32. Simonyan, K.; Zisserman, A. Very deep convolutional networks for large-scale image recognition. arXiv 2015, arXiv:1409.1556. [Google Scholar]
  33. Szegedy, C.; Liu, W.; Jia, Y.; Sermanet, P.; Reed, S.; Anguelov, D.; Erhan, D.; Vanhoucke, V.; Rabinovich, A. Going Deeper with Convolutions. In Proceedings of the IEEE Conference on Computer Vision and Pattern Recognition, Boston, MA, USA, 7–12 June 2015; pp. 1–9. [Google Scholar]
  34. Szegedy, C.; Vanhoucke, V.; Ioffe, S.; Shlens, J.; Wojna, Z. Rethinking the Inception Architecture for Computer Vision. In Proceedings of the IEEE Conference on Computer Vision and Pattern Recognition, Las Vegas, NV, USA, 26 June–1 July 2016; pp. 2818–2826. [Google Scholar]
  35. He, K.; Zhang, X.; Ren, S.; Sun, J. Deep Residual Learning for Image Recognition. In Proceedings of the IEEE Conference on Computer Vision and Pattern Recognition, Las Vegas, NV, USA, 26 June–1 July 2016; pp. 770–778. [Google Scholar]
  36. Long, J.; Shelhamer, E.; Darrell, T. Fully Convolutional Networks for Semantic Segmentation. In Proceedings of the IEEE Conference on Computer Vision and Pattern Recognition, Boston, MA, USA, 7–12 June 2015; pp. 3431–3440. [Google Scholar]
  37. Badrinarayanan, V.; Kendall, A.; Cipolla, R. Segnet: A deep convolutional encoder-decoder architecture for image segmentation. IEEE Trans. Pattern Anal. Mach. Intell. 2017, 39, 2481–2495. [Google Scholar] [CrossRef] [PubMed]
  38. Ronneberger, O.; Fischer, P.; Brox, T. U-net: Convolutional Networks for Biomedical Image Segmentation. In Proceedings of the International Conference on Medical Image Computing and Computer-Assisted Intervention; Springer: Munich, Germany, 2015; pp. 234–241. [Google Scholar]
  39. Xu, Y.; Wu, L.; Xie, Z.; Chen, Z. Building extraction in very high resolution remote sensing imagery using deep learning and guided filters. Remote Sens. Environ. 2018, 10, 144. [Google Scholar] [CrossRef] [Green Version]
  40. Zhong, Z.; Li, J.; Cui, W.; Jiang, H. Fully Convolutional Networks for Building and Road Extraction: Preliminary Results. In Proceedings of the 2016 IEEE International Geoscience and Remote Sensing Symposium (IGARSS), Beijing, China, 10–15 July 2016; pp. 1591–1594. [Google Scholar]
  41. Zhou, L.; Zhang, C.; Wu, M. D-LinkNet: LinkNet with Pretrained Encoder and Dilated Convolution for High Resolution Satellite Imagery Road Extraction. In Proceedings of the IEEE Conference on Computer Vision and Pattern Recognition (CVPR) Workshops, Salt Lake City, UT, USA, 18–22 June 2018; pp. 182–186. [Google Scholar]
  42. Hwang, C.-L.; Yoon, K. Methods for Multiple Attribute Decision Making. In Multiple Attribute Decision Making; Springer: Berlin/Heidelberg, Germany, 1981; pp. 58–191. [Google Scholar]
  43. Mooney, C.Z. Monte Carlo Simulation; Sage Publications: Thousand Oaks, CA, USA, 1997; Volume 116. [Google Scholar]
  44. Pham, H.M.; Yamaguchi, Y.; Bui, T.Q. A case study on the relation between city planning and urban growth using remote sensing and spatial metrics. Landsc. Urban Plan. 2011, 100, 223–230. [Google Scholar] [CrossRef]
  45. Abedi, M.; Norouzi, G.-H. A general framework of TOPSIS method for integration of airborne geophysics, satellite imagery, geochemical and geological data. Int. J. Appl. Earth Obs. Geoinf. 2016, 46, 31–44. [Google Scholar] [CrossRef]
  46. Mukherjee, A.B.; Krishna, A.P.; Patel, N. Application of Remote Sensing Technology, GIS and AHP-TOPSIS Model to Quantify Urban Landscape Vulnerability to Land Use Transformation. In Information and Communication Technology for Sustainable Development; Springer: Singapore, 2018; pp. 31–40. [Google Scholar]
  47. Xiamen Transportation Big Data Report (In Chinese). 2018. Available online: http://www.rmjtxw.com/news/dsj/71673.html (accessed on 15 August 2019).
  48. Baidu Map Intelligent Transportation (In Chinese). Available online: http://jiaotong.baidu.com/predict?citycode=194 (accessed on 15 August 2019).
  49. Circular of Xiamen Environmental Protection Bureau on Printing and Distributing the List of Key Pollutant Discharge Enterprises of Xiamen in 2018 (In Chinese). Available online: http://sthjj.xm.gov.cn/zwgk/hjjgxxgk/jbxx/201805/t20180518_1879247.htm (accessed on 15 August 2019).
  50. Resource and Environment Data Cloud Platform, Spatial Interpolation Data Set of Annual Precipitation in China Since 1980 (In Chinese). Available online: http://www.resdc.cn/data.aspx?DATAID=229 (accessed on 15 August 2019).
  51. Romero, A.; Gatta, C.; Camps-Valls, G. Unsupervised deep feature extraction for remote sensing image classification. IEEE Trans. Geosci. Remote Sens. 2015, 54, 1349–1362. [Google Scholar] [CrossRef] [Green Version]
  52. Liu, Z.; Wang, J.; Liu, W. Building Extraction from High Resolution Imagery Based on Multi-Scale Object Oriented Classification and Probabilistic Hough Transform. In Proceedings of the IEEE International Geoscience and Remote Sensing Symposium, Seoul, Korea, 25–29 July 2005; pp. 2250–2253. [Google Scholar]
  53. Jiang, N.; Zhang, J.; Li, H.; Lin, X. Semi-Automatic Building Extraction from High Resolution Imagery Based on Segmentation. In Proceedings of the International Workshop on Earth Observation and Remote Sensing Applications, EORSA 2008, Beijing, China, 30 June–1 July 2008; pp. 1–5. [Google Scholar]
  54. Jia, X.; Richards, J.A. Efficient maximum likelihood classification for imaging spectrometer data sets. IEEE Trans. Geosci. Remote Sens. 1994, 32, 274–281. [Google Scholar]
  55. Otukei, J.R.; Blaschke, T. Land cover change assessment using decision trees, support vector machines and maximum likelihood classification algorithms. Int. J. Appl. Earth Obs. Geoinf. 2010, 12, S27–S31. [Google Scholar] [CrossRef]
  56. Kong, Y.-F.; Tong, W.-W. Spatial exploration and interpolation of the surface precipitation data. Geogr. Res. 2008, 27, 1097–1108. [Google Scholar]
  57. Yue, T.; Wang, Y.; Chen, S.; Liu, J.; Qiu, D.; Deng, X.; Liu, M.; Tian, Y. Numerical simulation of population distribution in China. Popul. Environ. 2003, 25, 141–163. [Google Scholar] [CrossRef] [Green Version]
  58. Balk, D.L.; Deichmann, U.; Yetman, G.; Pozzi, F.; Hay, S.I.; Nelson, A. Determining global population distribution: Methods, applications and data. Adv. Parasitol. 2006, 62, 119–156. [Google Scholar]
  59. Goodchild, M.F.; Anselin, L.; Deichmann, U. A framework for the areal interpolation of socioeconomic data. Environ. Plan. A 1993, 25, 383–397. [Google Scholar] [CrossRef]
  60. Martin, D. Mapping population data from zone centroid locations. Trans. Inst. Br. Geogr. 1989, 14, 90–97. [Google Scholar] [CrossRef]
  61. Bracken, I.; Martin, D. The generation of spatial population distributions from census centroid data. Environ. Plan. A 1989, 21, 537–543. [Google Scholar] [CrossRef]
  62. Eicher, C.L.; Brewer, C.A. Dasymetric mapping and areal interpolation: Implementation and evaluation. Cartogr. Geogr. Inf. Sci. 2001, 28, 125–138. [Google Scholar] [CrossRef]
  63. Li, J.; Song, C.; Cao, L.; Zhu, F.; Meng, X.; Wu, J. Impacts of landscape structure on surface urban heat islands: A case study of Shanghai, China. Remote Sens. Environ. 2011, 115, 3249–3263. [Google Scholar] [CrossRef]
  64. Shafique, M.; Kim, R.; Rafiq, M. Green roof benefits, opportunities and challenges—A review. Renew. Sustain. Energy Rev. 2018, 90, 757–773. [Google Scholar] [CrossRef]
  65. Du, C.; Ren, H.; Qin, Q.; Meng, J.; Zhao, S. A practical split-window algorithm for estimating land surface temperature from Landsat 8 data. Remote Sens. 2015, 7, 647–665. [Google Scholar] [CrossRef] [Green Version]
  66. Ren, H.; Du, C.; Liu, R.; Qin, Q.; Yan, G.; Li, Z.L.; Meng, J. Atmospheric water vapor retrieval from Landsat 8 thermal infrared images. J. Geophys. Res. Atmos. 2015, 120, 1723–1738. [Google Scholar] [CrossRef]
  67. Janhäll, S. Review on urban vegetation and particle air pollution–Deposition and dispersion. Atmos. Environ. 2015, 105, 130–137. [Google Scholar] [CrossRef]
  68. Speak, A.; Rothwell, J.; Lindley, S.; Smith, C. Urban particulate pollution reduction by four species of green roof vegetation in a UK city. Atmos. Environ. 2012, 61, 283–293. [Google Scholar] [CrossRef]
  69. Von Bismarck-Osten, C.; Birmili, W.; Ketzel, M.; Massling, A.; Petäjä, T.; Weber, S. Characterization of parameters influencing the spatio-temporal variability of urban particle number size distributions in four European cities. Atmos. Environ. 2013, 77, 415–429. [Google Scholar] [CrossRef]
  70. Weber, S.; Kordowski, K.; Kuttler, W. Variability of particle number concentration and particle size dynamics in an urban street canyon under different meteorological conditions. Sci. Total Environ. 2013, 449, 102–114. [Google Scholar] [CrossRef]
  71. Zhang, Y.; Li, Q.; Wang, H.; Du, X.; Huang, H. Community scale livability evaluation integrating remote sensing, surface observation and geospatial big data. Int. J. Appl. Earth Obs. Geoinf. 2019, 80, 173–186. [Google Scholar] [CrossRef]
  72. Sobol, I.M. Global sensitivity indices for nonlinear mathematical models and their Monte Carlo estimates. Math. Comput. Simul. 2001, 55, 271–280. [Google Scholar] [CrossRef]
  73. Saltelli, A.; Ratto, M.; Andres, T.; Campolongo, F.; Cariboni, J.; Gatelli, D.; Saisana, M.; Tarantola, S. Global Sensitivity Analysis: The Primer; John Wiley & Sons: Hoboken, NJ, USA, 2008. [Google Scholar]
  74. Saltelli, A. Making best use of model evaluations to compute sensitivity indices. Comput. Phys. Commun. 2002, 145, 280–297. [Google Scholar] [CrossRef]
  75. Saltelli, A.; Annoni, P.; Azzini, I.; Campolongo, F.; Ratto, M.; Tarantola, S. Variance based sensitivity analysis of model output. Design and estimator for the total sensitivity index. Comput. Phys. Commun. 2010, 181, 259–270. [Google Scholar] [CrossRef]
  76. Wang, X.; Yin, L.; Wu, L. Analysis of Heavy Rainfall in Xiamen City (In Chinese). In Proceedings of the 34th Annual Meeting of the Chinese Meteorological Society S8 Observation Promotes the Development of Urban Meteorology—Proceedings of the Sixth Urban Meteorological Forum, Zhengzhou, Henan, China, 27–29 September 2017. [Google Scholar]
  77. Yalcin, G.; Selcuk, O. 3D City Modelling with Oblique Photogrammetry Method. Procedia Technol. 2015, 19, 424–431. [Google Scholar] [CrossRef] [Green Version]
  78. Toschi, I.; Ramos, M.; Nocerino, E.; Menna, F.; Remondino, F.; Moe, K.; Poli, D.; Legat, K.; Fassi, F. Oblique photogrammetry supporting 3D urban reconstruction of complex scenarios. Int. Arch. Photogramm. Remote Sens. Spatial Inf. Sci. 2017, 519–526. [Google Scholar] [CrossRef] [Green Version]
  79. Hong, W.; Guo, R.; Tang, H. Potential assessment and implementation strategy for roof greening in highly urbanized areas: A case study in Shenzhen, China. Cities 2019, 95, 102468. [Google Scholar] [CrossRef]
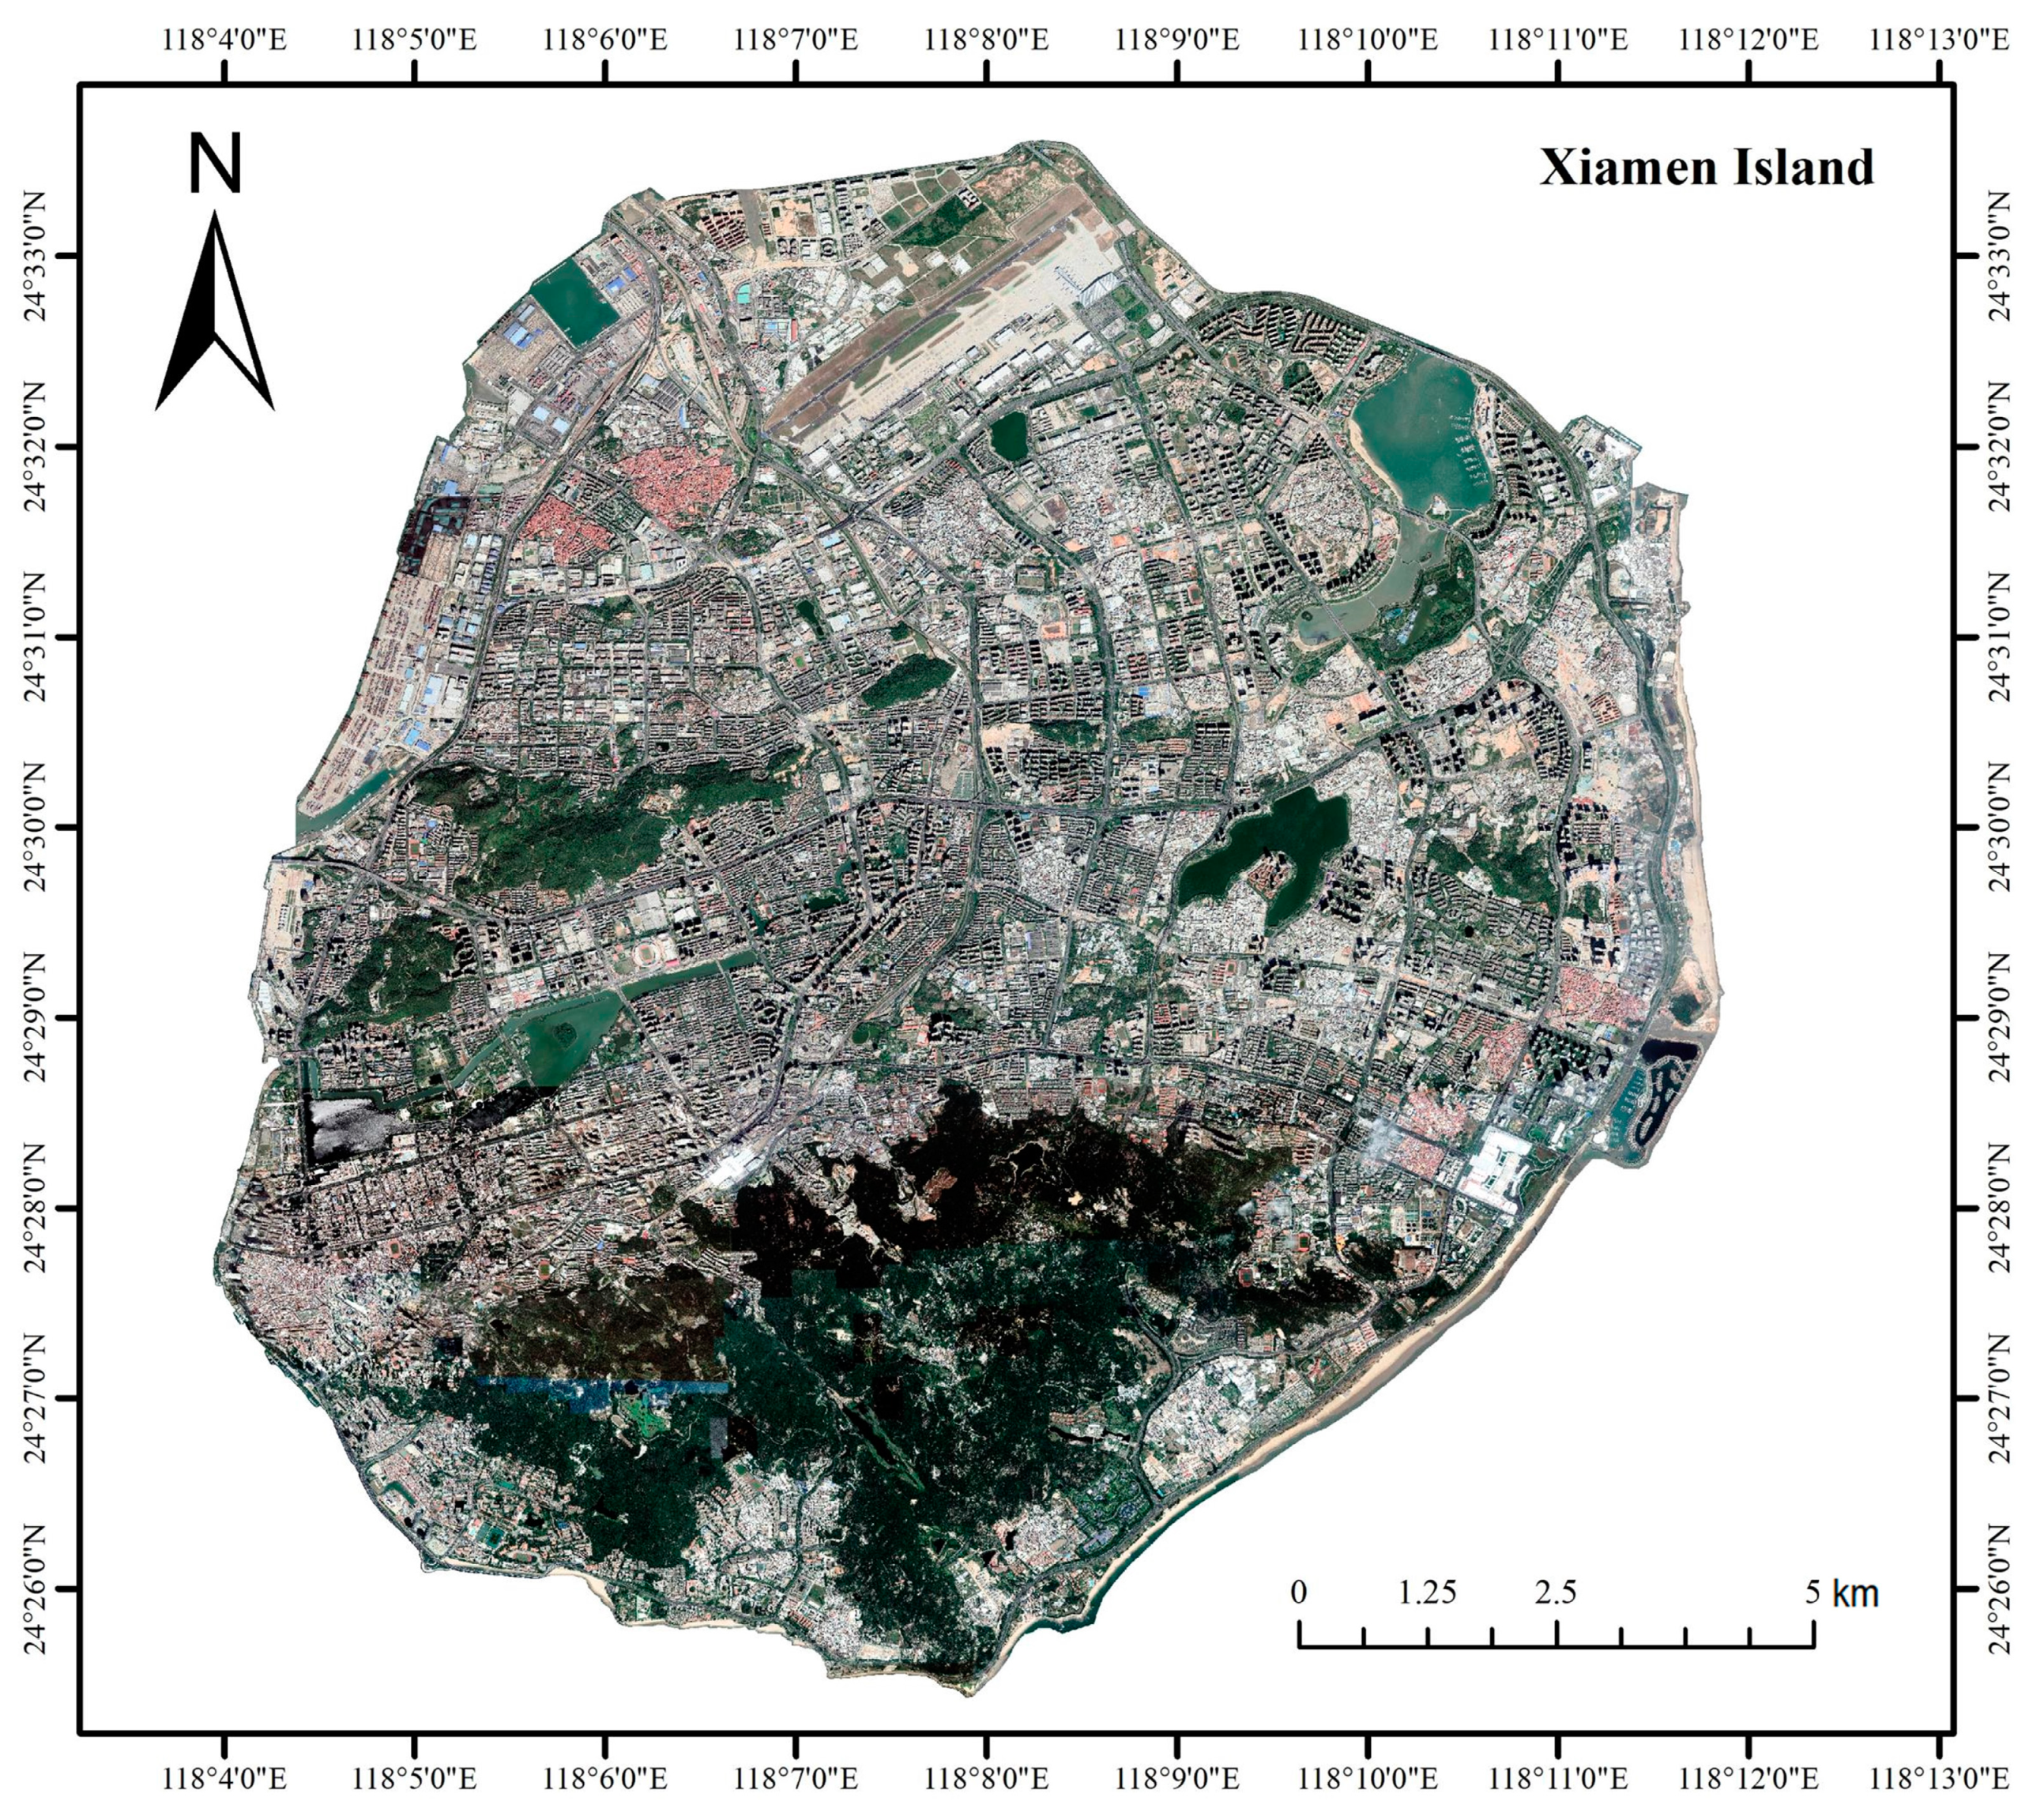
Figure 1. The research area of Xiamen Island.
Sustainability 12 04375 g001
Figure 2. The methodological framework of roof greening suitability evaluation.
Sustainability 12 04375 g002
Figure 3. Example of building samples.
Sustainability 12 04375 g003
Figure 4. A sketch map of the slope of a roof; (a) pitched roof and (b) flat roof.
Sustainability 12 04375 g004
Figure 5. Building roof extraction results.
Sustainability 12 04375 g005
Figure 6. Roof slope and material extraction results: (a) results of building roof extraction on Xiamen Island; (b) and (c) original image and roof slope recognition results of corresponding subarea 1; (d) and (e) original image and roof material recognition results of corresponding subarea 2.
Sustainability 12 04375 g006
Figure 7. The spatial distribution of 5 non-decisive criteria of suitability in the study area: (a) the distribution of precipitation in the whole island; (b) the surface temperature distribution obtained by RS thermal infrared band temperature inversion; (c) the classification of the impact scope of air pollution sources. Levels 1–5 mean different severity degree of air pollution. The larger the number is, the more serious the air pollution is; (d) the spatial distribution of urban green space; (e) the classification of the population density distribution at 10 a.m. on weekdays. Levels 1–5 mean the classification of population density. The larger the number is, the denser the population is; and (f) the classification of the population density distribution at 9:00 p.m. on weekdays.
Sustainability 12 04375 g007
Figure 8. Suitability evaluation of roof greening on Xiamen Island: (a) including roofs that do not meet the requirements of roof greening; (b) including only the roofs that meet the requirements of roof greening.
Sustainability 12 04375 g008
Figure 9. Sensitivity analysis of suitability evaluation: (a) first-order indices; (b) total-order index.
Sustainability 12 04375 g009
Figure 10. Correlation analysis of 5 non-decisive criteria: P, LST, PD, GSD and AQ are abbreviations of precipitation, land surface temperature, population density, green space distance and air quality respectively.
Sustainability 12 04375 g010
Figure 11. Statistics of suitability evaluation scores in 70,000 MCSs: (a) the maximum value; (b) the minimum value; and (c) variance.
Sustainability 12 04375 g011
Table 1. Confusion matrix.
Actual PositiveActual Negative
Predicted positivetrue positive (TP)false positive (FP)
Predicted negativefalse negative (FN)true negative (TN)