1. Introduction
South Africa is located in a predominantly semi-arid part of the world with an average rainfall of approximately 450 mm yr
−1, well below the world average of 860 mm yr
−1. Water resources are already fully (and in some cases over) allocated in a number of catchments in South Africa, and intensive utilization has also led to water quality issues [
1,
2]. Irrigated agriculture is the largest water user in South Africa, accounting for more than 60% of available water use nationally [
3]. Further deterioration is expected due to a growing population and urbanization [
2], climate change [
4], and poorly maintained, deteriorating wastewater treatment infrastructure [
5]. Increasing water scarcity in South Africa requires optimal management of this resource [
6]. Eutrophication is the process of nutrient enrichment and the associated excessive algal growth in water, and is recognized as a major threat to water security in South Africa [
7,
8] and globally [
9,
10,
11,
12] in areas with intensive agriculture. One of the major drivers of eutrophication is phosphorus (P) originating from both point and nonpoint sources [
10,
13] as it is most often the limiting nutrient in freshwater systems [
14]. Addressing this critical issue requires urgent and sustained management action based on sound information. A study by Matthews and Bernard [
15] used satellite remote sensing to assess the trophic status of 50 of South Africa′s largest water bodies, and results showed that the majority are impacted by eutrophication, with 62% even being hypertrophic and all of these having cyanobacterial blooms.
Point sources of P originate primarily from industrial discharges and wastewater treatment works (WWTW). One of the most common nonpoint sources (NPS) of P pollution is from agricultural runoff [
16]. Over-application of nitrogen (N) and P in intensive agricultural areas throughout the developed world has led to excessive accumulations of these nutrients in soil, groundwater, and surface water [
17]. Lake Erie, the fourth largest of the five Great Lakes in the US, is increasingly threatened by eutrophication [
18]. The Upper and Lower Mississippi River Valleys and Central Valley in California have been impacted by agricultural NPS pollution [
11]. Water quality deterioration in the Miyun Reservoir in China is largely attributed to agricultural NPS pollution [
19]. Pastoral agriculture in New Zealand, dairy farming in particular, has intensified in recent decades and is a major contributor to water quality deterioration caused by eutrophication [
20]. Many coastal and marine waters are increasingly showing symptoms of eutrophication, primarily caused by nutrient inputs and hypoxia (depleted levels of oxygen) [
21]. Excess nutrients in the Great Barrier Reef (GBR) has emanated mainly from agriculture [
22], with agro-chemicals, including pesticides, draining into the GBR lagoon and contributing to poor water quality [
23]. Phosphorus pollution resulting in eutrophication is also an issue in the Baltic Sea, Gulf of Mexico, China′s Chanjiang Estuary [
10], and the South China Sea [
24]. Although estuarine and marine ecosystems are also affected, freshwater systems are particularly vulnerable because they are so widely utilized [
12]. The contribution of agriculture to eutrophication does not only stem from current farming practices, but also from previous management strategies directed at production goals rather than environmental protection [
12].
Nitrogen (N) plays a major role in planktonic bloom and toxicity and also needs to be considered when developing an adaptable response to eutrophication [
18]. The main pollutant in the GBR, for example, is dissolved inorganic N [
25], and hypoxia in the northern Gulf of Mexico is attributed primarily to N from the Mississippi-Atchafalaya River Basin [
22]. Elevated N levels in water are also a threat to human and animal health, and emissions of greenhouse gases (GHGs) are enhanced by the availability of dissolved nutrients, specifically N [
26]. Another challenge created by N pollution is terrestrial and aquatic acidification [
27].
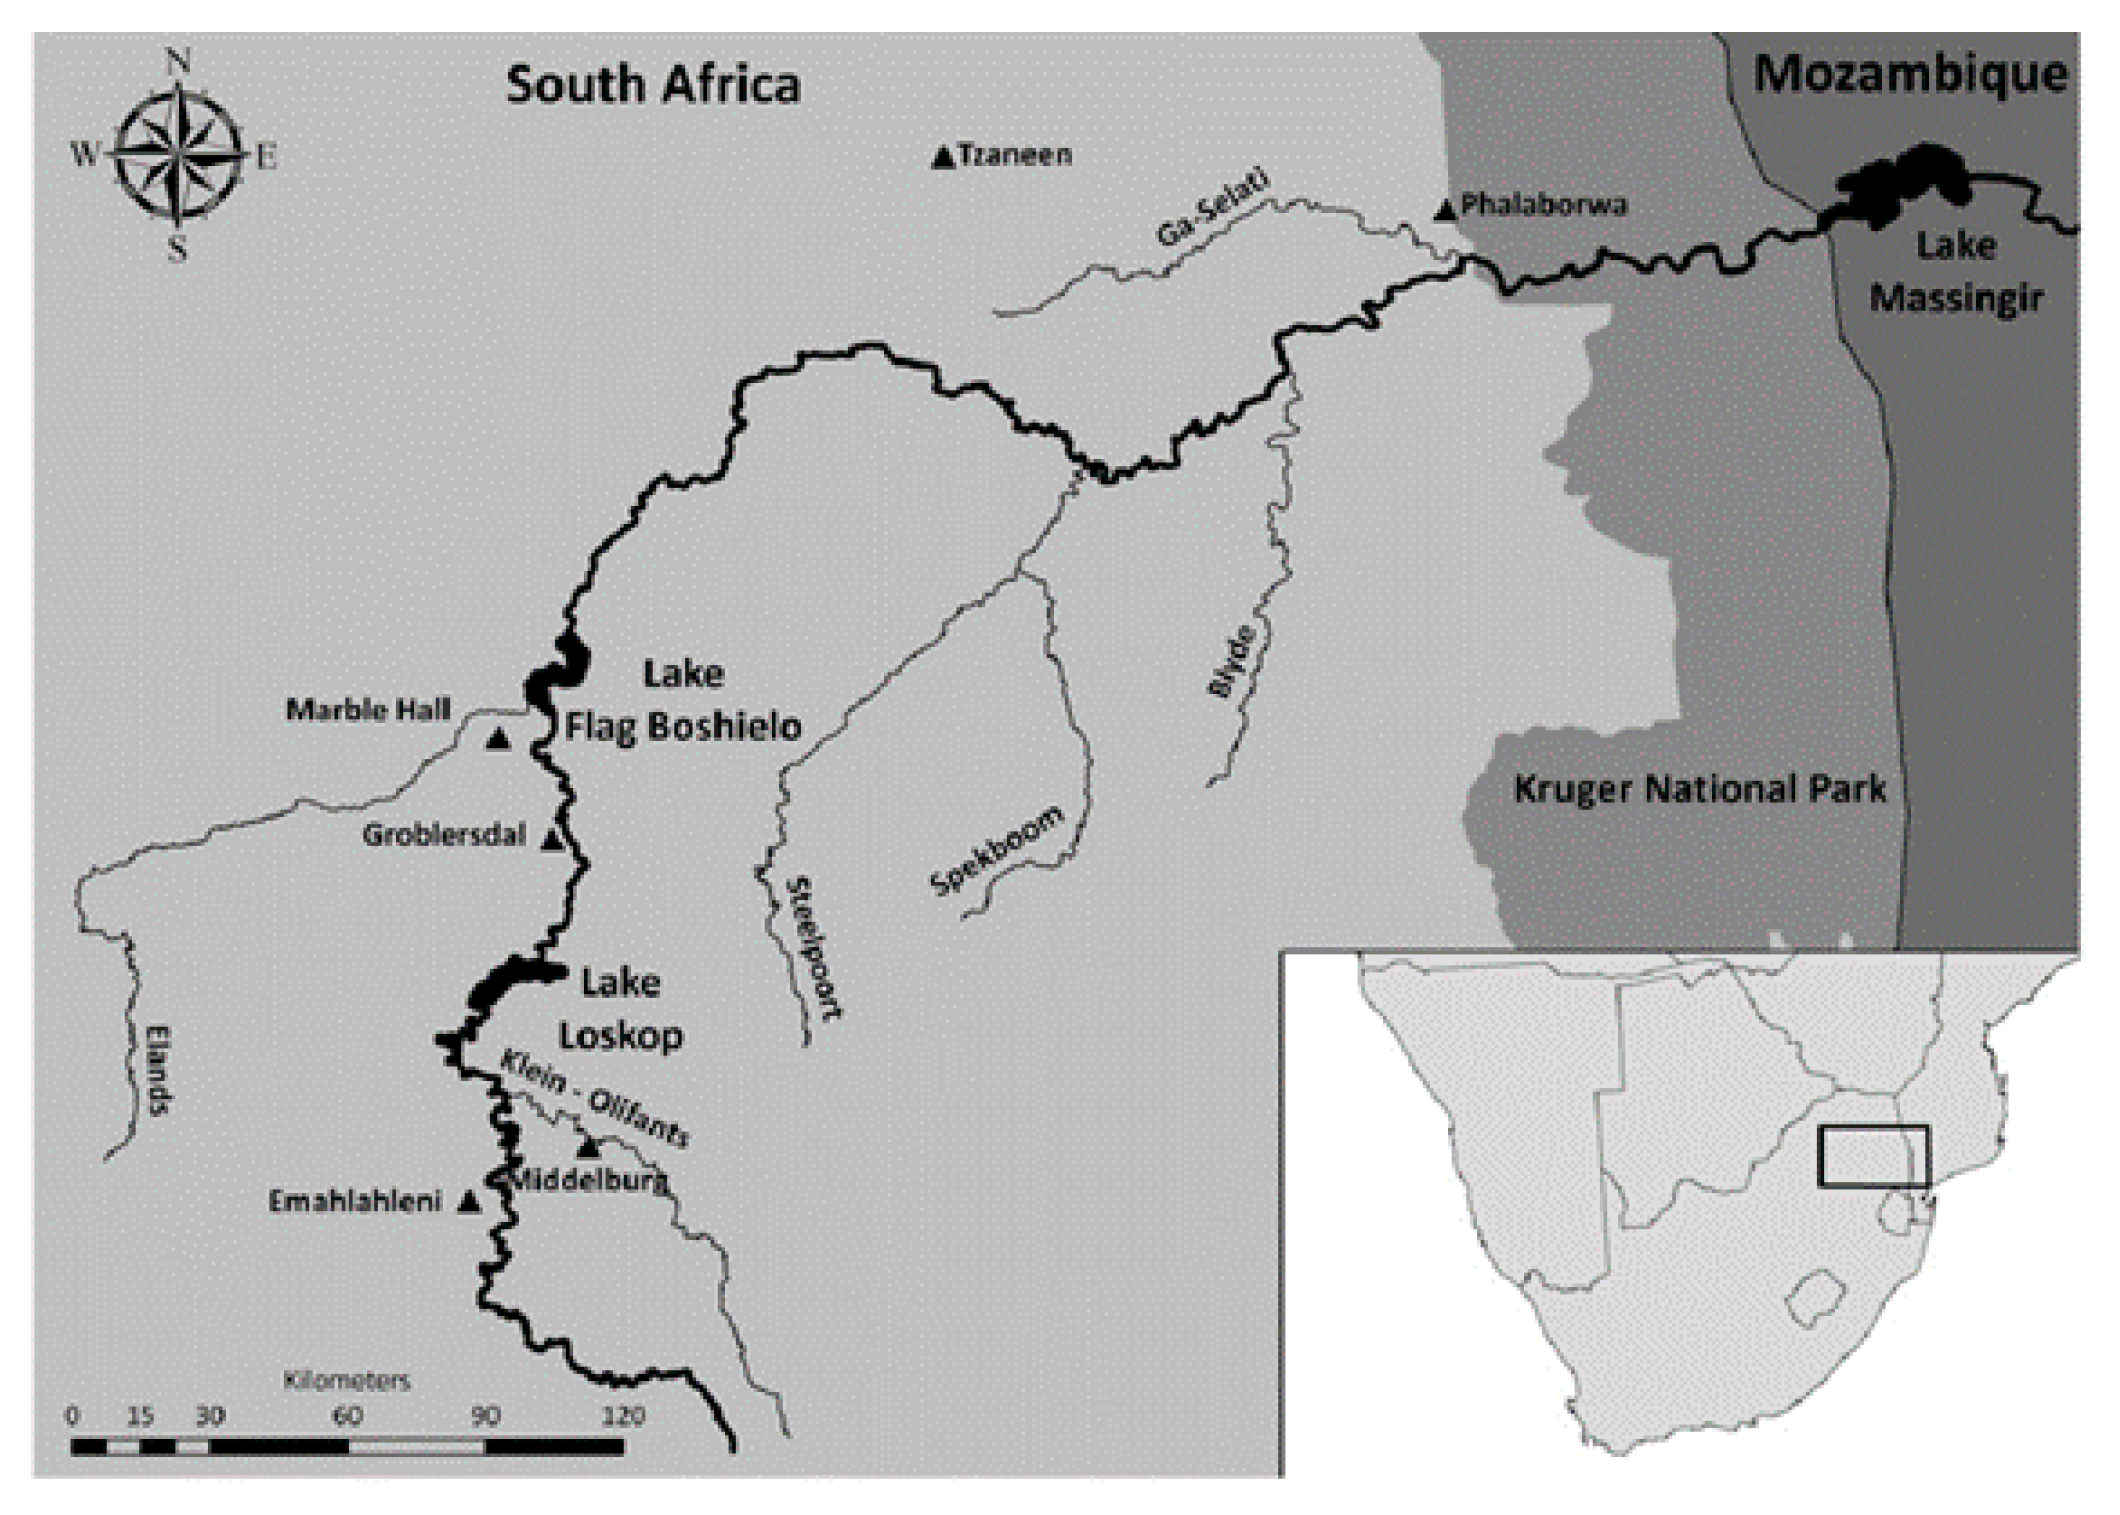
The Olifants Water Management Area (WMA), which comprises the Upper, Middle, and Lower Olifants Catchments, is a highly utilized and regulated basin [
28] and is the third most water-stressed catchment in South Africa [
29]. The Middle Olifants encompasses the second largest irrigation scheme in South Africa [
16,
30], making it imperative to reduce non-productive water losses and improve irrigation water use in the area [
3]. Formal economic activity is diverse and characterized mainly by irrigated and dryland agriculture as well as mining, industry and tourism [
28]. Citrus species, maize (
Zea mays L.), and wheat (
Triticum aestivum L.) are the main crops cultivated and account for approximately 16,818 ha (66%) of the area, with irrigation water being supplied by the Loskop Irrigation Scheme [
31]. Taking into consideration all eutrophication mitigation costs, the estimated total direct cost of algae is R2890 ha
−1 yr
−1, amounting to R48.6 million yr
−1 for these crops alone in the region. This figure increases to approximately R73.4 million yr
−1 for all irrigated crops, assuming all other irrigated crops in the area apply the same mitigation practices [
31]. In addition to water scarcity issues, therefore, it is essential to understand the water quality situation and potential threats in the Middle Olifants.
While a number of mostly broad-level studies have been conducted on eutrophication and water quality in South Africa [
16,
30,
32,
33,
34,
35], there is an urgent need to better understand and quantify nutrient losses from irrigated agriculture, and the interactions between surface water quality and irrigation. Irrigation even when managed optimally, results in the export of agrochemicals and salts to waterways. This leads to a deterioration in water quality, for example, when fertilizer N and P lost via runoff and leaching causes eutrophication. Linked to this, irrigation is affected by water quality. Highly saline waters can reduce crop yields [
36], while water with high levels of algae may clog components of the irrigation system [
30] and may need expensive filtration before being applied. In the interest of equity and sustainability, it is important to know the effects of upstream activities on downstream irrigation. Poor irrigation water quality may negatively affect the producer′s ability to export due to non-compliance of stringent export regulations, which has a knock-on effect on job security [
37]. It is therefore critical to ensure irrigation water quality of a standard that complies with regulations, which can be achieved through good management practices. We feel this study is scientifically important in that it (1) performs a quality control assessment of long-term water quality data in the South African government′s database (never done before), by comparing Department of Water and Sanitation (DWS) measurements with values obtained by conducting our own monitoring campaign in parallel; (2) analyzes the water quality situation (including trends over 20 years) in one of South Africa′s most intensively irrigated and economically important catchments and screens major water quality constituents for any risks to sustainable irrigation (and in so doing, provides an example of methodology that can be applied to other catchments in such a scoping study); (3) quantifies the potential additional pollution load that failing WWTW can have in the catchment relative to irrigation; (4) analyzes water quality in irrigation canals and a farm storage dam to investigate any changes in water quality from the source. The eutrophication status of the catchment and future threats were explored and recommendations for future research and mitigation are made.
3. Results
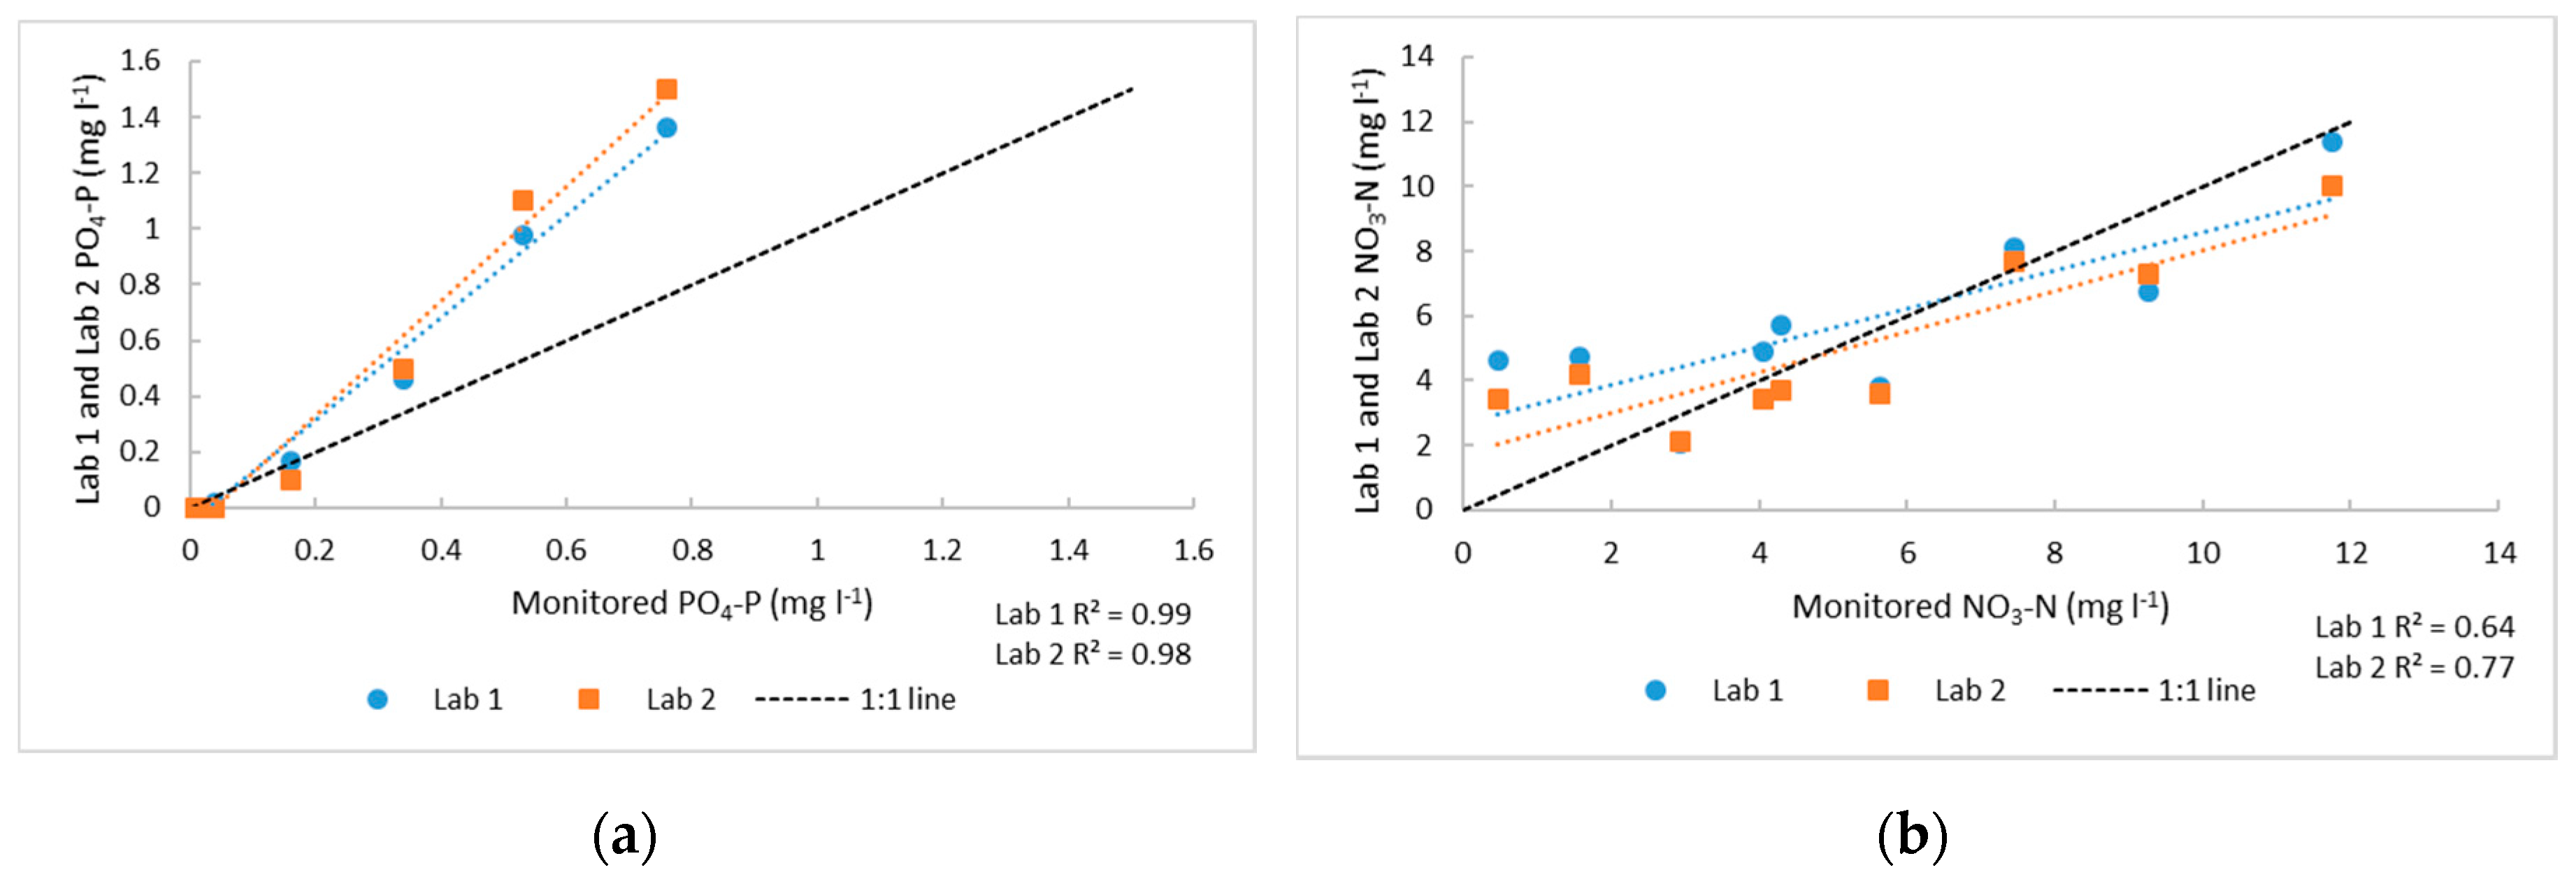
3.1. Laboratory Validation of Measured Results
Most of our measured values showed good correlation (
Figure 3). The commercial laboratories measured higher PO
4-P concentrations than we did at concentrations above approximately 0.3 mg PO
4-P l
−1, but measurements made in the study were generally much lower than these values. A good relationship between our measurements and the commercial laboratories measurements was observed for NO
3-N concentrations. In general, values from our monitoring study were therefore judged to have been accurate.
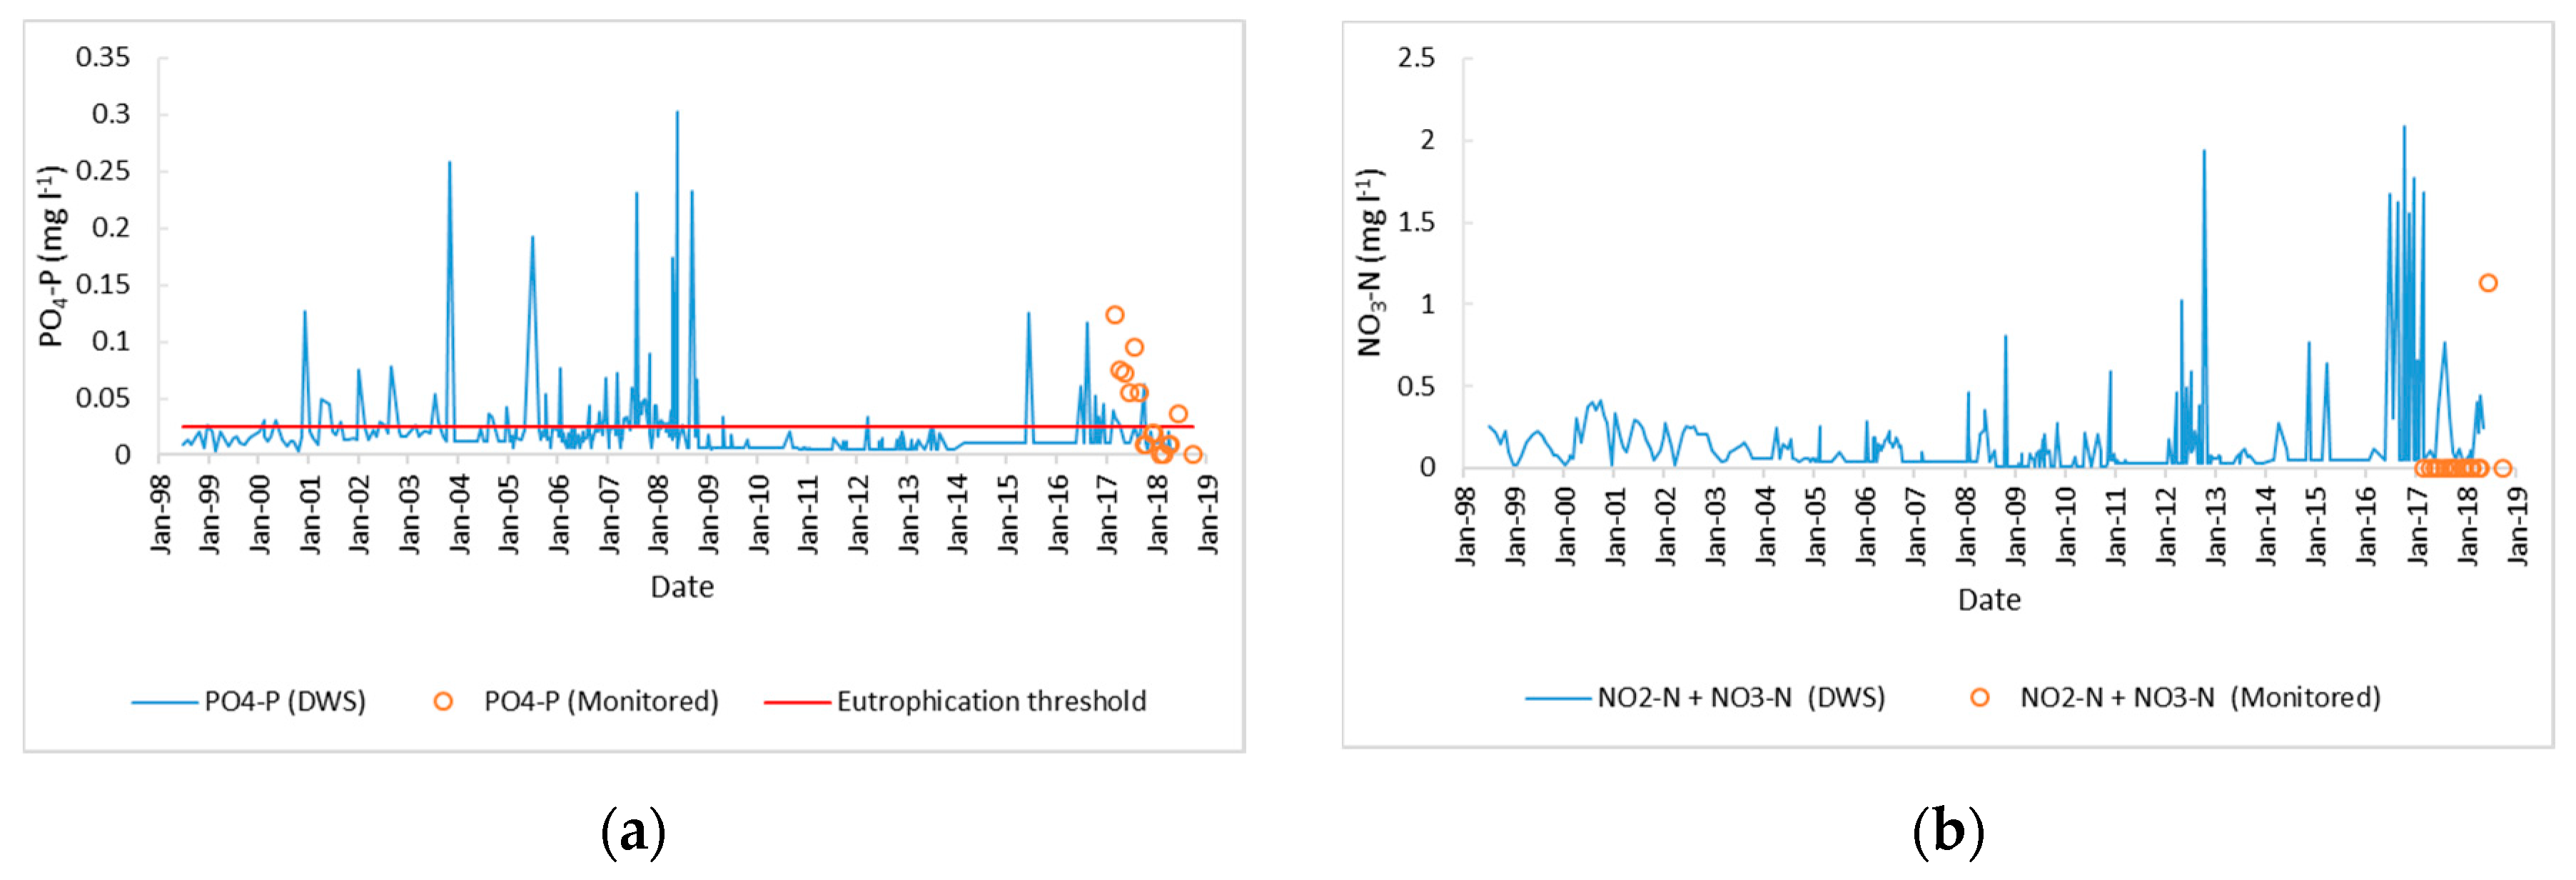
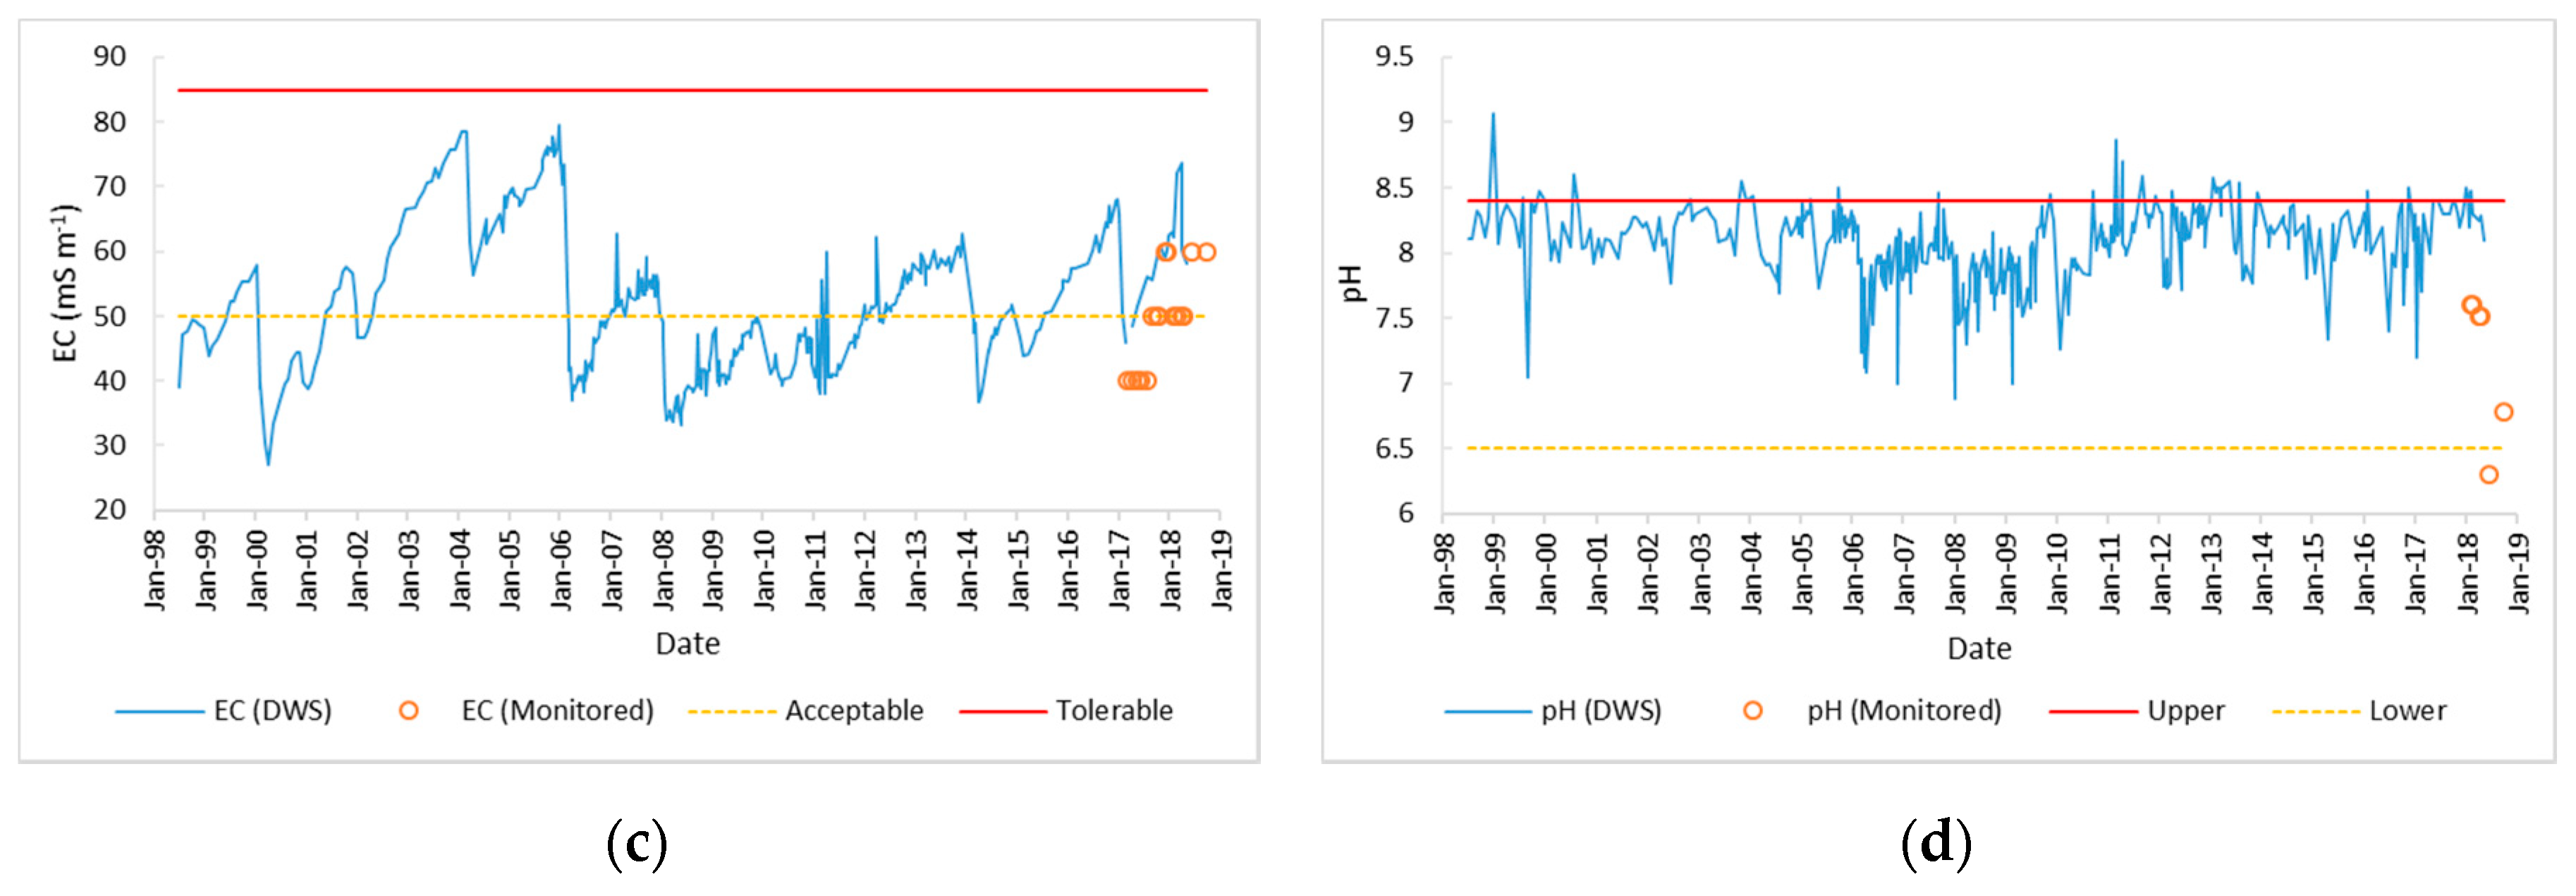
3.2. Comparison of Measured Data with Department of Water and Sanitation Long-Term Data
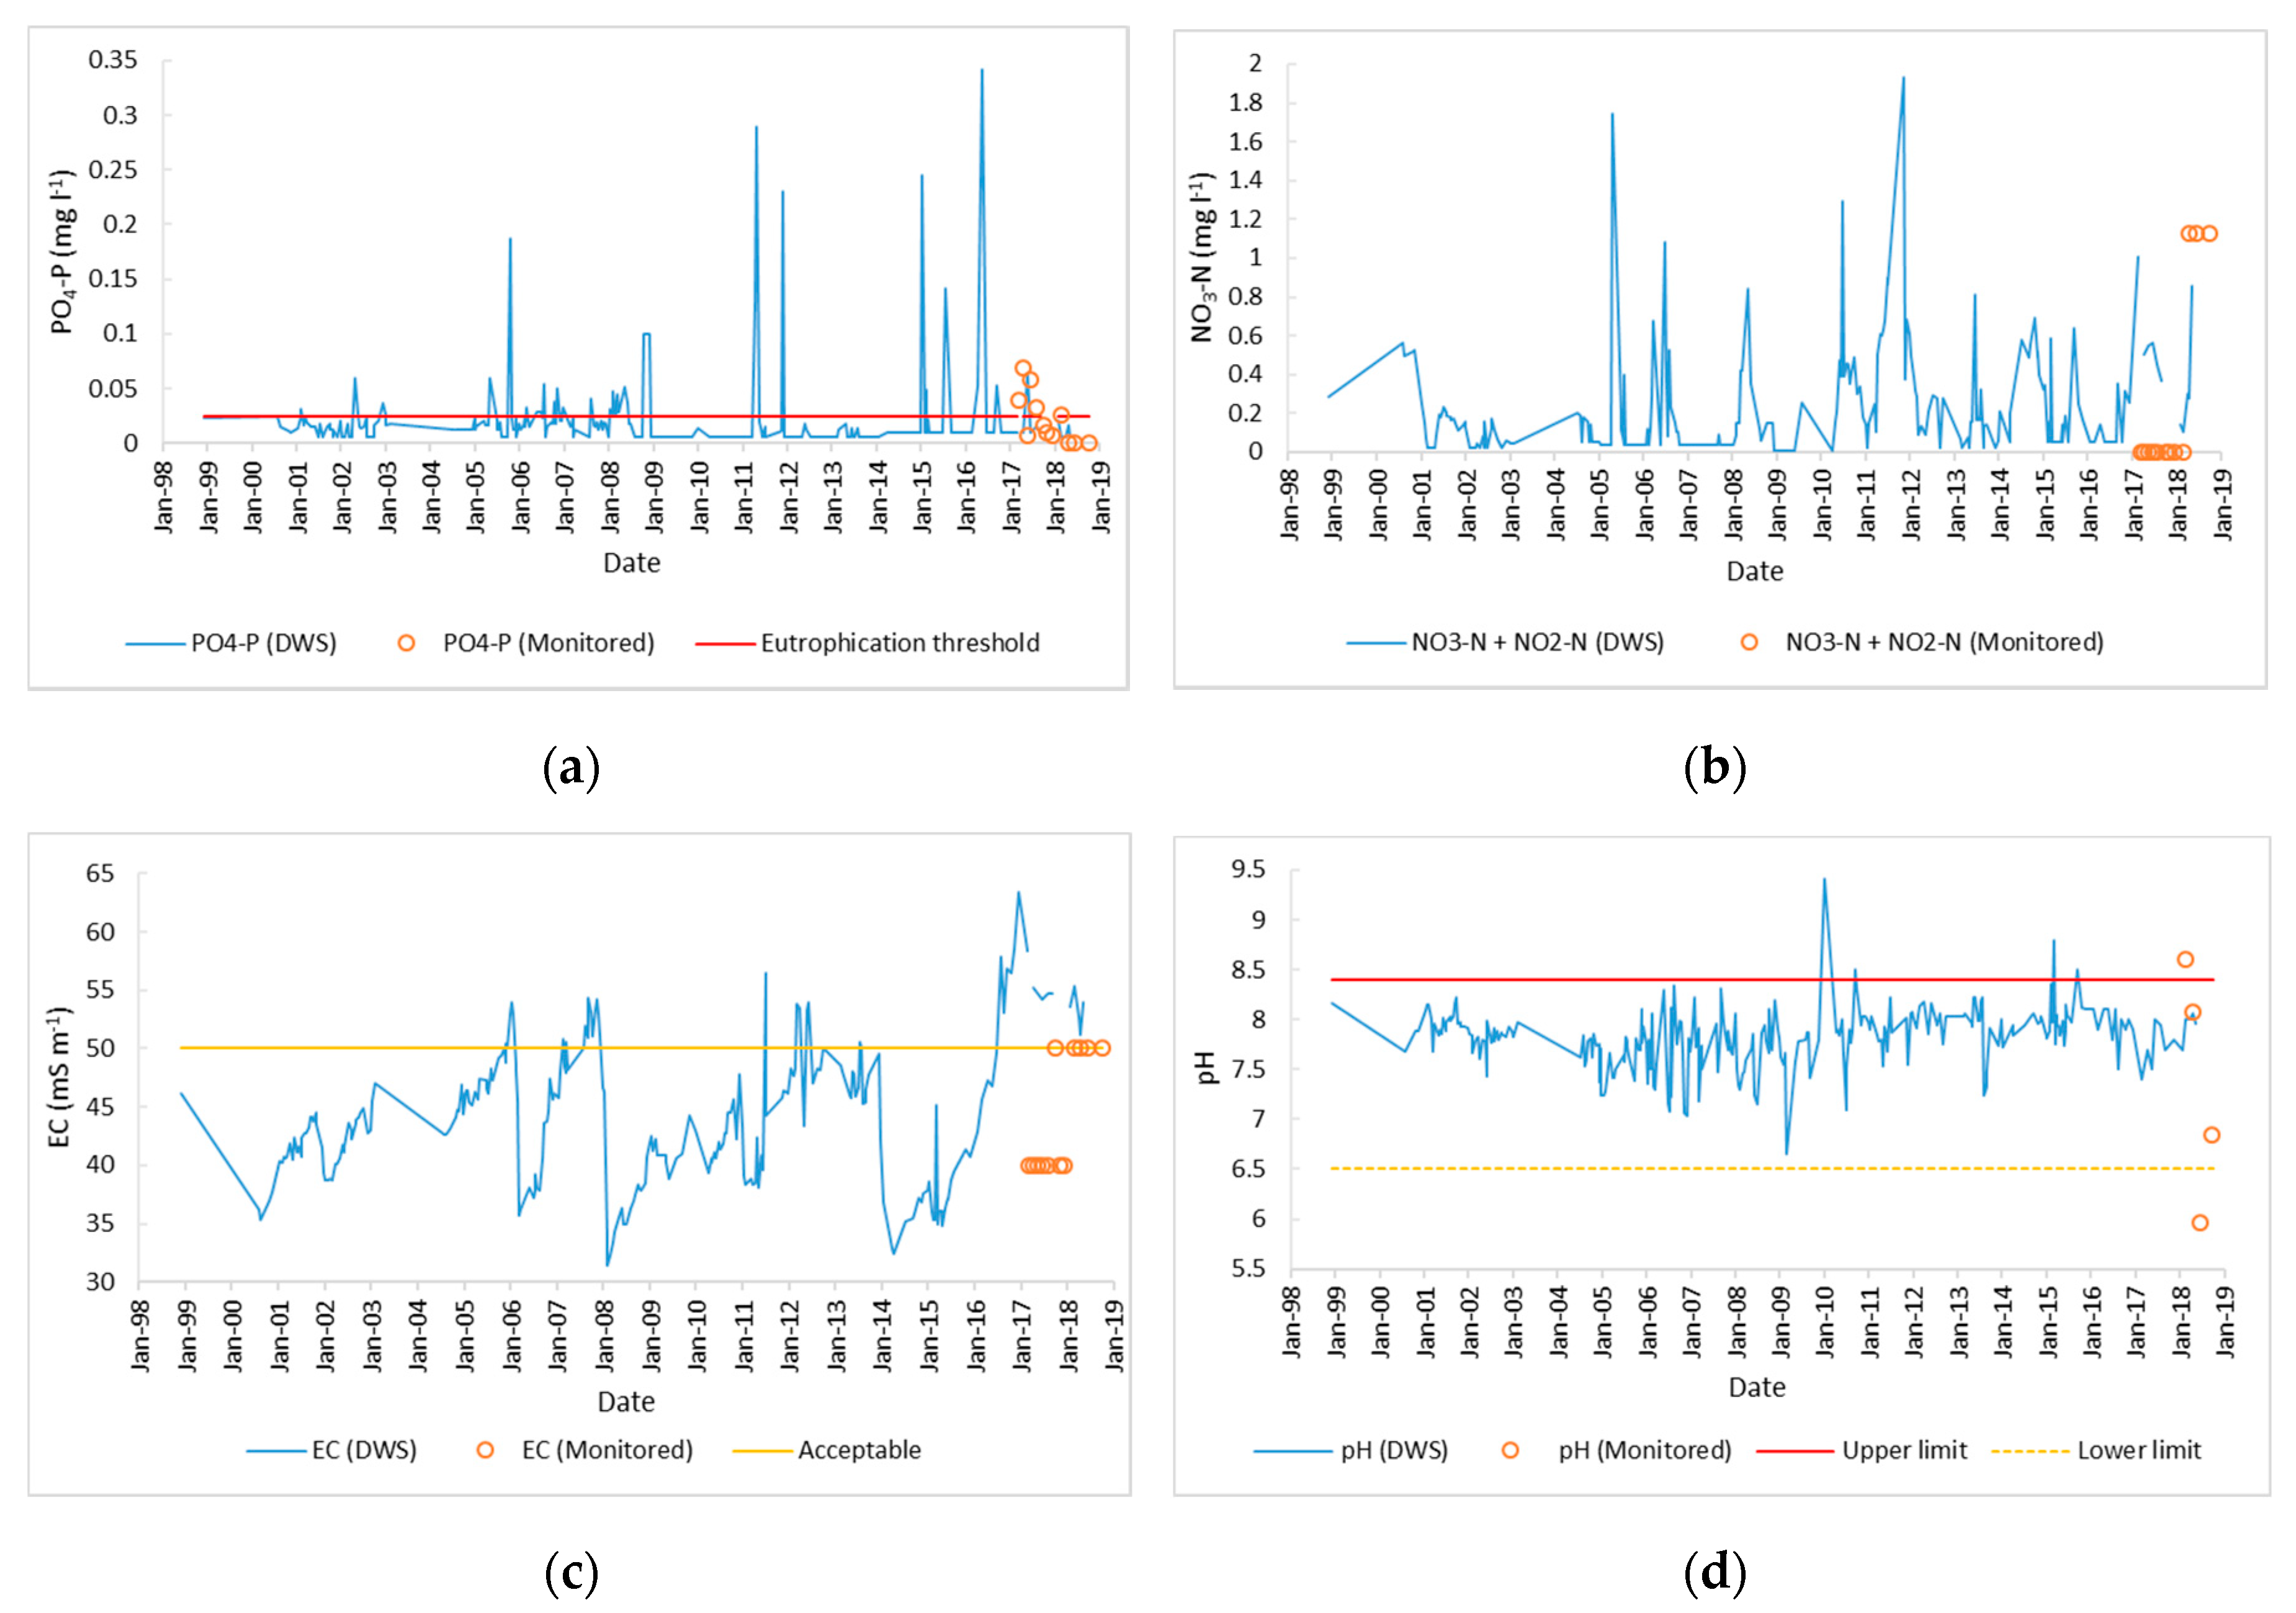
For PO
4-P in the Loskop Dam, apart from April and October 2018, our monitored values were higher than DWS values (
Table 1). The PO
4-P comparison for the Flag Boshielo Dam (
Table 2) shows a closer correlation between both sets of data, however, a similar trend to the Loskop Dam was seen with monitored values almost always higher than and above the eutrophication threshold compared to the DWS data, which were mostly below the threshold.
The DWS NO3-N values were consistently higher than our monitored values, however, both sets of data show that values were below the eutrophication threshold. During our sampling campaign, there was no detectable NO3-N in the Loskop Dam until April 2018, and no detectable NO3-N in the Flag Boshielo Dam except for June 2018. The same NO3-N concentration was detected in the Loskop Dam in April, June, and October in 2018 as in the Flag Boshielo Dam (1.13 mg L−1). Our monitored and the DWS values corresponded better for the Flag Boshielo Dam.
The comparison of EC in the Loskop and Flag Boshielo Dams showed that DWS values were higher than our monitored values. For the Loskop Dam, spikes in EC were seen at two different points (May for DWS data and September for monitored data). The DWS data for the Flag Boshielo Dam EC levels were lower than our monitored data on the first date of sampling, but following that the DWS values were consistently higher or the same. The SAR values in both dams indicate there was a moderate risk of infiltrability problems for irrigation for the sampling period (and a severe risk in the Flag Boshielo Dam in February 2018). From the pH data available for comparison, our pH values were higher for the Loskop Dam than DWS data. The opposite was observed for the Flag Boshielo Dam, where our monitored values were lower than DWS data.
3.3. Reservoir Water Quality
At the start of the sampling period, all dams had elevated PO
4-P levels (>0.025 mg L
−1) (
Figure 4,
Figure 5 and
Figure 6). After September 2017, however, the concentrations decreased to below the eutrophication threshold for all except the Flag Boshielo Dam sample in June 2018. The PO
4-P concentrations in the Flag Boshielo Dam were always higher than or equal to the Loskop Dam, except in February 2018. The long-term dataset (1998–2018) PO
4-P concentrations do not show a visible increase in the Flag Boshielo Dam and even suggest a decreasing trend over time, however the DWS comparison with monitored data reveals some cause for concern regarding the integrity of sampling and analysis.
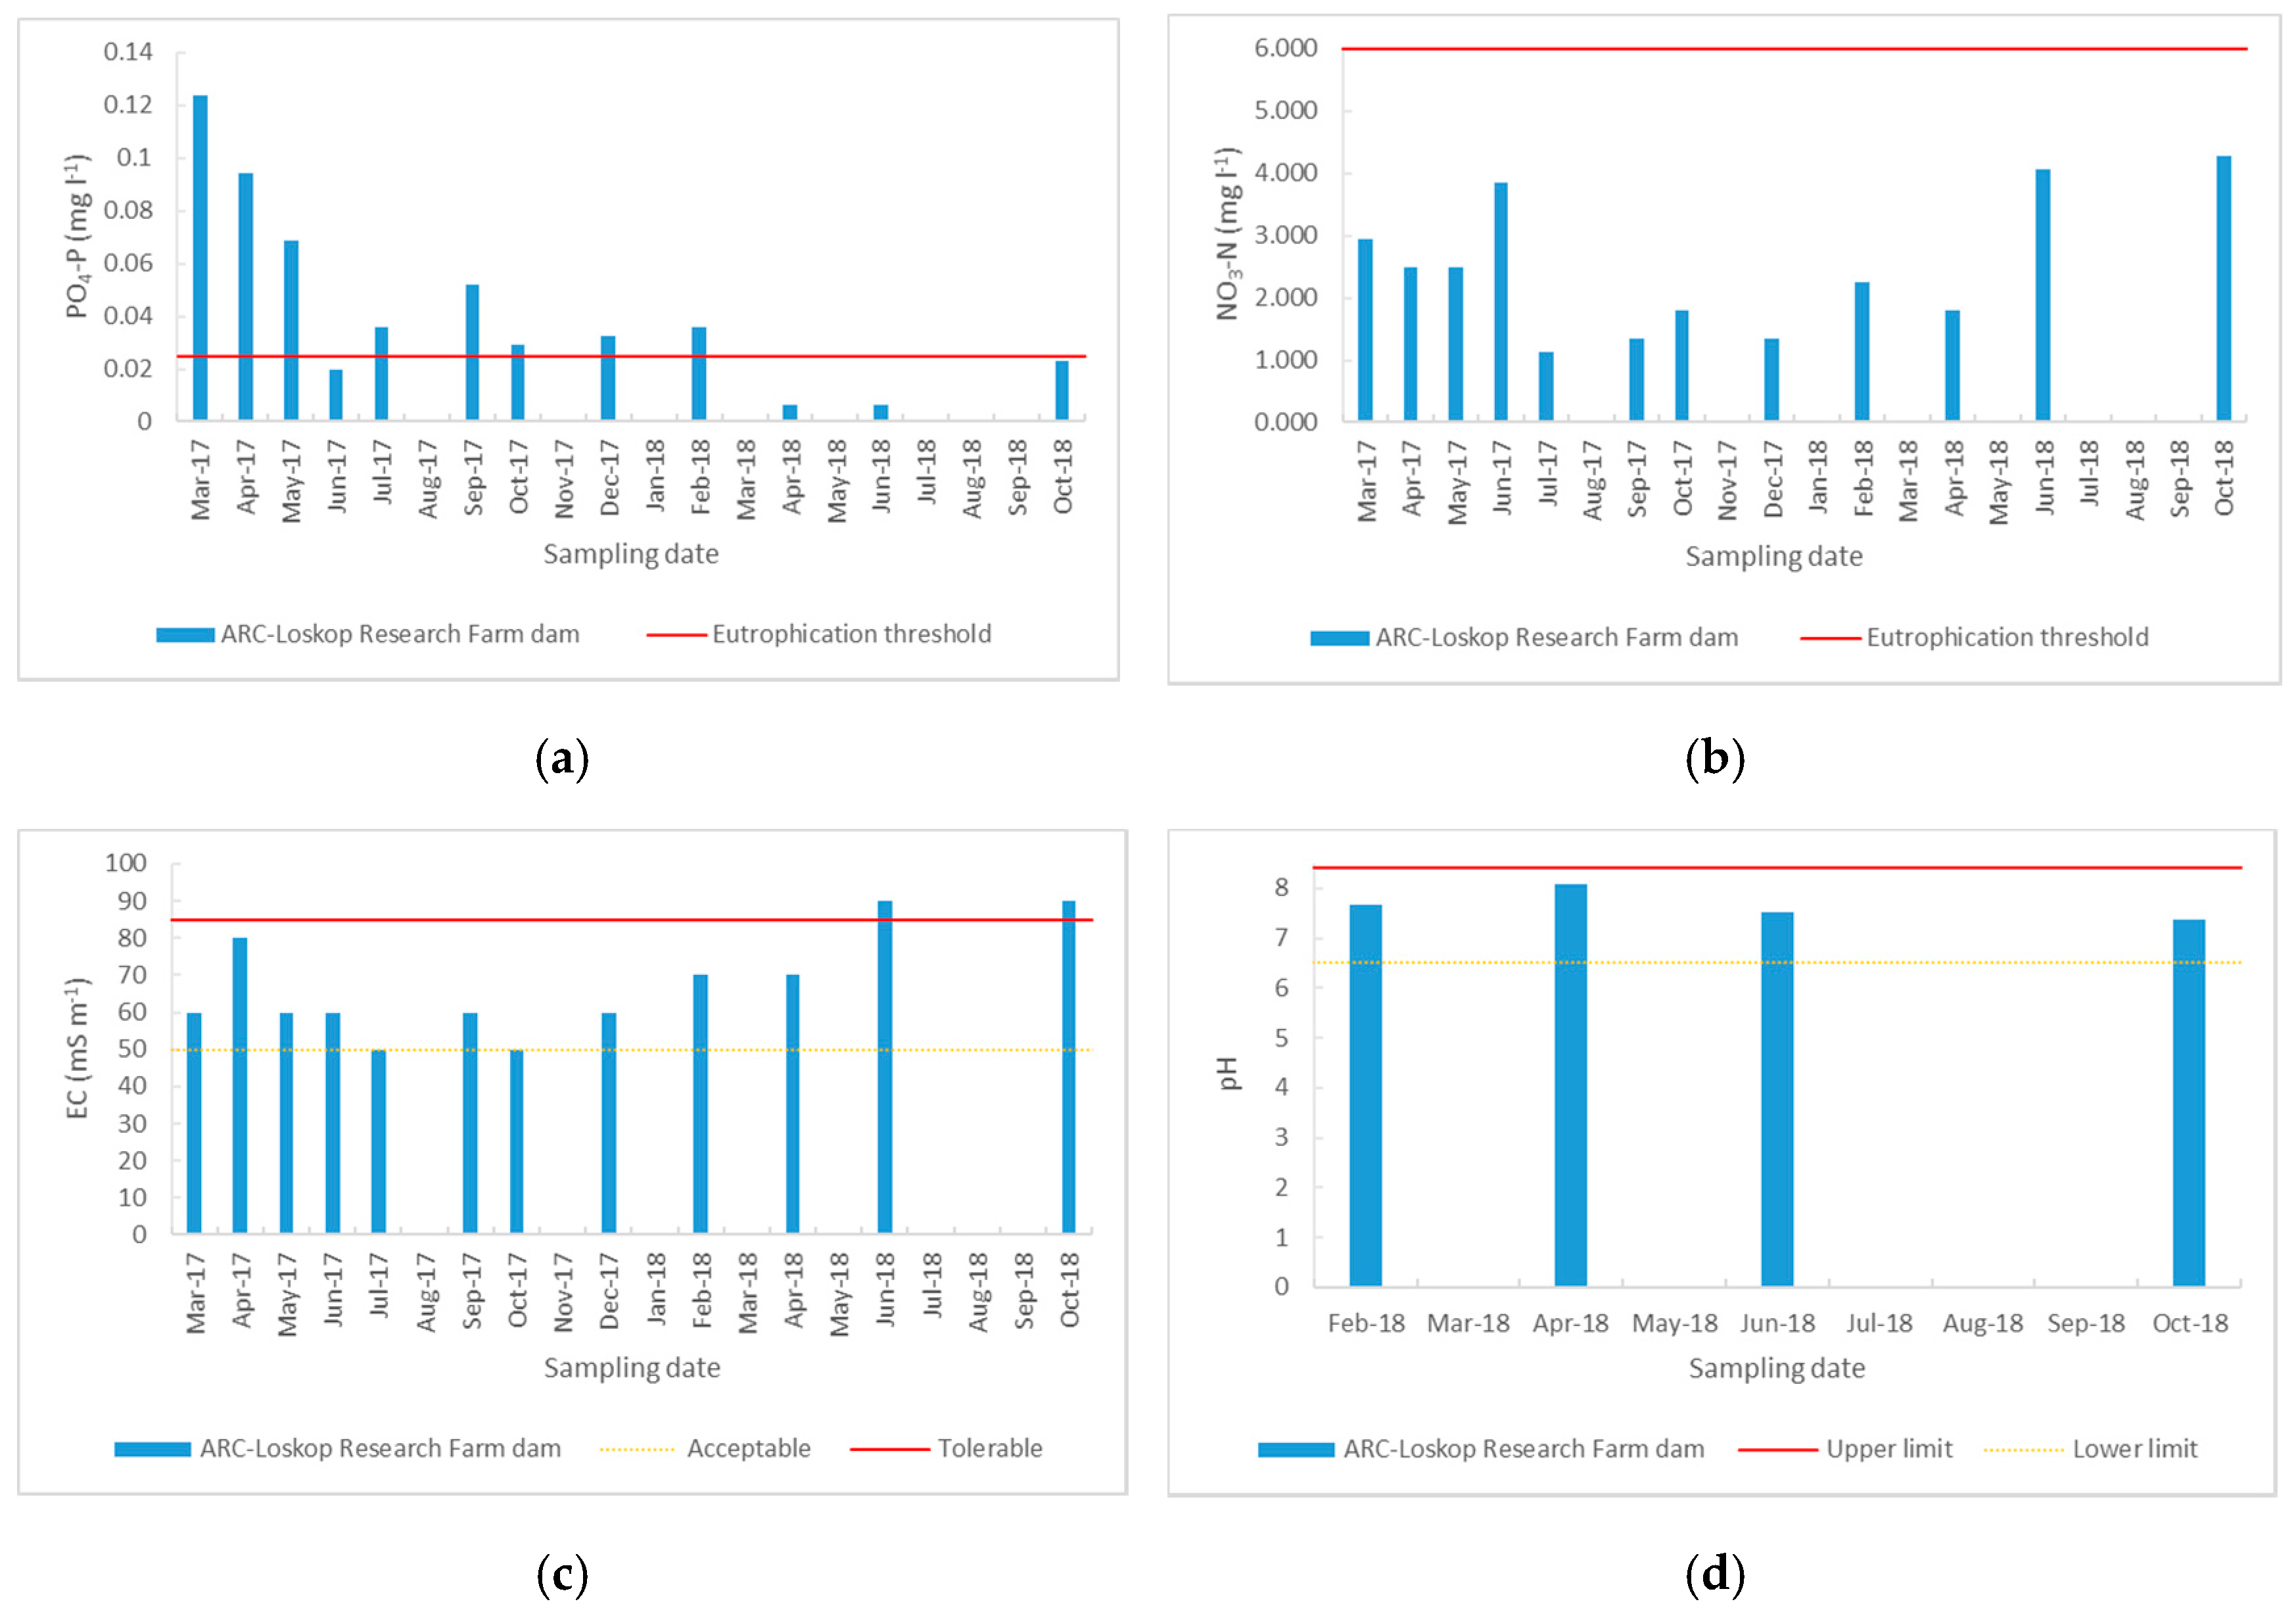
The PO
4-P concentrations in the ARC-Loskop Research Farm storage dam remained above the eutrophication threshold until April 2018 (
Figure 6). Thereafter, the concentration was below the eutrophication threshold until October 2018. The PO
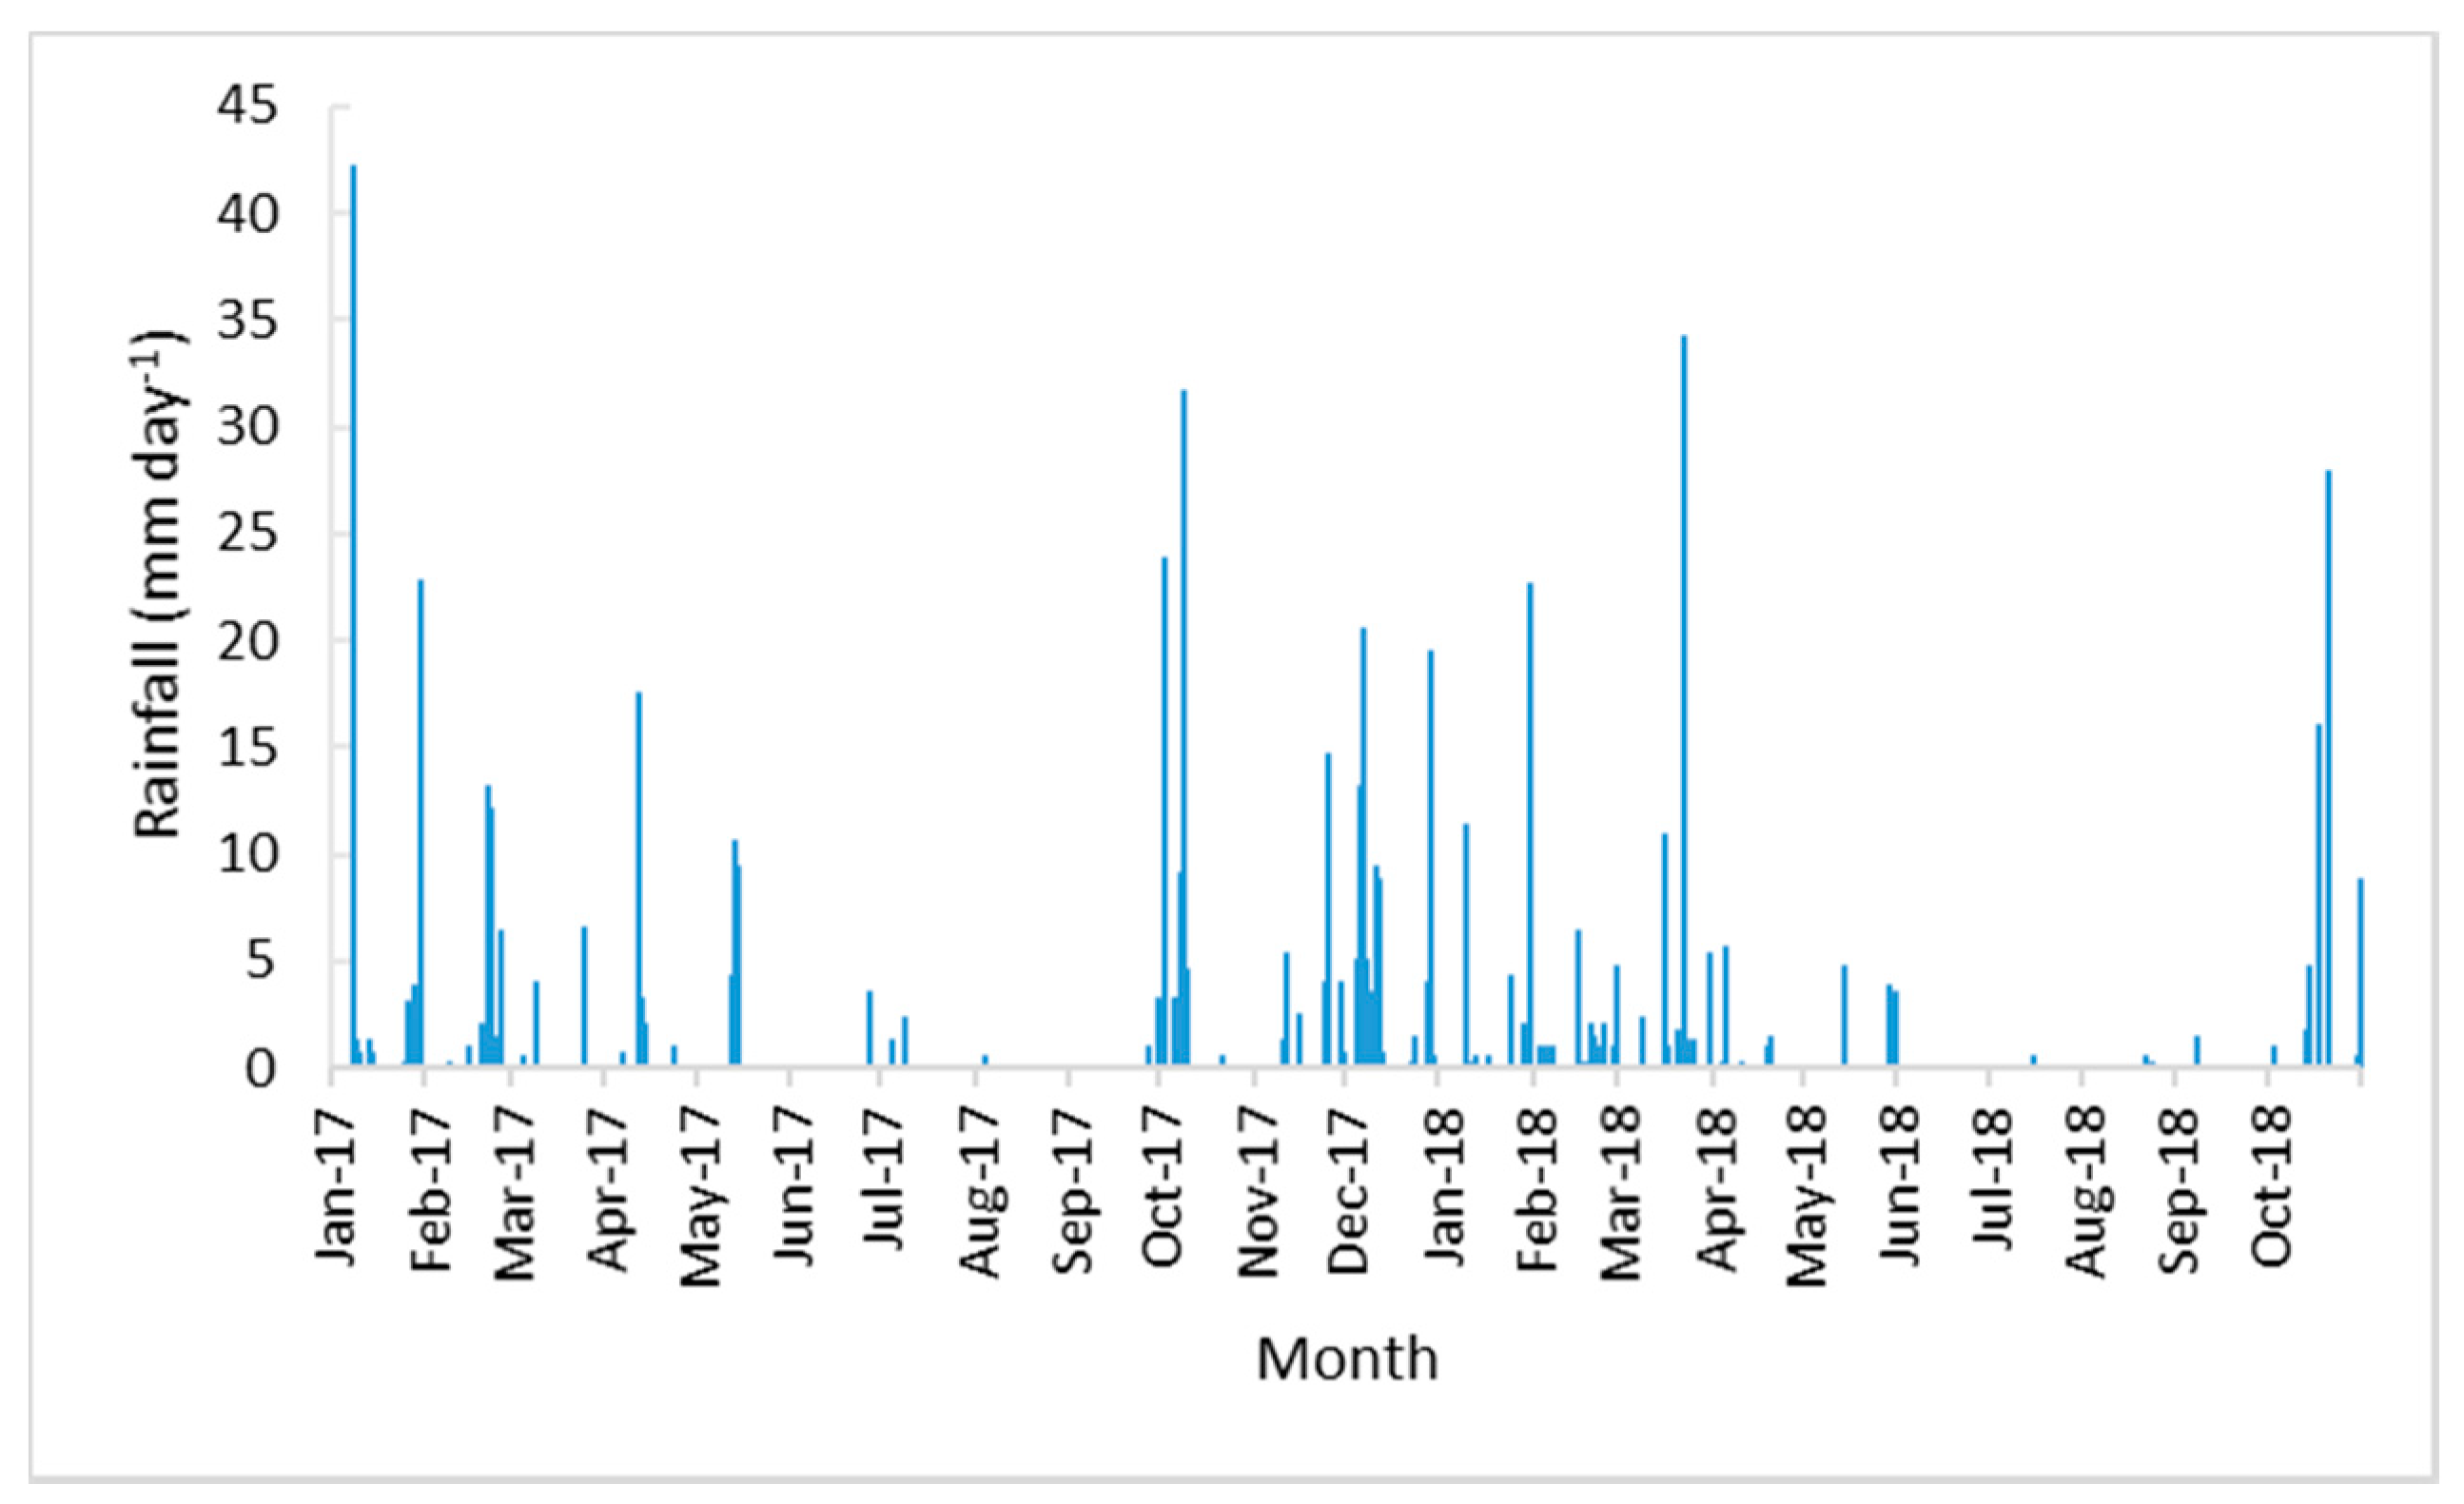
4-P concentrations generally started to drop after September, when rainfall increased (
Figure 7). This corresponds to the long-term dataset where lower PO
4-P concentrations were observed during higher flow periods before 2016 (
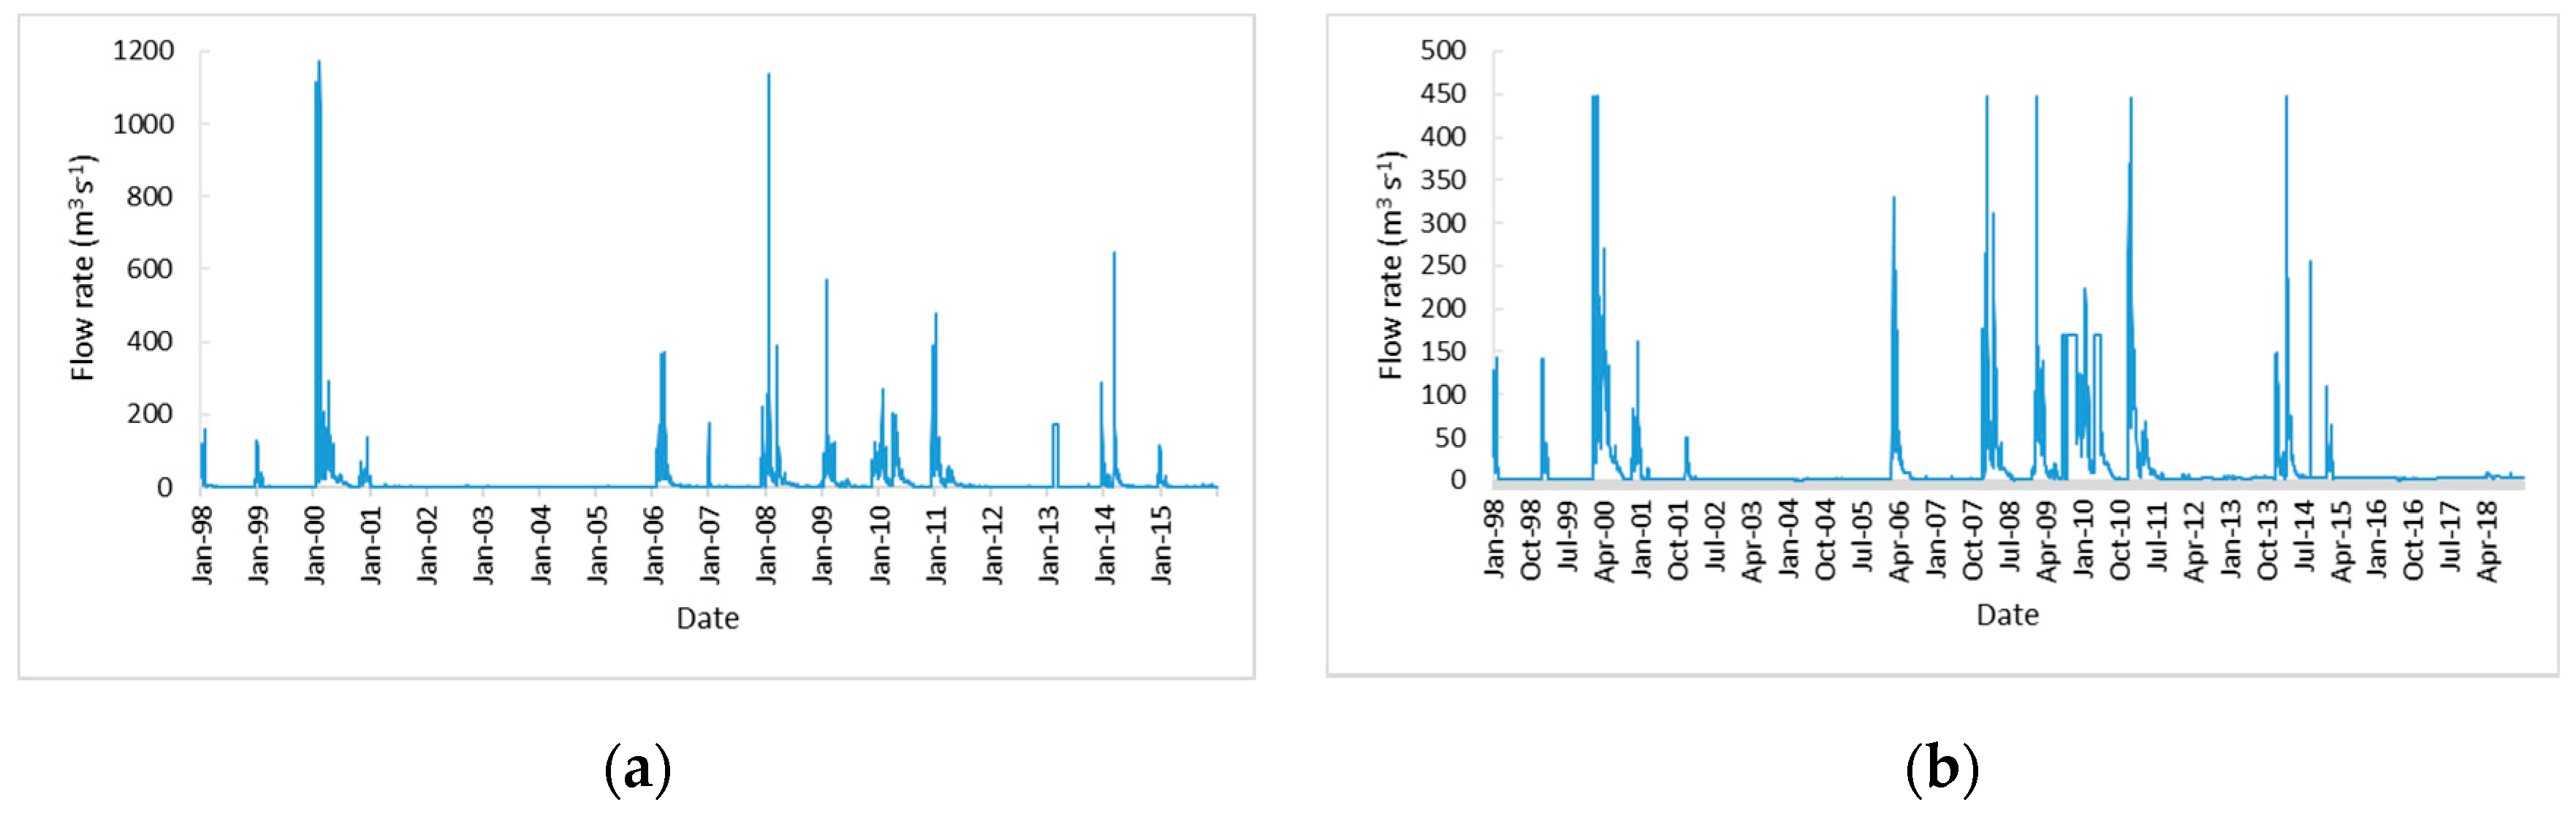
Figure 8) and higher concentrations during lower flow periods after 2016.
Monitored NO3-N concentrations remained below the eutrophication threshold (<6 mg L−1) throughout the sampling period. There appeared to be a slight lag between the increased NO3-N concentration observed at the Loskop Dam (April 2018) and Flag Boshielo Dam (June 2018). The ARC-Loskop Research Farm storage dam had higher concentrations than the Loskop and Flag Boshielo Dams, but even the highest concentration measured for this dam was below the eutrophication threshold. Decreased NO3-N concentrations were observed from July 2017 until April 2018, after which the NO3-N concentration increased again. The general long-term NO3-N trend showed that concentrations increased spatially from the Loskop Dam to Flag Boshielo Dam.
Electrical conductivity measured in the dams show that samples were in the acceptable range. The farm storage dam at the ARC-Loskop Research Farm is the only dam that deviated from this in June 2018, moving above the tolerable threshold and remained there until the end of the sampling campaign (
Figure 6). The smaller storage dam also displayed more variable EC values than the Loskop and Flag Boshielo Dams. The long-term dataset shows a concentrating effect from the Loskop Dam downstream to the Flag Boshielo Dam. While the long-term EC values in the Loskop Dam were generally in the ideal category, the Flag Boshielo Dam values were frequently very close to or above the tolerable limit.
Similar to EC, pH values in the Flag Boshielo Dam were frequently higher than in the Loskop Dam. For both Loskop and Flag Boshielo Dams, the pH appears to be higher in the summer months than winter months, possible evidence of the influence of salts from irrigation return-flows. Salt concentrations in irrigation return-flows can be one to ten-fold that of irrigation waters [
43]. The monitored pH of the large dams remained in the acceptable category for most of the sampling period, and for the entire period in the case of the ARC-Loskop Research Farm storage dam. The pH of the Loskop Dam started slightly higher than the acceptable pH limit in February 2018, but then fell within the acceptable range for the rest of the monitoring period. There was a drop in pH observed in June 2018 for the Loskop Dam and the same was observed, but to a lesser extent, for the Flag Boshielo Dam. It is possible that acidic mine drainage from mining activities upstream could have caused this decrease in pH. Acid mine drainage is produced by the oxidation of pyrite, producing H
+, which drops the pH of the system [
44]. Another contributor could have been acid rain resulting from mining activities and other industrial activity in the area. Coal-containing pyrite has sulfur, which is a source of acid rain [
45]. Both dams were within the acceptable range by the end of the sampling campaign. The pH in the ARC-Loskop Research Farm storage dam was more variable then the two large reservoirs. A study on farm dams by Brainwood et al. [
46] showed that in late summer and autumn, pH peaked in the late afternoon, following the period of maximum photosynthetic activity. This could explain the variability observed in the farm dam in this study, where time of sampling could have influenced the pH readings.
3.4. River Water Quality
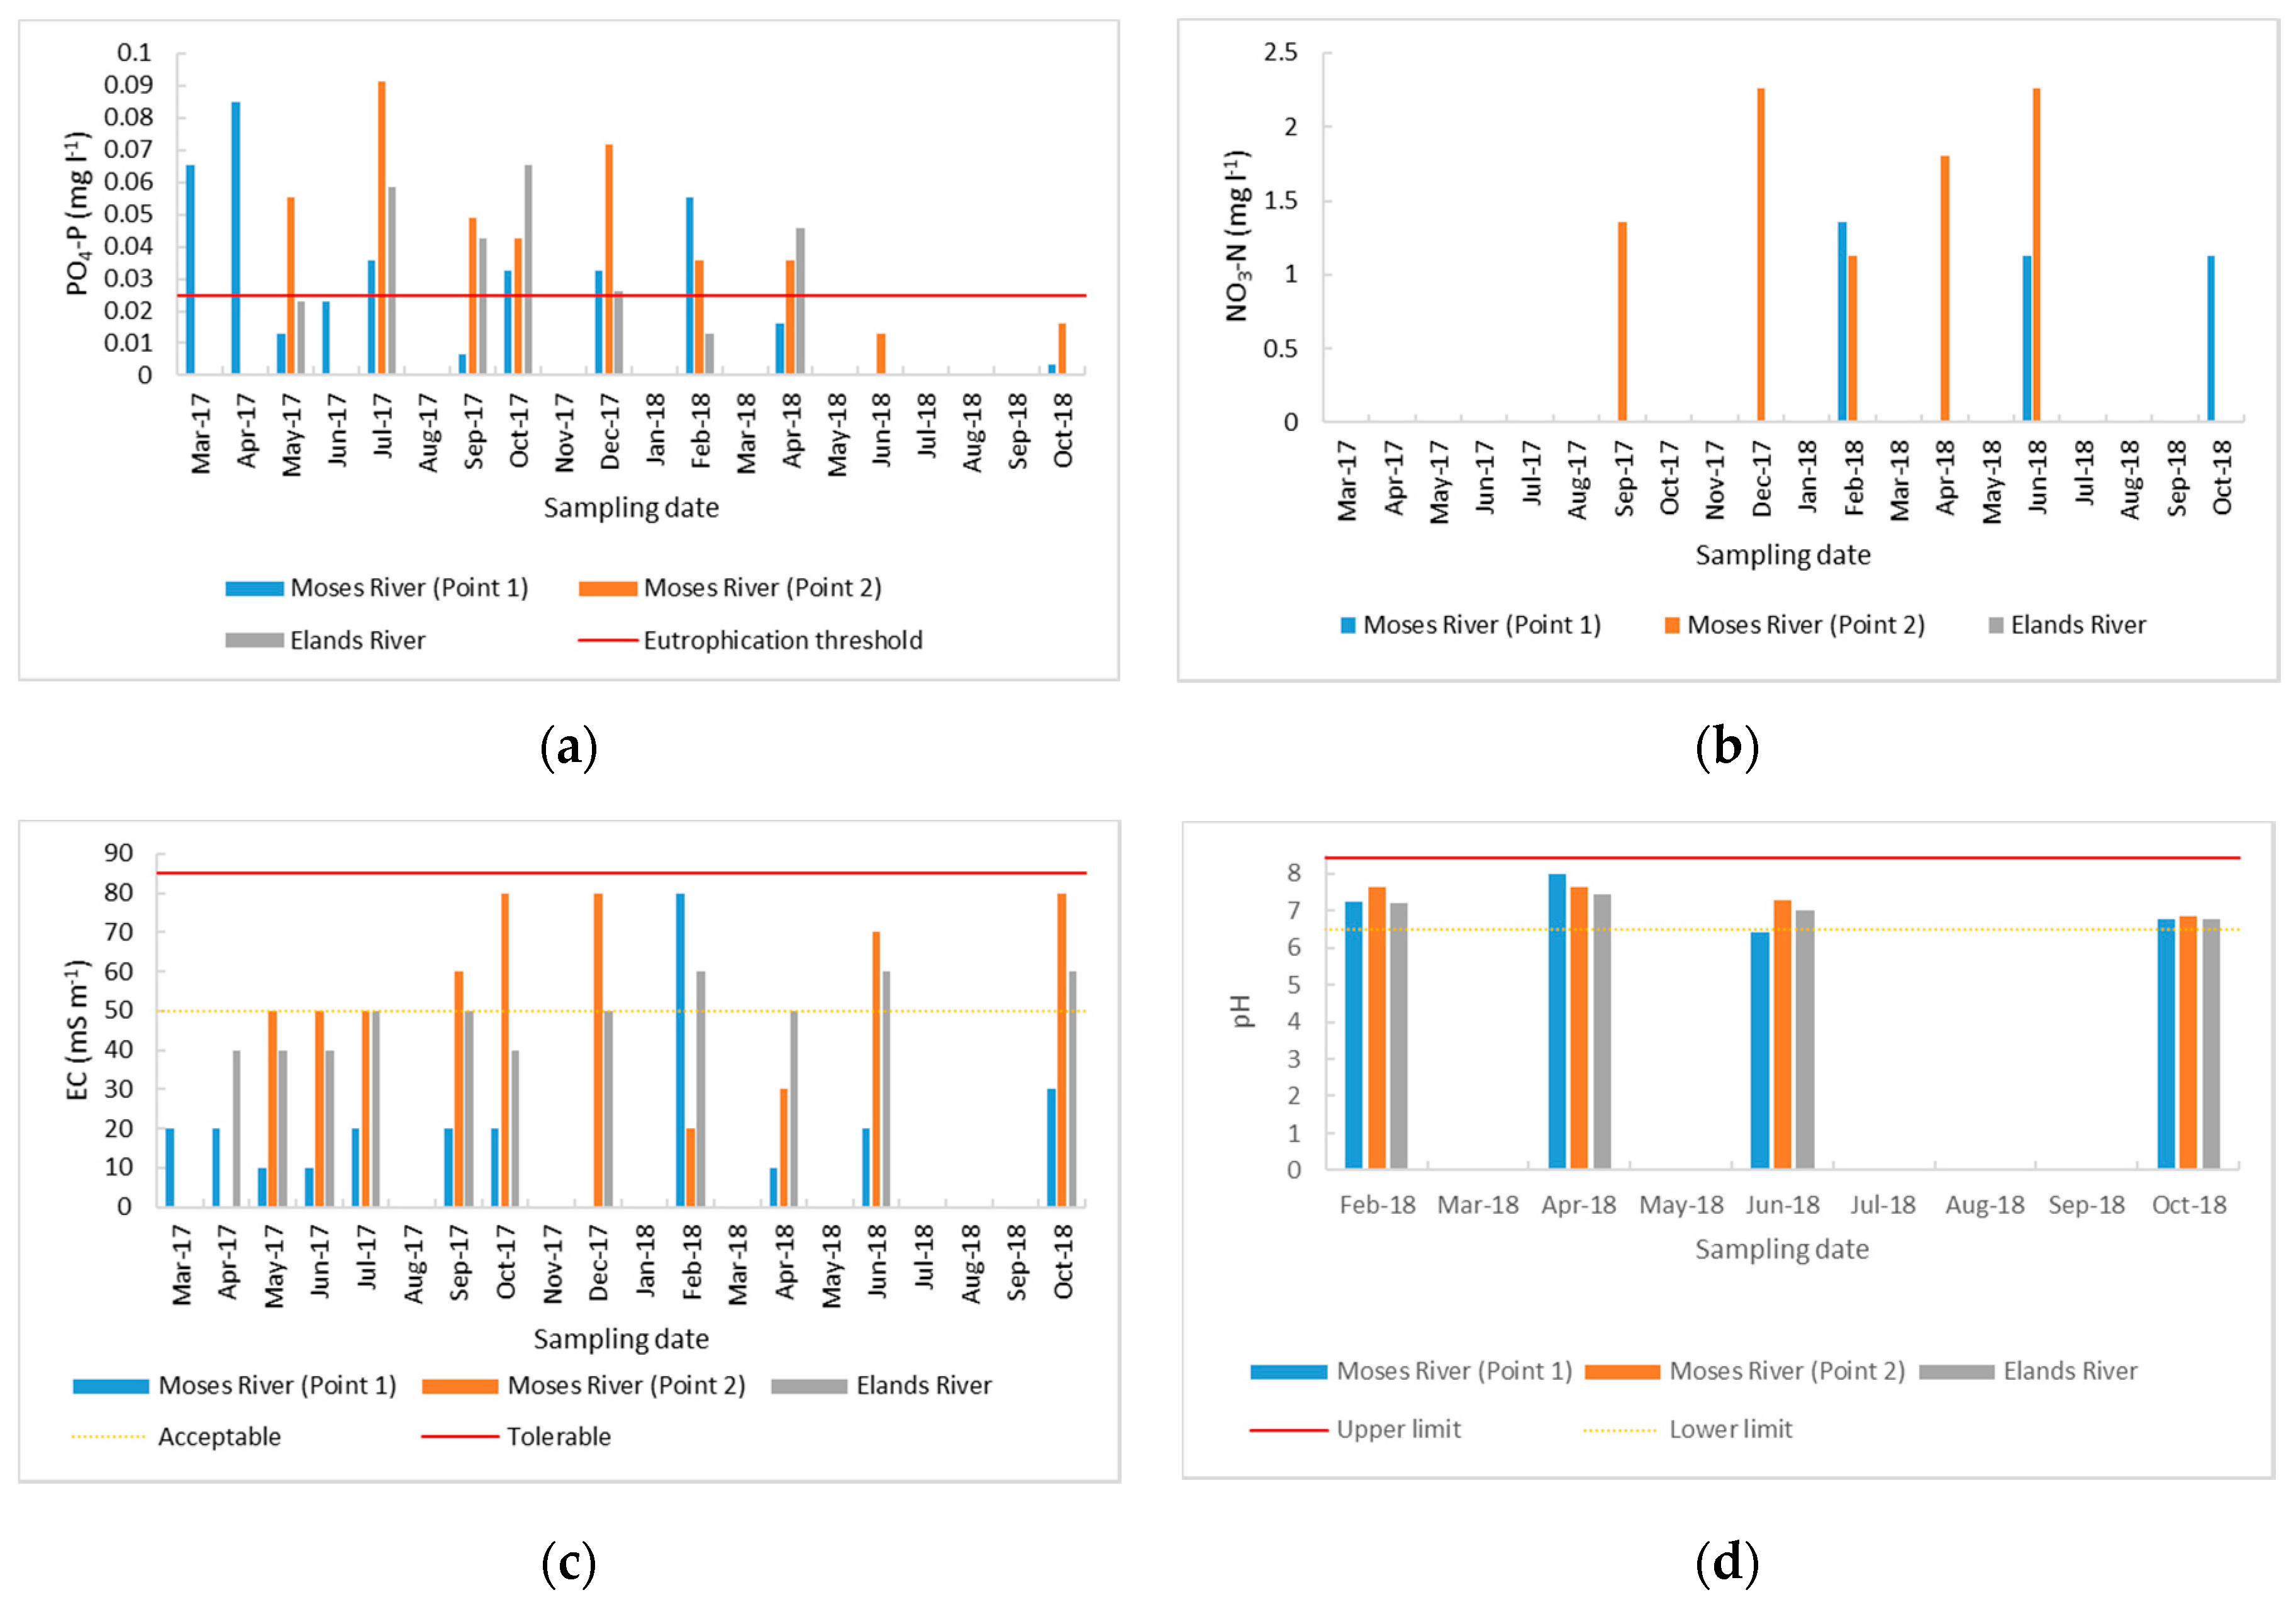
Moses River Point 2 consistently had higher PO
4-P concentrations than Point 1 upstream (
Figure 9). This is evidence of PO
4-P pollution into the Moses River and then into the Olifants River downstream of the Loskop Dam. The Elands River PO
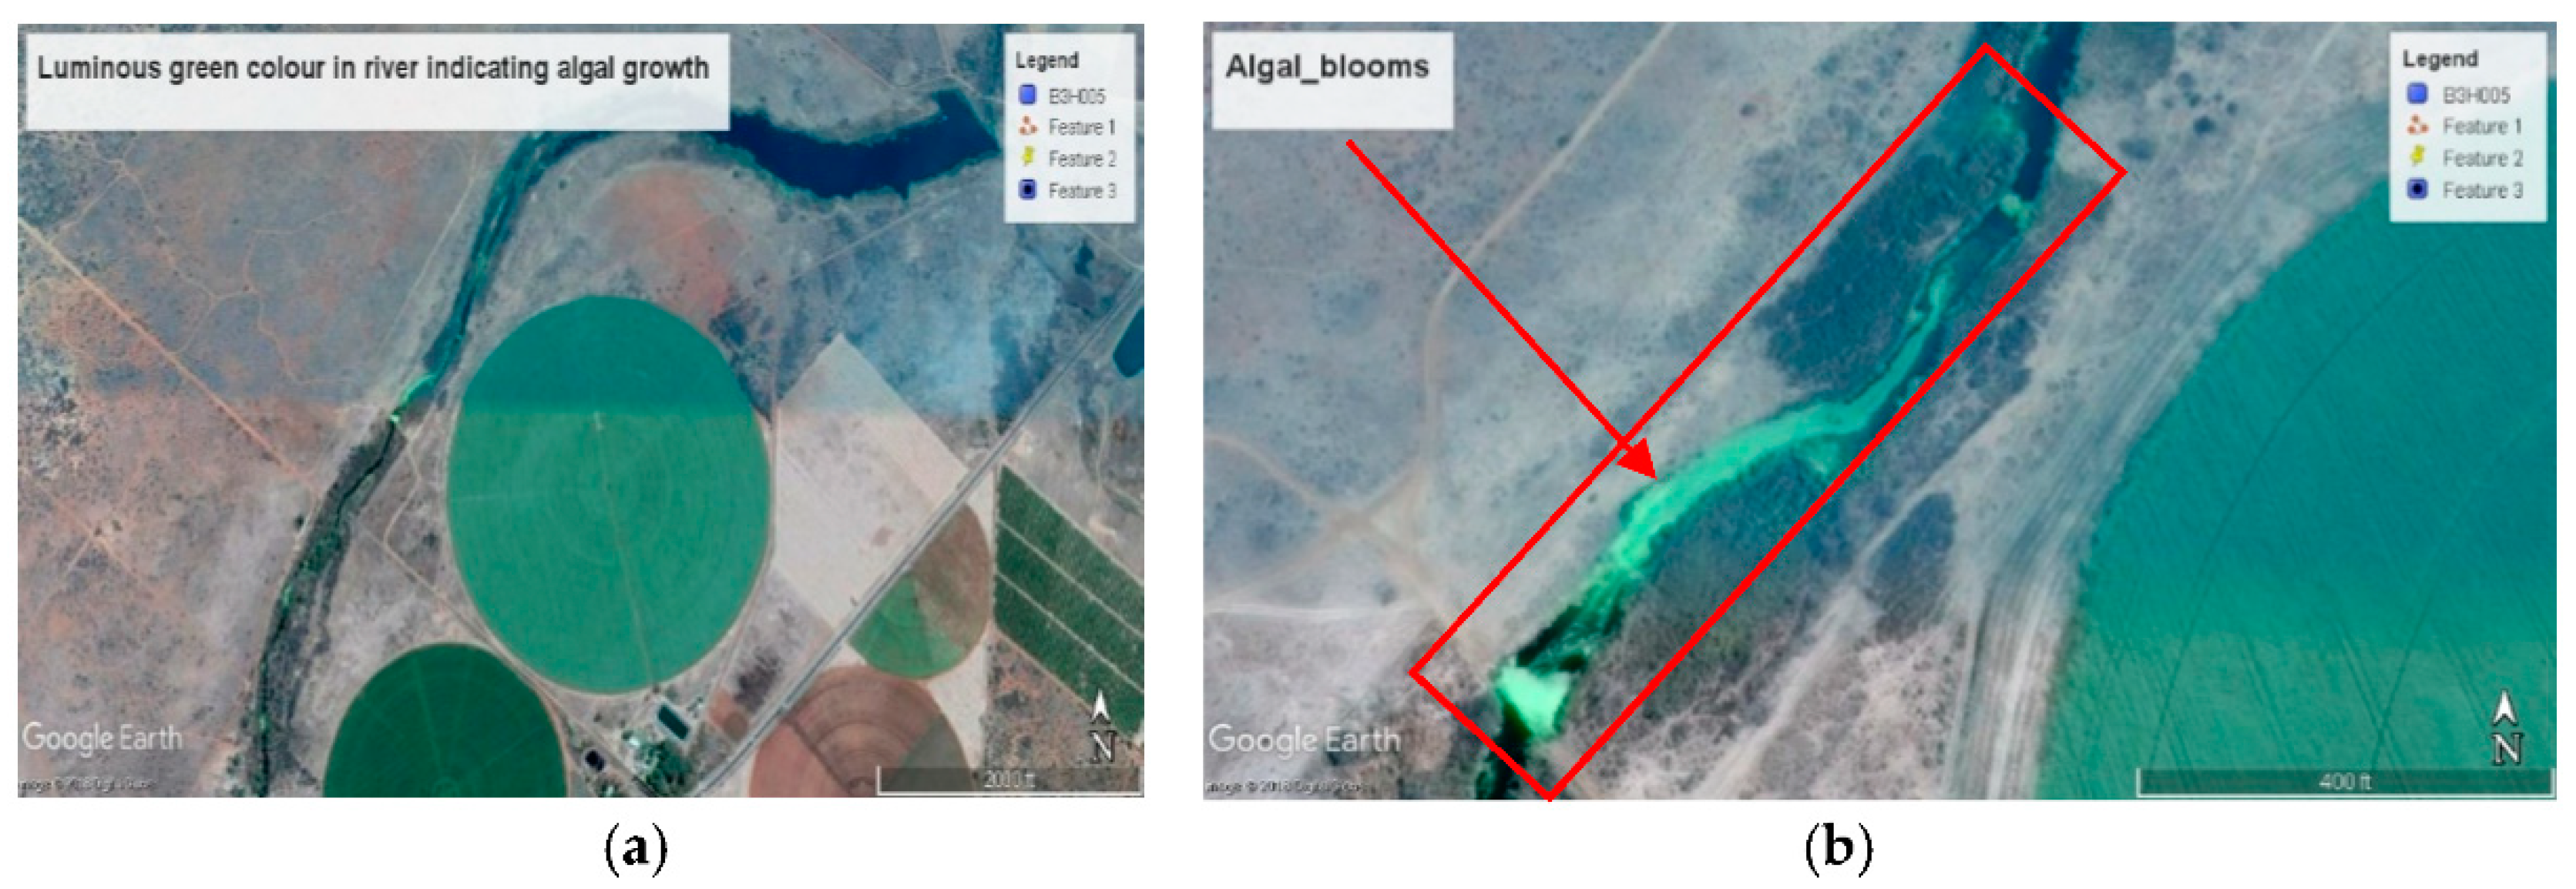
4-P concentrations were similar to the Moses River with higher values in the summer months than winter, and were more often than not above the eutrophication threshold. An interesting observation that we made upon closer inspection of the Elands River in Google Earth is the visible eutrophication (
Figure 10). The luminous green color of the river close to the area of intensive irrigation is indicative of algal blooms.
The NO
3-N concentrations for all river samples remained below the eutrophication threshold for the entire sampling period. The Elands River, sampled close to the Flag Boshielo Dam, had no measurable NO
3-N throughout the study. The Moses River Point 2 samples showed the same increases and decreases in NO
3-N concentration as its upstream counterpart. Similar to the dams, a lag in NO
3-N concentration changes between Moses River Points 1 and 2 was observed. The ARC-Loskop Research Farm storage dam had higher NO
3-N concentrations than the Loskop and Flag Boshielo Dams, however, for a period, there was a drop in concentration. A possible reason for this is that the longer residence time of water stored in dams enhances denitrification and the burial of organic N in sediments [
47]. Inorganic N can also be assimilated by photosynthetic organisms [
48].
The EC measurements for the Moses River Point 2 and Elands River were often in the acceptable category and were never elevated enough to exceed the tolerable threshold. Moses River Point 2 and the Elands River, however, had higher EC values than Moses River Point 1. Moses River Point 1 was sampled near a human settlement with no agricultural activity in close proximity. Moses River 2 is surrounded by only agricultural activity and generally had a higher EC than the other river samples for most of the sampling period. Drainage canal DE10 is in close proximity to Moses River 2 and likely discharges into this river. Sources of salinity entering the Elands River could be the intensive agricultural activity as well as the WWTW in the town. The pH of the rivers always stayed within acceptable limits, except for Moses River Point 1 in June 2018, which fell below the lower limit. This was consistent with what was observed for the Loskop and Flag Boshielo Dams. Similar to the dams, the rivers had higher pH values in summer than in winter.
3.5. Irrigation Canal Water Quality
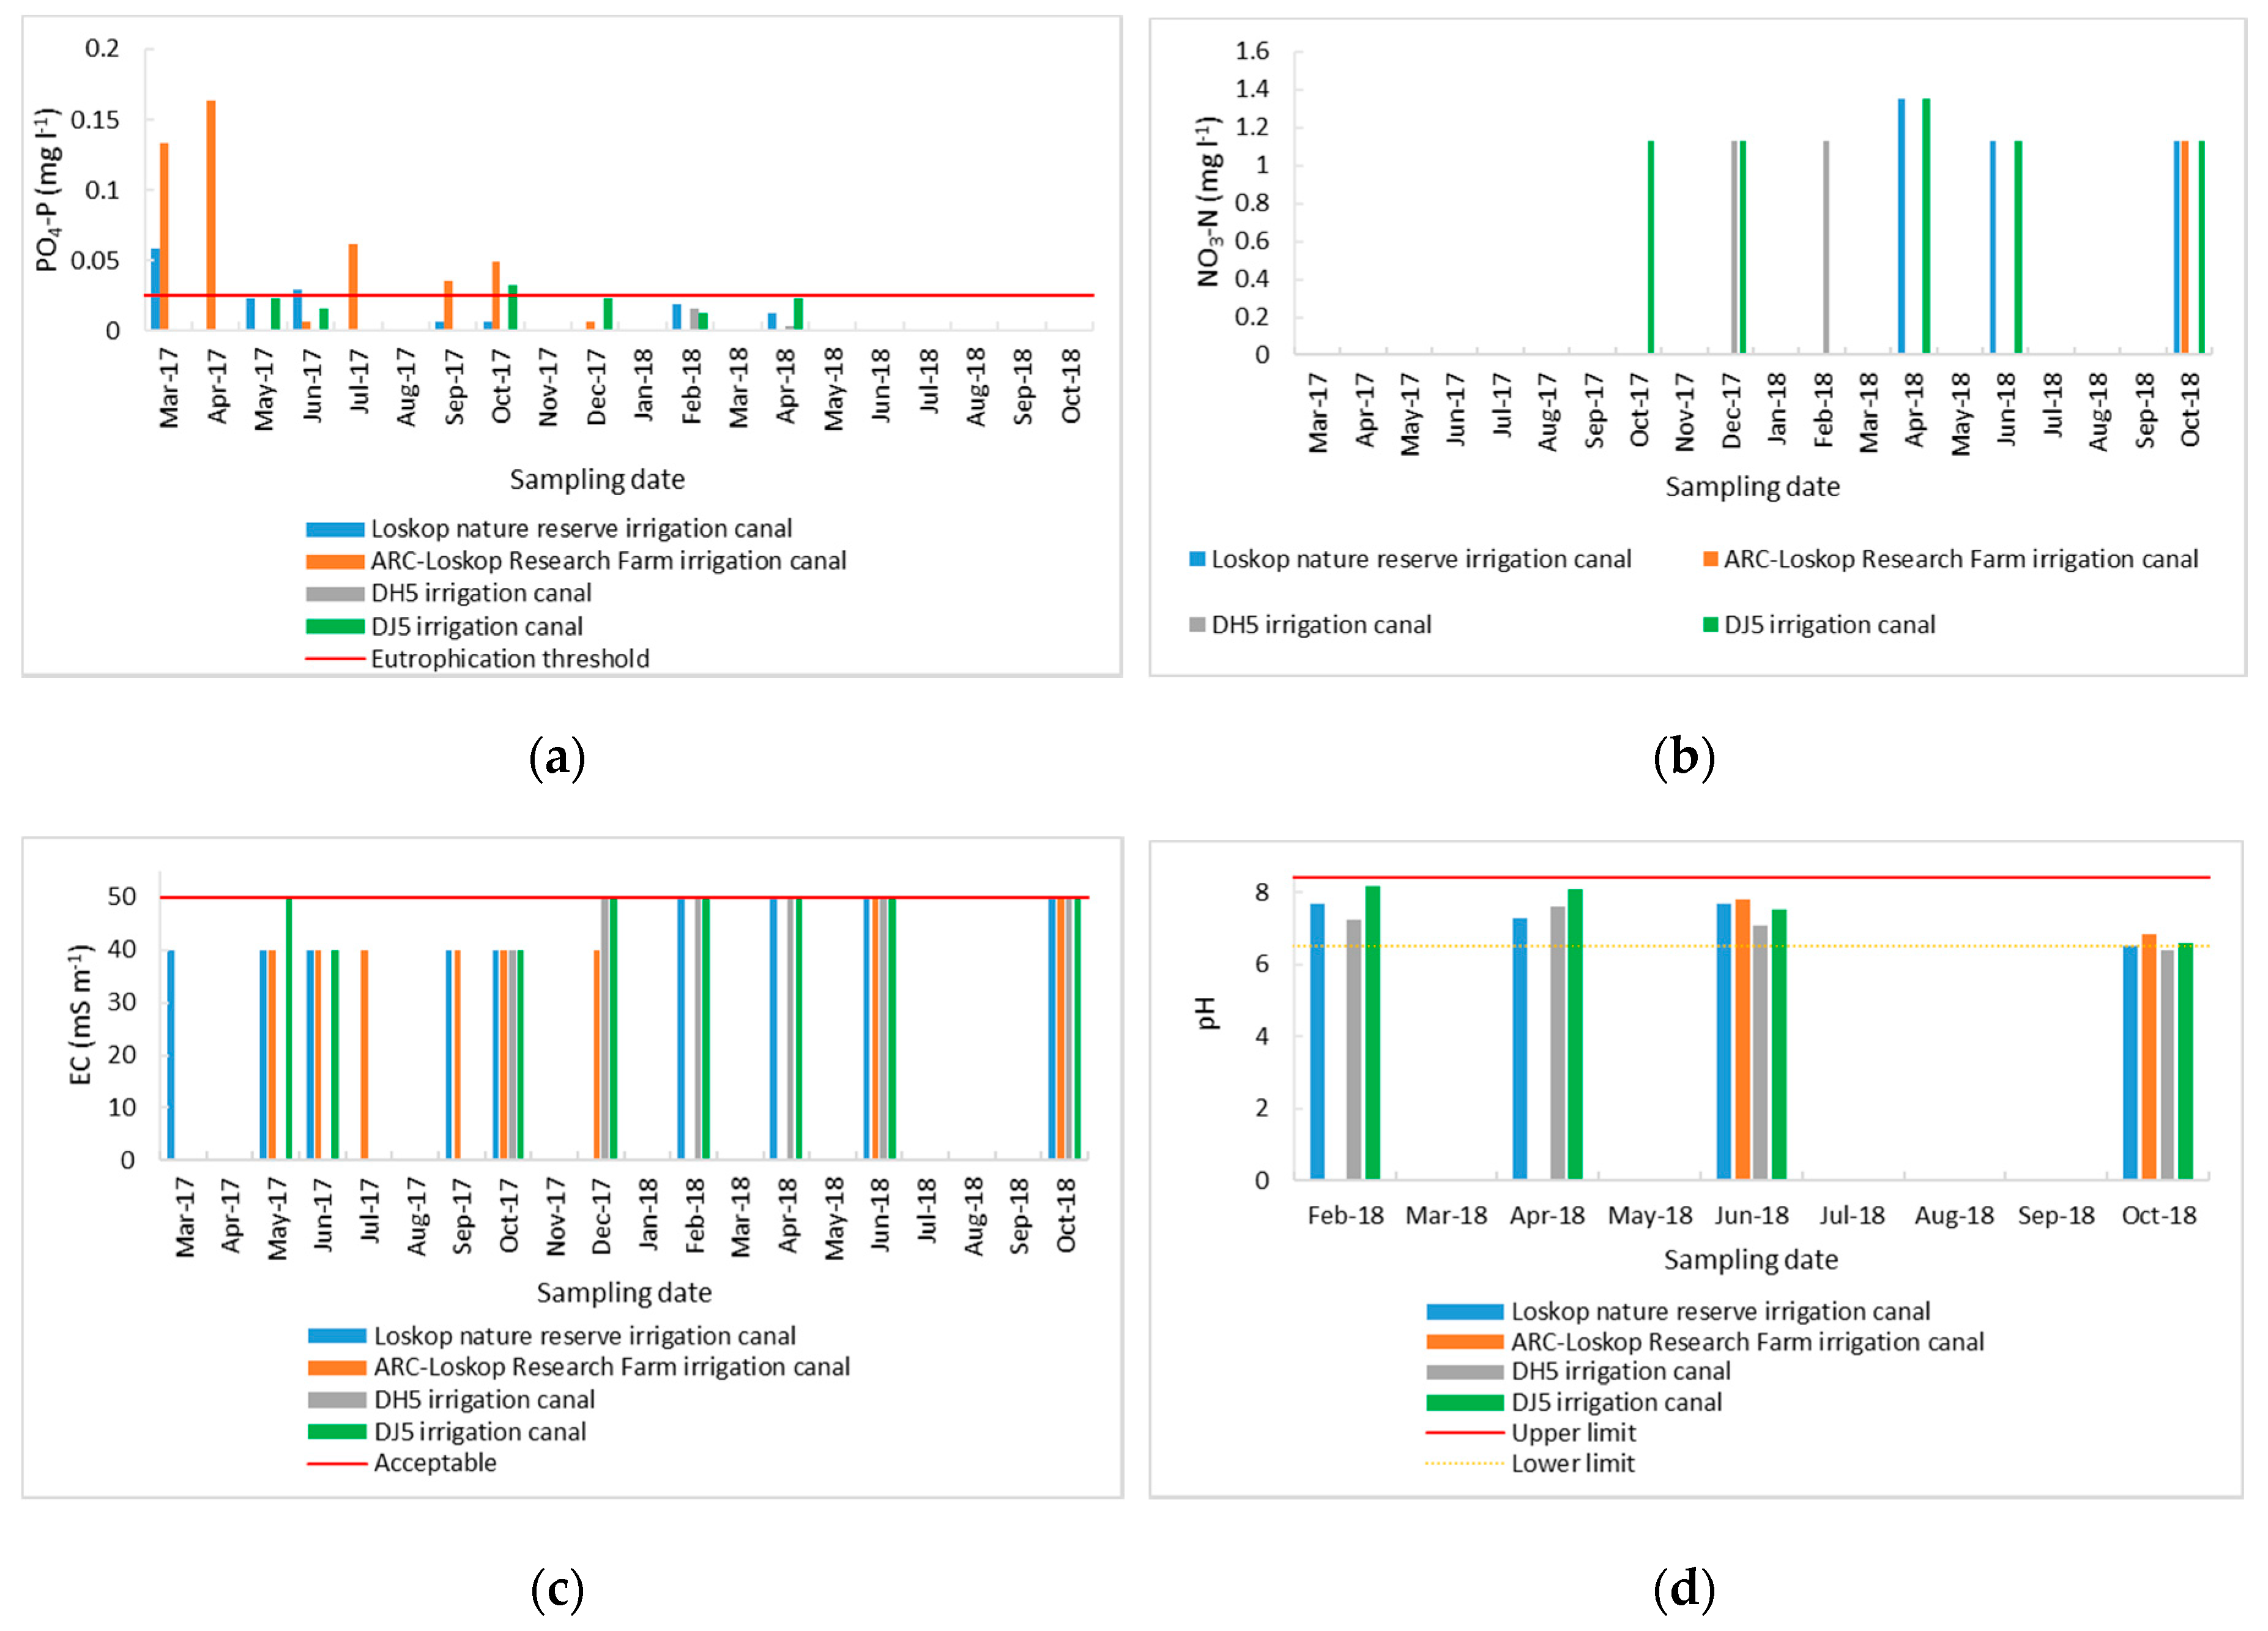
The DJ5 irrigation canal and the ARC-Loskop Research Farm irrigation canal are the only two canals that had PO
4-P concentrations higher than the eutrophication threshold (
Figure 11). This was, however, only at the start of the sampling campaign. After that point, all samples remained below the eutrophication threshold. This corresponded to the water the irrigation canals received from the Loskop Dam, which had PO
4-P concentrations below the eutrophication threshold for this period. It was unexpected that at times, lower PO
4-P concentrations were measured in DH5, which is closer to the Flag Boshielo Dam than DJ5. This is puzzling because DJ5 receives its water from the Loskop Dam, which has lower PO
4-P concentrations than the Flag Boshielo Dam. Similar to the storage farm dam, the irrigation canal water quality did not always reflect the water received from the Loskop Dam. It appears that PO
4-P is entering the DH5 and DJ5 irrigation canals from another source after being fed from the Loskop Dam.
All irrigation canal NO3-N concentrations were below the eutrophication threshold through the sampling period. The only samples that had measurable NO3-N concentrations were the DH5 and ARC-Loskop Research Farm irrigation canals, but these were always below 2 mg L−1. The irrigation canal on the ARC-Loskop Research Farm only reached that concentration in October 2018. The DH5 irrigation canal showed higher NO3-N concentrations in the summer months, which was not observed in the Loskop Dam. The DJ5 irrigation canal stayed constant for almost the entire sampling period, with a dip in concentration in February 2018.
The EC of the irrigation canal samples were consistently in the tolerable category, falling into the acceptable category at some stages, but as values were often close to or on the tolerable threshold, this variable should be monitored carefully due to the effect elevated salinity may have on crop yields. These EC values were a reflection of the water the irrigation canals received from the Loskop Dam. The pH of the irrigation canals stayed within acceptable limits apart from DH5, which dropped slightly below the lower limit in October 2018. All irrigation canals showed a decrease in pH in October 2018. This was probably due to the decreased pH of the Loskop Dam in June 2018 with a lag in the decrease observed in the source and the irrigation canal water.
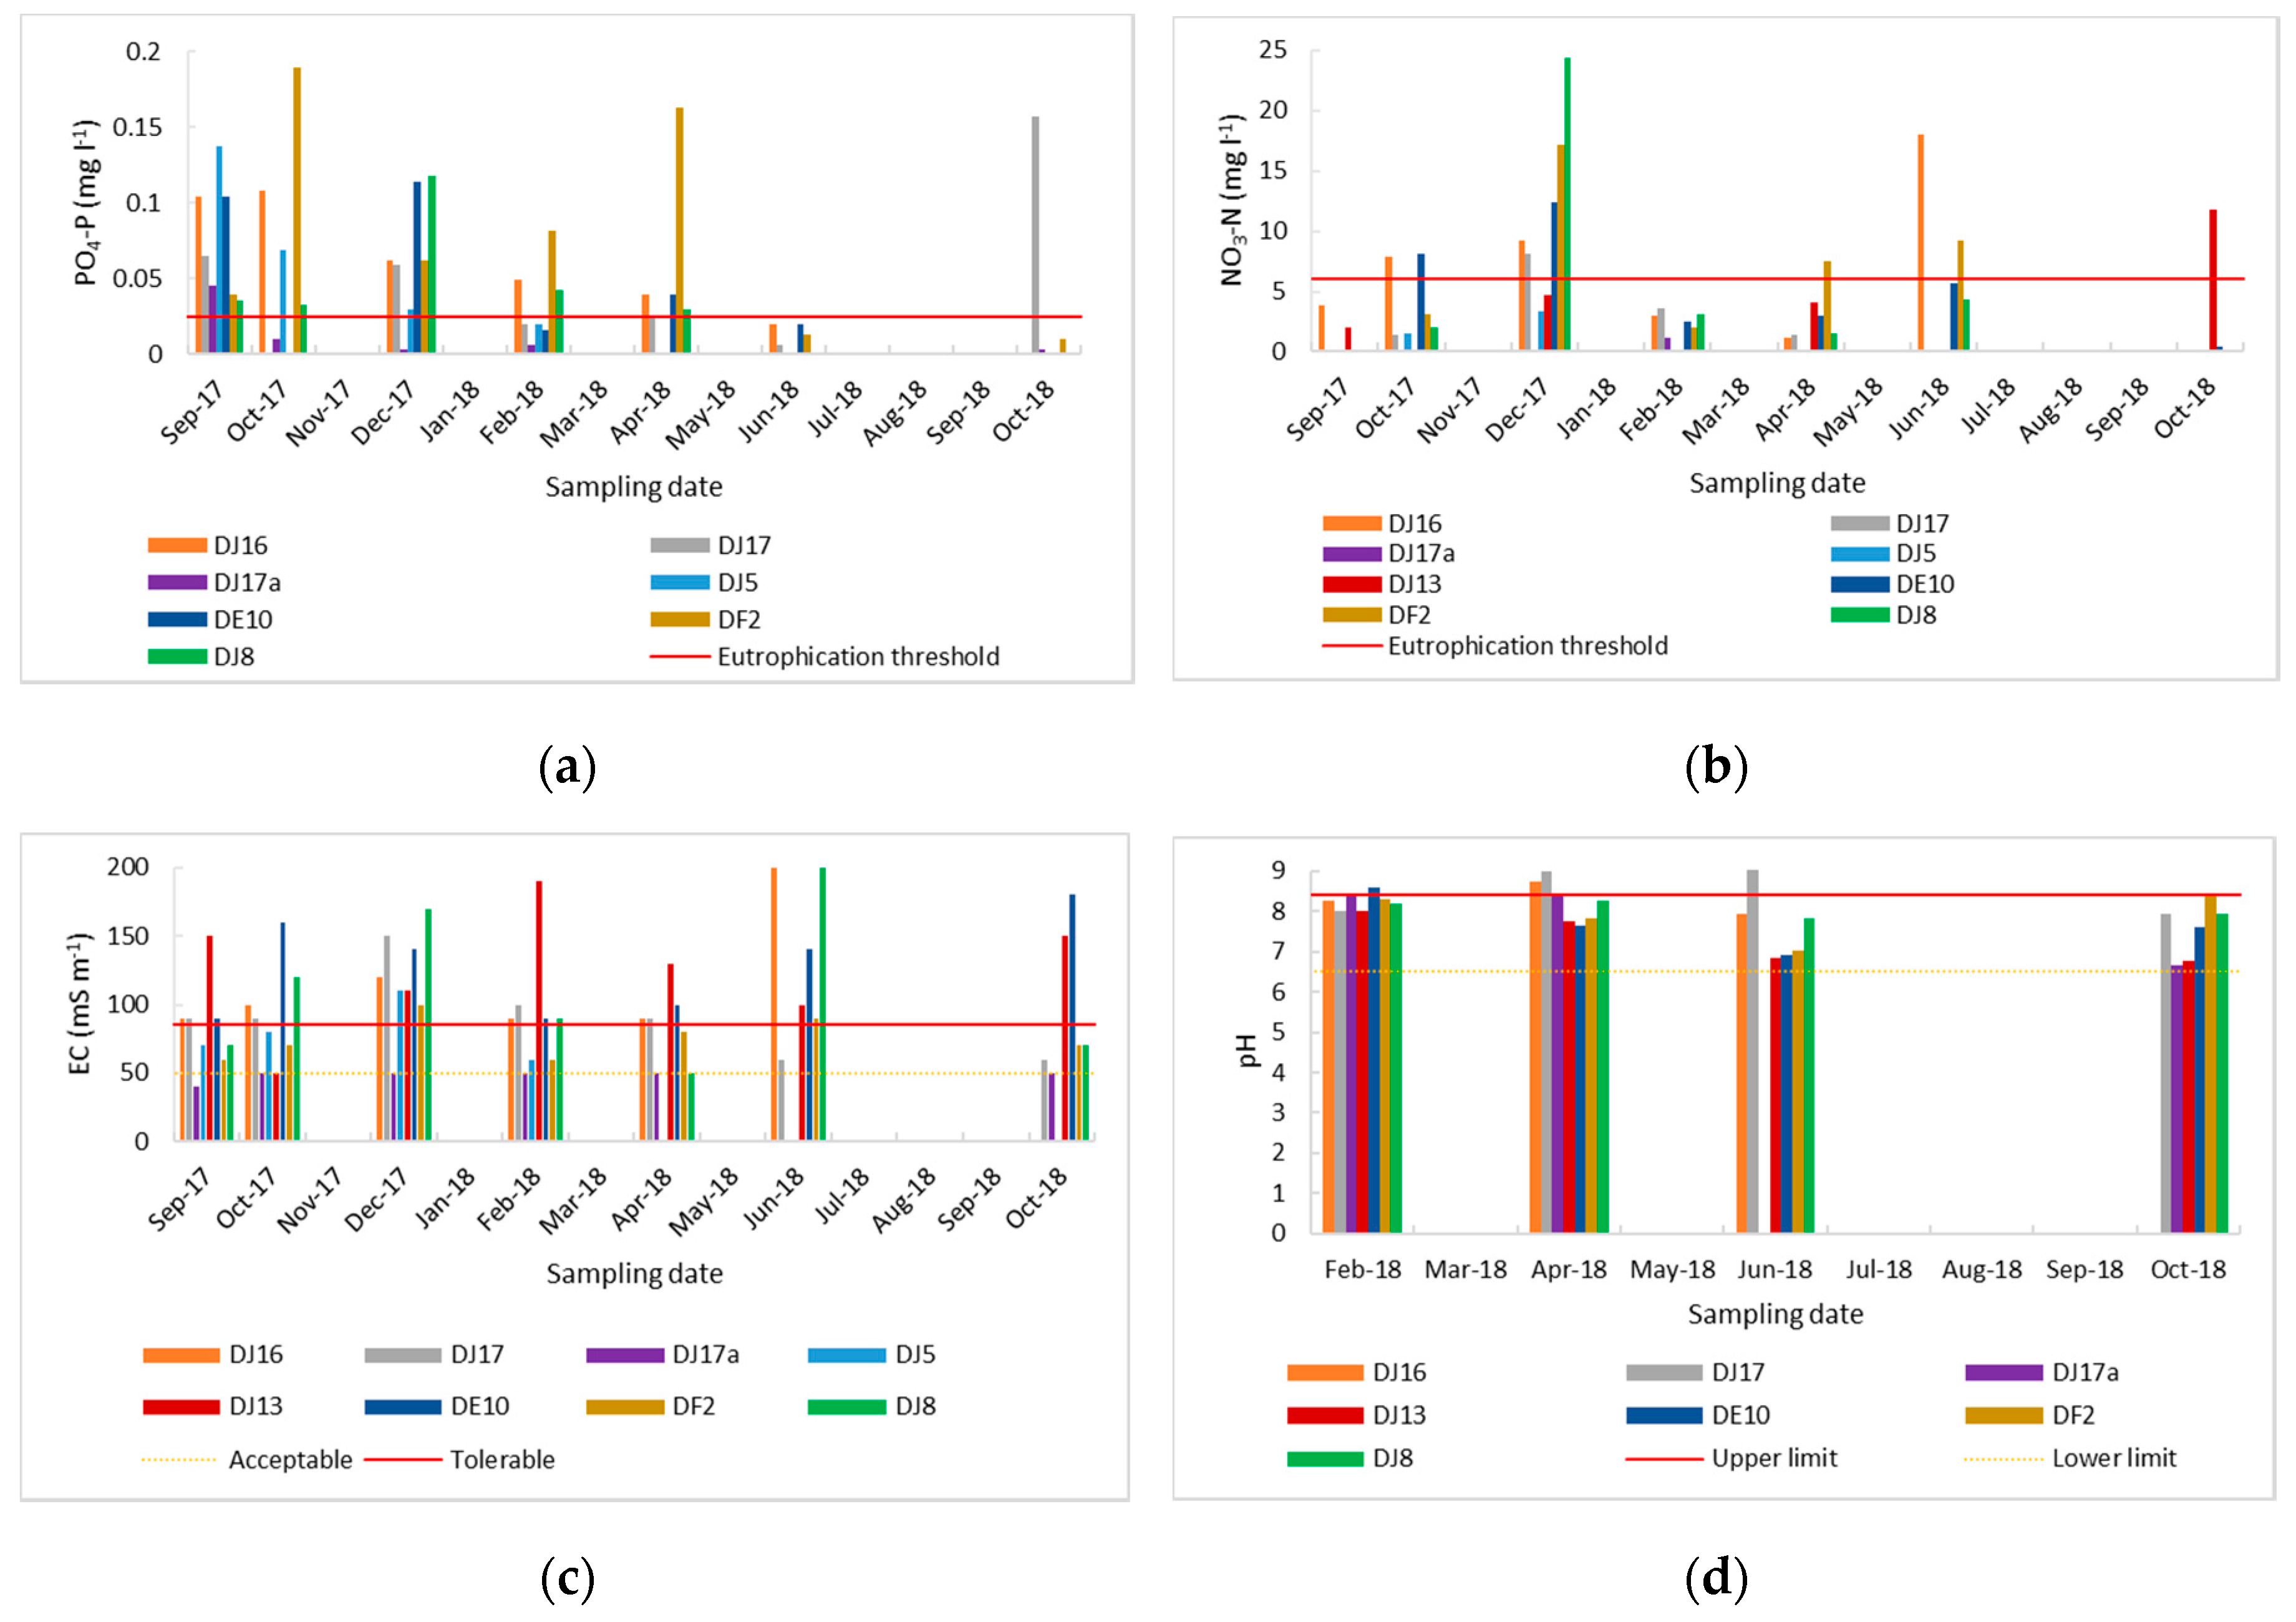
3.6. Drainage Canal Water Quality
The general trend observed was higher PO
4-P concentrations in the summer rainfall months than the drier winter months (
Figure 12). Peaks in concentrations that stand out are during 17 October, 17 December, 18 April, and 18 October. All of these, apart from April, had the highest rainfall months during the sampling period and April followed three of the higher rainfall months. Excess soluble PO
4-P is therefore being flushed out of the fields during the rainy months. The PO
4-P concentrations of DF2 were considerably higher than the other drainage canals. Livestock were observed in a fenced off area close to this drainage canal, which could have influenced the PO
4-P concentration in any runoff that was exported from this area to DF2. Another possibility is that these animals could have been allowed to graze near the canal, resulting in exposed soil surfaces or excretal returns directly into the drainage canal. The presence of grazing animals are known to exacerbate P losses by soil treading damage, ripping/overgrazing pasture, and defecation [
49]. Other drainage canals that had PO
4-P concentrations higher than the eutrophication threshold for the majority of the sampling period were DJ16 and DJ8, which were close to where citrus and field crops are produced. Although the drainage canals had high PO
4-P concentrations posing eutrophication risks, they were well below the effluent discharge standard of 1 mg L
−1 [
50].
Drainage canal DJ13 was the anomalous sample (
Table 3). Since October 2017, these PO
4-P concentrations were much higher than any of the other drainage canals in the study area. This drainage canal is situated outside a processing plant on a citrus farm and there is a citrus retailer close to this sampling point. Phosphates have known use in the processing and preservation of fruits and to protect the color of fresh fruits and vegetables that are to be directly consumed [
51]. This could possibly be the source of the high concentrations consistently measured in this drainage canal. The data from DJ13 were removed from the graph so the other results could be seen more clearly.
The NO
3-N concentrations from the drainage canals showed two clear spikes above the eutrophication threshold. The first spike, recording the highest NO
3-N concentrations, occurred in December 2017 and was likely due to a flush of nutrients with summer rainfall after the summer crops had been fertilized (the highest rainfall month as seen in
Figure 7). The second, less pronounced, spike occurred in June and was most likely caused by the export of nutrients through drainage water after the winter crops had been fertilized. Although NO
3-N concentrations were high in these samples, at times higher than the effluent discharge standard of 10 mg L
−1 [
50], the high NO
3-N concentrations in the drainage canals did not appear to influence river water concentrations much since NO
3-N concentrations of the rivers were always below the eutrophication threshold. The highest NO
3-N concentration were observed in DJ8, where citrus and field crops were noted to be growing close by, in December 2017. The second highest concentration was DF2. The N export here is likely from the nearby livestock. The drainage canal DJ16 also showed concentration spikes in December and June. Citrus and field crops were visible in this area and fertilization could explain these spikes. Due to very low flow in the drainage canals, flow volume and PO
4-P and NO
3-N loads could not be measured and it is acknowledged that high concentrations do not necessarily translate into high pollutant loads.
Electrical conductivity in the drainage canals was generally above the tolerable threshold, with the exception of DJ17a and DF2, which were below the tolerable threshold for a large part of the sampling period. The EC spikes (December and June) corresponded to the NO
3-N concentration spikes, which can possibly be explained by the application of chemical fertilizers, and their subsequent export into the drainage canals. Irrigating with water high in salts can result in decreased crop yields [
36]. The high EC in drainage canal samples was not seen in the rivers, which were clearly able to dilute the irrigation return flows and had EC levels below the tolerable limit.
The pH of most of the drainage canals were within acceptable limits for the sampling period. The only sample that had a high pH for the majority of the sampling period was DJ17. Drainage canals DJ16 and DJ17a had pH levels above the upper limit in April 2018. Although salt-containing irrigation return flows lead to increased pH levels, a possible reason that this confluence of canals showed higher pH levels than other drainage canals could be due to liming by the farmers to prevent soil acidification. Some of this lime could have been transported with soil in surface runoff or by erosion. Although the pH is high for these drainage canal samples, the pH of the river samples remained within the acceptable limits.
3.7. Theoretical Calculations of Potential P Pollutant Loads from Irrigated Agriculture Versus Wastewater
South Africa faces the challenge of many WWTW being dysfunctional. It is therefore often difficult to pinpoint the source of pollution in a catchment and this is likely the reason that agricultural contributions have widely been assumed as negligible. To date, there is a lack of information regarding the contribution of P loads from agriculture relative to wastewater in South African catchments. A theoretical calculation was therefore done to predict potential nutrient losses from agriculture compared to what we see as the other major threat in the catchment from a nutrient enrichment perspective, namely WWTW. According to DWA, irrigated agriculture in the Middle Olifants accounts for approximately 50,000 ha [
52]. Calculations were done assuming the irrigated crop profile in the Loskop area (
Table 4) is applied to all agricultural activity in the Middle Olifants, and that farmers apply recommended P fertilizer rates. Any contributions from animal waste were not considered. From this, an estimated 1,254,000 kg P yr
−1 is added via inorganic fertilizer. Assuming a leaching/runoff loss of 10% [
53], this value becomes 125,400 kg P yr
−1 polluted. Using annual flow from the Loskop monitoring station (B3H017), which is 1193 × 10
6 m
3 (averaged over the last 10 years), an average concentration of 0.10 mg PO
4-P l
−1 would result in the water flowing through the catchment. The predicted concentration at the Flag Boshielo Dam, based on annual flow data from monitoring station B5H004, which is 647 × 10
6 m
3 (averaged over the last 10 years), would be 0.19 mg L
-1. In comparison to measured values, the average concentration measured in the Flag Boshielo Dam was 0.05 mg L
−1, however, from March until September 2017, concentrations of 0.1 mg L
−1 were measured.
Due to the lack of information on the performance of WWTW in the catchment despite extensive searching and correspondence, a number of assumptions also needed to be made to estimate the maximum contribution of P from wastewater. The population of the Middle Olifants is approximately 366,000 [
52] and according to Wiechers and Heynike [
55], the average quantity derived from human excreta is approximately 0.47 kg P capita
−1 yr
−1, which is similar to the value of approximately 0.49 reported by Metson et al. [
56] for the United States. This results in an estimated P load from wastewater of approximately 173,500 kg P yr
−1 in the catchment. Using annual flow from the Flag Boshielo monitoring station (B5H004), this results in a concentration of 0.27 mg L
−1.
Based on these calculations, untreated wastewater has the potential of leading to even higher levels of P pollution than irrigated agriculture in the catchment. The 10% leaching/runoff fraction assumed represents a maximum value, so the proportion of P pollution from wastewater relative to irrigation could potentially even be higher in reality than these results reflect.
4. Discussion
Most of the commercial laboratory results corresponded well with our measured values, particularly for PO
4-P, enabling high confidence in our monitored results. A comparison of our monitored data with DWS long-term data for the Loskop and Flag Boshielo Dams revealed that our PO
4-P measured values were higher than DWS, while NO
3-N showed the opposite trend. A concern is that the monitoring study picked up elevated concentrations of NO
3-N in the Loskop Dam from April 2018, of which DWS does not have a record. It is also concerning that PO
4-P concentrations from the monitoring study do not match well with DWS data, especially since DWS data reflects water of a better quality and not at eutrophic levels. A possible reason that DWS generally measured higher NO
3-N is because they measure NO
3-N + NO
2-N, while our monitored values are only NO
3-N. Nitrite (NO
2−) was not measured in monitored samples as it is widely assumed to be transient in the environment [
57] and was therefore assumed to only be present in negligible concentrations. This variable should be considered, in addition to NO
3-N, for future work. Since 2018, however, NO
3-N was detected in our monitored study but not in DWS data, which warrants further investigation. Comparisons of additional monitored sites close to DWS monitoring stations that have consistent data is necessary to further investigate these differences. Future work should involve conducting the same exercise to investigate discrepancies in other catchments in South Africa for quality control purposes and to ensure we do not miss any water quality threats.
It is concerning that DWS monitoring is infrequent and irregular. This limitation was also noted by de Necker et al. [
58], where there was patchy historical data obtained from DWS monitoring stations for their study site on the Lower Phongolo River. Another challenge is the delay in monitored data being made available on the DWS website. As of January 2020, data could only be obtained until May 2018 for the two dams. This is an issue because as stated in South Africa′s water policy, ′ongoing monitoring and assessment [is] critical to our ability to manage and protect [water] resources on the basis of sound scientific and technical information and understanding. Adequate information is essential for effective resource management and protection′ [
15]. Long-term water quality data is indispensable and is used globally to detect changes in water quality and catchment responses [
58]. Several monitoring stations were identified in the catchment that could not be used because data had not been captured in the last several years. It is imperative that this national asset is given more attention and resources to enable more frequent sampling to be conducted, preferably at more locations, to monitor the health and sustainability of South Africa′s water resources. For example, changes in nutrient concentration in the Loskop Dam are only detected later in the Flag Boshielo Dam, and frequent monitoring and recording would allow downstream water users to account for changes in water quality.
4.1. Reservoir Water Quality
The PO
4-P concentrations in the Flag Boshielo Dam were higher than or equal to the Loskop Dam for most of the sampling period, which indicates that there is upstream loading of P from agricultural, domestic, and industrial activities influencing water quality in the Flag Boshielo Dam. It is also probable that there is an evapoconcentration effect. The decrease in PO
4-P concentrations during the rainy season is contrary to what is anticipated because flush events are expected to increase PO
4-P concentrations during the wetter months [
19]. Nutrient concentrations also increase with rainfall intensity due to higher levels of sediment erosion and re-suspension [
59]. Low intensity rainfall generally exports less nutrient-heavy sediment than high intensity rainfall, however, soil antecedent water content and permeability characteristics also influence sediment export [
46]. Higher rainfall, however, leads to the dilution of nutrient concentrations [
33], which may be the dominant process leading to lower PO
4-P concentrations in the rainy season. The reliance on rainfall for nutrient dilution, however, becomes problematic during periods when rainfall is low especially since droughts are a consistent feature in South Africa [
60].
Although the NO
3-N concentrations were low, this and similar water quality constituents of these reservoirs need to be continuously monitored because as they age, their capacity for nutrient and sediment retention can also change [
61]. Management of N pollution is not only necessary for eutrophication mitigation purposes. Emissions of greenhouse gases (GHGs) is enhanced by the availability of dissolved nutrients, specifically N, and organic carbon, which makes farm dams, which are heavily influenced by local agricultural activities, a potential source for relatively high emission rates [
26]. A study by Ollivier et al. [
26] showed that constructed farm dams emit 3.43 times the mass of CO
2-e m
−2 (carbon dioxide equivalent emissions per m
2) as their larger reservoir counterparts.
A concern that needs to be monitored and attended to is potential infiltrability problems associated with sodicity and salinity in both dams. Water quality for irrigation falls into the moderate risk for infiltrability problems and appears to be worse in the Flag Boshielo Dam compared to the Loskop Dam. Elevated pH, which was observed in the summer months, can enhance eutrophication as alkalinity has a direct impact on P release from sediment, with a higher pH possibly resulting in more P released in water [
62]. The pH of water is also very important in sediments where P retention depends on iron (Fe). As the pH increases, the P binding capacity of the oxygenated sediment layer decreases as a result of competition between hydroxyl ions and P ions. In the sediment of eutrophic water bodies, photosynthetically elevated pH can result in more P, which is loosely sorbed to Fe, and increases release rates [
63]. A drop in pH was observed towards the end of the sampling campaign and this must be monitored to ensure the pH remains above the lower limit.
The ARC-Loskop Research Farm dam was the anomalous sample with the results for all variables deviating from the two large reservoirs sampled. Agricultural farm storage dam water quality is the result of the complex interaction between rainwater composition, catchment weathering processes, and groundwater inputs such as dissolved and particulate materials during a storm flushing event [
46]. The nutrient concentrations of the farm storage dam were expected to closely resemble the water quality of the incoming water, however, the storage dam water was not a reflection of the Loskop Dam water quality. It appears there was another source of water entering the farm storage dam apart from the water from the Loskop Dam. It also possible that microorganism activity in the dam change the water quality over time. The difference between the farm storage dam water quality compared to the source (Loskop Dam) could be a result of evapoconcentration and an inflow of groundwater [
46]. The farm storage dam water could have also been contaminated by sediment runoff. While these effects would be diluted in a river system, it is compounded through continuous retention in a farm storage dam [
46]. Based on these observations, it is recommended that farmers analyze their own water in storage dams to guide irrigation management decisions. This is especially important if the water has been stagnant for a lengthy period and microorganism activity has had an opportunity to change the water quality variables.
4.2. River Water Quality
The general trend was that PO
4-P concentrations were elevated in the summer months and lower in the winter months. These results complement the findings of Jonnalagadda and Mhere [
64], where higher PO
4-P concentrations in a Zimbabwean river were also observed in the summer months. A possible reason for lower PO
4-P concentrations in winter is that during these months with low rainfall, there are periods of stagnation, which allows filamentous algae to deplete the PO
4-P in the water bodies [
49]. Concentrations were mostly above the eutrophication threshold, even in the cooler, drier months. This requires intervention and mitigation from government to land owner level, and due to the nature of the issue, may require the setting and achieving of multi-generational sustainability targets.
Despite the high concentrations of NO
3-N released into the drainage canals, the concentrations were quite low in the rivers throughout the sampling period. River sediments provide a favorable environment for denitrifying bacteria and fungi [
65] with the presence of anoxic conditions and organic matter for denitrification [
66]. Denitrification, organic matter burial in sediments, sediment sorption, and plant and microbial uptake can remove N from rivers and decrease the amount of N that gets transported into coastal waterbodies [
67].
There is evidence of a deterioration in water quality downstream from Moses River Point 1 to Point 2. It was expected that river water would have a lower pH due to mining activities upstream, however, it appears that as the study by Van Der Laan et al. [
6] postulated, salts from irrigation return-flows buffer the effects of acid mine drainage. At the pH of these rivers, the dominant carbonate species should be HCO
3− (bicarbonate), which can also neutralize acidity [
68].
4.3. Irrigation Canal Water Quality
The irrigation canal water quality did not always reflect that of the water it received from the Loskop Dam. The DJ5 irrigation canal had a higher PO4-P concentration than the other irrigation canals and it is possible that surface runoff containing elevated PO4-P concentrations entered this canal. Similarly, NO3-N was higher in the DH5 and DJ5 irrigation canals than in the Loskop Dam. It is plausible that nutrients were concentrated due to evaporation, arose from the decomposition of algae and aquatic plants, nutrient-containing runoff entered the canals during rainfall events, or that deteriorations in the canal structures could lead to subsurface water from the surrounding soils entering the irrigation canals. The NO3-N concentration of the irrigation water should be taken into account when designing a fertilizer program. For example, irrigating 1000 mm of water with 1.2 mg N l−1 will add 12 kg N to the soil.
The EC values were often close to or on the tolerable limit and this should be monitored carefully due to the effect elevated salinity may have on crop yield as irrigating with water high in salts can result in decreased crop yields [
36]. Citrus species are classified as sensitive to salinity, grapes and maize are moderately sensitive, while wheat and cotton are classified as moderately tolerant and tolerant, respectively [
69]. The pH of the irrigation canal samples was generally higher in summer months, likely as a result of irrigation return flows.
Apart from the eutrophication risk in the canals in this study area, there is also a threat from pathogen contamination, which was expressed as the primary concern for many farmers regarding water quality at a meeting with the Loskop Irrigation Board. This contamination is most likely caused by dysfunctional WWTW in the area. A study by Ijabadeniyi et al. [
70] concluded that the temperature and pH of a Loskop canal, along with samples taken from the Olifants and Wilge Rivers, were conducive to bacterial growth, which may promote the survival of pathogens in the water. The study found that all three water sources were contaminated by E. Coli and fecal coliform, indicators of fecal pollution, which is a public health concern for water used for agricultural purposes [
70], especially for crops where the harvestable portions come into direct contact with the irrigation water and they are consumed raw. A similar finding was observed in a study conducted by Wahed et al. [
71] on irrigation canal water in the Fayoum watershed in Egypt, where the irrigation water showed substantially elevated bacteria levels. While regular testing can be an economic burden, infrequent sampling can be dangerous [
72]. There is a definite need to test irrigation water more frequently for a wide range of constituents and online platforms to report surface water quality in real-time should also be developed to assist water users in the area.
4.4. Drainage Canal Water Quality
Although the drainage canals PO
4-P concentrations were below the effluent discharge standard of 1 mg L
−1 [
50], management practices to reduce P export should still be sought, and options to treat drainage canal water before it enters rivers using cost-effective means, such as natural wetlands, should be considered. The drainage canals show that the combination of fertilizer application and runoff events in summer have a larger impact on elevating PO
4-P concentrations than the low flow reduced dilution capacity effect in winter, which was seen in the dams.
Agricultural drainage from drainage canals/drainage ditches is receiving increasing attention as a conduit for nutrient pollution [
73]. It is important to keep monitoring these potentially problematic concentrations of PO
4-P being lost from drainage canals in routine monitoring programs. In a study conducted by Das et al. [
74], P in drainage water was identified as a major contributor to eutrophication in the downstream Florida Everglades ecosystem. A significant correlation was identified between P release and concentrations of amorphous iron (Fe) and aluminum (Al) in the sediment [
74]. This infers that P release in drainage canals may be dependent on soil type and associated mineralogy. Highly weathered soils, which are common in South Africa, have an abundance of Fe and Al oxides and soil analysis of fields could determine which farms would be prone to P release in sediment. Another factor that could influence P release is the amount of organic matter that is transported to the drainage canals with the sediment. Decomposition products of organic matter and P compete for the same sorption sites, resulting in increased soil solution P concentrations [
75]. Phosphorus loading to canals and subsequent P flux from accumulated sediment to overlying water is a concern as a potential source of P to downstream surface waters [
74].
The high NO
3-N concentrations in the drainage canals not being detected in the river water is most likely due to denitrification losses. A study by Stamati et al. [
76] concluded that denitrification was the main process responsible for buffering diffuse NO
3− pollution in Mediterranean drainage canals. A common electron donor for denitrification is pyrite (Fe
2S) [
77] and the role of pyrite in denitrification in this catchment is plausible due to the extensive coal mining in the Upper Olifants and mining activities in the Middle Olifants. Pyrite is ubiquitous in acid mine drainage (AMD)-affected streams [
78] and according to a study by Baeseman et al. [
78], denitrifying organisms are present and active in AMD-impacted stream sediments.
The high EC in the drainage canals is likely necessary as irrigators need to flush excess salts from their fields. In most instances, the water levels in the drainage canals were quite low indicative of efficient irrigation scheduling practices by producers in the area. Future work should involve analysis of major cation and anion concentrations in the drainage water to determine what salts are being leached, and ideally the predominant fraction will include minimal beneficial plant nutrients from fertilizers if good irrigation practices are adhered to. In winter, however, it may have been unexpected to find water in the drainage canals, assuming accurate irrigation scheduling was taking place. No major problems associated with pH were identified in these drainage canals.
4.5. Theoretical Calculations of Potential P Pollutant Loads From Irrigated Agriculture Versus Wastewater
Although drainage canal load was not measured due to low flow, it is important to take heed of the fact that the majority of the drainage canal samples had concentrations that were above the eutrophication threshold for almost the entire sampling period. A theoretical calculation assuming that the bulk of P pollution comes from agriculture and wastewater, showed that 42% of the P load in this catchment could arise from irrigated agriculture and 58% from poorly treated wastewater, and both can theoretically result in river and dam concentrations above the eutrophication threshold. Future work should involve catchment scale hydrological modeling to better identify sources and quantify N and P losses more accurately. While pollution from agriculture can have dire consequences on downstream water quality, as already witnessed in many others parts of the world, South Africa and countries in similar situations will face even greater challenges if its catchments must deal with both pollution from agriculture as well as equally high P pollution from wastewater as result of failing infrastructure. While developed countries such as the USA and Australia really struggle with NPS nutrient pollution from agriculture, our calculation shows that less well-equipped developing countries might face an even bigger challenge in dealing with the problem if we cannot continue to treat our wastewater adequately. The theoretical wastewater concentration is lower than the discharge effluent for the WWTW in the area, which is 3 mg L
−1. The Green Drop report is produced by DWS and communicates information on the wastewater business of water services in South Africa, and the latest publicly available report noted that 10% of the country’s 824 WWTW were releasing clean water, while the rest were rated “critical” and in need of urgent repair [
79]. In Mpumalanga, 50 WWTW were investigated and three complied with the set standards of authorization, four were known to operate within their design capacity and most of them were overloaded and, in some cases, overflowing. Only six have emergency dams, therefore when there are breakdowns in the system, raw, untreated sewage flows directly into streams [
80]. According to the 2010/2011 Green Drop report, 58% of municipal plants were in a “high-to-critical” zone, which is a direct reflection of inadequacies in plant capacity, effluent quality, and technical skills [
80]. It is therefore imperative to get WWTW in working order to reduce P pollution of water resources in the catchment. Future work should involve monitoring nutrients upstream and downstream of WWTW and comparing points where drainage canals export effluent into the same rivers. Key pathogens, pesticides, and other endocrine disruption chemicals in water sources in this catchment should also be considered for intensive monitoring.
5. Conclusions
Eutrophication is clearly an issue in the Middle Olifants and P pollution is the most serious threat requiring urgent attention. The PO4-P concentration of the Flag Boshielo Dam was consistently higher than that of the Loskop Dam for the majority of the sampling period. Left unmanaged, this will become a long-term issue that will be near-impossible to rectify with current technology. Agricultural contributions to water quality deterioration needs to be addressed in order to improve the quality of South Africa’s and similar catchments around the world. Perhaps of greater concern, however, is the failing WWTW in the catchment, which could be the source of even larger pollutant loads than irrigated agriculture, in a system that is already at eutrophic nutrient levels. It may also be more cost-effective to target WWTW to reduce P pollution in the short term.
Water quality monitoring, especially in catchments with water quality issues, should be prioritized. Current monitoring intensity seems to be on the decline, likely as a result of budget constraints within South African government departments, however, increased sampling frequency by DWS is critical to manage water quality threats. Verification of DWS data is also important because DWS data often reflect water of a better quality than we monitored in our study. Regulations for wastewater treatment need to be enforced and policies to reduce the impact of agricultural activity on water quality need to be developed and enhanced, especially in intensively irrigated catchments.


