Limitations of Urban Infrastructure for the Large-Scale Implementation of Electric Mobility. A Case Study

 , ,
, ,
Abstract
1. Introduction
2. Background
2.1. Stakeholders
2.2. The Current State of Electric Vehicle Technology
2.3. Previous Research on the Impact of the Electric Vehicle on the Electric Network
3. Materials and Methods
4. Results
4.1. Global Data
4.2. Slow Charging Hypothesis
4.3. Semi-Fast Charging Hypothesis
4.4. Fast Charging Hypothesis
5. Discussion
6. Conclusions
Author Contributions
Funding
Acknowledgments
Conflicts of Interest
Abbreviations
| EV | electric vehicle |
| FEV | fully electric vehicles |
| FHP | fiscal power |
| GHG | greenhouse gas |
| HEC | high electricity price charging |
| HEV | hybrid electric vehicles |
| ICE | internal combustion engine |
| ICV | internal combustion engine vehicle |
| LEC | low electricity price charging |
| LV | low voltage |
| MV/LV | medium voltage to low voltage |
| NEDC | new European driving cycle |
| TOC | total vehicle ownership costs |
| VAT | value-added tax |
| V2G | vehicle-to-grid |
| WHO | World Health Organization |
Appendix A

| MV/LV Transformer Number | Fiscal Power (FHP) | ||||
|---|---|---|---|---|---|
| <8 | 8 – 11.99 | 12 – 15.99 | 16 – 19.99 | >20 | |
| 103.385 | 2 | 65 | 60 | 6 | 0 |
| 33.757 | 3 | 38 | 37 | 3 | 1 |
| 102.743 | 0 | 5 | 4 | 1 | 0 |
| 103.386 | 0 | 0 | 1 | 0 | 0 |
| 34.312 | 16 | 166 | 116 | 10 | 5 |
| 71.925 | 1 | 39 | 38 | 3 | 1 |
| 33.766 | 12 | 100 | 97 | 9 | 2 |
| 104.387 | 0 | 1 | 1 | 0 | 0 |
| 33.850 | 5 | 93 | 79 | 6 | 2 |
| 82.663 | 0 | 1 | 2 | 0 | 0 |
| 33.855 | 15 | 195 | 212 | 18 | 3 |
| 82.526 | 12 | 157 | 145 | 18 | 3 |
| 33.765 | 4 | 46 | 65 | 8 | 1 |
| 64.183 | 5 | 63 | 49 | 4 | 1 |
| 91.791 | 0 | 20 | 21 | 1 | 1 |
| 34.316 | 1 | 39 | 33 | 3 | 0 |
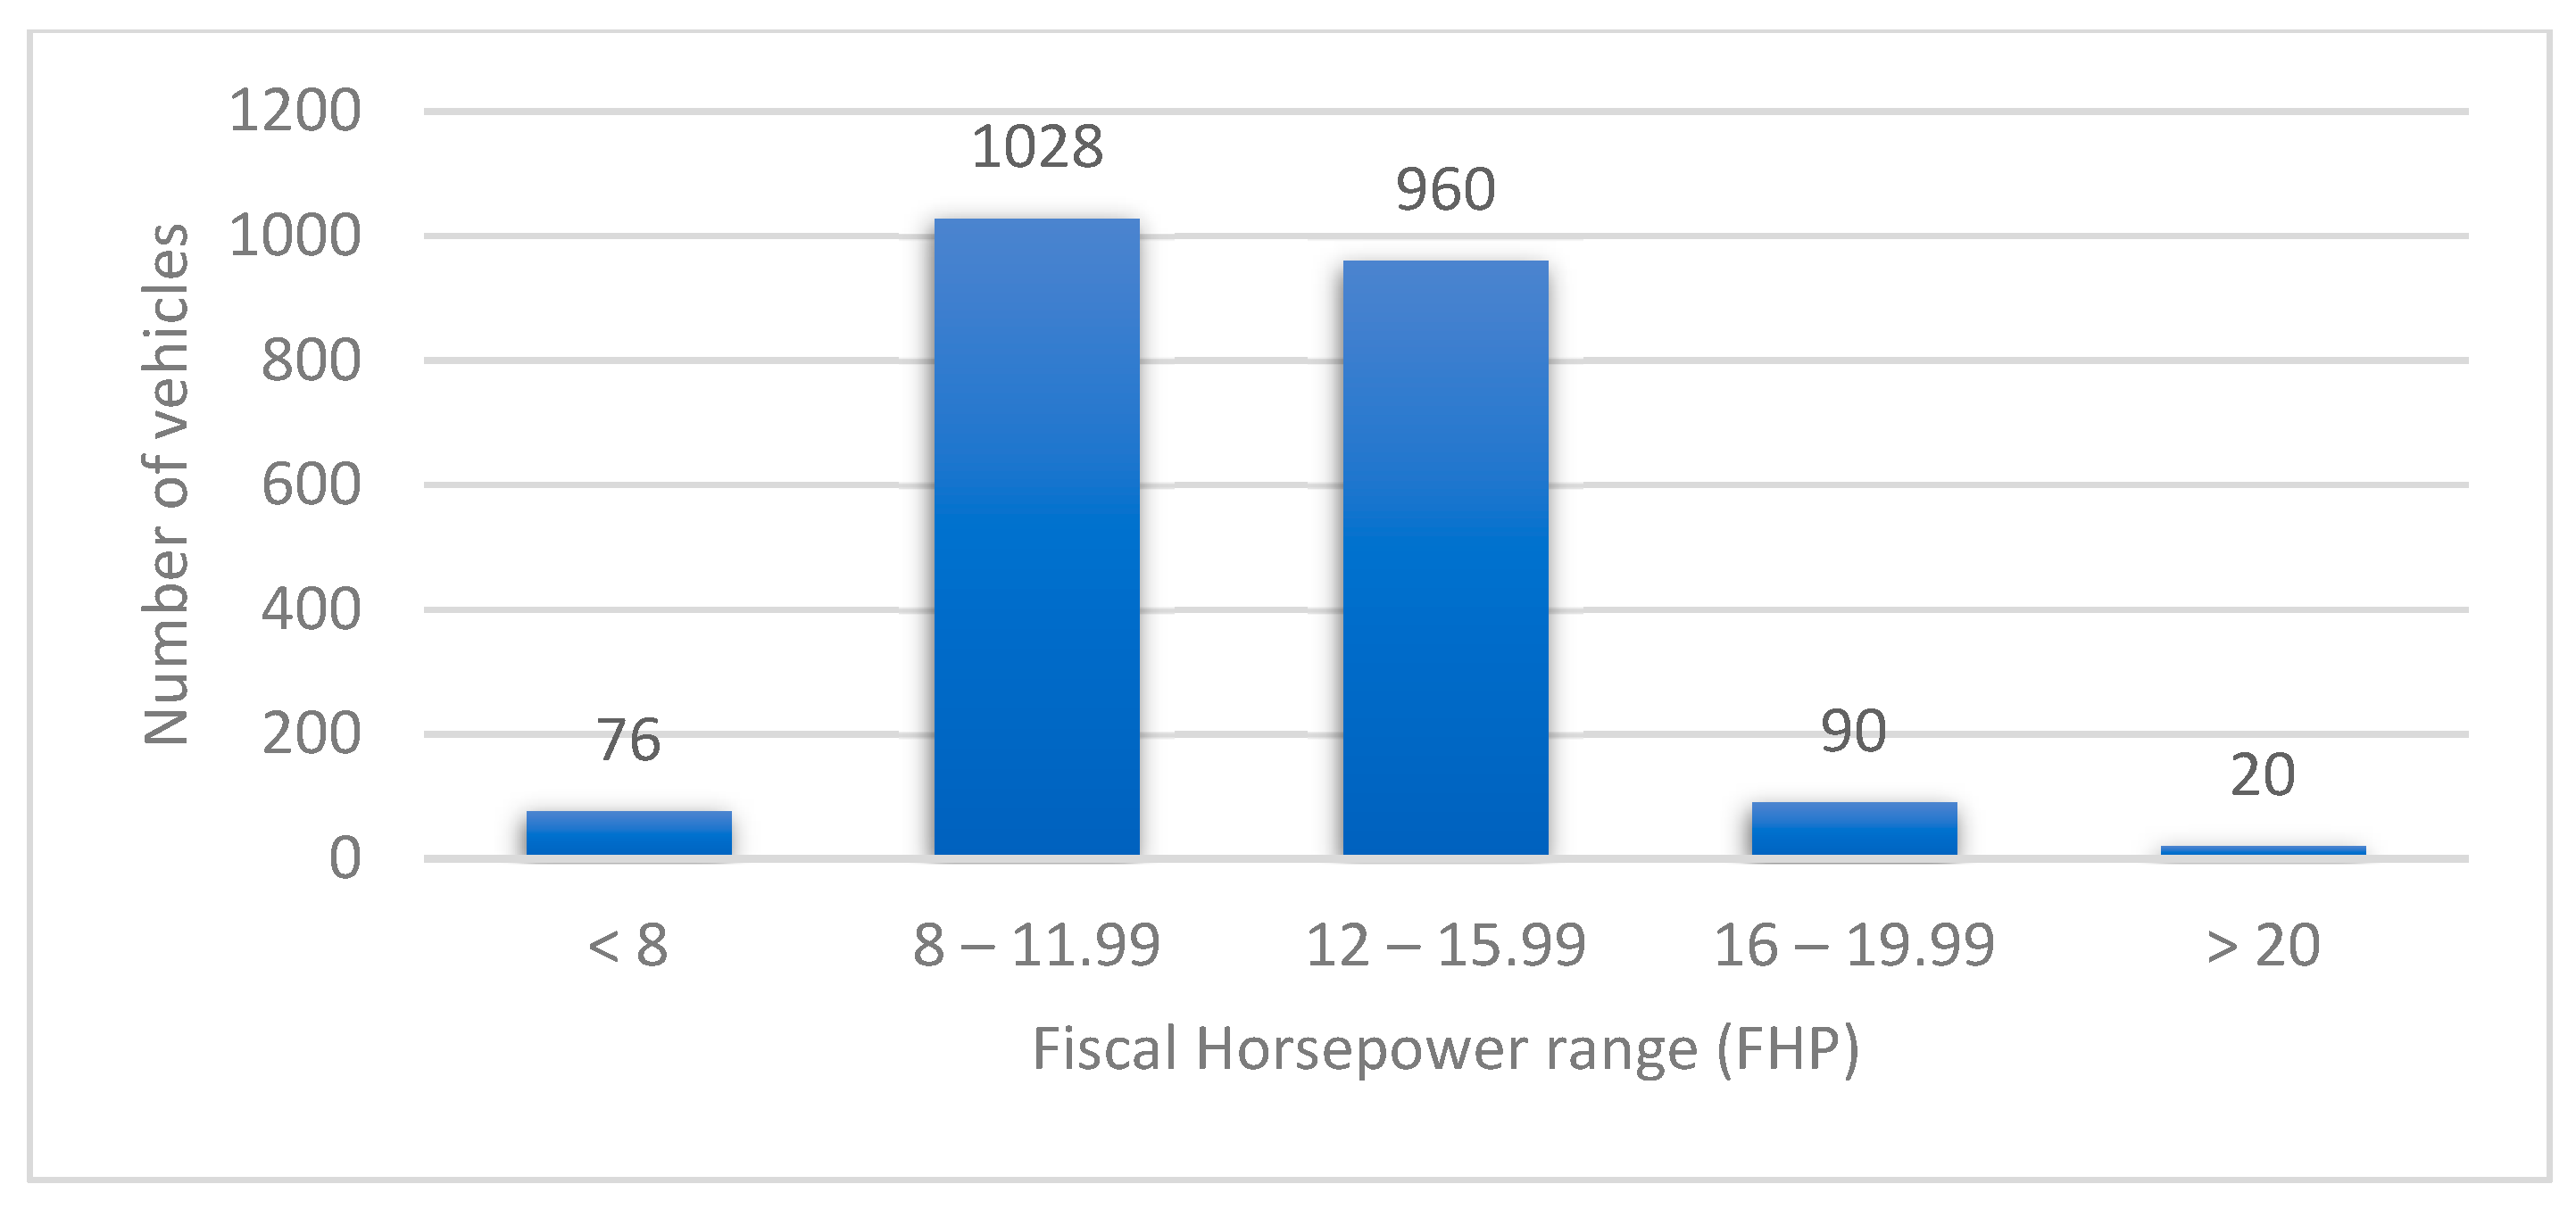
| TOTAL | 76 | 1028 | 960 | 90 | 20 |
Appendix B
| Fiscal Power (FHP) | Vehicle Model | Consumption | Distance (km/year) | Price (€) | |
|---|---|---|---|---|---|
| Electricity (kWh/km) | Gasoline (L/km) | ||||
| <8 | Renault Twizy Life 45 | 0.06 | - | 3650 | 5800 |
| Aixam City Pack | - | 0.031 | 3650 | 9082 | |
| 8–11.99 | Citroen C-Zero | 0.10 | - | 7300 | 23.900 |
| Citroen C1 1.2 VTI | - | 0.054 | 7300 | 11.800 | |
| 12–15.99 | Nissan LEAF | 0.12 | - | 9855 | 22.600 |
| Nissan Micra | - | 0.050 | 9855 | 16.300 | |
| 16–19.99 | Volkswagen eGolf | 0.12 | - | 21.535 | 27.700 |
| Volkswagen Sportsvan 1.5 TSI | - | 0.051 | 21.535 | 19.100 | |
| >20 | Tesla Model 3 80.5 kWh | 0.15 | - | 32.485 | 66.300 |
| BMW 340i xDrive G21 | - | 0.074 | 32.485 | 58.600 | |

References
- Cohen, A.J.; Anderson, H.R.; Ostro, B.; Pandey, K.D.; Krzyzanowski, M.; Künzli, N.; Gutschmidt, K.; Pope, A.; Romieu, I.; Samet, J.M.; et al. The global burden of disease due to outdoor air pollution. J. Toxicol. Environ. Heal. Part A 2005, 68, 1301–1307. [Google Scholar] [CrossRef] [PubMed]
- Brauer, M.; Amann, M.; Burnett, R.T.; Cohen, A.; Dentener, F.; Ezzati, M.; Henderson, S.B.; Krzyzanowski, M.; Martin, R.V.; Van Dingenen, R.; et al. Exposure Assessment for Estimation of the Global Burden of Disease Attributable to Outdoor Air Pollution. Environ. Sci. Technol. 2011, 46, 652–660. [Google Scholar] [CrossRef] [PubMed]
- Liu, Y.; Sun, J.; Gou, Y.; Sun, X.; Zhang, D.; Xue, F. Analysis of Short-Term Effects of Air Pollution on Cardiovascular Disease Using Bayesian Spatio-Temporal Models. Int. J. Environ. Res. Public Health 2020, 17, 879. [Google Scholar] [CrossRef] [PubMed]
- Van Fan, Y.; Perry, S.; Klemeš, J.J.; Lee, C.T. A review on air emissions assessment: Transportation. J. Clean. Prod. 2018, 194, 673–684. [Google Scholar] [CrossRef]
- Reznik, A.; Kissinger, M.; Alfasi, N. Real-data-based high-resolution GHG emissions accounting of urban residents private transportation. Int. J. Sustain. Transp. 2019, 13, 235–244. [Google Scholar] [CrossRef]
- Lin, Z.; Greene, D.L. Promoting the market for plug-in hybrid and battery electric vehicles. Transp. Res. Rec. 2011, 2252, 49–56. [Google Scholar] [CrossRef]
- Statharas, S.; Moysoglou, Y.; Siskos, P.; Zazias, G.; Capros, P. Factors influencing electric vehicle penetration in the EU by 2030: A model-based policy assessment. Energies 2019, 12, 2739. [Google Scholar] [CrossRef]
- Struben, J.; Sterman, J.D. Transition challenges for alternative fuel vehicle and transportation systems. Environ. Plan. B Plan. Des. 2008, 35, 1070–1097. [Google Scholar] [CrossRef]
- Hübner, Y.; Blythe, P.; Hill, G.; Neaimeh, M.; Austin, J.; Gray, L.; Herron, C.; Wardle, J. 49,999 electric car journeys and counting. In Proceedings of the 2013 World Electric Vehicle Symposium and Exhibition, EVS 2014, Barcelona, Spain, 17–20 November 2013; Institute of Electrical and Electronics Engineers Inc.: Piscataway, NJ, USA, 2014. [Google Scholar]
- Rahmani, D.; Loureiro, M.L. Assessing drivers’ preferences for hybrid electric vehicles (HEV) in Spain. Res. Transp. Econ. 2019, 73, 89–97. [Google Scholar] [CrossRef]
- Jensen, A.F.; Rasmussen, T.K.; Prato, C.G. A Route Choice Model for Capturing Driver Preferences When Driving Electric and Conventional Vehicles. Sustainability 2020, 12, 1149. [Google Scholar] [CrossRef]
- Torres, J.L.; Gonzalez, R.; Gimenez, A.; Lopez, J. Energy management strategy for plug-in hybrid electric vehicles. A comparative study. Appl. Energy 2014, 113, 816–824. [Google Scholar] [CrossRef]
- Martínez-Lao, J.; Montoya, F.G.; Montoya, M.G.; Manzano-Agugliaro, F. Electric vehicles in Spain: An overview of charging systems. Renew. Sustain. Energy Rev. 2017, 77, 970–983. [Google Scholar] [CrossRef]
- Propfe, B.; Redelbach, M.; Santini, D.; Friedrich, H. Cost analysis of Plug-in Hybrid Electric Vehicles including Maintenance & Repair Costs and Resale Values. World Electr. Veh. J. 2012, 5, 886–895. [Google Scholar]
- Montoya, F.G.; Martínez-Lao, J.; Torres-Moreno, J.; Manzano-Agugliaro, F.; Barón, V. Analysis of charging stations for electric vehicles in Spain. Renew. Energy Power Qual. J. 2016, 6, 7. [Google Scholar]
- Torres-Moreno, J.L.; Gimenez-Fernandez, A.; Perez-Garcia, M.; Rodriguez, F. Energy management strategy for micro-grids with PV-battery systems and electric vehicles. Energies 2018, 11, 522. [Google Scholar] [CrossRef]
- Ul-Haq, A.; Cecati, C.; Strunz, K.; Abbasi, E. Impact of Electric Vehicle Charging on Voltage Unbalance in an Urban Distribution Network. Intell. Ind. Syst. 2015, 1, 51–60. [Google Scholar] [CrossRef]
- Spitzer, M.; Schlund, J.; Apostolaki-Iosifidou, E.; Pruckner, M. Optimized integration of electric vehicles in low voltage distribution grids. Energies 2019, 12, 4059. [Google Scholar] [CrossRef]
- Nour, M.; Ali, A.; Farkas, C. Evaluation of Electric Vehicles Charging Impacts on a Real Low Voltage Grid. Int. J. Power Eng. Energy 2018, 9, 837–842. [Google Scholar]
- Ramadan, H.; Ali, A.; Farkas, C. Assessment of plug-in electric vehicles charging impacts on residential low voltage distribution grid in Hungary. In Proceedings of the 2018 6th International Istanbul Smart Grids and Cities Congress and Fair, ICSG 2018, Istanbul, Turkey, 25–26 April 2018; Institute of Electrical and Electronics Engineers Inc.: Piscataway, NJ, USA, 2018; pp. 105–109. [Google Scholar]
- Richardson, P.; Moran, M.; Taylor, J.; Maitra, A.; Keane, A. Impact of electric vehicle charging on residential distribution networks: An Irish demonstration initiative. In Proceedings of the 22nd International Conference and Exhibition on Electricity Distribution (CIRED 2013), Stockholm, Sweden, 10–13 June 2013; pp. 10–13. [Google Scholar]
- Tie, C.H.; Gan, C.K.; Ibrahim, K.A. The impact of electric vehicle charging on a residential low voltage distribution network in Malaysia. In Proceedings of the 2014 IEEE Innovative Smart Grid Technologies—Asia, ISGT ASIA 2014, Kuala Lumpur, Malaysia, 20–23 May 2014; IEEE Computer Society: Washington, DC, USA, 2014; pp. 272–277. [Google Scholar]
- Richardson, P.; Flynn, D.; Keane, A. Optimal charging of electric vehicles in low-voltage distribution systems. IEEE Trans. Power Syst. 2012, 27, 268–279. [Google Scholar] [CrossRef]
- Richardson, P.; Flynn, D.; Keane, A. Impact assessment of varying penetrations of electric vehicles on low voltage distribution systems. In Proceedings of the IEEE PES General Meeting, PES 2010, Providence, RI, USA, 25–29 July 2010. [Google Scholar]
- Arellano, B.; Sena, S.; Abdollahy, S.; Lavrova, O.; Stratton, S.; Hawkins, J. Analysis of electric vehicle impacts in New Mexico urban utility distribution infrastructure. In Proceedings of the 2013 IEEE Transportation Electrification Conference and Expo (ITEC), Detroit, MI, USA, 16–19 June 2013; pp. 1–6. [Google Scholar]
- Hatziargyriou, N.; Karfopoulos, E.L.; Tsatsakis, K. The impact of EV charging on the system demand. In Electric Vehicle Integration into Modern Power Networks; Springer: New York, NY, USA, 2013; pp. 57–85. ISBN 9781461401346. [Google Scholar]
- Saisirirat, P.; Chollacoop, N.; Tongroon, M.; Laoonual, Y.; Pongthanaisawan, J. Scenario analysis of electric vehicle technology penetration in Thailand: Comparisons of required electricity with power development plan and projections of fossil fuel and greenhouse gas reduction. Energy Procedia 2013, 34, 459–470. [Google Scholar] [CrossRef]
- Lopes, J.A.P.; Soares, F.J.; Almeida, P.M.R. Integration of electric vehicles in the electric power system. Proc. IEEE 2011, 99, 168–183. [Google Scholar] [CrossRef]
- Luo, X.; Chan, K.W. Real-time scheduling of electric vehicles charging in low-voltage residential distribution systems to minimise power losses and improve voltage profile. IET Gener. Transm. Distrib. 2014, 8, 516–529. [Google Scholar] [CrossRef]
- Lacey, G.; Putrus, G.; Bentley, E.; Johnston, D.; Walker, S.; Jiang, T. A modelling tool to investigate the effect of electric vehicle charging on low voltage networks. In Proceedings of the 2013 World Electric Vehicle Symposium and Exhibition, EVS 2014, Barcelona, Spain, 17–20 November 2013; Institute of Electrical and Electronics Engineers Inc.: Piscataway, NJ, USA, 2014. [Google Scholar]
- Mateo, C.; Frías, P.; Sánchez-Miralles, A. Distribution planning with hourly profiles for analysing electric vehicle charging strategies. Int. J. Electr. Hybrid Veh. 2016, 8, 1–18. [Google Scholar] [CrossRef]
- Hong, J.; Xiang, Y.; Liu, Y.; Liu, J.; Li, R.; Li, F.; Gou, J. Development of EV charging templates: An improved K-prototypes method. IET Gener. Transm. Distrib. 2018, 12, 4361–4367. [Google Scholar] [CrossRef]
- Schäuble, J.; Kaschub, T.; Ensslen, A.; Jochem, P.; Fichtner, W. Generating electric vehicle load profiles from empirical data of three EV fleets in Southwest Germany. J. Clean. Prod. 2017, 150, 253–266. [Google Scholar] [CrossRef]
- Draz, M.; Albayrak, S. A Power Demand Estimator for Electric Vehicle Charging Infrastructure. In Proceedings of the 2019 IEEE Milan PowerTech, Milan, Italy, 23–27 June 2019; pp. 1–6. [Google Scholar]
- Frías Marín, P.; Mateo Domingo, C.; Pérez Arriaga, J. Evaluación del impacto de la integración del coche eléctrico en las redes de distribución de energía eléctrica. Lychnos 2011, 6, 56–61. [Google Scholar]
- Putrus, G.A.; Suwanapingkarl, P.; Johnston, D.; Bentley, E.C.; Narayana, M. Impact of electric vehicles on power distribution networks. In Proceedings of the 5th IEEE Vehicle Power and Propulsion Conference, VPPC ’09, Dearborn, MI, USA, 7–10 September 2009; pp. 827–831. [Google Scholar]
- Dyke, K.J.; Schofield, N.; Barnes, M. The impact of transport electrification on electrical networks. IEEE Trans. Ind. Electron. 2010, 57, 3917–3926. [Google Scholar] [CrossRef]
- Papadopoulos, P.; Skarvelis-Kazakos, S.; Grau, I.; Cipcigan, L.M.; Jenkins, N. Predicting electric vehicle impacts on residential distribution networks with distributed generation. In Proceedings of the 2010 IEEE Vehicle Power and Propulsion Conference, VPPC 2010, Lille, France, 1–3 September 2010. [Google Scholar]
- Olivella-Rosell, P.; Villafafila-Robles, R.; Sumper, A.; Bergas-Jané, J. Probabilistic Agent-Based Model of Electric Vehicle Charging Demand to Analyse the Impact on Distribution Networks. Energies 2015, 8, 4160–4187. [Google Scholar] [CrossRef]
- Red-Eléctrica-de-España. REE Web Site. Available online: https://www.ree.es/en (accessed on 26 March 2020).
- Senabre, C.; Valero, S.; Gabaldón, A.; Ortiz, M.; González, M. Predicción de la Demanda Total de Energía Eléctrica Española Utilizando Mapas Auto-organizados como Modelo de Red Neuronal. In Proceedings of the International Conference on Modern Eléctrical Power Engineering, Zaragoza, Spain, 2–4 July 2009; pp. 2–7. [Google Scholar]
- Ministerio-de-Hacienda Orden HAC/1273/2019. Available online: https://www.boe.es/eli/es/o/2019/12/16/hac1273 (accessed on 4 May 2020).
- Golob, T.F.; Gould, J. Projecting use of electric vehicles from household vehicle trials. Transp. Res. Part B Methodol. 1998, 32, 441–454. [Google Scholar] [CrossRef]
- Pearre, N.S.; Kempton, W.; Guensler, R.L.; Elango, V.V. Electric vehicles: How much range is required for a day’s driving? Transp. Res. Part C Emerg. Technol. 2011, 19, 1171–1184. [Google Scholar] [CrossRef]
- Franke, T.; Krems, J.F. What drives range preferences in electric vehicle users? Transp. Policy 2013, 30, 56–62. [Google Scholar] [CrossRef]
- Rusck, S. The Simultaneous Demand in Distribution Networks Supplying Domestic Consumers. ASEA J. 1956, 10, 59–61. [Google Scholar]
- Gwisdorf, B.; Stepanescu, S.; Rehtanz, C. Effects of demand side management on the planning and operation of distribution grids. In Proceedings of the IEEE PES Innovative Smart Grid Technologies Conference Europe, ISGT Europe, Gothenberg, Sweden, 11–13 October 2010. [Google Scholar]
- De Groot, R.J.W.; Morren, J.; Slootweg, J.G. Investigation of simultaneity in distribution networks for the assessment of da feasibility. In Proceedings of the 2012 47th International Universities Power Engineering Conference (UPEC), London, UK, 4–7 September 2012; pp. 1–6. [Google Scholar]
- Protopapadaki, C.; Saelens, D. Heat pump and PV impact on residential low-voltage distribution grids as a function of building and district properties. Appl. Energy 2017, 192, 268–281. [Google Scholar] [CrossRef]
- Clement-Nyns, K.; Haesen, E.; Driesen, J. The Impact of Charging Plug-In Hybrid Electric Vehicles on a Residential Distribution Grid. IEEE Trans. Power Syst. 2010, 25, 371–380. [Google Scholar] [CrossRef]
- Kordkheili, R.A.; Bak-Jensen, B.; Pillai, J.R.; Bhattarai, B.P. Improving and handling electric vehicle penetration level by different smart charging algorithms in distribution grids. In Proceedings of the 2015 IEEE Eindhoven PowerTech, Eindhoven, The Netherlands, 29 June–2 July 2015; Institute of Electrical and Electronics Engineers Inc.: Piscataway, NJ, USA, 2015. [Google Scholar]
- Poblet, M. Los aparcamientos residenciales, privados y municipales, en el contexto del mercado inmobiliario: Estudio económico y financiero de los precios de la ciudad de Barcelona. Ciudad y Territ. Estud. Territ. 2002, 132, 345–360. [Google Scholar]
- Marsden, G. The evidence base for parking policies-a review. Transp. Policy 2006, 13, 447–457. [Google Scholar] [CrossRef]
- Pozueta, J. Movilidad y Planeamiento Sostenible: Hacia una Consideración Inteligente del Transporte y la Movilidad en el Planeamiento y en el Diseño Urbano; Cuadernos de investigación urbanística; Instituto Juan de Herrera: Madrid, Spain, 2000; ISBN 9788495365361. [Google Scholar]
- Ramos-Teodoro, J.; Rodríguez, F.; Berenguel, M.; Torres, J.L. Heterogeneous resource management in energy hubs with self-consumption: Contributions and application example. Appl. Energy 2018, 229, 537–550. [Google Scholar] [CrossRef]
- Wirges, J. Planning the Charging Infrastructure for Electric Vehicles in Cities and Regions; KIT Scientific Publishing: Karlsruhe, Germany, 2016. [Google Scholar]


| Fiscal Power Range (FHP) | Electric Model | Power (kW) | Model Fiscal Power (FHP) | Battery (kWh) | Range (km) | Energy Comp. (kWh/km) |
|---|---|---|---|---|---|---|
| <8 | Renault Twizy | 4 | 0.78 | 6.1 | 100 | 0.06 |
| 8–11.99 | Citroën C-Zero | 49 | 9.51 | 15.2 | 150 | 0.10 |
| 12–15.99 | Nissan Leaf | 80 | 15.53 | 24 | 200 | 0.12 |
| 16–19.99 | Volks. eGolf | 100 | 19.41 | 35.8 | 300 | 0.12 |
| >20 | Tesla Model 3 | 379 | 73.56 | 80.5 | 530 | 0.15 |
| Electric Model | Battery Range (km) | Interval Between Charging (days) |
|---|---|---|
| Renault Twizy | 100 | 1.81 |
| Citroën C-Zero | 150 | 2.72 |
| Nissan Leaf | 200 | 3.63 |
| Volks. eGolf | 300 | 5.45 |
| Tesla Model 3 | 530 | 9.63 |
| MV/LV Transfer Number | Power Installed (kVA) | Max. Power Available Slow Charge (kW) | Max. Power Available Fast Charge (kW) | Max. Daily Energy Demand (kWh) | Max. Power Demand Slow Charge (kW) | Max. Power Demand Semi-Fast Charge (kW) | Max. Power Demand Fast Charge (kW) |
|---|---|---|---|---|---|---|---|
| 103.385 | 1260 | 225 | 321 | 2655 | 332 | 885 | 5310 |
| 33.757 | 800 | 143 | 204 | 1672 | 209 | 557 | 3344 |
| 102.743 | 1260 | 225 | 321 | 208 | 26 | 69 | 416 |
| 103.386 | 1260 | 225 | 321 | 24 | 3 | 8 | 48 |
| 34.312 | 1260 | 225 | 321 | 6165 | 771 | 2055 | 12.331 |
| 71.925 | 1260 | 225 | 321 | 1699 | 212 | 566 | 3398 |
| 33.766 | 1260 | 225 | 321 | 4404 | 551 | 1468 | 8809 |
| 104.387 | 1260 | 225 | 321 | 40 | 5 | 13 | 78 |
| 33.850 | 630 | 113 | 160 | 3715 | 464 | 1239 | 7432 |
| 82.663 | 1260 | 225 | 321 | 63 | 8 | 21 | 126 |
| 33.855 | 1260 | 225 | 321 | 9029 | 1129 | 3010 | 18.059 |
| 82.526 | 1260 | 225 | 321 | 6825 | 853 | 2275 | 13.651 |
| 33.765 | 400 | 72 | 102 | 2650 | 331 | 884 | 5301 |
| 64.183 | 630 | 113 | 160 | 2388 | 298 | 796 | 4776 |
| 91.791 | 1260 | 225 | 321 | 924 | 116 | 308 | 1849 |
| 34.316 | 630 | 113 | 160 | 1498 | 187 | 499 | 2997 |
| AVER. | 1060 | 189 | 270 | 2747 | 343 | 916 | 5495 |
| MV/LV Transfer Number | Power Installed (kVA) | Max. Power Available Slow Charge (kW) | Max. Power Available Fast Charge (kW) | Max. Daily Energy Demand (kWh) | Max. Power Demand Slow Charge (kW) | Max. Power Demand Semi-Fast Charge (kW) | Max. Power Demand Fast Charge (kW) |
|---|---|---|---|---|---|---|---|
| 103.385 | 1260 | 225 | 321 | 816 | 102 | 272 | 1633 |
| 33.757 | 800 | 143 | 204 | 502 | 63 | 167 | 1004 |
| 102.743 | 1260 | 225 | 321 | 62 | 8 | 21 | 124 |
| 103.386 | 1260 | 225 | 321 | 7 | 1 | 2 | 13 |
| 34.312 | 1260 | 225 | 321 | 1880 | 235 | 627 | 3760 |
| 71.925 | 1260 | 225 | 321 | 507 | 63 | 169 | 1015 |
| 33.766 | 1260 | 225 | 321 | 1334 | 167 | 445 | 2668 |
| 104.387 | 1260 | 225 | 321 | 12 | 2 | 4 | 25 |
| 33.850 | 630 | 113 | 160 | 1130 | 141 | 377 | 2259 |
| 82.663 | 1260 | 225 | 321 | 19 | 2 | 6 | 38 |
| 33.855 | 1260 | 225 | 321 | 2722 | 340 | 907 | 5443 |
| 82.526 | 1260 | 225 | 321 | 2047 | 256 | 682 | 4095 |
| 33.765 | 400 | 72 | 102 | 772 | 97 | 257 | 1545 |
| 64.183 | 630 | 113 | 160 | 737 | 92 | 246 | 1473 |
| 91.791 | 1260 | 225 | 321 | 269 | 34 | 90 | 539 |
| 34.316 | 630 | 113 | 160 | 465 | 58 | 155 | 930 |
| AVER. | 1060 | 189 | 270 | 830 | 104 | 277 | 1660 |
| Electric Model | Battery Range (km) | Interval Between Charging (days) | Maximum Power Demand (kW) | Minimum Power Demand (kW) | % EV Penetration |
|---|---|---|---|---|---|
| Renault Twizy | 100 | 1.81 | 135 | 75 | 100 |
| Citroën C-Zero | 150 | 2.72 | 336 | 123 | 53 |
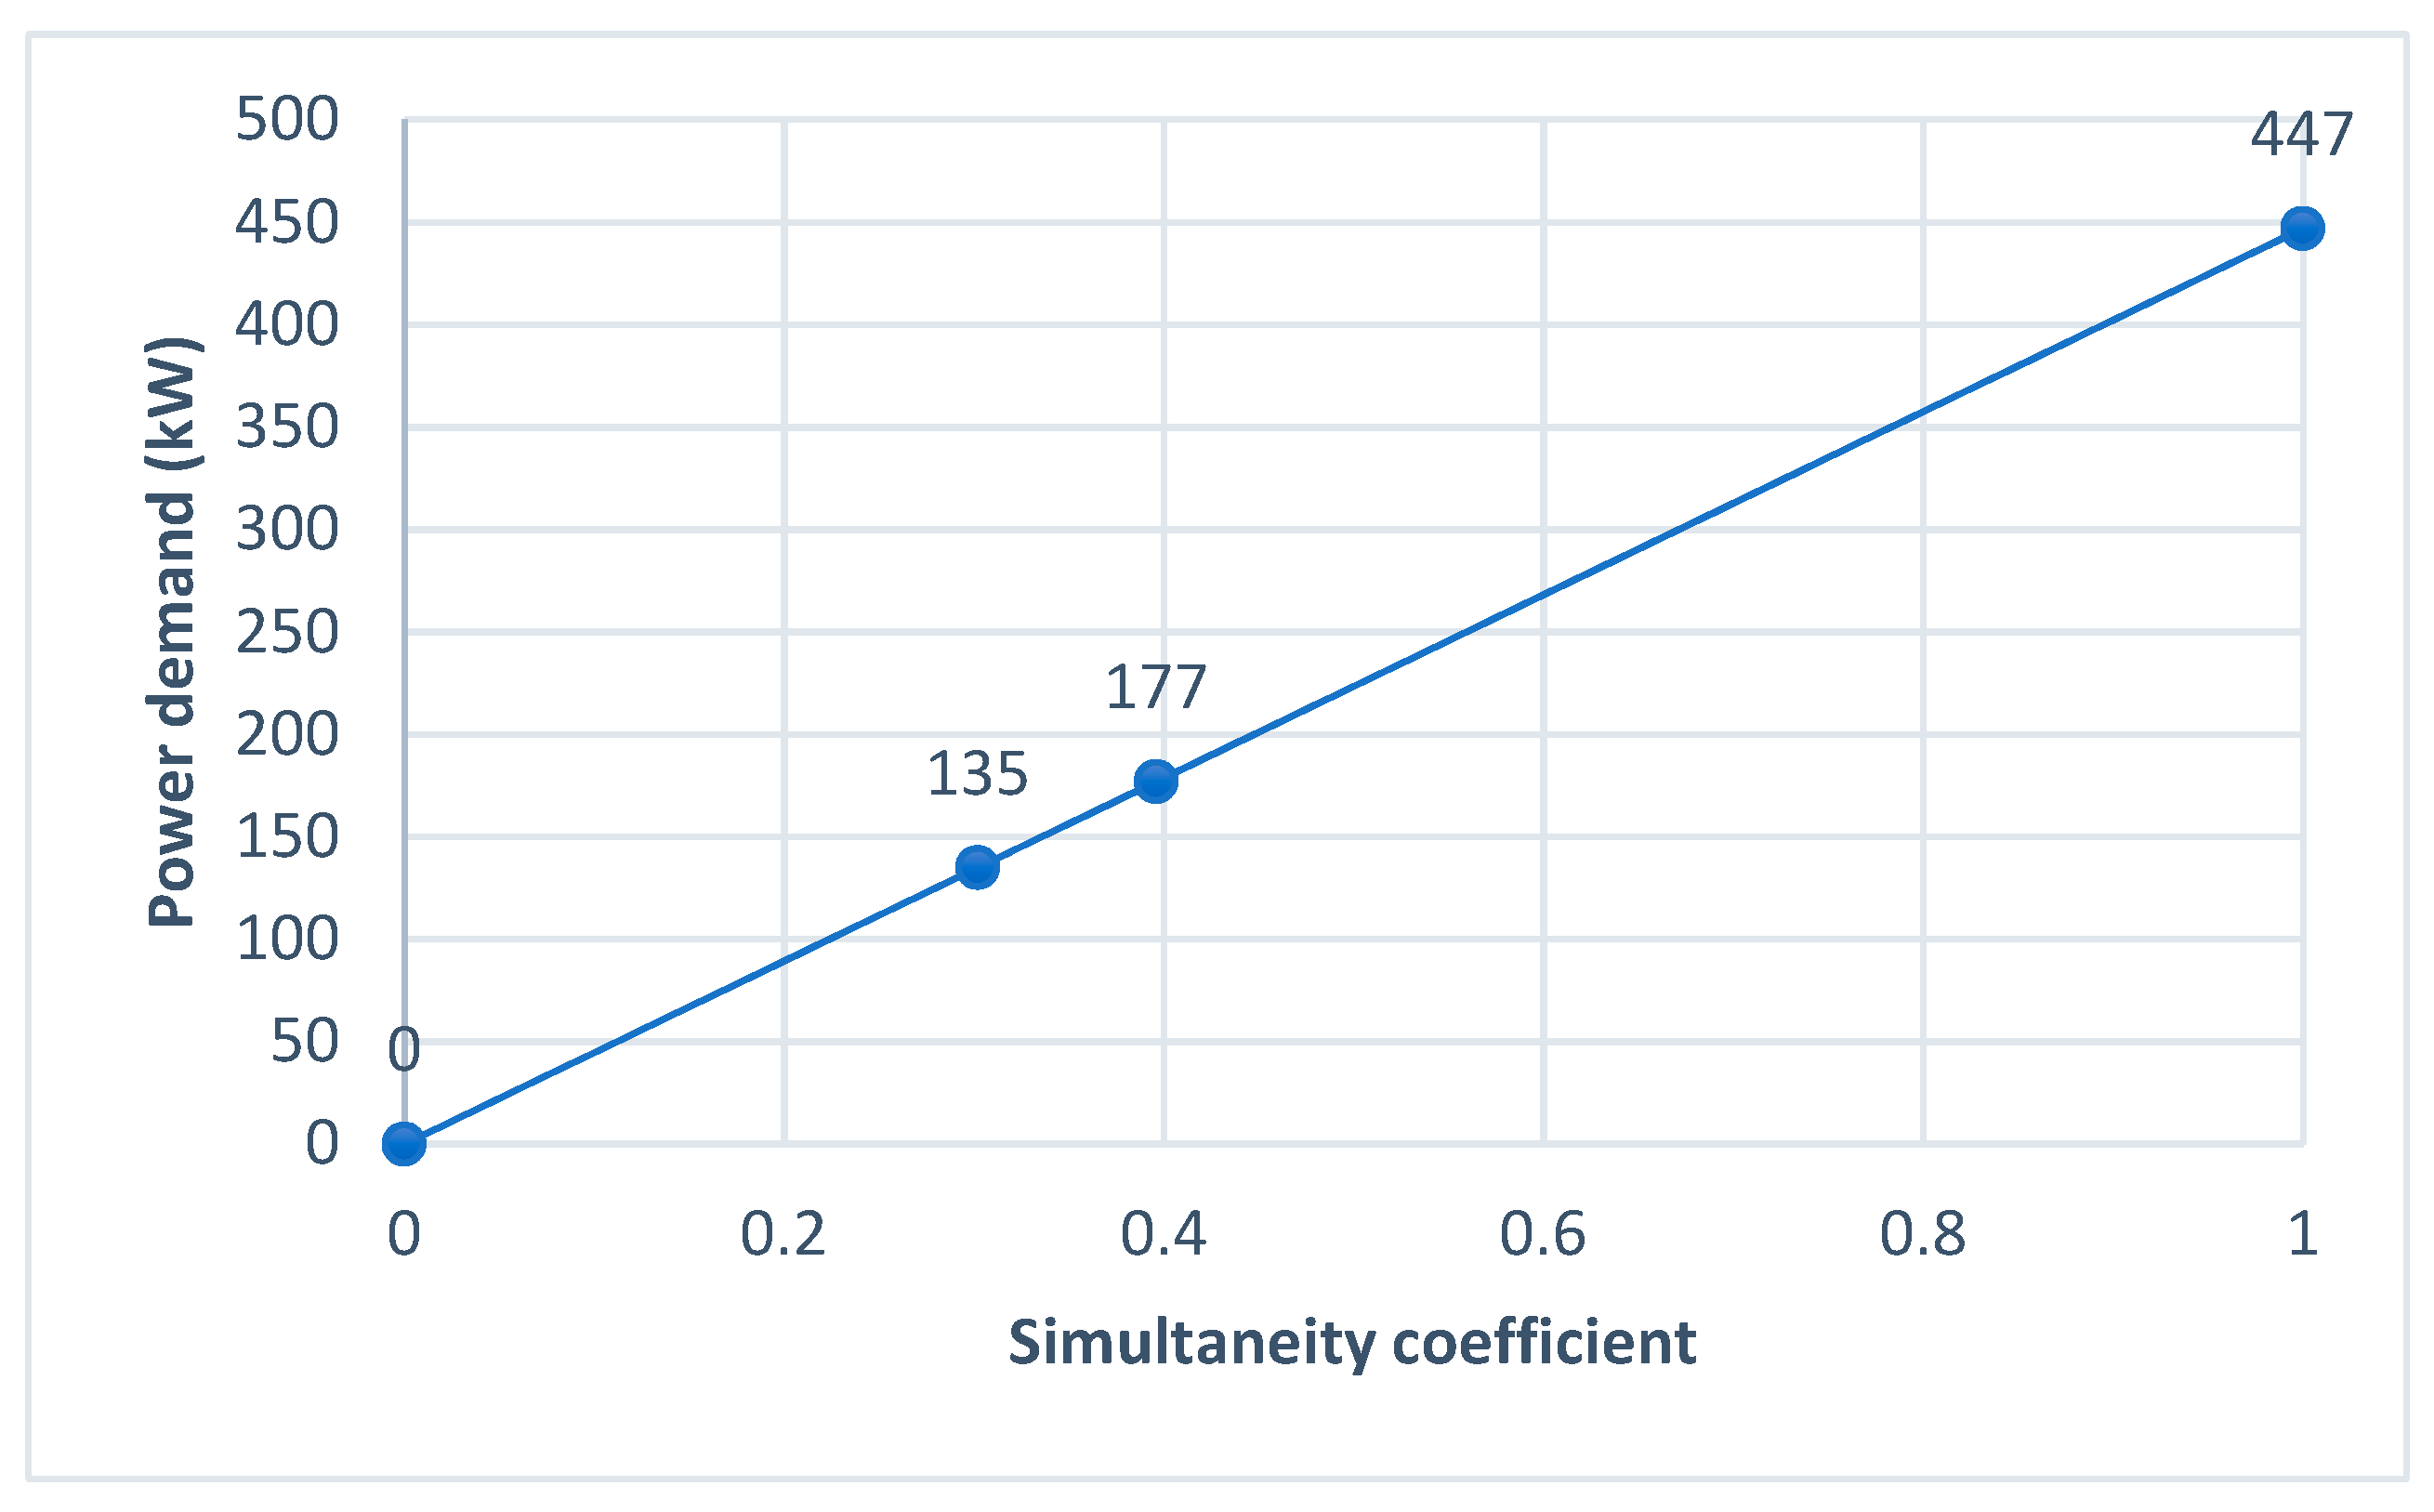
| Current Pool | 447 | 135 | 40 | ||
| Nissan Leaf | 200 | 3.63 | 531 | 146 | 33 |
| Volks. eGolf | 300 | 5.45 | 792 | 145 | 22 |
| Tesla Model 3 | 530 | 9.63 | 1782 | 185 | 10 |
© 2020 by the authors. Licensee MDPI, Basel, Switzerland. This article is an open access article distributed under the terms and conditions of the Creative Commons Attribution (CC BY) license (http://creativecommons.org/licenses/by/4.0/).
Share and Cite
López-Sánchez, J.Á.; Garrido-Jiménez, F.J.; Torres-Moreno, J.L.; Chofre-García, A.; Gimenez-Fernandez, A. Limitations of Urban Infrastructure for the Large-Scale Implementation of Electric Mobility. A Case Study. Sustainability 2020, 12, 4253. https://doi.org/10.3390/su12104253
López-Sánchez JÁ, Garrido-Jiménez FJ, Torres-Moreno JL, Chofre-García A, Gimenez-Fernandez A. Limitations of Urban Infrastructure for the Large-Scale Implementation of Electric Mobility. A Case Study. Sustainability. 2020; 12(10):4253. https://doi.org/10.3390/su12104253
Chicago/Turabian StyleLópez-Sánchez, José Ángel, Francisco Javier Garrido-Jiménez, Jose Luis Torres-Moreno, Alfredo Chofre-García, and Antonio Gimenez-Fernandez. 2020. "Limitations of Urban Infrastructure for the Large-Scale Implementation of Electric Mobility. A Case Study" Sustainability 12, no. 10: 4253. https://doi.org/10.3390/su12104253
APA StyleLópez-Sánchez, J. Á., Garrido-Jiménez, F. J., Torres-Moreno, J. L., Chofre-García, A., & Gimenez-Fernandez, A. (2020). Limitations of Urban Infrastructure for the Large-Scale Implementation of Electric Mobility. A Case Study. Sustainability, 12(10), 4253. https://doi.org/10.3390/su12104253