Article

Changes in the Spatial Structure of the Landscape of Isolated Forest Complexes in the 19th and 20th Centuries and Their Potential Effects on Supporting Ecosystem Services Related to the Protection of Biodiversity Using the Example of the Niemodlin Forests (SW Poland)

by
Krzysztof Badora
* and
Radosław Wróbel
*
Institute of Socio-Economic Geography and Spatial Management, University of Opole, 45-058 Opole, Poland
*
Authors to whom correspondence should be addressed.
Sustainability 2020, 12(10), 4237; https://doi.org/10.3390/su12104237
Submission received: 31 March 2020 / Revised: 20 May 2020 / Accepted: 20 May 2020 / Published: 21 May 2020

Abstract

:
This study assesses the changes in the spatial structure of the landscape between 1825 and 2019 in the isolated, protected forest complex of the Niemodlin Forests. Based on the analysis of changes in this structure, a change the supporting ecosystem services related to the protection of biodiversity was proposed. The landscape metrics were used separately for the analysis of the structure of the whole landscape, and individual types of ecosystems were used in the research. There were no major changes in the share of individual types of ecosystems during the period under review. At the same time, a very large increase in built-up areas and tree stands was found in 1825. Landscape metrics point to internal changes in the landscape composition, which is important for the functioning of the landscape and is related to the fragmentation and increasing isolation of ecosystems. Changes in the share of the surface of individual types of ecosystems in the landscape do not provide enough information about the actual structural and functional changes and ongoing ecosystem support services. There has been ecosystem degradation that is associated with freshwater habitats—surface waters, marshlands, meadows and pastures, as well as ecosystem support services related to these habitats. Changes in the spatial structure of the landscape cannot be solely deduced on the basis of changes in landscape metrics that are calculated for the whole landscape. Changes in the spatial composition of individual groups of ecosystems should be analyzed. Landscape metrics are very helpful in studying changes in the structure and function of ecosystem services.

1. Introduction

Human civilization development is associated with changes in the spatial structure of the landscape. The basic direction of the changes is the disappearance of natural ecosystems and their fragmentation [1,2]. The share of anthropogenic ecosystems with a low natural value is increasing. Forest ecosystems are one of the most important ecosystems undergoing global change [3]. Their disappearance has negative ecological consequences for the protection of biodiversity [4,5]. They are crucial for the functioning of all groups of ecosystem services. The most important forest supporting services include primary production, regulation of elemental circulation, soil creation and protection and occurrence of species habitats. Provisioning services are implemented, among others, by supplying wood and other products for industry and biomass for renewable energy sources. Forests also perform important regulating services in the field of, for example, carbon balance and climate regulation, water purification, flood prevention, as well as cultural services related to tourism and recreation [6,7,8] and space aesthetics [6,9,10,11,12,13]. For these reasons, among others, many forest complexes are protected. There is a relationship between ecosystem services and the protection of biodiversity [14,15,16,17,18,19].
Changes in spatial development, resulting in the reorganization of the structure and functioning of forests, including their fragmentation, lead to disruptions of ecosystem services that are related to the protection of biodiversity [20,21]. The woodiness of some areas, in particular in the mountains, increases due to the recession of agriculture, among other things [22,23]. For these reasons, it is very important to study the changes in the structure of forest landscapes in historical terms. They allow for a determination of the changes in the functioning of ecosystem services as well as to forecast and determine the direction of the sustainable development of landscapes, taking into account the protection of biodiversity [24]. The relationship between landscape changes, biodiversity protection and ecosystem services is an important and under-explored research area [19,25].
Landscape metrics are helpful in research because they allow for the assessment of changes in the structure of patches of individual types of ecosystems, as well as for diagnosing the structural and functional relationships between patches within coverage classes and between classes throughout the entire landscape unit [26]. Landscape heterogeneity, measured by metrics, is crucial for ecosystem services [27]. Comparing landscape metrics from different periods can help quantify the changes that are taking place in the landscapes, including the diversity of the landscape, the degree of its fragmentation, the spatial isolation of ecosystems, the disappearance or increase of their surface and others. Landscape metrics are very useful in protecting biodiversity (e.g., [28,29]). Based on a comparison of indicators from different periods, one can learn about changes and threats to ecosystem functions [30], including those related to the protection of biodiversity [31]. Relations between biodiversity and ecosystem services can also be explored [32]. Landscape metrics have been used by many researchers to study ecosystem services [20,27,33,34,35,36,37]. The researchers use surface indicators (e.g., Percentage of Landscape PLAND, Largest Patch Index LPI, Mean Patch Size AREA_MN), shape (e.g., Perimeter-Area Fractal Dimension PAFRAC, Perimeter-Area Ratio Distribution PARA), border contrast (e.g., Contrast-Weighted Edge Density CWED), aggregation and adhesion (e.g., Landscape Division Index DIVISION, Splitting Index SPLIT, Effective Mesh Size MESH), diversity (e.g., Shannon’s Evenness Index SHEI, Shannon’s Diversity Index SHDI) and others.
Forest areas exposed, in particular, to the degradation of the structure and functioning of the landscape are the remains of old forests, currently in the form of large forest islands surrounded by agricultural and built-up landscapes. The reduction and isolation of large forest complexes limits the possibility of, for example, counteracting climate change, regulating element circulation, water protection and species migration. The reduction and loss of forest habitats affect biodiversity [38,39,40]. It also promotes other forms of land use penetrating into the forest structure, which is the reason for subsequent degradation processes. The protection of valuable natural areas is an element of the strategy for preserving ecosystem services [41].
The aim of the study is to assess the changes in the spatial structure of the landscape of the large isolated Niemodlin Forests complex from 1825 to 2019 and to quantify it using the landscape metrics to show the effects of these changes on the protection of biodiversity. The cartographic method was used, based on a comparison of the state of the spatial structure of the landscape in 1825 and 2019.

2. Materials and Methods
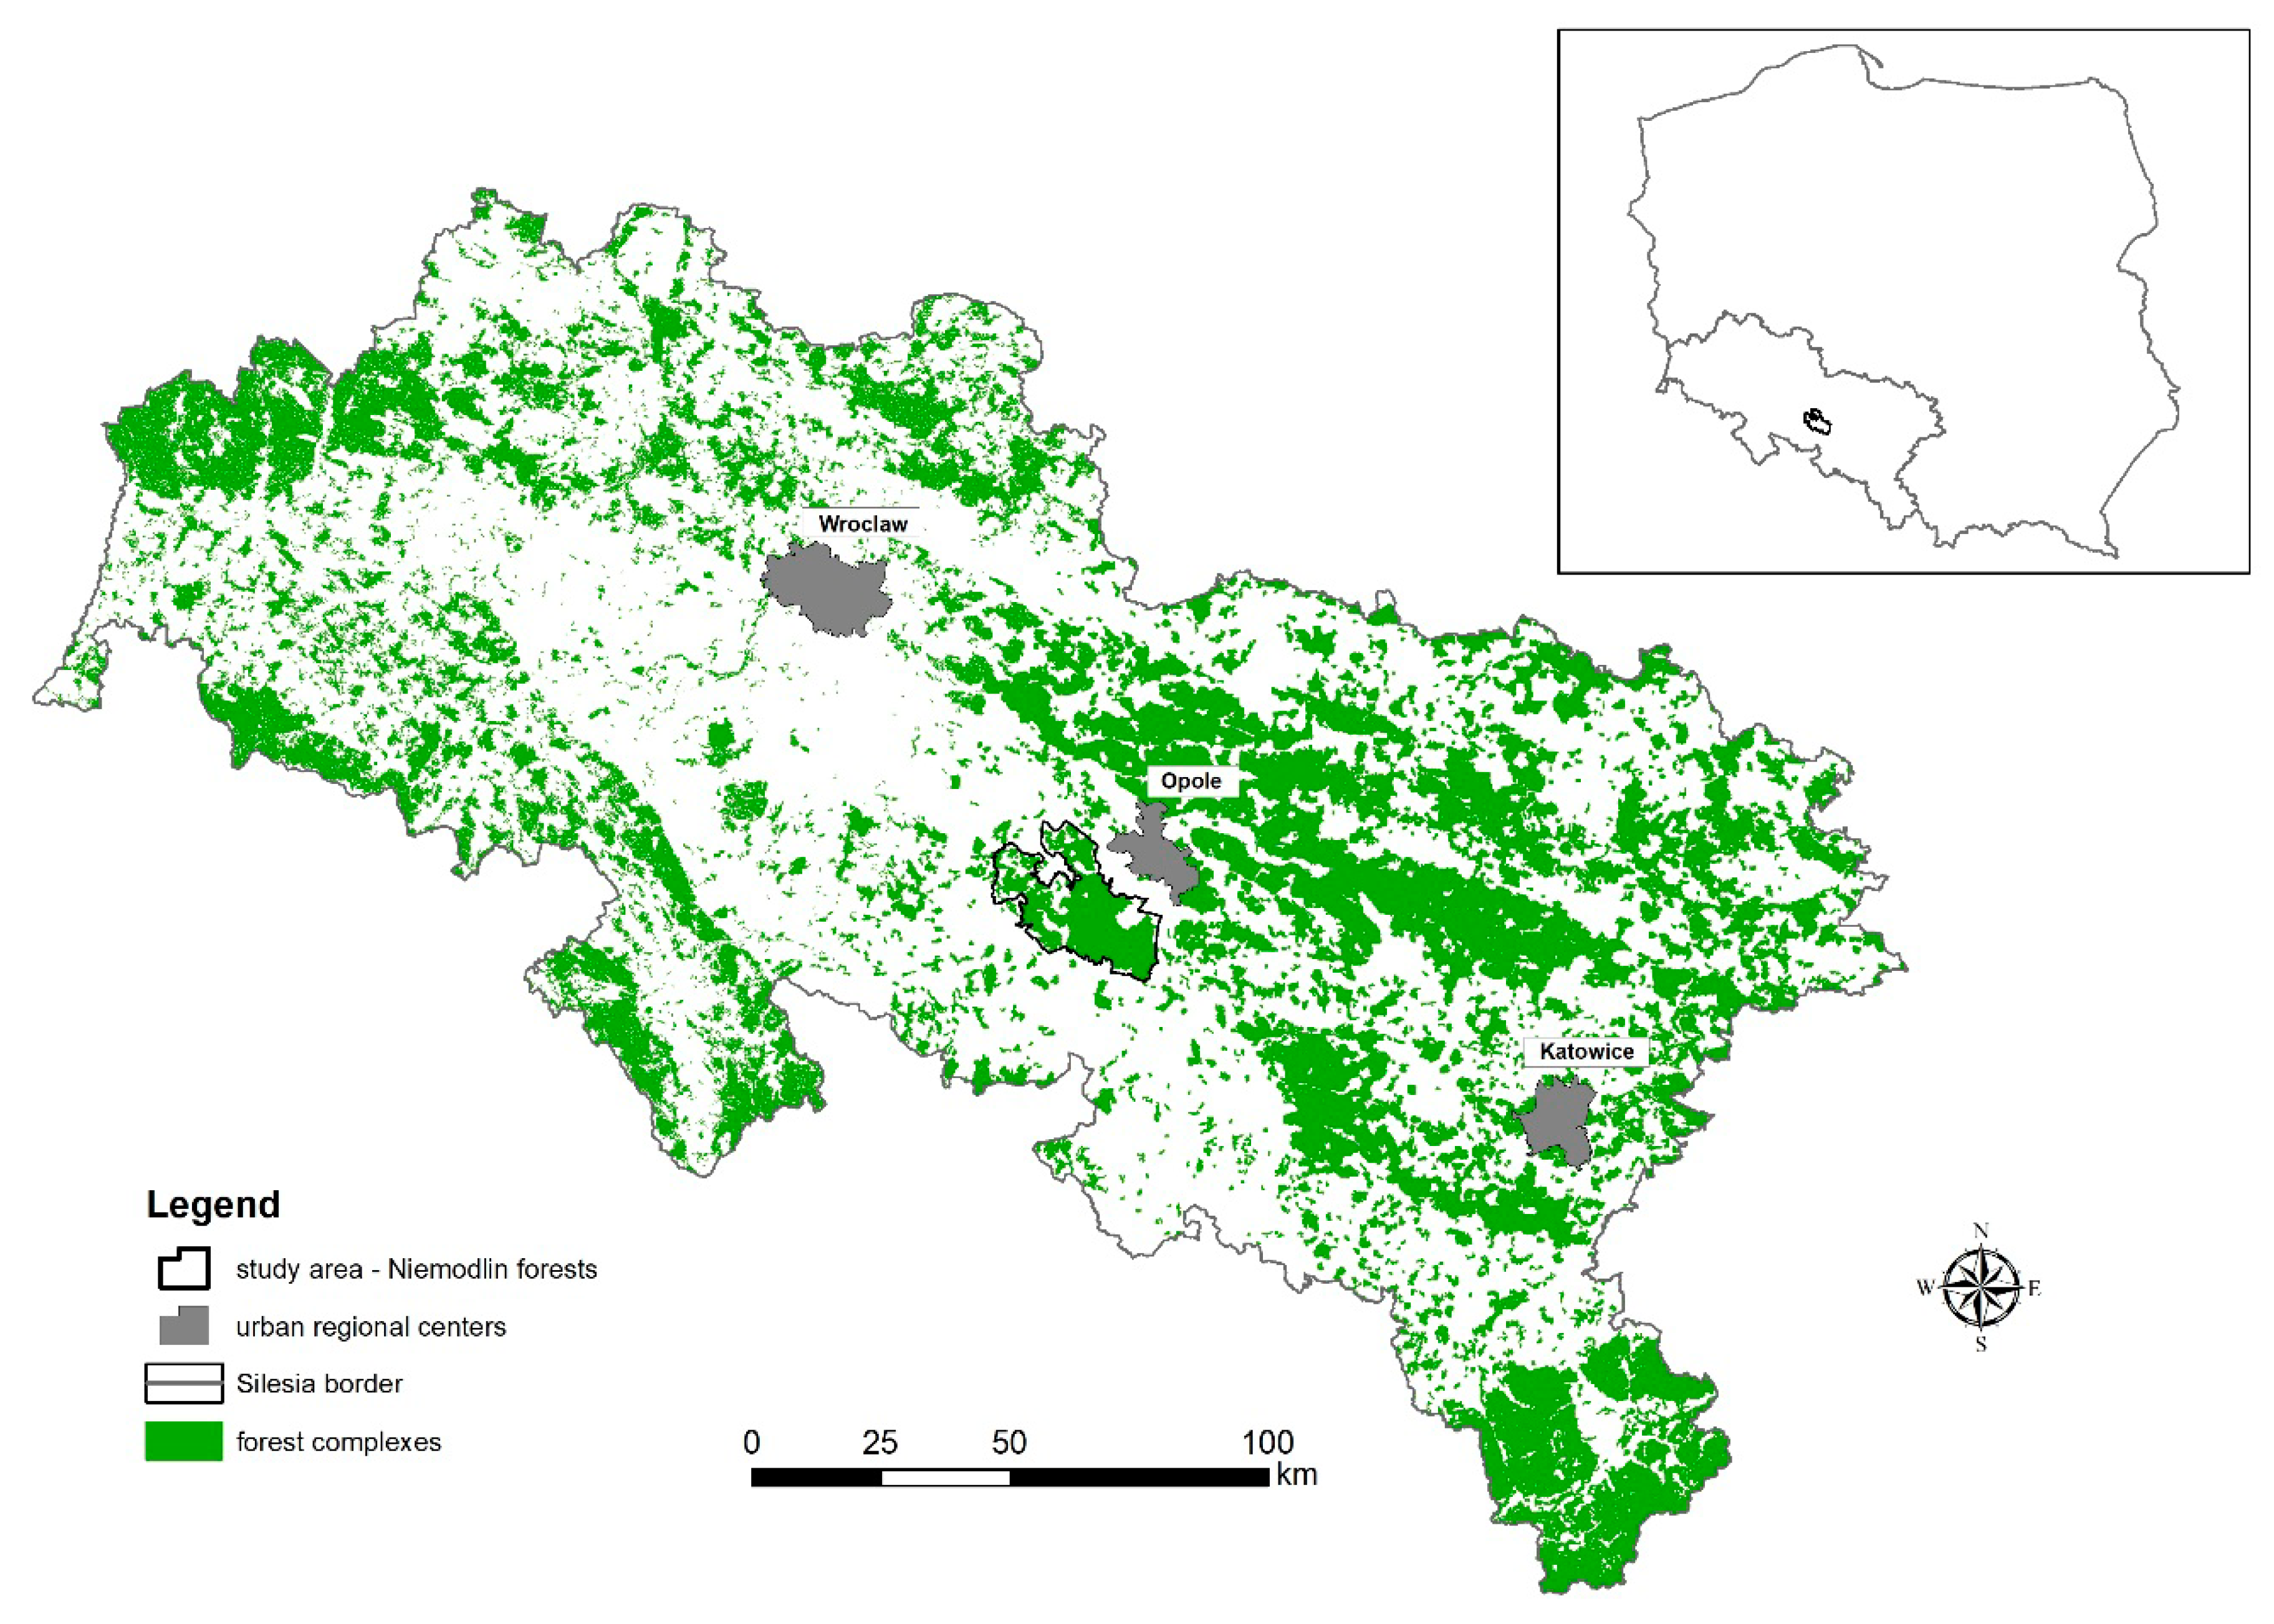
2.1. Study Area

The assessment of changes in the spatial structure of the Niemodlin Forests landscape and the effects of these changes on the performance of selected ecosystem functions were carried out within the Protected Landscape Area of Niemodlin Forests, which has an area of about 50 km2.
One of the large, isolated forest complexes, currently surrounded by agricultural and built-up areas, is a fragment of the former Silesian Forest—the Niemodlin Forests. It is a compact lowland forest complex with an area of about 50 km2, located in Southwest Poland between the valleys of Oder and Nysa Kłodzka. The Niemodlin Forests are located in the Silesian region (Figure 1), on the Niemodlin Plain, which is part of the Silesian Lowland [42]. They are dominated by suboceanic Leucobryo-Pinetum pine forests, and sour oak Calamagrostio-Quercetum also has a significant share. Sour beech forests of Luzulo pilosae-Fagetum are less common, but can be found in the areas of river valleys and depressions of the Fraxino-Alnetum and Ficario-Ulmetum riparian forests. The area has great natural value. It is protected in the Protected Landscape Area of Niemodlin Forests. Part of the complex is also protected by the Natura 2000 site SAC Niemodlin Forests and by eight nature reserves. The studied area is also an important element of the national ecological corridor system [43]. It connects the ecological corridors of the Odra (international) and Nysa Kłodzka (national) valleys. It is also located in the suburbanization zone of the city of Opole, which increases the negative impact on natural forest areas (development of forest areas, increased penetration of forests and their destruction by people). Protection against these threats is not fully effective.

2.2. Cartographic Data

The spatial structure of the landscape in 1825 was estimated from the German map—the so-called Urmesstischblätter. These are the first images, based on triangulation, created using a measuring table, made in 1816–1825 on a scale of 1:25,000. The maps were not intended for publication, remaining as colorful manuscripts. However, they have the features of typical maps, from which basic forms of land use can be read as informative of the spatial structure of the landscape. These maps were obtained from the National Library of Berlin, as scans at 300 dpi resolution (Table 1). The cartographic analysis of these maps was carried out by, among others [44,45].
The current state of the landscape’s spatial structure was analyzed on the basis of an orthophotomap from 2018–2019, made available by the Marshal’s Office of the Opolskie Voivodeship.

2.3. Methods

Studies on the changes in the spatial structure of the Niemodlin Forests landscape were carried out in several stages. In the first stage, sheets of archival topographic maps were registered, calibrated and rectified in ArcInfo v. 10.6 of the ArcGIS package. Archival Urmesstischblätter maps were given a georeference in the Polish system “1992” (EPSG:2180 system), using reference data from 1:10,000 topographic maps in the “1992” system, performing a geometric transformation using a second- or third-degree polynomial.
The cartometric analysis of the cartographic sources used was performed using mathematical and statistical methods and was based on the analyses made by other authors [44,46]. The most common mistakes made while processing spatial information include errors of generalization, reproduction, errors resulting from paper deformation or the process of digitization itself [47,48,49].
Cartometric maps were examined in relation to individual elements, and the average error was determined. The calibration accuracy was determined by the root mean square error (RMS), determined by the relationship [46]:
R M S = { [ ( x s t x m ) 2 + ( y s t y m ) 2 ] / n } 1 / 2 ,
where n is the number of checkpoints, xst and yst are coordinates of scan checkpoints and xm and ym are coordinates on the map.
The error values of fitting individual control points and their average RMS values were determined. The RMS values were generated by the program. The error values were up to 30 m at an RMS around 10–15 m for archival maps and up to 10 m at an RMS 1–4 m for current maps.
On the registered, calibrated and rectified raster sleepers from 1825, the following types of land cover in three classes of naturalness were identified by screen digitization:
  • natural and semi-natural ecosystems: forests, trees and shrubs, surface waters, marshlands, meadows and pastures;
  • degraded ecosystems: arable lands;
  • devastated ecosystems: developed areas, including road and machine infrastructures.
When designating individual forms of land cover, they included:
  • forests—areas covered with forest, with an area of over 0,5 ha;
  • trees and shrubs—dense areas of roadside and mid-field trees and shrubs with an area of less than 0.5 ha;
  • waters—water reservoirs and main watercourses;
  • marshlands—wetlands and marshes;
  • meadows—meadows and pastures;
  • arable lands—land used for agriculture;
  • developed areas—building areas, squares, paved areas including road and machine infrastructures.
The key was to use the same criteria for both sources, with the starting point being land cover forms visible on old maps. The same types of land cover were analyzed on an orthophotomap from 2018–2019.
Basic data characterizing the structure were measured and calculated for each type of land cover form. Natural and semi-natural ecosystems are characterized by a high natural potential that supports ecosystem services that are related to the protection of biodiversity, but the development of forms of coverage limits this potential. Prior to the comparative analyses, land use categories (data aggregation) were unified on all the maps.
After the vectorization, the maps were subjected to an analysis of similarity, based on fuzzy logic and Kappa indices [50,51,52], obtaining Kappa values at the level of 0.70–0.88; however, due to the type of analyses carried out, the results were not subjected to a broad discussion. For both periods of analysis, basic spatial data were calculated in individual categories of precipitates and compared with each other. The spatial diversity of the distribution of individual types of landscape structure elements was also compared. Image overlaying was abandoned due to the possibility of creating so-called residual polygons. They form when applying surfaces with differently shaped borders [48].
In the next stage, to assess changes in the spatial structure of the landscape, raster images were analyzed for the structure obtained from the Urmesstischblätter maps (1816–1825) and the current state from the orthophotomap, using the Fragstats v. 4.2 software [26]. The analysis included raster files that were generated in ArcInfo v. 10.6, in GeoTiff format, with a 10 m cell resolution. Fragstats further defined the parameters such as class descriptions and edge contrast, assuming a range of values from 0 to 1, where 0 is no contrast and 1 is maximum contrast. A radius was also given to calculate the indicators of proximity and similarity at a distance of 200 m and a threshold distance of the connection indicator at a distance of 200 m. Attempts were also made to enter larger radius values by comparing the results obtained. The obtained values were similar.
For each of the seven types of ecosystems in the landscape spatial structure, the following landscape metrics were calculated separately for 1825 and 2019: Class Area (CA), Percentage of Landscape (PLAND), Number of Patches (NP), Patch Density (PD), Largest Patch Index (LPI), Mean Patch Size (AREA_MN), Perimeter-Area Ratio Distribution (PARA_MN), Mean Contiguity Index (CONTIG_MN), Connectance Index (CONNECT), Landscape Division Index (DIVISION), Effective Mesh Size (MESH) and Splitting Index (SPLIT).
For all the types of ecosystems considered together, the following indicators were calculated and characterize the spatial structure of the landscape for the maps from 1825 and 2019: Total Area (TA), Patch Density (PD), Total Edge (TE), Edge Density (ED), Mean Patch Size (AREA_MN), Patch Radius of Gyration (GYRATE_MN), Perimeter-Area Ratio Distribution (PARA_MN), Mean Contiguity Index (CONTIG_MN), Perimeter-Area Fractal Dimension (PAFRAC), Connectance Index (CONNECT), Contrast-Weighted Edge Density (CWED), Landscape Division Index (DIVISION), Effective Mesh Size (MESH), Splitting Index (SPLIT), Shannon’s Diversity Index (SHDI) and Shannon’s Evenness Index (SHEI).

3. Results and Discussion

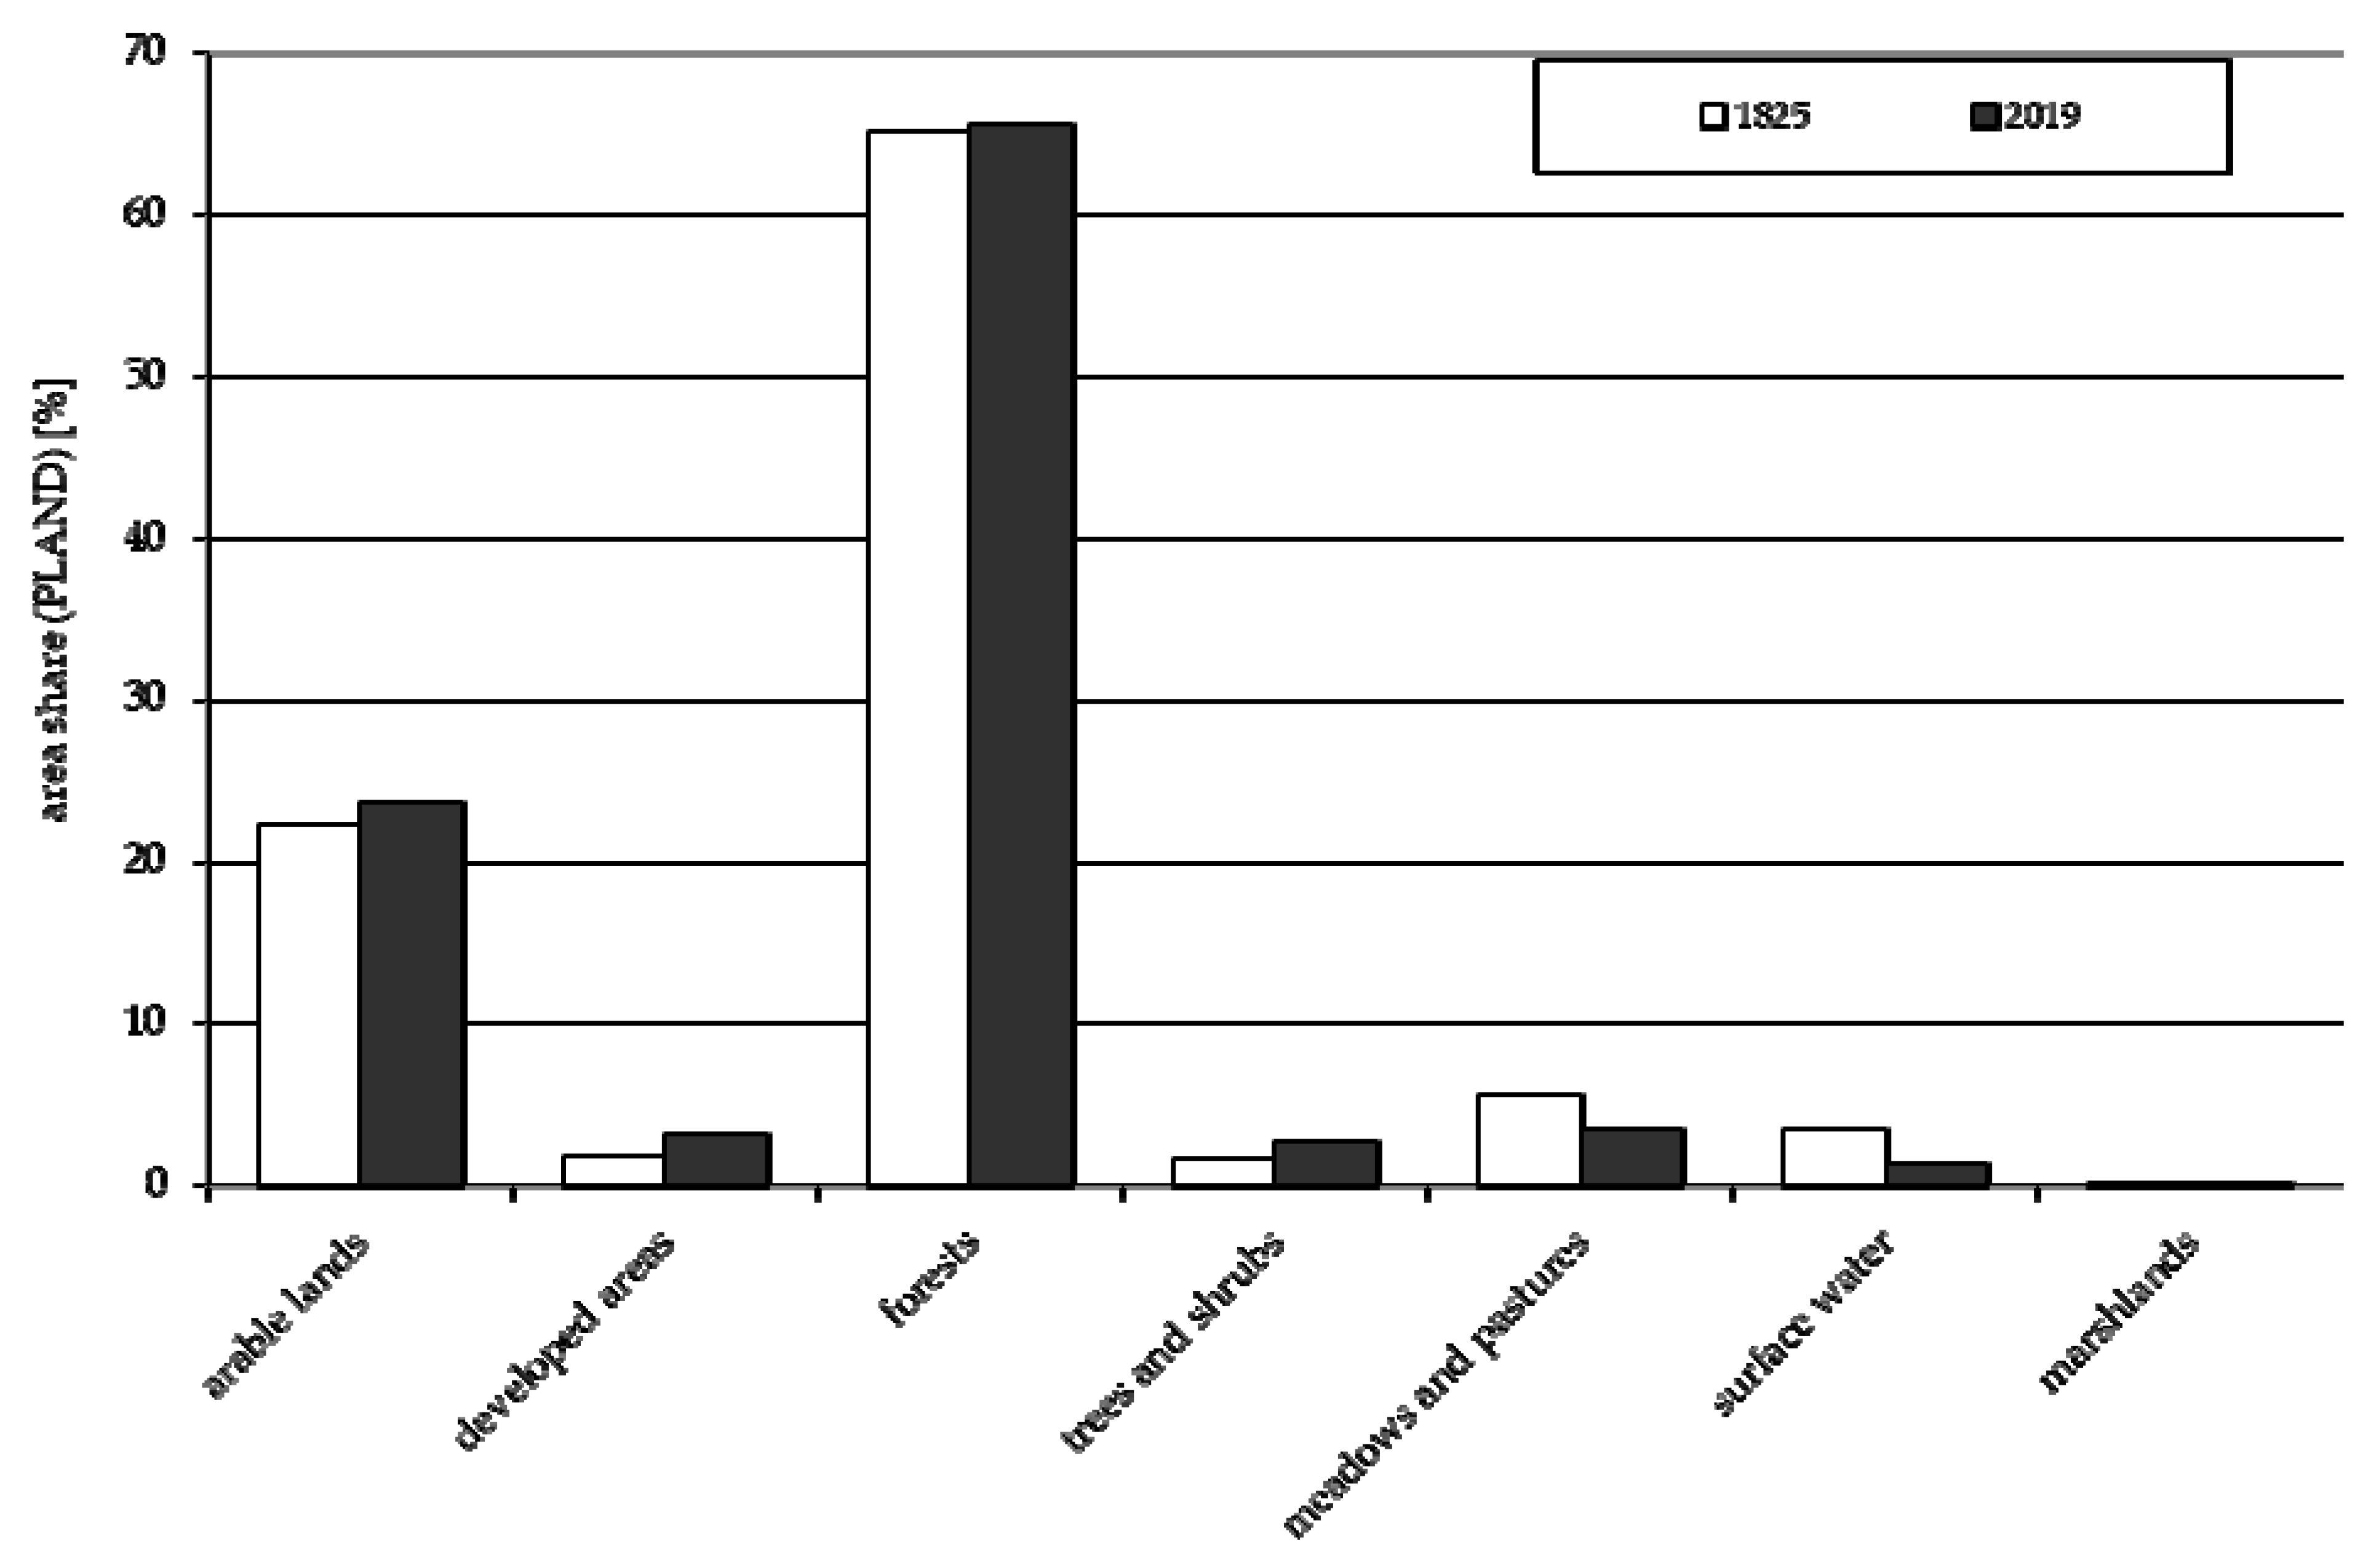
3.1. Changes in Surface Shares of Landscape Spatial Structure Elements

In the years 1825–2019, minor changes occurred in the surface shares of individual types of ecosystems in the Niemodlin Forests (Figure 2; Table 2 and Table 3). Taking into account the areas occupied by individual types of ecosystems in 1825 and 2019, the largest regress was found for meadows and pastures, whose share in the landscape structure decreased from 5.6% in 1825 to 3.4% in 2019, and surface waters, from 3.5% to 1.4%. These seemingly small changes (around 2.1%–2.2%) actually mean a reduction of about half the share of these ecosystems. This is of great importance in terms of its negative impact on biodiversity associated with these types of ecosystems. The main reason for the changes is the drainage of land for the development of agricultural crops. Meadow degradation and its negative impact on the protection of biodiversity have also been recorded in other regions [31]. These are ecosystems that are sensitive to anthropogenic changes and natural ecological succession. A slight increase was noted for arable land—from 22.3% to 23.7%. Arable land and the increase in the intensification of its protection were identified as the main direction of landscape changes on a global scale [53]. The increase in arable land leads to the loss of habitats and the fragmentation of forests, which were identified as the two most important threats to forest biodiversity [54,55]. Relatively large changes, taking into account the areas from 1980 to 2019, occurred for expansion built-up areas, from 1.8% in 1825 to 3.1% in 2019, and tree stands, from 1.6% to 2.7%. Changes in the forest area were small but positive, from 65.0% to 65.6%. An analysis of the two basic elements of the spatial structure of the landscape that negatively affect ecosystem services, which are related to the protection of biodiversity, i.e., arable land and built-up areas, indicates that, over a period of 190 years in the Niemodlin Forests, the area of arable land increased by approx. 691 ha, and built-up areas by 672 ha. For arable land, it increased by 6%, in comparison to 1825, and for built-up areas, a very large increase by 75% (Table 2). New ecosystems related to the expansion of buildings have negative consequences for the protection of biodiversity [9]. The increase in developed areas and human population has a very large impact on ecosystem services [56,57,58]. The increases in the area of natural and semi-natural ecosystems, responsible for supporting ecosystem services and related to the protection of biodiversity, compared to 1825, amounted to 1% for forests and 68.8% for tree stands. For other valuable ecosystems, there were very large surface declines, as compared to 1825. For surface waters, they amounted to as much as 59.6% of the original surface, 52.4% of marsh areas and 40.2% of meadows and pastures.
The trend of increasing forest cover recorded in the studied area confirms the results of the research conducted in other areas of southern Poland—Ślęża Landscape Park [59], Sudetes [60], Beskids [61] and Orawa [62]. It should be noted, however, that compared to these mountainous areas, the increase in forest cover was very slight, which confirms that in the lowland areas, where the Niemodlin Forests are located, forest cover is more stable [63]. In the mountains, the increase in forest cover is associated with the afforestation of former agricultural land. Its share in the landscape structure is decreasing. The share of arable land is increasing in the Niemodlin Forests. The decrease in the area share of all non-forest areas typical of the mountains has not been confirmed. This indicates that in lowland areas, forest cover changes are less dynamic [63], and there is no intensive afforestation of formerly farmed agricultural land.
The research results only partially confirm the dominant tendency in Europe to change the landscape associated with the transformation of agricultural land [64]. Only meadows were significantly reduced in the analyzed area, while the share of arable land did not significantly change.
However, not only general changes in the share of individual land use in the landscape are important for biodiversity protection, but also changes in spatial composition conditioned by socio-economic factors [63,64]. The study of all these changes is currently very important because recently there has been a noticeable increase in landscape changes in nearby protected areas—landscape parks [65].

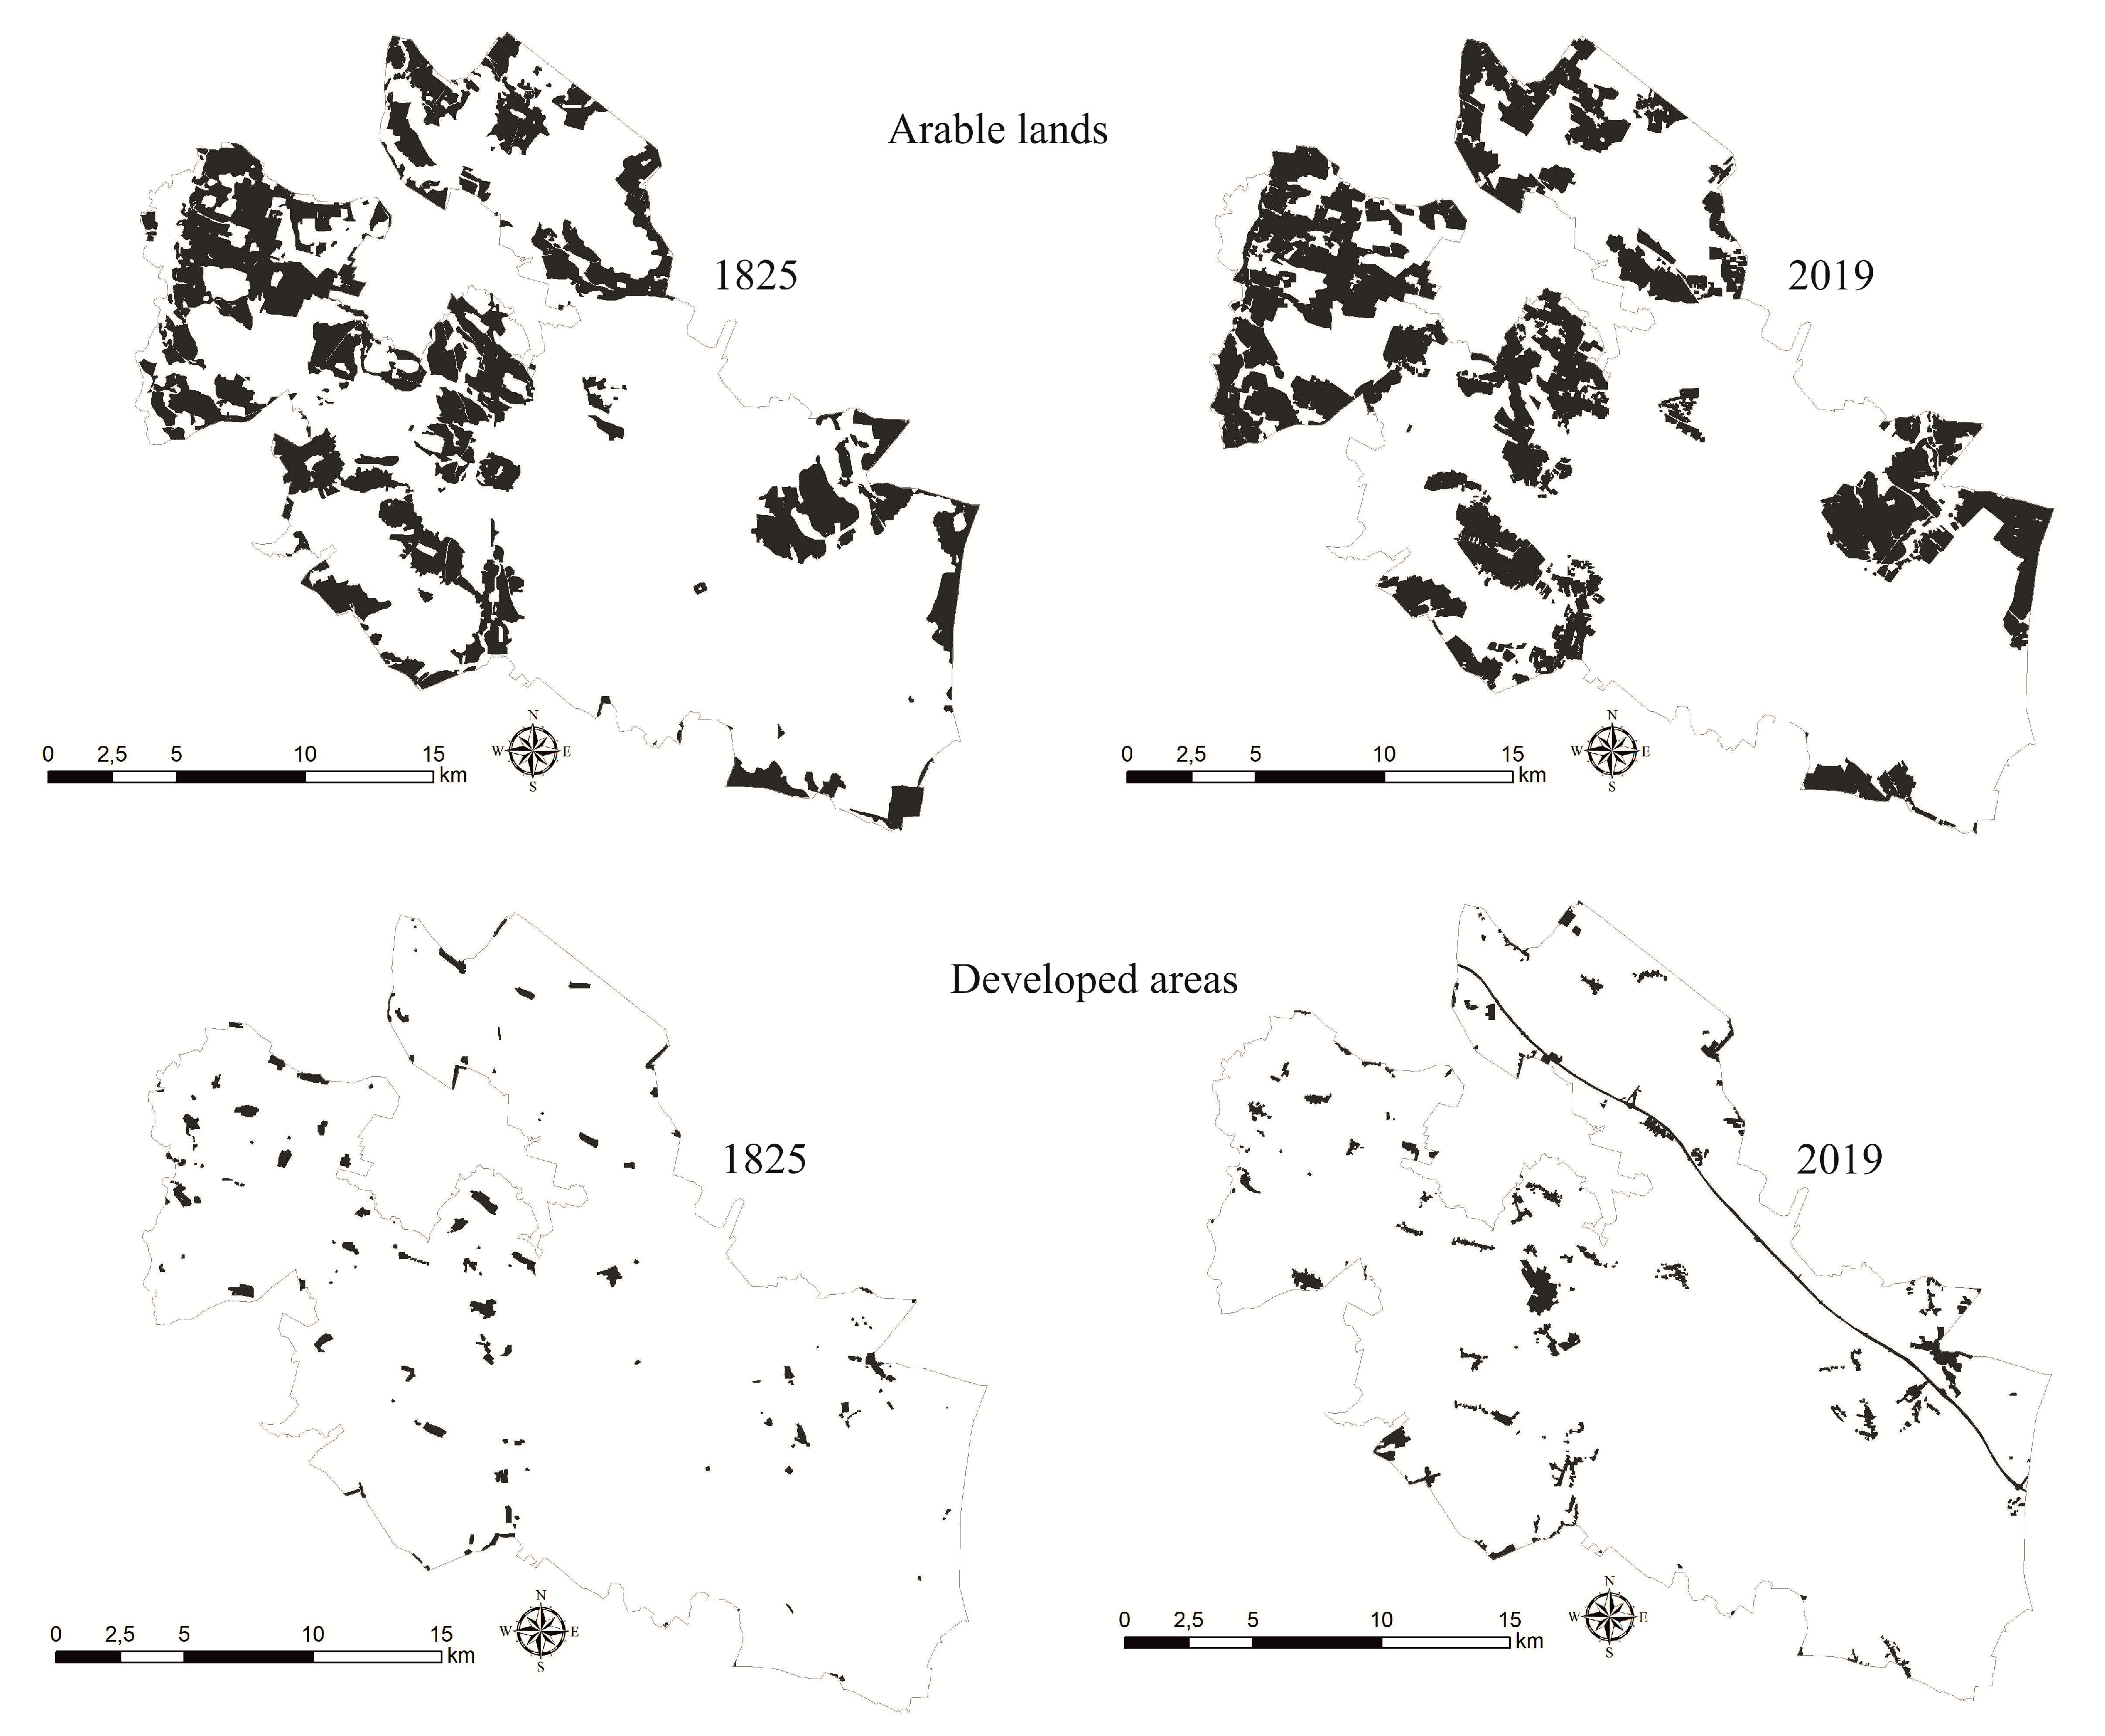
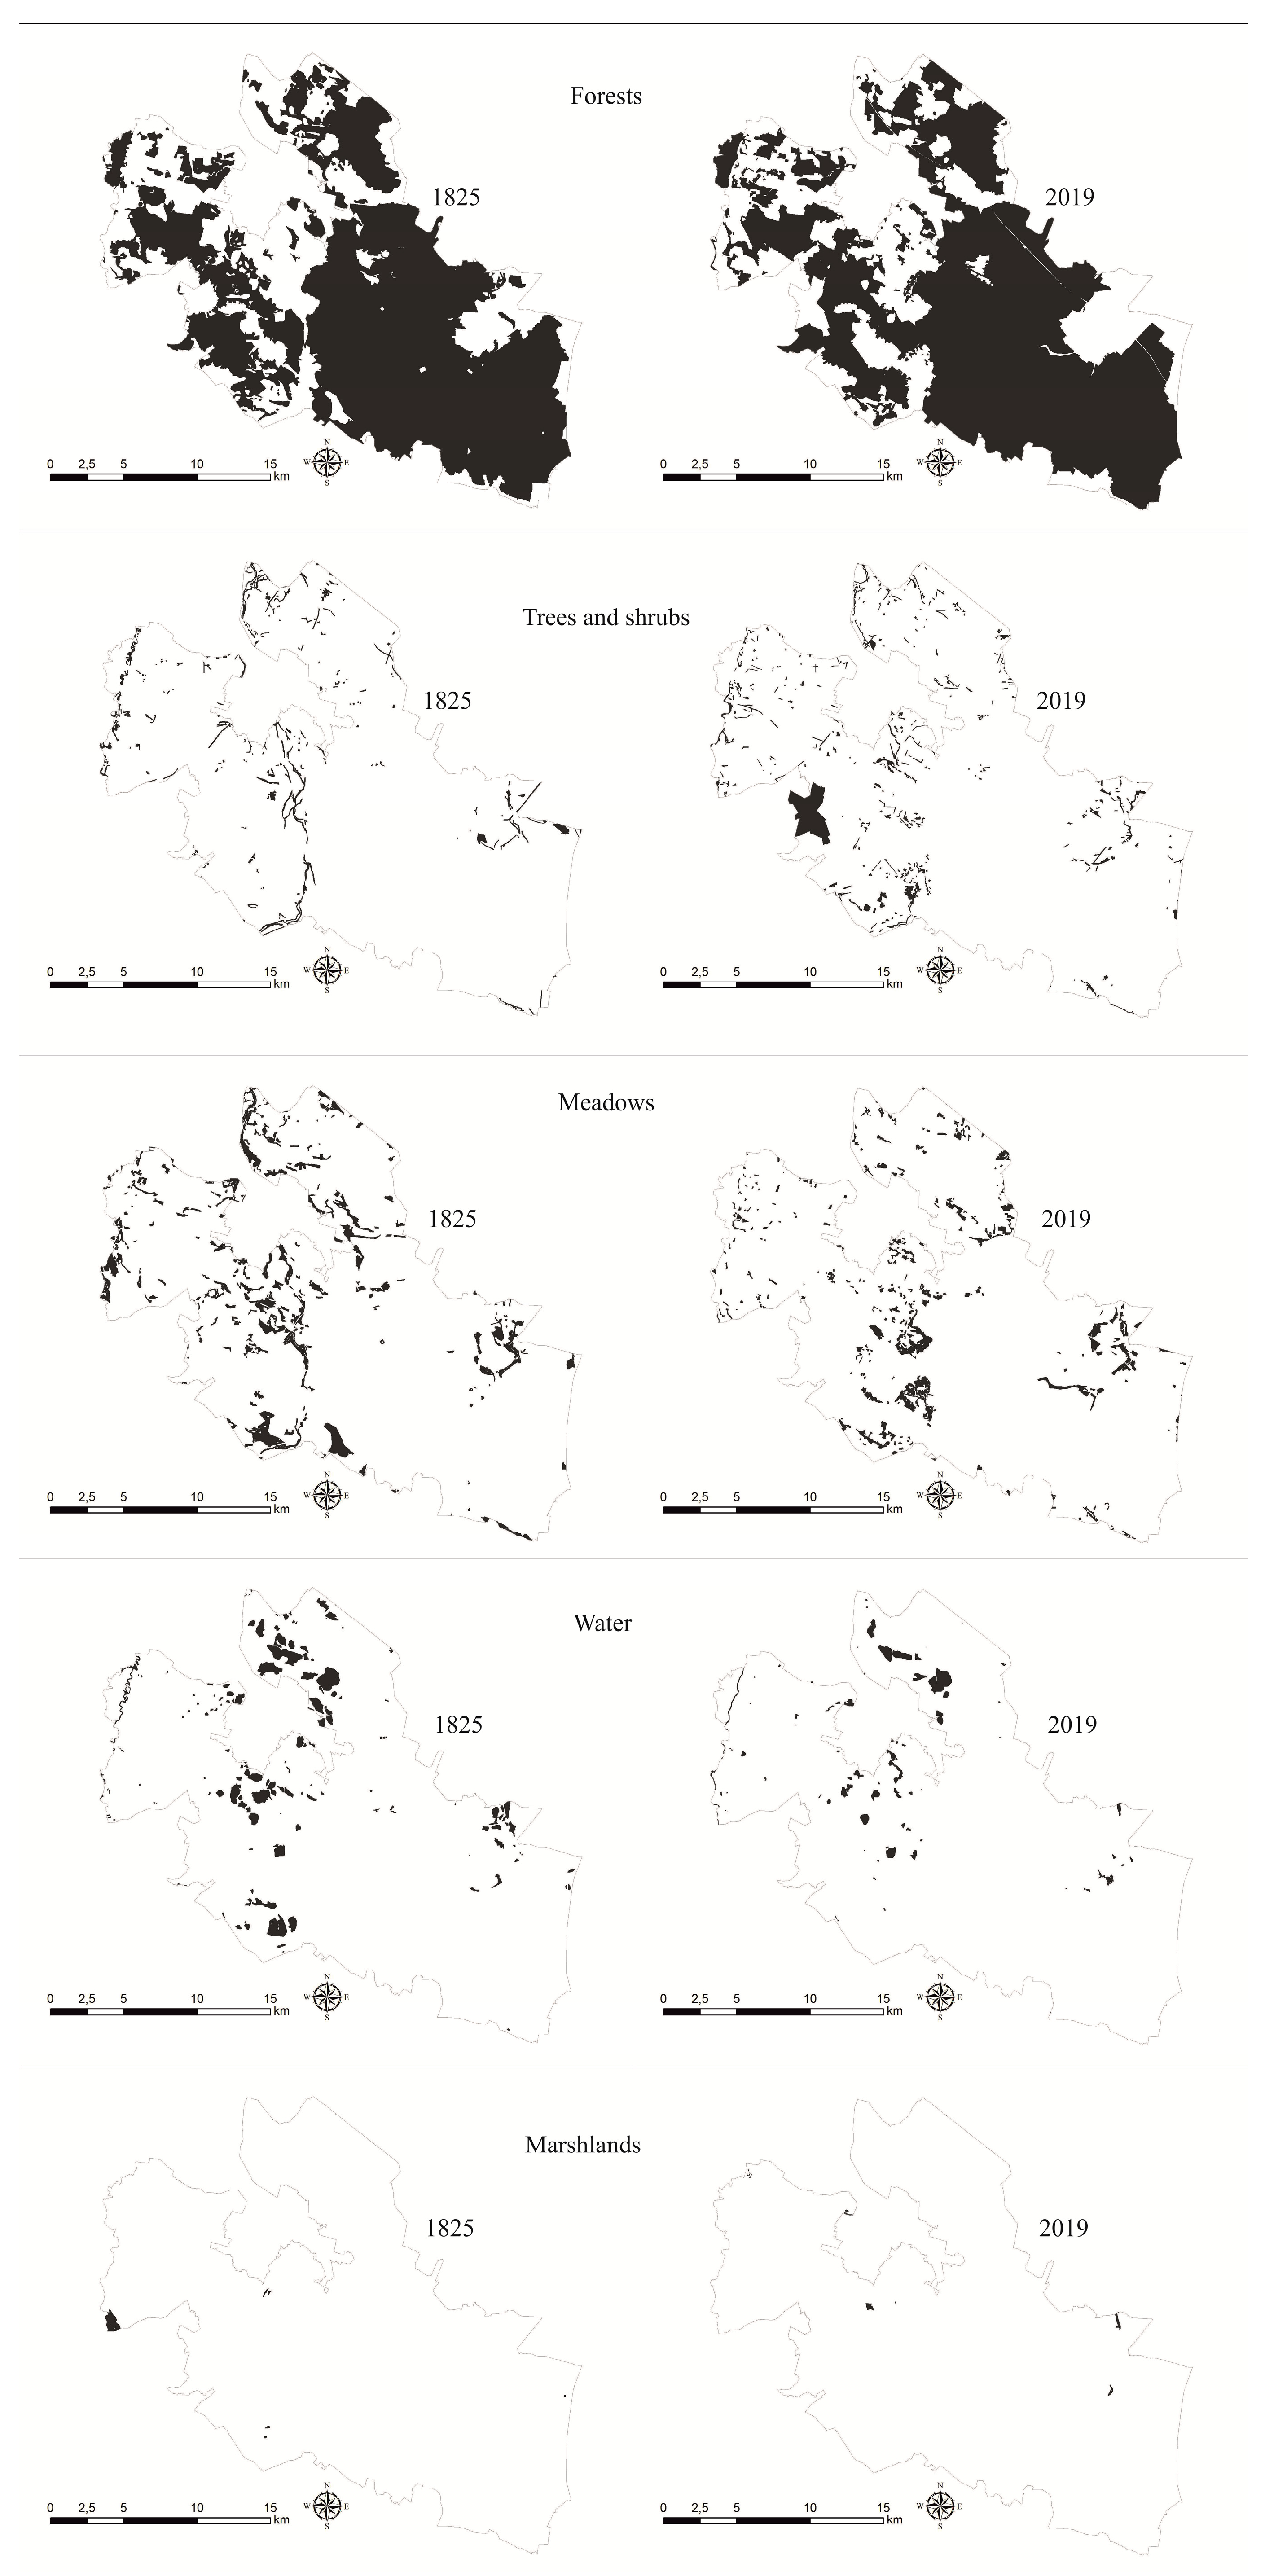
3.2. Changes in the Landscape Structure in Spatial Terms

The biggest changes in the spatial structure of forest ecosystems in the Niemodlin Forests, between 1825 and 2019, concern the southwestern part (Figure 3 and Figure 4). Marshlands and part of the meadows in the Ścinawa Niemodlińska Valley were afforested. In this region, as well as in the northeast, the share of forests converted to arable land decreased. In the north, the A4 motorway strip cut off the Niemodlin Forests area, which is the main reason for the fragmentation of the largest compact forest complex. In 1825, tree ecosystems were concentrated in river valleys, with a significant part of them currently located on former arable land, where use was abandoned. The share of tree plantings increased and spread as a result of ecological succession. The largest new tree complex, located in the west, covered a large wasteland after the former military training ground was deconstructed. Meadow and pasture ecosystems in 1825 were the dominant type of ecosystem in river valleys. Currently, larger areas of the valleys are used as arable land or have been afforested. Former compact and large meadow complexes have been fragmented. In 1825, the share of aquatic ecosystems was significantly larger in the Niemodlin Forests. They occurred in the form of pond complexes in the northern and central parts. A large portion of these ponds has disappeared, converted into arable or forested land. The main arable land complexes occurred in both periods in the western and central parts of the analyzed area. Developed areas increased the most in the central part of the Tułowice area, which was a small village in 1825 and a city in 2019, as well as in the northeast, where there were semiurbanization processes related to the development of the city of Opole.

3.3. Changes in the Spatial Composition of the Landscape in Terms of Individual Groups of Escosystems

With minor changes in the surface shares of individual types of ecosystems in the Niemodlin Forests between 1825 and 2019, the structure of the landscape composition changed significantly. The number of ecosystem patches (NPs) that were responsible for landscape fragmentation and the degradation of ecosystems, characterized by high biodiversity, have increased. For arable land, the increase was relatively small, from 193 to 210 plots, and very large for built-up areas, from 156 to 233 plots. This indicates that the increase in the share of built-up areas does not take place only in compact spatial units and the maintaining of the number of these units. The dispersion of buildings is unfavorable for the protection of biodiversity.
In the group of ecosystems responsible for supporting ecosystem services for biodiversity protection, unfavorable tendencies were mostly noticeable. For surface water ecosystems, a large decrease in the surface share was associated with a decrease in the number of patches, which means that these ecosystems are disappearing in the landscape. For marshlands, meadows and pastures, the number of patches increased, while the surface area decreased. This indicates both the disappearance and fragmentation of once large surfaces. The reduction in the unitary surface of marshlands and meadows and pastures was very unfavorable because negative external impacts on these ecosystems increased. A large increase in the number of trees was accompanied by a large increase in the number of patches, from 251 to 469. Tree plantings do not form compact, large areas, which would be beneficial. They occur in mosaics with other types of ecosystems. Preferably, the value of the NP indicator is for forests. Their share increased and the number of patches increased slightly, from 65 to 67. The increase in forest cover in the Niemodlin Forests took place through the afforestation of areas that were directly adjacent to existing complexes, which is beneficial for supporting ecosystem services.
In the index of the number of patches of individual types of Niemodlin Forests ecosystems per unit area, the PD for ecosystems degrading the natural values of the area is similar. As for arable land in both studied periods, it amounted to 0.4 plot/100 ha of landscape, and for built-up areas it increased from 0.3 plot/100 ha in 1825 to 0.5 plot per 100 ha in 2019 (Table 2). For natural ecosystems, it was 0.9 plot/100 ha in 2019 for trees and shrubs, the largest increase for this type of ecosystem and the largest increase overall, from 0.5 plot/100 ha in 1825 (Table 3). It also reached high values for meadows and pastures with low growth dynamics between 1825 and 2019. The value of this indicator decreased for surface water ecosystems, from 0.3 to 0.2, and for marshlands it was close to 0.
Large forest complexes dominate the area of the Niemodlin Forests. The Largest Patch Index for forests was 43.6% in 1825, and in 2019 it increased to 52.2%. This confirms the favorable process of increasing the forest cover of the area by extending existing forest complexes. For other ecosystems, the value of the indicator did not exceed 1% in both analyzed periods, except for arable land, which was 4.2% in 1825 and fell to 3.3% in 2019. A significant increase in the LPI ratio for built-up areas is significant, from 0.1% in 1825 to 0.6% in 2019. This indicates a very large increase in the largest settlement units from the Niemodlin Forests area.
The average area of ecosystem patches (AREA_MN) is the largest for forests. It amounted to 505.8 ha in 1825 and decreased to 495.0 in 2019. The average area of arable land is almost nine times smaller than that of the forests and was very similar in both periods—57.0–58.5 ha. Other types of ecosystems have a very small average area, and only for built-up areas did it increase from 5.8 ha to 6.8 ha. In other ecosystems there was a decrease in the average area of the lobe: marshy ecosystems decreased very strongly from 15.5 ha to 4.9 ha and meadows and pastures from 9.4 ha to 4.8 ha. The decrease in the average surface area of these ecosystems and the strongest decreases in the share in the landscape indicate that they are among the ecosystems most at risk of disappearance, together with the supporting ecosystem services.
For all the types of ecosystems studied, with the exception of built-up areas, the value of GYRATE_MN inertia index decreased in 1825–2019, which corresponds to a large increase in the share of built-up areas in the landscape, an increase in the number of patches and their average area.
The largest ratios of lobe circumferences to their surfaces (PARA_MN) generally corresponded to ecosystems with the smallest average lobes. The highest value of this indicator increased for marshlands, from 385.6 m/ha in 1825 to 831.3 m/ha in 2019, and for tree stands, from 884.1 m/ha in 1825 to 1208.9 m/ha in 2019. The indicator also increased between 1825 and 2019 for developed areas, forests, meadows and pastures, as well as surface waters. Only for arable lands did it decrease. This indicates that the landscape of the Niemodlin Forests is more complex in 2019 compared to 1825, and that ecotonic influences have increased in the area. This may mean an increase in biodiversity, as ecotonic structures are characterized as species accumulation areas [59]. Increasing the share of ecotones is conducive to increasing the ecological potential and achieving the objectives of the protection of the Niemodlin Forests. However, the increase in the proportion of ecotones, in relation to the inside of the lobes, reduces the biodiversity of species requiring large ecosystem areas to occur. The increase in the ecotonic effect, in particular, weakens the ecosystem potential for creating optimal habitat conditions for species that are typical in swamps, followed by tree stands and forests. In the case of trees and forests, the unfavorable process was compensated by the increase in their overall area. At the same time, for marshes, meadows and pastures, as well as surface waters, the surface decreased, which is unfavorable.
Similar values of the Mean Contiguity Index were found for all types of ecosystems in 1825 and 2019. These values slightly decreased in the analyzed period for built-up areas, trees and marshlands, by 0.1. The landscape of the Niemodlin Forests in the analyzed period is characterized by a similar degree of dispersion of individual ecosystems.
A very important index for diagnosing the spatial structure of the landscape, from the point of view of ecosystem functions ensuring the possibility of species migration, is the Connectance Index. In the group of natural and semi-natural ecosystems in the analyzed period, its value increased for forests from 0.5% to 0.7%, surface waters from 0.2% to 0.5% and marshes from 0.0% to 2.8%. It remained unchanged for trees and decreased for meadows and pastures from 0.2% to 0.1%. From the point of view of supporting ecosystem services related to the protection of biodiversity, the increase in the value of this indicator for arable land and built-up areas is unfavorable. Increasing the connections between these ecosystems indicate their expansion.
The survey indicated high values on the Landscape Division Index, which, apart from forests, did not change in the period of 1825–2019. In forests, the value of this indicator decreased from 0.8 to 0.7. This is the only type of ecosystem that is relatively poorly divided.
The value of the Effective Mesh Size landscape fragmentation index is the largest for forest ecosystems, indicating their compact nature. The compactness of these ecosystems increased significantly between 1825 and 2019. Arable land is also quite compact, compared to other ecosystems, but its compactness has decreased. The value of the indicator for other ecosystems does not exceed 10. It increased many times in the examined period for developed areas and trees and shrubs, and decreased for meadows and pastures, surface waters and marshlands. This again indicates a significant weakening of the ecosystem functions that are related to the protection of biodiversity of ecosystems associated with hydrogenic habitats.
The Splitting Index comparison leads to similar conclusions. It has the lowest value for forest ecosystems, and this value decreased between 1825 and 2019 from 5.0 to 3.6. Forest fragmentation decreased during this period. The fragmentation of the second type of ecosystem, with a relatively compact nature of occurrence, increased—arable land reached in 1825 the index value of 346.7, and in 2019 of 412.0. The values obtained for the remaining types of ecosystems indicate their strong fragmentation. It increased significantly for marshes, compared to 1825, less so for surface waters and the least for meadows and pastures. It decreased significantly for developed areas and trees.

3.4. Changes in the Spatial Composition of the Landscape

In the years 1825–2019, various changes in the values of indicators of the spatial composition of the landscape were noted in the Niemodlin Forests area (Table 4). The density of PD patches increased significantly from 2.26 in 1825 to 2.81 in 2019. This indicates a fragmentation of the spatial structure of the landscape by approx. 24%, compared to the initial state from 1825. It increased by 4% in total boundaries between all types of TE ecosystems, indicating an increase in the fragmentation and complexity of the landscape structure. The density of the ED borders increased by 6% in the analyzed period.
In the period 1825–2019, the average patch area decreased from 44.3 ha to 34.8 ha, i.e., by 21%. The perimeter to surface ratio (PARA) for all ecosystems of the Niemodlin Forests increased by 35%, compared to 1825. The Mean Contiguity Index value decreased by 7%, which indicates an increase in the degree of isolation of individual ecosystems. The Perimeter-Area Fractal Dimension Index increased by 1%, which indicates a slight increase in the complexity of ecosystem shapes. The contrast of landscape boundaries, measured by the Contrast-Weighted Edge Density Index, increased by 7%, and by 3% when measured by the Total Edge Contrast Index, thus confirming the increase in the degree of structural and functional isolation of ecosystems. The value of the Connectance Index decreased by 10%, confirming the progressing fragmentation of the landscape and the increase in the spatial isolation of the patches. The Landscape Division Index has decreased by the same amount.
In the analyzed period, the value of the Effective Mesh Size index increased by 37%, and the value of the Splitting Index decreased by 24%. The Shannon’s Diversity Index decreased by 4%, and the Simpson’s Diversity Index decreased by 5%.

4. Conclusions

In the period of 1825–2019, there were no significant changes in the area shares of individual types of ecosystems in the Niemodlin Forests. The changes, considered by the total surface shares of individual types of ecosystems, did not exceed the value of 2.2%. Seemingly, the area has not significantly changed its ecological potential in the field of biodiversity protection. Theoretically, this would indicate the good behavior of supporting ecosystem services related to the protection of biodiversity in this area. The analysis of the indicators of the spatial composition of the landscape indicates, however, that with small changes in the share, the area’s functionality for biodiversity protection has been significantly reduced, especially for ecosystems related to the freshwater environment—i.e., water reservoirs, swamps and wet meadows.
The research shows that, in the analyzed area, the share of forests increased slightly, which is a positive phenomenon for an isolated, large forest complex. At the same time, however, the primary shares of wetland, meadow and pasture and water ecosystems have significantly decreased. An increase in forest cover does not necessarily mean an increase in the natural values of the protected areas or an improvement in the functioning of supporting ecosystem services. It is important to consider the expense of increasing forest cover in ecosystems. The afforestation of arable lands is favorable. Increasing forest cover at the expense of meadows and pastures, surface waters and marshlands is not beneficial for ecosystem services related to biodiversity protection. Meadows and pastures occupied small areas in the study area in 1825 and 2019, but at the same time the share of meadows decreased by about 40%. A slight increase in the forest ecosystem area, at the expense of meadow grass, will not significantly change the conditions for the protection of forest biodiversity, but it dramatically reduces the conditions for the protection of meadow species—not only because it greatly reduces the surface of meadows, but also because it fragments former large meadow areas, increasing their spatial isolation. In addition, the meadows in the Niemodlin Forests in 1825 were strongly associated with wetlands, which could not be cultivated as arable land. The entire wetland complex, i.e., meadows, surface waters and swamps, occupied, and still occupy, small shares in the landscape, and in the analyzed period these shares decreased from about 40% to 60%. Any further reduction of the surface of these ecosystems is not beneficial, and they should be particularly protected in the policy of sustainable development.
In the study of changes in the spatial structure of the landscape of areas with high natural values, more attention should be paid to ecosystems that often occur in small surface proportions, because even small global changes in their surface may have large negative effects on the protection of biodiversity.
During the period under study, the spatial composition of the landscape changed significantly, which affects the value of habitats for individual groups of species. Supporting ecosystem services related to the protection of biodiversity for wetlands and water, as well as meadows and pastures, have drastically decreased. The spatial isolation of these habitats has decreased by more than half. The hydrogenic habitats and groups of flora and fauna of these habitats are under threat in the Niemodlin Forests.
The assessment of changes in the functioning of ecosystem services in different periods of time for a specific area, based only on the surface share of certain types of ecosystems, may lead to misinterpretation. Research in the Niemodlin Forests between 1825 and 2019 does not indicate the occurrence of large changes in the surface share of individual ecosystems, but assessment of the composition structure of the landscape, suggesting the occurrence of significantly larger changes. Through the evolution of high natural values, the surfaces of individual ecosystems may change a little, but at the same time the landscape fragmentation and spatial isolation of ecosystems can increase significantly. This is unfavorable for the preservation of natural values.
Research using landscape metrics indicates the importance of ecotones in the functioning of ecosystem services related to the protection of biodiversity. The progressive fragmentation of the landscape increases the length of ecotonic structures. In order to increase the effectiveness of biodiversity protection, instruments to protect ecotone zones should be strengthened in the protection policy [66]—in particular, those associated with endangered ecosystems of water, swamps and meadows.
Studies indicate that landscape indicators covering the entire study area should be interpreted cautiously. They do not depict changes occurring in individual classes of land cover, but are an average image of the whole landscape. Meanwhile, each type of ecosystem has a different role in supporting the ecosystem services related to biodiversity protection. Indicators should be analyzed separately for individual classes of ecosystems and separately for the whole landscape.
Studies on the changes in the structure and composition of the landscape using landscape indicators should be the basis for sustainable landscape planning, including ecosystem services [41]. Landscape models [67] associated with assessments of the impact of economic activity on changes in the landscape structure [68] are helpful for this.
In light of the research results, the nature protection policy as well as spatial planning and development should change. For the sustainable development of the Niemodlin Forests area, it is necessary to strengthen the policy for the protection of ecosystems related to the aquatic and wetland environment. The protection of these ecosystems, as well as the creation of new water reservoirs, meadow areas and bogging areas, are favorably correlated with the need to counteract the effects of climate change, in particular drought. There is a need to correlate nature protection policy and counteract the effects of climate change in the field of water retention in the landscape. To protect the ecotones, it is necessary to plan new built-up areas far away from forest border areas with meadows, tree stands and surface waters. It is also necessary to limit the scattering of buildings and the location of residential and service areas in ecological corridor bands that connect adjacent patches of forests and other natural ecosystems. For the protection of the Niemodlin Forests, a new spatial policy is needed to take greater account of the degradation of valuable ecosystems and to limit fragmentation processes. The assessment of the potential of performing ecosystem functions—related to the protection of biodiversity only on the basis of the analysis of general changes in the share of individual ecosystems in the landscape in different periods of time—does not guarantee the sustainable and balanced development of forest areas.

Author Contributions

Conceptualization, K.B. and R.W.; data curation, R.W.; formal analysis, K.B. and R.W.; funding acquisition, K.B. and R.W.; methodology, K.B. and R.W.; project administration, K.B. and R.W.; supervision, K.B.; validation, R.W.; visualization, K.B. and R.W.; writing—original draft, K.B. and R.W.; writing—review & editing, K.B. and R.W. All authors have read and agreed to the published version of the manuscript.

Funding

This research was funded by University of Opole (funds for scientific research of the Institute of Human Geography and Spatial Management).

Conflicts of Interest

The authors declare no conflict of interest.

References

  1. Forman, R.T.T.; Godron, M. Patches and Structural Components for A Landscape Ecology. BioScience 1981, 31, 733–740. [Google Scholar] [CrossRef]
  2. Forman, R.T.T.; Godron, M. Landscape Ecology; J. Wiley & Sons: New York, NY, USA, 1986. [Google Scholar]
  3. Wu, J. Landscape sustainability science: Ecosystem services and human well-being in changing landscapes. Landsc. Ecol. 2013, 28, 999–1023. [Google Scholar] [CrossRef]
  4. Franklin, J.F.; Forman, R.T. Creating landscape patterns by forest cutting: Ecological consequences and principles. Landsc. Ecol. 1987, 1, 5–18. [Google Scholar] [CrossRef]
  5. Lindenmayer, D.B.; Franklin, J.F. Conserving Forest Biodiversity: A Comprehensive Multiscaled Approach; Island Press: Washington, DC, USA, 2002; p. 352. [Google Scholar]
  6. Riccioli, F.; Marone, E.; Boncinelli, F.; Tattoni, C.; Rocchini, D.; Fratini, R. The recreational value of forests under different management systems. New For. 2018, 1–16. [Google Scholar] [CrossRef] [Green Version]
  7. Egarter Vigl, L.; Tasser, E.; Schirpke, U.; Tappeiner, U. Using land use/land cover trajectories to uncover ecosystem service patterns across the Alps. Reg. Environ. Chang. 2017. [Google Scholar] [CrossRef] [Green Version]
  8. Tattoni, C.; Ianni, E.; Geneletti, D.; Zatelli, P.; Ciolli, M. Landscape changes, traditional ecological knowledge and future scenarios in the Alps: A holistic ecological approach. Sci. Total Environ. 2017, 579, 27–36. [Google Scholar] [CrossRef]
  9. Hobbs, R.J.; Higgs, E.S.; Hall, C.M. Novel Ecosystems: Intervening in the New World Order; Wiley: Oxford, UK, 2013. [Google Scholar]
  10. Bouma, J.A.; Van Beukering, P.J.H. (Eds.) Ecosystem Services: From Concept to Practice; Cambridge Univeristy Press: Cambridge, UK, 2015. [Google Scholar]
  11. Potschin, M.; Haines-Young, R.; Fish, R.; Turner, R.K. (Eds.) Routledge Handbook Of Ecosystem Services; Routledge: London, UK, 2016. [Google Scholar]
  12. Von Haaren, C.; Lovett, A.A.; Albert, C. (Eds.) Landscape Planning with Ecosystem Services. Theories and Methods for Application in Europe; Landscape Series 24; Springer Nature Dordrecht: Berlin/Heidelberg, Germany, 2016. [Google Scholar]
  13. Grunewald, K.; Bastian, O. Ecosystem Services—Concept, Methods and Case Studies; Springer: Berlin/Heidelberg, Germany, 2015. [Google Scholar]
  14. Carpenter, S.R.; Pingali, P.; Bennet, E.M.; Zurek, M.B. (Eds.) Millennium Ecosystem Assessment. Ecosystems and Human Well-being: Scenarios. Millennium Ecosystem Assessment; Island Press: Washington, DC, USA, 2005; p. 245. [Google Scholar]
  15. Hooper, D.U.; Chapin, F.S.; Ewel, J.J.; Hector, A.; Inchausti, P.; Lavorel, S.; Lawton, J.H.; Lodge, D.M.; Loreau, M.; Naeem, S.; et al. Effects of biodiversity on ecosystem functioning: A consensus of current knowledge. Ecol Monog 2005, 75, 3–35. [Google Scholar] [CrossRef]
  16. Costanza, R.; Fisher, B.; Mulder, K.; Liu, S.; Christopher, T. Biodiversity and ecosystem services: A multi-scale empirical study of the relationship between species rich-ness and net primary production. Ecol. Econ. 2007, 61, 478–491. [Google Scholar] [CrossRef]
  17. Hector, A.; Bagchi, R. Biodiversity and ecosystem multifunctionality. Nature 2007, 448, 188–190. [Google Scholar] [CrossRef]
  18. Elmqvist, T.; Maltby, E.; Barker, T.; Mortime, M.; Perrings, C. TEEB, Ecological and Economic Foundation Draft Chapters-Chapter 2: Biodiversity, Ecosystems and Ecosystem Services; UNEP: Geneva, Switzerland, 2010. [Google Scholar]
  19. Schneiders, A.; Van Daele, T.; Van Landuyt, W.; Van Reeth, W. Biodiversity and ecosystem services: Complementary approaches for ecosystem management? EcolIndic 2012, 21, 123–133. [Google Scholar] [CrossRef]
  20. Linder, P.; Östlund, L. Structural changes in three mid-boreal Swedish forest landscapes, 1885–1996. Biol. Conserv. 1998, 85, 9–19. [Google Scholar] [CrossRef]
  21. Rodríguez-Echeverry, J.; Echeverría, C.; Oyarzún, C.; Morales, L. Impact of land-use change on biodiversity and ecosystem services in the Chilean temperate forests. Landsc. Ecol. 2018, 33, 439–453. [Google Scholar] [CrossRef]
  22. MacDonald, D.; Crabtree, J.R.; Wiesinger, G.; Dax, T.; Stamou, N.; Fleury, P.; Lazpita, J.G.; Gibon, A. Agricultural abandonment in mountain areas of Europe: Environmental consequences and policy response. J. Environ. Manag. 2000, 59, 47–69. [Google Scholar] [CrossRef]
  23. Ciolli, M.; Tattoni, C.; Ferretti, F. Understanding forest changes to support planning: A fine-scale Markov chain approach. In Developments in Environmental Modelling; Elsevier: Amsterdam, The Netherlands, 2012; pp. 355–373. [Google Scholar] [CrossRef]
  24. Carpenter, S.; Mooney, H.; Agard, J.; Capistrano, D.; Defries, R.S.; Díaz, S.; Dietz, T.; Duraiappah, A.K.; Oteng-Yeboah, A.; Pereira, H.M.; et al. Science for managing ecosystem services: Beyond the millennium ecosystem assessment. Proc. Natl. Acad. Sci. USA 2009, 106, 1305–1312. [Google Scholar] [CrossRef] [Green Version]
  25. Iverson, L.; Echeverria, C.; Nahuelhual, L.; Luque, S. Ecosystem services in changing landscapes: An introduction. Lands Ecol. 2014, 29, 181–186. [Google Scholar] [CrossRef]
  26. McGarigal, K.; Cushman, S.A.; Ene, E. FRAGSTATS v4: Spatial Pattern Analysis Program for Categorical and Continuous Maps. Computer Software Program Produced by the Authors at the University of Massachusetts, Amherst. 2012. Available online: http://www.umass.edu/landeco/research/fragstats/fragstats.html (accessed on 23 March 2020).
  27. Syrbe, R.U.; Walz, U. Spatial indicators for the assessment of ecosystem services: Providing, benefiting and connecting areas and landscape metrics. Ecol. Indic. 2012, 21, 80–88. [Google Scholar] [CrossRef]
  28. Waltz, U. Landscape Structure, Landscape Metrics and Biodiversity. Living Rev. Landsc. Res. 2011, 5, 1–35. [Google Scholar] [CrossRef]
  29. Marshall, E.; Wintle, B.A.; Southwell, D.; Kujala, H. What are we measuring? A review of metrics used to describe biodiversity in offsets exchanges. Biol. Conserv. 2020, 241, 1–8. [Google Scholar] [CrossRef]
  30. Dittrich, A.; Wehrden, H.; Abson, D.J.; Bartkowski, B.; Cord, A.; Fust, P.; Hoyer, C.; Kambach, S.; Meyer, M.A.; Radzeviciute, R.; et al. Mapping and analysing historical indicators of ecosystem services in Germany. Ecol. Indic. 2017, 75, 101–110. [Google Scholar] [CrossRef]
  31. Niemandt, C.; Greve, M. Fragmentation metric proxies provide insights into historical biodiversity loss in critically endangered grassland. Agric. Ecosyst. Environ. 2016, 235, 172–181. [Google Scholar] [CrossRef]
  32. Morelli, F.; Jiguet, F.; Sabatier, R.; Dross, C.; KarinePrince, K.; Tryjanowski, P.; Tichit, M. Spatial covariance between ecosystem services and biodiversity pattern at a national scale (France). Ecol. Indic. 2017, 82, 574–586. [Google Scholar] [CrossRef]
  33. Herzog, F.; Lausch, A.; Müller, E.; Thulke, H.H.; Steinhardt, U.; Lehmann, S. Landscape metrics for assessment of landscape destruction and rehabilitation. Environ. Manag. 2001, 27, 91–107. [Google Scholar] [CrossRef]
  34. Frank, S.; Fürst, C.; Koschke, L.; Makeschin, F. A contribution towards a transfer of the ecosystem service concept to landscape planning using landscape metrics. Ecol. Indic. 2012, 21, 30–38. [Google Scholar] [CrossRef]
  35. Almeida, D.; Rocha, J.; Neto, C.; Arsenio, P. Landscape metrics applied to formerly reclaimed saltmarshes: A tool to evaluate ecosystem services? Estuar. Coast. Shelf Sci. 2016, 181, 100–113. [Google Scholar] [CrossRef]
  36. Lamy, T.; Liss, K.N.; Gonzales, A.; Bennett, E.M. Landscape structure affects the provision of multiple ecosystem services. Environ. Res. Lett. 2016, 11, 124017. Available online: http://iopscience.iop.org/1748-9326/11/12/124017 (accessed on 23 March 2020). [CrossRef]
  37. Duarte, G.T.; Santos, P.M.; Cornelissen, T.G.; Ribeiro, M.C.; Paglia, A.P. The effects of landscape patterns on ecosystem services: Meta-analyses of landscape services. Landsc. Ecol. 2018, 33, 1247–1257. [Google Scholar] [CrossRef] [Green Version]
  38. Hooftman, D.A.P.; Bullock, J.M. Mapping to inform conservation: A case study of changes in semi-natural habitats and their connectivity over 70 years. Biol. Conserv. 2012, 145, 30–38. [Google Scholar] [CrossRef]
  39. Liu, S.; Dong, Y.; Deng, L.; Liu, L.; Zhao, H.; Dong, S. Forest fragmentation and landscape connectivity change associated with road network extension and city expansion: A case study in the Lancang River Valley. Ecol. Indic. 2014, 36, 160–168. [Google Scholar] [CrossRef]
  40. Ren, Z.; Peng, H.; Liu, Z.W. The rapid climate change-caused dichotomy on subtropical evergreen broad-leaved forest in Yunnan: Reduction in habitat diversity and increase in species diversity. Plant Divers 2016, 38, 142–148. [Google Scholar] [CrossRef] [Green Version]
  41. Chan, K.M.A.; Shaw, M.R.; Cameron, D.R.; Underwood, E.C.; Daily, G.C. Conservation planning for ecosystem services. Public Libr. Sci. Biol. 2006, 4, e379. [Google Scholar] [CrossRef] [Green Version]
  42. Solon, J.; Borzyszkowski, J.; Bidłasik, M.; Richling, A.; Badora, K.; Balon, J.; Brzezińska-Wójcik, T.; Chabudziński, Ł.; Dobrowolski, R.; Grzegorczyk, I.; et al. Physico-geographical mesoregions of Poland: Verification and adjustment of boundaries on the basis of contemporary spatial data. Geogr. Pol. 2018, 91, 143–170. [Google Scholar] [CrossRef]
  43. Jędrzejewski, W.; Nowak, S.; Stachura, K.; Skierczyński, M.; Mysłajek, R.W.; Niedziałkowski, K.; Jędrzejewska, B.; Wójcik, J.M.; Zalewska, H.; Pilot, M.; et al. Projekt Korytarzy Ekologicznych Łączących Europejską Sieć Natura 2000 w Polsce; Zakład Badania Ssaków PAN: Białowieża, Poland, 2011. [Google Scholar]
  44. Konias, A. Kartografia topograficzna państwa i zaboru pruskiego od II połowy XVIII wieku do połowy XX wieku; Wydawnictwo Naukowe Akademii Pomorskiej w Słupsku: Słupsk, Poland, 2010; p. 232. [Google Scholar]
  45. Lorek, D. Potencjał informacyjny map topograficznych z lat 1822-33 (Urmesstischblätter) z terenu Wielkopolski, praca doktorska, maszynopis; Uniwersytet Adama Mickiewicza w Poznaniu: Poznań, Poland, 2011. [Google Scholar]
  46. Urbański, J. GIS w badaniach przyrodniczych; Wydawnictwo Uniwersytetu Gdańskiego: Gdańsk, Poland, 2008; p. 252. [Google Scholar]
  47. Goodchild, M.; Gopal, S. (Eds.) Accuracy of Spatial Databases; Taylor and Francis: London, UK, 1989; p. 308. [Google Scholar]
  48. Kraak, M.J.; Ormeling, F. Cartography: Visualization of Spatial Data; Routledge: London, UK, 2013; p. 204. [Google Scholar]
  49. Van Der Zee, D. GIS and landscape change analysis. In GIS i teledetekcja w badaniach struktury i funkcjonowania krajobrazu; Nienartowicz, A., Kunz, M., Eds.; UMK: Toruń, Poland, 2001; pp. 27–38. [Google Scholar]
  50. Pontius, J.R. Quantification error versus location error in the comparison of categorical maps. Photogramm. Eng. Remote Sens. 2000, 66, 1011–1016. [Google Scholar]
  51. Hagen, A. Fuzzy set approach to assessing similarity of categorical maps. Int. J. Geogr. Inf. Sci. 2003, 17, 235–249. [Google Scholar] [CrossRef] [Green Version]
  52. Gobbi, S.; Ciolli, M.; La Porta, N.; Rocchini, D.; Tattoni, C.; Zatelli, P. New Tools for the Classification and Filtering of Historical Maps. ISPRS Int. J. Geo-Information 2019, 8, 455. [Google Scholar] [CrossRef] [Green Version]
  53. Butchart, S.H.M.; Walpole, M.; Collen, B.; van Strien, A.; Scharlemann, J.P.W.; Almond, R.A.E.; Baillie, J.E.M.; Bomhard, B.; Brown, C.; Bruno, J.; et al. Global biodiversity: Indicators of recent declines. Science 2010, 328, 1164–1168. [Google Scholar] [CrossRef]
  54. Lindenmayer, D. Land use intensification in natural forest settings. In Land Use Intensification: Effects on Agriculture, Biodiversity and Ecological Processes; Lindenmayer, D., Cunningham, S., Young, A., Eds.; CSIRO Publishing: Clayton, Australia, 2012; pp. 113–121. [Google Scholar] [CrossRef]
  55. Lindenmayer, D. Interactions between forest resource management and landscape structure. Curr. Lands Ecol. Rep. 2016, 1, 10–18. [Google Scholar] [CrossRef]
  56. Vihervaara, P.; Rönkä, M.; Walls, M. Trends in ecosystem service research: Early steps and current drivers. AMBIOA J. Hum. Environ. 2010, 39, 314–324. [Google Scholar] [CrossRef]
  57. Pan, Y.; Xu, Z.; Wu, J. Spatial differences of the supply of multiple ecosystem services and the environmental and land use factors affecting them. Ecosyst. Serv. 2013, 5, 4–10. [Google Scholar] [CrossRef]
  58. Bai, Y.; Zhuang, C.; Ouyang, Z.; Zheng, H.; Jiang, B. Spatial characteristics between biodiversity and ecosystem services in a human-dominated watershed. Ecol. Complex 2011, 8, 177–183. [Google Scholar] [CrossRef]
  59. Krajewski, P.; Solecka, I.; Mrozik, K. Forest Landscape Change and Preliminary Study on Its Driving Forces in Ślęża Landscape Park (Southwestern Poland) in 1883–2013. Sustainability 2018, 10, 4526. [Google Scholar] [CrossRef] [Green Version]
  60. Szymura, T.H.; Murak, S.; Szymura, M.; Raduła, M.W. Changes in forest cover in Sudety Mountains during the last 250 years: Patterns, drivers, and landscape-scale implications for nature conservation. Acta Soc. Bot. Pol. 2018, 87, 1–14. [Google Scholar] [CrossRef]
  61. Sobala, M.; Rahmonov, O.; Myga-Piątek, U. Historical and contemporary forest ecosystem changes in the Beskid Mountains (southern Poland) between 1848 and 2014. iForest Biogeosci. For. 2017, 10, 939–947. [Google Scholar] [CrossRef] [Green Version]
  62. Kozak, J. Forest cover change in the Western Carpathians in the past 180 years: A case study in the Orawa region in Poland. Mt. Res. Dev. 2003, 23, 369–375. [Google Scholar] [CrossRef] [Green Version]
  63. Szabo, P. Driving forces of stability and change in woodland structure: A case-study from the Czech lowlands. For. Ecol. Manag. 2010, 259, 650–656. [Google Scholar] [CrossRef]
  64. Plieninger, T.; Draux, H.; Fagerholm, N.; Bieling, C.; Bürgi, M.; Kizos, T.; Kuemmerle, T.; Primdahl, J.; Verburg, P.H. The driving forces of landscape change in Europe: A systematic review of the evidence. Land Use Policy 2016, 57, 204–214. [Google Scholar] [CrossRef] [Green Version]
  65. Krajewski, P. Monitoring of Landscape Transformations within Landscape Parks in Poland in the 21st Century. Sustainability 2019, 11, 2410. [Google Scholar] [CrossRef] [Green Version]
  66. Kark, S. Effects of Ecotones on Biodiversity. In Reference Module in Life Sciences; Elsevier: Amsterdam, The Netherlands, 2017. [Google Scholar] [CrossRef]
  67. Ferrier, S.; Drielsma, M.J. Synthesis of pattern and process in biodiversity conservation assessment: A flexible whole-landscape modelling framework. Divers. Distrib. 2010, 16, 386–402. [Google Scholar] [CrossRef]
  68. Southworth, J.; Nagendra, H.; Tucker, C. Fragmentation of a landscape: Incorporating landscape metrics into satellite analyses of land-cover change. Landsc. Res. 2002, 27, 253–269. [Google Scholar] [CrossRef]
Figure 1. Study area.
Sustainability 12 04237 g001
Figure 2. Area share (PLAND) of individual types of ecosystems in Niemodlin Forests, in 1825 and 2019.
Sustainability 12 04237 g002
Figure 3. Changes in the spatial structure of developed areas and arable lands between 1825 and 2019.
Sustainability 12 04237 g003
Figure 4. Changes in the spatial structure of forests, trees and shrubs, meadows, water and marshlands between 1825 and 2019.
Sustainability 12 04237 g004
Table 1. List of used Urmesstischblätter map sheets.
SheetSymbol (Sheet Number)The Year of PublicationSource
Bösdorf31941825National Library of Berlin
Dambrau31411825National Library of Berlin
Falkenberg31401825National Library of Berlin
Grottkau31391825National Library of Berlin
Krappitz32521825National Library of Berlin
Löwen30811825National Library of Berlin
Oppeln31421825National Library of Berlin
Proskau31971825National Library of Berlin
Psychod31961825National Library of Berlin
Schelitz32511825National Library of Berlin
Schurgast30821825National Library of Berlin
Tillowitz31951825National Library of Berlin
Table 2. Changes in the indicators of the spatial structure of ecosystems degrading the functions of supporting ecosystem services for biodiversity protection in arable land and built-up areas in Niemodlin Forests, in 1825 and 2019.
Landscape Structure IndexArable LandsDeveloped Areas
1825201918252019
CA11,284.811,976.1901.21573.1
PLAND22.323.71.83.1
NP193.0210.0156.0233.0
PD0.40.40.30.5
LPI4.23.30.10.6
AREA_MN58.557.05.86.8
GYRATE_MN243.0225.692.8122.0
PARA_MN417.1399.0520.4672.5
CONTIG_MN0.90.90.90.8
CONNECT0.50.60.10.2
DIVISION1.01.01.01.0
MESH145.9122.70.32.7
SPLIT346.7412.0156,725.118,627.0
Table 3. Changes in the indicators of the spatial structure of ecosystems responsible for the functions of supporting ecosystem services for biodiversity protection in forests, trees and shrubs, meadows, surface waters and marshlands areas in Niemodlin Forests in 1825 and 2019.
Landscape Structure IndexForestsTrees and ShrubsMeadowsWaterMarshlands
1825201918252019182520191825201918252019
CA32,876.933,165.9806.01366.62807.71694.11793.2724.192.944.2
PLAND65.065.61.62.75.63.43.51.40.20.1
NP65.067.0251.0469.0298.0356.0172.0107.06.09.0
PD0.10.10.50.90.60.70.30.20.00.0
LPI43.652.20.11.20.40.40.30.30.20.0
AREA_MN505.8495.03.22.99.44.810.46.815.54.9
GYRATE_MN442.1386.4106.473.9137.988.0107.292.8124.8113.0
PARA_MN327.3436.0884.11208.9564.9661.3568.5675.6385.6831.3
CONTIG_MN0.90.90.80.70.80.80.80.80.90.8
CONNECT0.50.70.10.10.20.10.20.50.02.8
DIVISION0.80.71.01.01.01.01.01.01.01.0
MESH10,093.713,871.90.37.63.01.72.10.70.10.0
SPLIT5.03.6165,065.26689.616,848.029,463.923,931.668,614.8373,839.64,826,586.9
Table 4. Changes in the indicators of the spatial structure landscape of the Niemodlin Forests in 1825 and 2019.
Landscape Structure Index18252019
TA50,562.8650,544.02
PD2.262.81
TE1,445,560.001,502,490.00
ED28.5930.28
AREA_MN44.3134,83
GYRATE_MN155.21123.10
PARA_MN590.10793.84
CONTIG_MN0.840.78
PAFRAC1.281.29
CWED14.2415.24
TECI38.3039.60
CONNECT0.200.18
DIVISION0.800.72
MESH10,245.3914,007.35
SPLIT4.943.61
SHDI1.041.00
SHEI0.540.52

