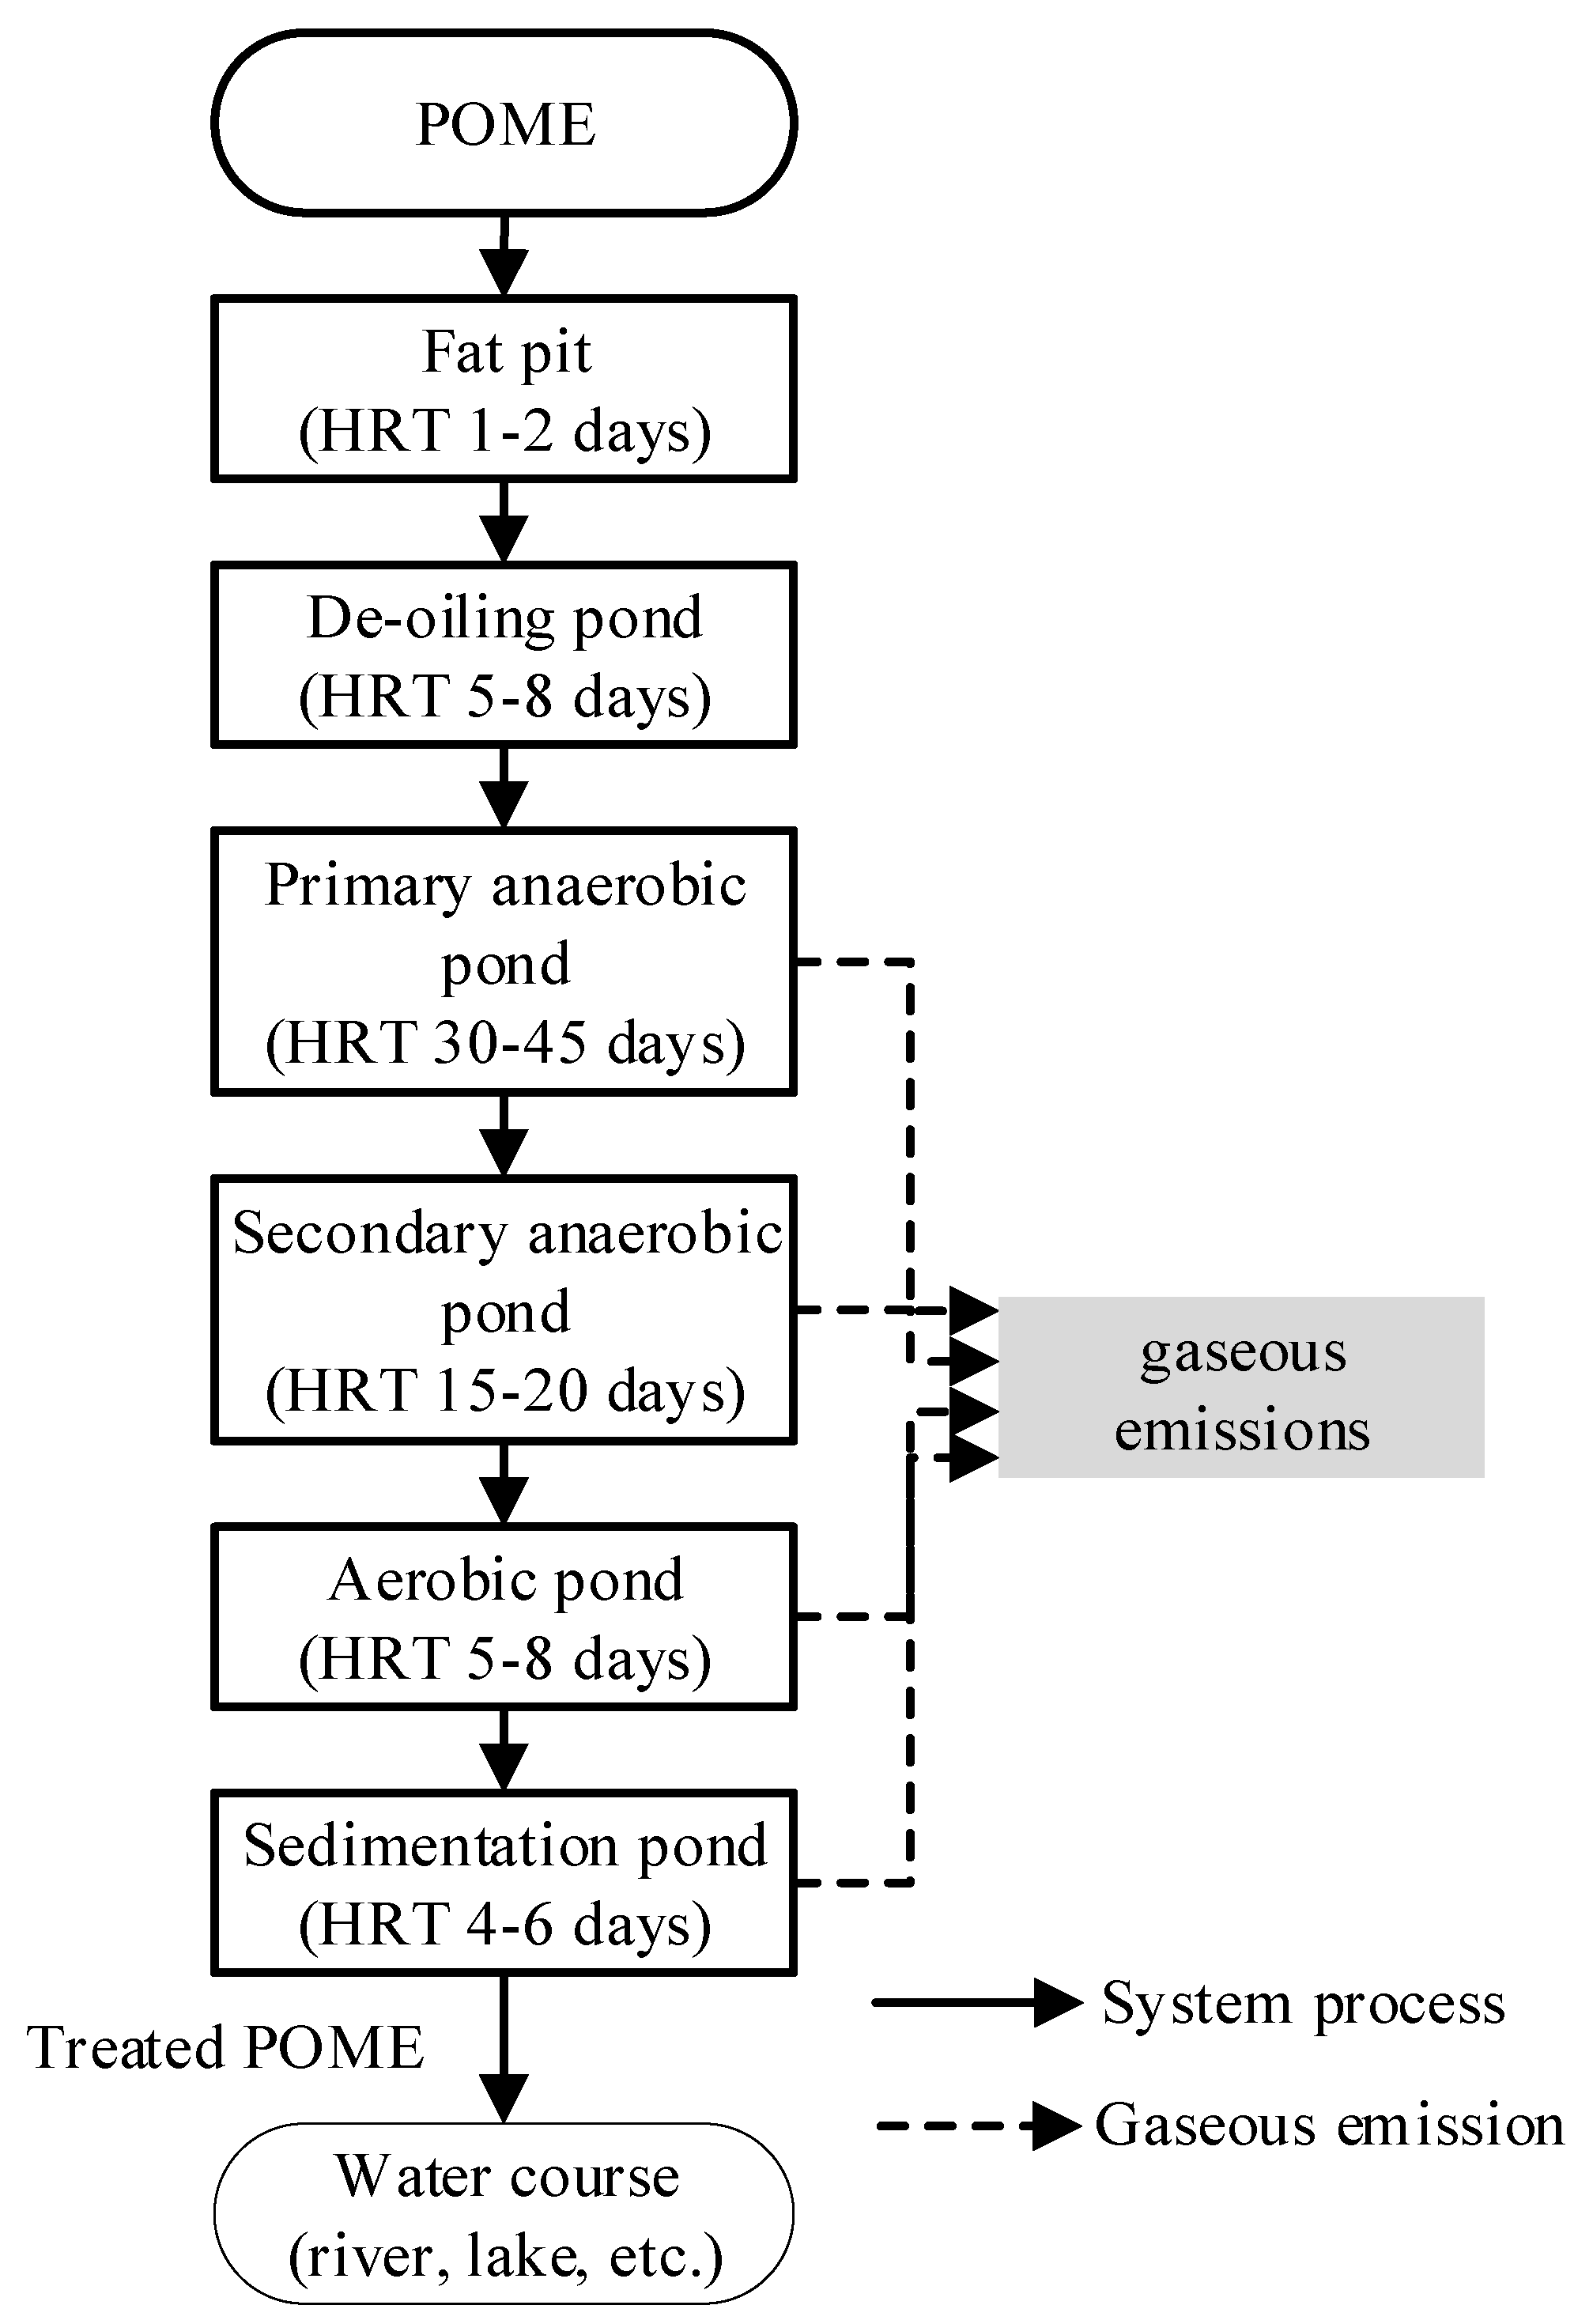
You are currently viewing a new version of our website. To view the old version click .
Sustainability
  • Article
  • Open Access

18 May 2020

Alternative POME Treatment Technology in the Implementation of Roundtable on Sustainable Palm Oil, Indonesian Sustainable Palm Oil (ISPO), and Malaysian Sustainable Palm Oil (MSPO) Standards Using LCA and AHP Methods

,
,
and
1
Indonesian Oil Palm Research Institute (IOPRI), Medan 20158, Indonesia
2
Faculty of Life and Environmental Sciences, University of Tsukuba, Tsukuba 305-8572, Japan
*
Author to whom correspondence should be addressed.

Abstract

Palm oil mill effluent (POME) is a major concern as open lagoon technology is not environment-friendly. Therefore, the palm oil industry refers to a roundtable on sustainable palm oil (RSPO), Indonesian sustainable palm oil (ISPO), and Malaysian sustainable palm oil (MSPO) standards for POME treatment to reduce greenhouse gas emissions. An alternative POME treatment technology is the combination of open lagoon technology (COLT) with composting, biogas technology plus composting, biogas technology plus membrane, and biogas technology plus land application. The objective of this study is to analyze the life cycle assessment (LCA) result using a multi-criteria decision approach and to determine the implementation of POME treatment in the RSPO, ISPO, and MSPO standards. The LCA system boundary was considered from gate-to-gate and unit per ton of fresh fruit bunch as a functional unit. SimaPro® was used as the LCA analysis tool; Expert Choice® and Super Decision Software® were used to perform the analytic hierarchy process and analytic network process, respectively. In this study, COLT–Biogas plus composting technology had the maximum priority weight (0.470), according to the opinion of experts. The results could help palm oil mill decision-makers in choosing environment-friendly POME treatment technology.

1. Introduction

Palm oil is one of the most important commodities in Indonesia, and palm oil production continues to increase, especially in the last decades. North Sumatra, a province in Indonesia, is one of the largest palm growers, and the second-largest palm oil producer. In 2014, North Sumatra had a crude palm oil (CPO) production of 4.75 million tons, which accounted for 16.2% of the total CPO production in Indonesia [1]. Palm oil is the extractable, liquid product of fresh fruit bunch (FFB) of the oil palm plant when it is milled. The extraction process uses hot water, which produces liquid waste after extraction. The liquid waste is called “palm oil mill effluent” (POME). The palm oil mill not only releases the liquid waste but also releases solid waste and gaseous emissions. The solid wastes are oil palm empty fruit bunch (EFB), oil palm shell (shell), and oil palm fiber (fiber). Gaseous emissions come from the biomass-boiler chimney and are used for electricity generation. POME treatment is dominated by open lagoon technology [2]. This technology has environmentally detrimental effects because it releases significant greenhouse gases (GHGs) and needs more than 60–90 days of hydraulic retention time (HRT) (Figure 1).
Figure 1. Existing palm oil mill effluent (POME) treatment process using open lagoon technology and total HRT for each step.
Studies have investigated actual GHG emissions from lagoons and open digesting tanks in oil palm mills and reported that the contribution of methane to biogas released from open digesting tanks and lagoon systems is 35% and 45%, respectively. POME treatment technology is being developed in a variety of ways to achieve a sustainable palm oil industry, whose target is to reduce GHG emissions. The treatment of POME must comply with the roundtable on sustainable palm oil (RSPO), Indonesian sustainable palm oil (ISPO), and Malaysian sustainable palm oil (MSPO) certification requirements for a sustainable palm oil industry from 2020, following RSPO and ISPO regulations, regarding the Indonesian government’s commitment in reducing GHG emissions by 29% by 2030 [3]. In this case, RSPO, ISPO, and MSPO standards have the same goal in the reduction of emissions. The differences and the points in common of RSPO, ISPO, and MSPO standards for mitigation of GHG emissions are shown in Table 1. In general, the differences between RSPO, ISPO, and MSPO standards are directives on business practices and plantation management, which require ethical commitment in business operations and transactions [4]. In terms of its environment, the RSPO has the clearest explanation related to the principles, criteria, indicators, guidelines, and requirements for the environment.
Table 1. Dissimilarities and similarities of the roundtable on sustainable palm oil (RSPO), Indonesian sustainable palm oil (ISPO), and Malaysian sustainable palm oil (MSPO) for the mitigation of greenhouse gas emissions.
Open lagoon technology for POME treatment must be avoided and replaced with other technologies that have comparatively less environmentally damaging effects to comply with certification standards. Life cycle assessment (LCA) is one of the standard methods for environmental assessment of products and for the design of technology to incorporate sustainability. The internationally recognized standards of LCA is ISO 14040-14044, which provide and describe the principles and framework of LCA [5]. The principles and structures of these ISO standards include the goals and scope of life cycle assessment, life cycle inventory analysis (LCI), life cycle impact assessment (LCIA), life cycle interpretation, reporting, critical review, limitations, and the relationship between the different LCA steps [6,7]. LCA has the advantage of being able to identify the priorities, avoid problem shifting, and comprehensiveness of addressing environmental impacts associated with the generation of palm oil [8]. However, LCA is a complex process, taking significant time, which depends on the normalization of reference data, and requires a complex interpretation of the results [9]. The results of LCA can highlight the environmental impacts caused, in the absence of the input of well-informed decision making by a planner, developer, and policymaker. One of the conclusions of the Commission of the European Communities in their final report was that LCA must be applied as the decision-supporting tool and not as stand-alone decision-making method [10] to minimize the LCA results. One multi-criteria decision analysis (MCDA) system is the analytic hierarchy process (AHP) that is appropriate for application to complex problems or an issue involving value or subjective judgments [11,12]. AHP assumes that criteria are independent of each other and provide a baseline for some criteria that have different units [13]. The strengths of AHP have the possibility of weighting the criteria with their dimensions and a single score for an overall evaluation. Another MCDA is the analytic network process (ANP), which is an extension of the AHP and a non-linear structure with a two-way connection [14,15].
In this study, LCA and MCDA were sequentially applied to find the best combination of POME processing technology to replace open lagoon technology. Furthermore, this research applies the LCA method in the first step, according to RSPO, ISPO, and MSPO standards. The next step is to employ the MCDA method for using AHP and ANP to find more comprehensive and precise conclusions. The MCDA method is applied after LCA because LCA does not rank environmental impacts in order of priority. The research workflow is presented in Figure 2.
Figure 2. Research workflow.

2. Materials and Methods

2.1. POME Treatment

POME treatment technology is still dominated by open lagoon technology, which is known as the simplest and cheapest method (Figure 1). However, this technology emits abundant GHGs, especially from anaerobic and aerobic ponds [16]. In this study, two alternatives to POME treatment combined with open lagoon technology were analyzed: one with composting, and the second with biogas technology. As composting and biogas technology require fat pits and de-oiling ponds as the final collection point of crude palm oil, a combination of open lagoon technology (COLT–Composting), and COLT–Biogas was evaluated. COLT-Composting is one of the proven technologies that produce compost as an organic fertilizer [17]. The composting process is co-composting between POME and EFB as the material involved. COLT–Biogas is a technology that can produce biogas by fermentation in an anaerobic digester. Finally, the biogas could be converted to electricity by using the gas engine after purification of CO
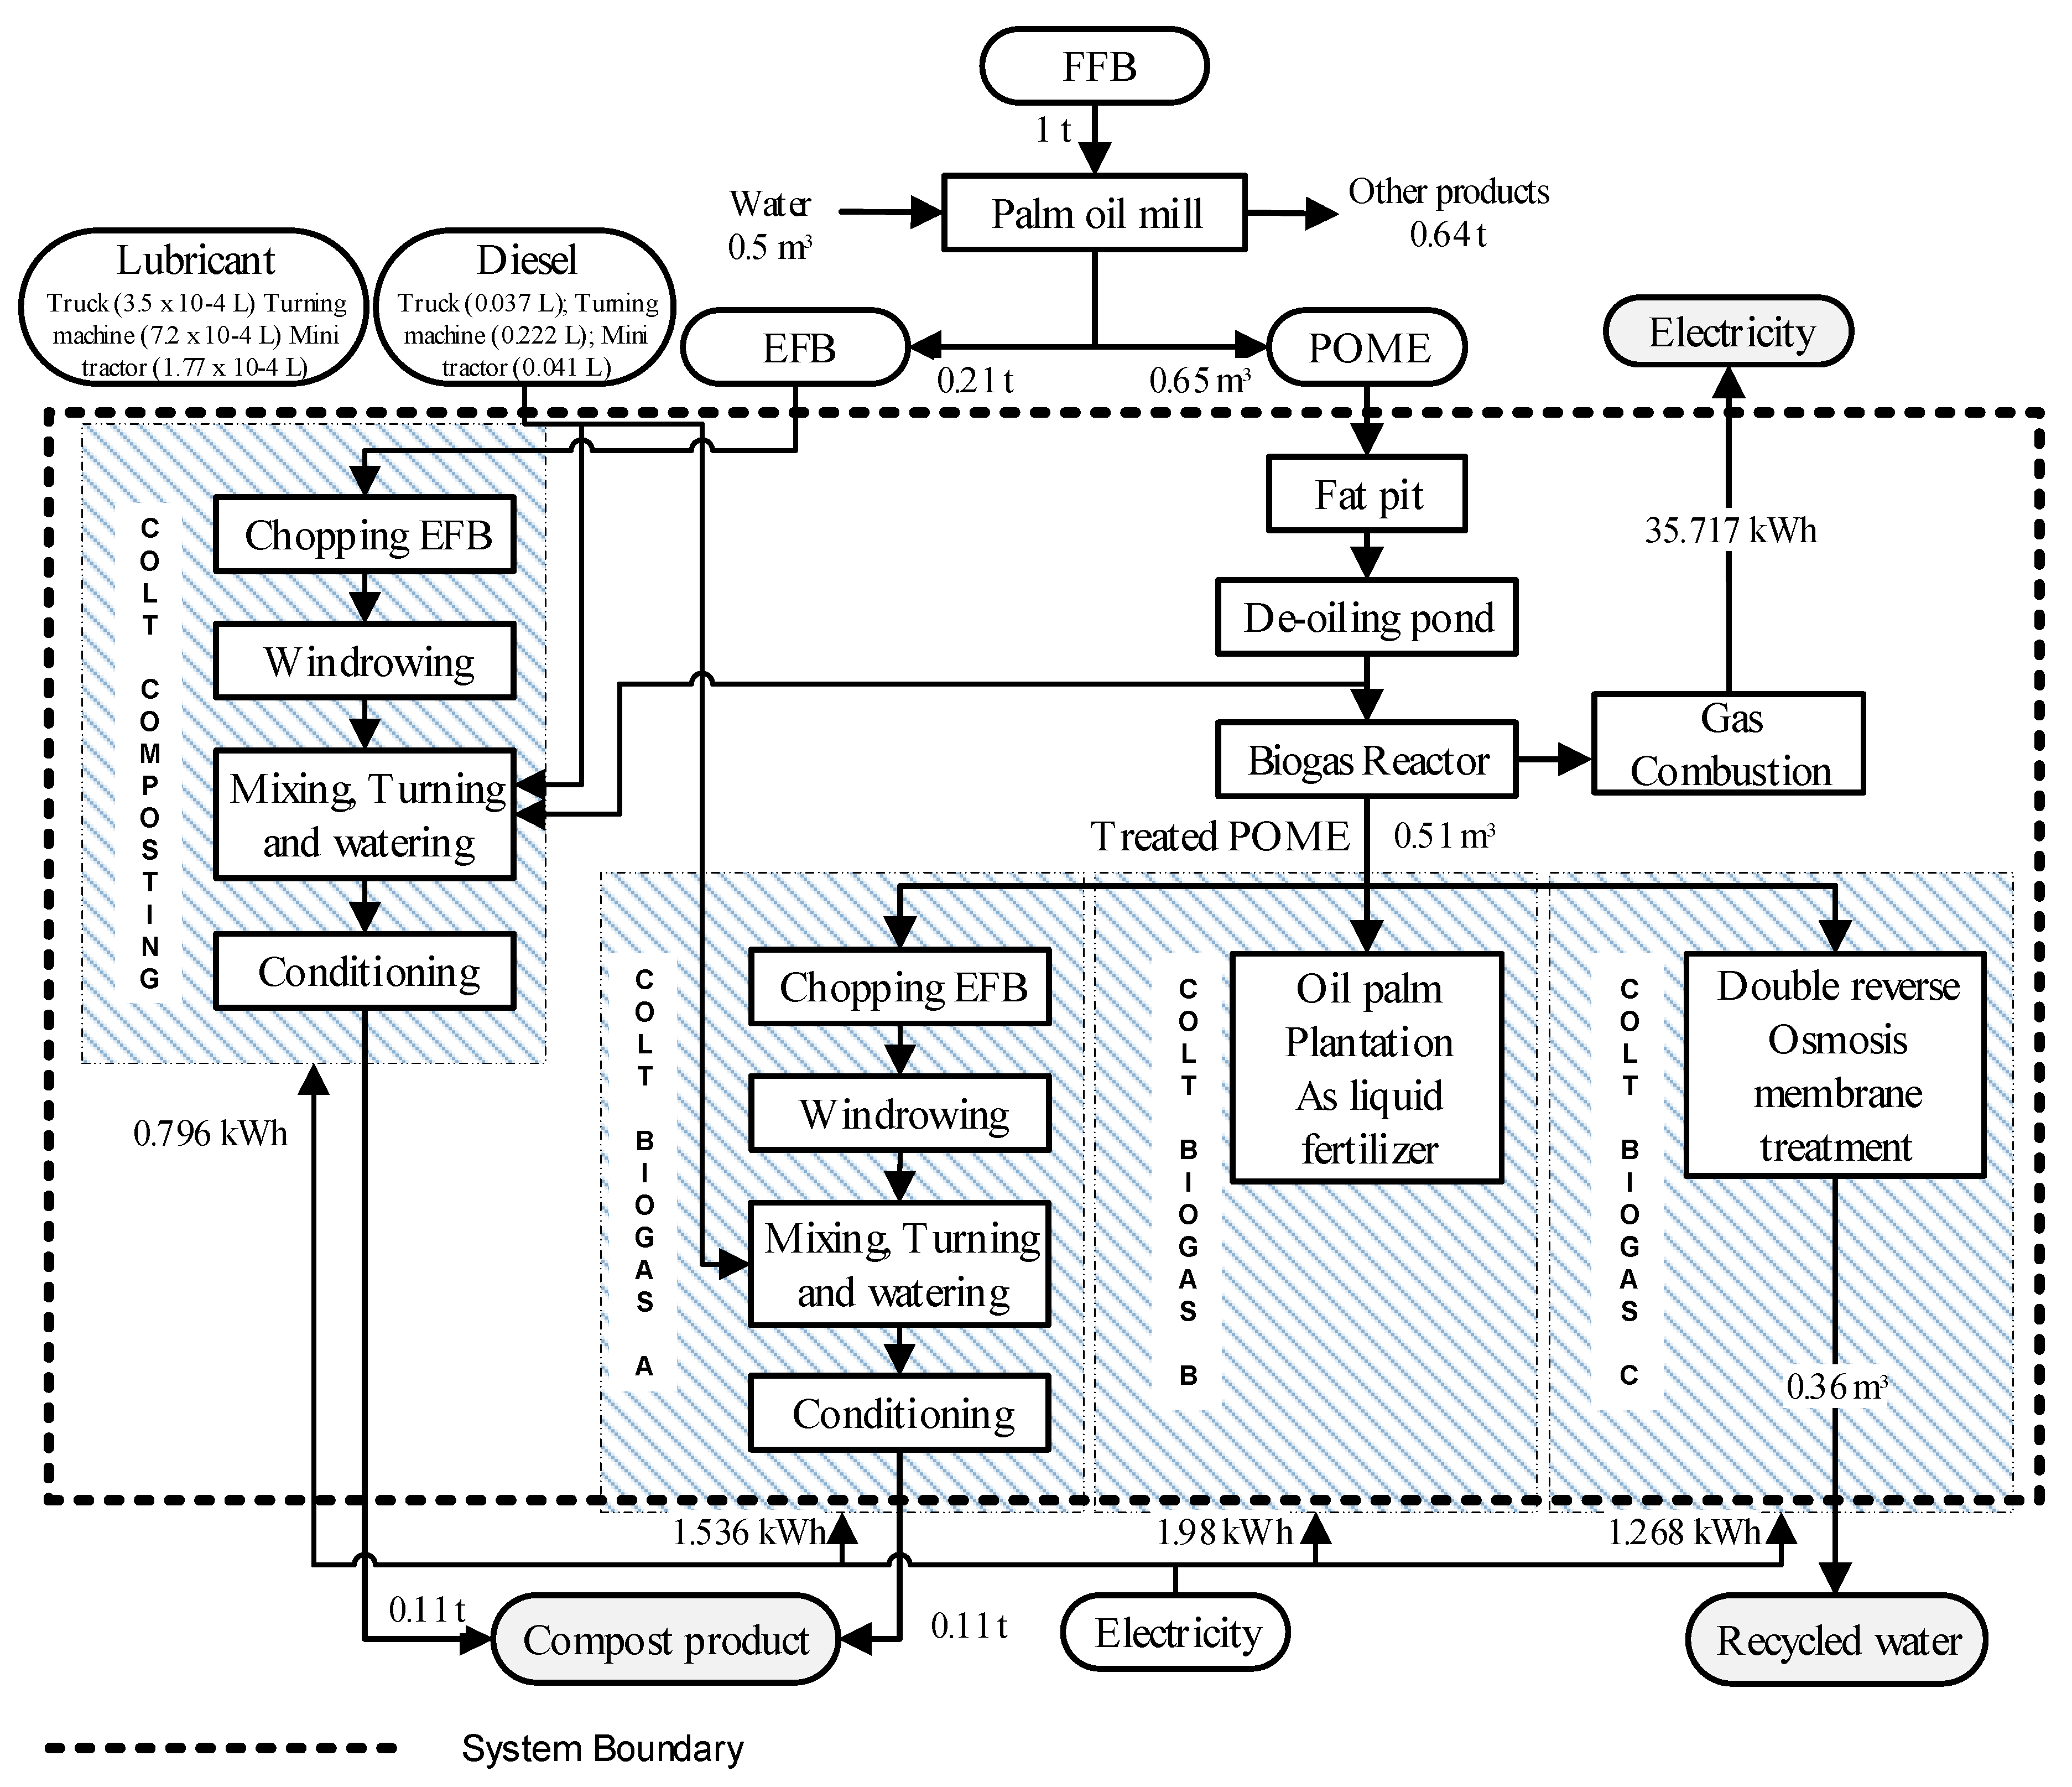
2, desulfurization, and dewatering. In this study, treated POME from COLT–Biogas had chemical oxygen demand (COD) content that exceeded the discharge limit of the waterway entering the river. The POME was treated using composting technology (COLT–Biogas A), land application technology (COLT–Biogas B), and membrane technology (COLT–Biogas C).
COLT–Biogas A is a combination of the COLT–Biogas technology with composting technology (Figure 3). The composting process in this alternative is similar to that of the COLT–Composting technology. However, the source of POME for watering the EFB during the fermentation process uses treated POME. Meanwhile, COLT–Composting uses POME from the de-oiling pond. COLT–Biogas B requires the POME to be applied to the land as a final treatment for treated POME from the biogas reactor. The land application has liquid fertilizer that flows to the plantation. COLT–Biogas C is a combination of biogas technology and membrane technology. A double reverse osmosis membrane was used for this combination of technologies. The information about whole POME alternative treatments is referred to in our previous study [18].
Figure 3. Flow process and system boundary of alternative treatment technology of palm oil mill effluent (POME); figure modified from Nasution et al. [18].
COLT–Biogas B is a combination of technologies that use biogas technology as the first treatment technology, followed by land application technology. As COD of treated POME of biogas still exceeds the standard environmental acceptance criteria when released to the surrounding area (such as rivers and lakes), land application technology is used as the final technology to treat the treated POME from the biogas reactor/digester, resulting in fertilizer in its liquid form being applied to the palm plantations.

2.2. Life Cycle Assessment

As the initial step in the analysis of POME treatment technology, the LCA results of our previous study were used as criteria in the second step of MCDA. In our previous study, LCA was performed to compare and analyze the alternatives to POME treatment technology [18]. The method was used to calculate the LCA result based on the LCA standard assessment by following the ISO 14040 series and SimaPro® version 8.1.1.16 (Pre Consultants, Holland) was used as the LCA analysis tool. The functional unit is replaced per ton of FFB. The gate-to-gate system boundary was used in this study (Figure 3). This study preferred to use the environment impact assessment midpoint rather than environment impact endpoint, as the midpoint result was more familiar to the study unit [19]. Yi (2014) reported that more than 65% of the 1000 respondents preferred the impact assessment midpoint for the LCA study. The midpoint environmental categories are global warming potential (GWP), eutrophication potential (EP), acidification potential (AP), and human toxicity potential (HTP). Inventory analysis and experimental data, including mass and energy balance, were undertaken and collected by field survey from a palm oil mill located in North Sumatra. Mass and energy balances were conducted to quantify the total elementary input and output flows, recycled water, and energy required according to the system boundaries. The GWP, EP, and AP were obtained as follows:
G W P = C E E l + C E L u b + C E D + C E M C + C E M O L + C E U E F B
where
C E E l (carbon dioxide emissions from electricity)
C E E l = E l e c t r i c i t y   c o n s u m p t i o n × e l e c t r i c i t y   e m i s s i o n   f a c t o r
C E L u b (carbon dioxide emissions from the lubricant),
C E L u b = L u b r i c a n t   c o n s u m p t i o n × L u b r i c a n t   e m i s s i o n   f a c t o r
C E D (carbon dioxide emissions from diesel fuel),
C E D = D i e s e l   c o n s u m p t i o n × d i e s e l   e m i s s i o n   f a c t o r
C E M C (Carbon dioxide emissions related to methane emissions from composting),
C E M C = T o t a l   m e t h a n e   f r o m   c o m p o s t i n g × G W P   f a c t o r
* T o t a l   m e t h a n e   c o m p o s t i n g = T o t a l   E F B × c o m p o s t i n g   e m i s s i o n   f a c t o r
C E M O L (carbon dioxide emissions related to methane emissions from the open lagoon),
C E M O L = T o t a l   m e t h a n e   e m i s s i o n s   f r o m   t h e   o p e n   l a g o o n × G W P   f a c t o r
* T o t a l   m e t h a n e   e m i s s i o n s   f r o m   t h e   o p e n   l a g o o n         = T o t a l   P O M E   m a s s × C O D   o f   P O M E         × g e n e r i c   c o n v e r s i o n   f o r   m e t h a n e
C E U E F B (Carbon dioxide emissions related to untreated EFB) = EFB dumping (230 kg CO2-eq per ton of FFB)
E P = P E P P O M E + P E N P O M E + P E P E F B + P E N E F B
where
P E P P O M E (PO4 emissions related to P compounds in POME),
P E P P O M E = A m o u n t   P   i n   P O M E × P O 4   t o   P   e q u i v a l e n c e   f a c t o r
P E N P O M E (PO4 emissions related to P compounds in POME),
P E P P O M E = A m o u n t   N   i n   P O M E × P O 4   t o   N   e q u i v a l e n c e   f a c t o r
P E P E F B (PO4 emissions related to P compounds in EFB),
P E P P O M E = A m o u n t   P   i n   E F B × P O 4   t o   P   e q u i v a l e n c e   f a c t o r
P E N E F B (PO4 emissions related to P compounds in EFB),
P E P P O M E = A m o u n t   N   i n   E F B × P O 4   t o   N   e q u i v a l e n c e   f a c t o r
A P = S E S B + S E S D
where
S E S B = (SO2 emissions related to H2S compounds in biogas),
S E S B = A m o u n t   H s S   i n   B i o g a s × S O 2   e q u i v a l e n c e   f a c t o r
S E S D i e s e l (SO2 emissions related to H2S compounds in diesel combustion),
S E S D = H s S   e m i s s i o n s   f r o m   d i e s e l   c o m b u s t i o n × S O 2   e q u i v a l e n c e   f a c t o r
Furthermore, HTP was calculated and collected from a previous study [18], which included a method developed by Stichnothe and Schuchardt [20]. The LCA results were difficult to interpret to find a specific outcome because there was little variation between the environmental impact value of each alternative technology. For example, the GWP COLT–Composting was 18.79 kg CO2-eq, which was not much different from 14.01 kg CO2-eq the GWP of COLT–Biogas A (Table 2). In addition, the category value fluctuated. Some alternatives had the highest in one category and had lower values in other categories. For example, COLT–Biogas A had the highest AP, but the lowest GWP.
Table 2. Establishment of alternatives for analytical hierarchy process (AHP) modeling.

2.3. Analytical Hierarchy Process

AHP is a decision-making methodology that assumes that criteria or sub-criteria are independent of each other. The differentiation between criteria is significant as it can be an indicator of the importance of alternative criteria. Priority is given according to the percentage attributed to the alternatives. In the application and analysis of AHPs, it is assumed that statistical significance is limited. AHP is a subjective comparison that, in some cases, does not require a specific number of participants’ involvement in developing the AHP model. Moreover, AHP has a good correlation with the expertise level of the participants. Furthermore, to clarify our AHP model as one of the objectives of our research, we selected experts in this field as participants.
Expert professionals have observation, knowledge, and experience regarding POME treatment in Indonesia and North Sumatra. The experts are affiliated with reputed oil palm industry companies, which have at least one plantation and palm oil mill in North Sumatra, Indonesia. Furthermore, the experts from these companies have collaborated with the Oil Palm Research Institute and the Indonesian Palm Oil Association on POME-based treatment technology. These individual experts have 15–35 years of POME treatment experience and come from established reputable institutions having 20–100 years of experience in oil palm research and production. Therefore, a series of weighted assessments by experts were selected for the AHP model.
The AHP steps for this study were as follows: Step (1) Determined the AHP model that influences the decision-making process. Based on the LCA results, the model of AHP for this study is shown in Figure 4. The criteria used were GWP, AP, EP, and HTP. Step (2) Determined the alternative establishment for AHP modeling, as shown in Table 2. This table was summarized based on the results of the environmental assessment and for decision-makers and respondents to prepare pairwise comparison [21]. In addition, we determined the preferences of the alternatives. This result was described in our previous research [18]. Open lagoon technology, as the existing technology for POME treatment, was used as a base reference for comparison with the alternative technologies (Table 2). The quantified questionnaire responses were collected by adopting joint comparison matrices using Saaty’s nine-point scale (Table 3) [22].
Figure 4. Analytical hierarchy process (AHP) model to determine the best combination of palm oil mill effluent (POME) treatments.
Table 3. Saaty’s pairwise comparison nine-point scale.
Step (3) The questionnaire for pairwise comparisons was prepared and distributed among eight experts who had experience and knowledge about POME and/or LCA. The experts joined the questionnaire, and the proposed sampling procedure was followed. The experts were affiliated with reputable palm oil companies, industry, university, and government (Table 4).
Table 4. Profile of the study respondents.
The collected responses were tested for consistency, and final decisions were made about the preferences of POME treatment technologies. Step (4): Collation and calculations of different expert assessments were performed. The construction of the joint comparison matrix is a part of the elaboration of the AHP analytic process [23,24]. In addition, the weighting of AHP is regarded as an example of decision making, and the proposal of a decision-making model considering the versatile LCA in the future is the objective of this study. We had different attributes on the same level, and the pairwise comparison matrix, A , can be constructed according to the following equations.
A = ( a i j ) n x n = ( a 11 a 12 a 1 n a 21 a n 1 a 22 a n 2 a 2 n a n n )
where a i j is the expression of the geometric mean that the respondent group compares the criteria i over other criteria j . The geometric mean was calculated using the geometric mean method (GMM) for the aggregation of different participant assessments, as recommended by Saaty [11]. There are N expert respondents, and a i j k is the judgment of the k-th respondent when comparing item i with item j , and GMM follows the formula:
a i j = ( k = 1 N a i j k ) 1 N
Matrix A is a positive and symmetric matrix, and its main diagonal is equal to 1. Normalize the elements of matrix A using the following formula:
a ¯ i j = a i j m = 1 n a m j
Subsequently, the normalization matrix A is obtained by the following equation:
A ¯ = ( a ¯ i j ) n x n = ( a ¯ 11 a ¯ 12 a ¯ 1 n a ¯ 21 a ¯ n 1 a ¯ 22 a ¯ n 2 a ¯ 2 n a ¯ n n )
The elements of the same line of normalization matrix A ¯ are calculated using Equation (8). Subsequently, to calculate the relative importance of the criteria in the matrix A , the priority of the criteria is determined using the eigenvector w = ( ω 1 , ω 2 , ω n ) obtained according to Equation (9), and the summary of this vector is equal to 1.
ω ¯ i = j = 1 n a ¯ i j
ω i = ω ¯ i m = 1 n ω ¯ m
where n is the number of rows or columns or the number of criteria being compared in the matrix. The maximum eigenvalue λ m a x of A can be obtained using Equation (10) [25]. Consistency was required to verify the credibility and reasonability of the evaluation. The consistency index ( C I ) was calculated according to the following formula:
λ m a x = 1 n i = 1 n ( A ω ) i ω i
C I = λ m a x n n 1
C R = C I R I
C R is expressed for consistency ratio, and R I represents the random index. The value of R I is the average consistency index (Table 5). If the value of C R is below 0.1, the weighting is accepted. Alternatively, if the value is higher than 0.1, it is unacceptable. If the value is equal to 0, it shows a perfect weight comparison [11]. Finally, to check the validity of the result, a sensitivity analysis was performed by changing the weight of the evaluation items. The analysis was performed using AHP tools, Expert Choice® version 11 (ExpertChoice, USA), and Microsoft Excel.
Table 5. Random consistency index.

2.4. Analytic Network Process

Analogous to AHP, ANP, as the extended theory of AHP, also requires the structure to present the problem and pairwise comparison to establish the relationships within the structure of AHP and ANP. ANP is a more complex, interdependent relationship and provides feedback for elements in the hierarchy [15,26]. In this study, to compare the AHP result, ANP was used to determine the interdependence among the criteria and alternatives, and Super Decisions Software® version 2.10 (Creative Decisions Foundation, USA) was used to perform the ANP calculation and analysis. The ANP method had four steps [27]. The first step was to generate a network model based on the comprehensive problem. The second step was to make a pairwise comparison, according to the experts’ opinions. The different expert opinions were calculated using the GMM to determine their combined value. The first and second steps of the ANP method were similar to the AHP method. The importance of the ANP method is the third step that constructs the supermatrix to show the properties of the elements. Finally, the ANP step was added for decisions using the supermatrix model. The supermatrix was expressed as a weighted evaluation of paired comparison matrices U and V. Matrix U is the evaluation of the criteria (C1, C2, C3, and C4) according to the alternatives (A1, A2, A3, and A4). In contrast, matrix V refers to the evaluation of the criteria according to the alternatives. Matrix U, V, and supermatrix S can be expressed by Equations (13)–(15), respectively:
U = ( U 11 U 12 U 13 U 14 U 21 U 31 U 41 U 22 U 32 U 42 U 23 U 33 U 43 U 24 U 34 U 44 )
V = ( V 11 V 12 V 13 V 14 V 21 V 31 V 41 V 22 V 32 V 42 V 23 V 33 V 43 V 24 V 34 V 44 )
S w e i g h t e d ( 0 U V 0 ) = A 1 A 4 C 1 C 4 A 1 A 4 C 1 C 4 ( 0 0 U 11 U 14 0 0 U 41 U 44 V 11 V 14 0 0 V 41 V 44 0 0 )
Finally, the supermatrix is raised to powers; the limit supermatrix was obtained by multiplying the matrix itself, and this can be expressed as follows:
S l i m i t e d = lim n α S w e i g h t e d n

3. Results and Discussion

3.1. Comparison of Performance by AHP Results

The combined data of pairwise comparisons were collected from surveys and questionnaires using GMM. The accumulated results of pairwise comparisons by the combined expert opinions are shown in Table 6. In this case, the overall inconsistency index was 0.04. After the calculations using Expert Choice® for all pairwise comparisons, the weights that measured the relative importance of each criterion are shown in Table 7. This table shows the overall weight of the hierarchical decision-making and modeling. Among the assessments for the best environment-friendly POME treatment, the most important criterion based on the expert opinion was GWP (48.1%), followed by AP (26.8%), EP (14%), and the least important was HTP (11.1%). According to this data, the experts had the opinion that GWP had a maximum influence on the environment in terms of environmental categories.
Table 6. Pairwise comparison of criteria vs. criteria with respect to the goal (results of combined experts).
Table 7. Criteria weighting for the most environmental-friendly palm oil mill effluent (POME) treatment.
The relative weight of the best technology for POME treatment based on the criteria is shown in Figure 5. COLT–Biogas A had the maximum preference with respect to GWP (0.563), EP (0.49), and HTP (0.448). According to the GWP criteria, COLT–Biogas A had a maximum decrease of GHG emissions. The AP criteria were important for COLT–Biogas C, which could be a factor in changing the preference of the result. The results would help in providing electricity supply in North Sumatra province because the electrification in this province is still underdeveloped. In North Sumatra, the ratio of electrification was 91.03, and power failure often occurs [28].
Figure 5. Synthesized and weighted criteria for each palm oil mill effluent (POME) treatment alternative.

3.2. Comparison of Performance by ANP Results

The results of the weighted supermatrix and limit supermatrix show the relationships between the criteria and the alternatives (Table 8 and Table 9). In ANP analysis, the most important criteria were GWP, followed by AP, EP, and HTP, respectively. This result was analogous to the AHP result related to the top-ranked criteria priorities. As a result, the best POME treatment was reported from ANP analysis; COLT–Biogas A (weighted, 0.470) was the top-ranked, followed by COLT–Composting (0.241), COLT–Biogas B (0.156), and COLT–Biogas C (0.132). When comparing the AHP and ANP results, there were negligible differences between the MCDA systems of this study (Table 10). As there were no significant differences between the AHP and ANP results, it is demonstrated that the criteria were independent.
Table 8. Criteria weighting for the weighted supermatrix designed to determine the relationship between the criteria and alternatives of palm oil mill effluent (POME) treatment technology using the analytical network process (ANP).
Table 9. Limited supermatrix for determining the relationship between the criteria and alternatives of palm oil mill effluent (POME) treatment technology using the analytical network process (ANP).
Table 10. Analytical hierarchy process (AHP) and analytical network process (ANP) priority criteria weightings for the palm oil mill effluent (POME) treatment technologies.

3.3. Sensitivity Analysis Based on the Analytical Hierarchy Process Method

As there was no substantial difference between AHP and ANP methods, a sensitivity analysis was used to determine how these changes influenced the priorities of the alternatives. These had been selected by changing the criteria priorities. The sensitivity analysis was conducted using the dynamic sensitivity of Expert Choice®. The effect of the criteria priority on the overall results is shown in Figure 6a. The COLT–Biogas A priority ranking had the maximum weight of GWP (48.1%), followed by AP (26.8%), EP (14%), and HTP (11.1%). The balance point between COLT–Biogas A and other alternatives (in this case, COLT–Biogas B) was 17.5% weight of GWP, 76.1% weight of AP, 3.5% weight of EP, and 2.9% weight of HTP (Figure 6b). It is indicated that the COLT–Biogas B technology becomes the preferred alternative for POME treatment if the AP criterion has increased sufficiently by more than 76.1%. Only the AP criterion could change the preferred alternative as the AP criterion had the highest relative weight.
Figure 6. Dynamic sensitivity for criteria: (a) dynamic sensitivity priority of the criteria is changed, and (b) dynamic sensitivity when the best alternative (COLT–Biogas A) has balanced weighted criteria with another alternative (COLT–Biogas B) (modified).

3.4. Implementation of Result Based on Roundtable On Sustainable Palm Oil, Indonesian Sustainable Palm Oil, and Malaysian Sustainable Palm Oil Standards

The implementation of results based on RSPO, ISPO, and MSPO standards for renewable energy and emission reductions regarding COLT–Biogas A are listed in Table 11. The assessment of alternatives to POME treatment technology revealed that COLT–Biogas is the most environment-friendly. This technology has weights of 0.470 (ANP) and 0.471 (AHP) with top priority. This result indicates that the COLT–Biogas A and GWP criteria have the maximum GHG reduction.
Table 11. Implementation of results based on the roundtable on sustainable palm oil (RSPO), Indonesian sustainable palm oil (ISPO), and Malaysian sustainable palm oil (MSPO).
Therefore, the implementation of the RSPO, ISPO, and MSPO in this study had the same criteria to generate renewable energy and reduce emissions. However, the difference between them in the certification system, where RSPO was voluntary, ISPO was mandatory, and MSPO is working towards mandatory status. Furthermore, RSPO was more detailed in explaining the steps to be taken towards reducing GHG emissions than ISPO and MSPO. This study refers to the stakeholders and contributors within the supply chain who can significantly reduce adverse environmental impacts, especially GHG emissions.

4. Conclusions

In this study, sequence LCA and MCDA-based assessments were employed to evaluate the environmental impacts of alternative POME treatment technologies. POME treatment using COLT must be replaced by a more sustainable alternative by the end of 2020, according to the RSPO, ISPO, and MSPO standards. Therefore, it is crucial to evaluate alternative technologies that can be feasibly adopted by palm mill owners within the allotted time. The alternatives examined in this report were COLT–Composting for fertilizer production and COLT–Biogas for energy generation, in which the biogas was combined with composting, land application, and membrane technology. The following conclusions were achieved based on the research:
  • Using the performance results of the alternatives studied in this study, COLT–Biogas with composting (COLT–Biogas A) was superior to others as a combination of technology for POME treatment. This alternative technology selection has the potential to support a sustainable palm oil industry.
  • The top rankings of the selection criteria were GWP, followed by AP, EP, and HTP. It was observed that GWP is the criterion that possesses the maximum potential to ameliorate future environmental problems associated with palm oil production.
  • There was no difference between the results of the AHP and ANP methods. Regarding LCA results, we observed that there were no related criteria that influence environmental impact assessment (GWP, AP, EP, HTP).
  • The implementation of COLT–Biogas A under the RSPO, ISPO, and MSPO standards, would be suitable as a supply of renewable energy and result in GHG emission reduction.
  • We propose integrating open lagoon technology and biogas technology to generate electricity and utilize composting as the final treatment for treated POME from biogas reactors. The electricity produced through the combination of these technologies could be vital in improving the electrification in the North Sumatra province of Indonesia.

Author Contributions

Conceptualization, M.A.N., R.N.; methodology, M.A.N.; software, M.A.N., A.W.; validation, T.A.; formal analysis, M.A.N.; investigation, M.A.N.; data curation, T.A., R.N.; writing—original draft preparation, M.A.N.; writing—review and editing, M.A.N., A.W., T.A., R.N.; supervision, R.N. All authors have read and agreed to the published version of the manuscript.

Funding

This research received no external funding

Acknowledgments

The authors would like to thank the Indonesia oil palm research institute (IOPRI) for their support of this research. We also like to express our gratitude and thank the all participants who were involved in this research questionnaire.

Conflicts of Interest

The authors declare no conflict of interest.

References

  1. Directorate General of Estate Crops of Indonesia, Ministry of Agriculture. Tree Crop Estate Statistics of Indonesia; Directorate general of Estate Crops: Jakarta, Indonesia, 2016; p. 81. [Google Scholar]
  2. Lim, C.I.; Biswas, W.K. Sustainability Implications of the Incorporation of a Biogas Trapping System into a Conventional Crude Palm Oil Supply Chain. Sustainability 2019, 11, 792. [Google Scholar] [CrossRef]
  3. Suharto, R.; Husein, K.; Sartono, D.K.; Darussamin, A.; Nedyasari, D.; Riksanto, D.; Hariyadi Rahman, A.; Uno, T.; Gillespie, P.; Arianto, C.; et al. Joint Study of the Similarities and Differences of the ISPO and RSPO Certification Systems; ISPO Commission; RSPO; UNDP: Jakarta, Indonesia, 2015. [Google Scholar]
  4. Environment, E.C. Comparison of the ISPO, MSPO, and RSPO Standards Aim. Available online: http://www.efeca.com/wp-content/uploads/2016/03/Efeca_PO-Standards-Comparison-.pdf (accessed on 14 February 2018).
  5. Chuen, O.C.; Yusoff, S. Benefits of clean development mechanism application on the life cycle assessment perspective: A case study in the palm oil industry. J. Air Waste Manag. Assoc. 2012, 62, 299–306. [Google Scholar] [CrossRef] [PubMed][Green Version]
  6. ISO. ISO 14040: Environmental Management—Life Cycle Assessment—Principles and Framework; International Organization for Standardization: Geneva, Switzerland, 2006. [Google Scholar]
  7. ISO. ISO 14044: Environmental Management—Life Cycle Assessment—Requirements and Guidelines; International Organization for Standardization: Geneva, Switzerland, 2006. [Google Scholar]
  8. Rothwell, A.; Ridoutt, B.; Bellotti, W. Greenhouse Gas Implications of Peri-Urban Land Use Change in a Developed City under Four Future Climate Scenarios. Land 2016, 5, 46. [Google Scholar] [CrossRef]
  9. Khang, D.S.; Tan, R.R.; Uy, O.M.; Promentilla, M.A.B.; Tuan, P.D.; Abe, N.; Razon, L.F. Design of experiments for global sensitivity analysis in life cycle assessment: The case of biodiesel in Vietnam. Resour. Conserv. Recycl. 2017, 119, 12–23. [Google Scholar] [CrossRef]
  10. Policy, I.F.E.E. Final Report, Supporting the Thematic Strategy on Waste Prevention and Recycling. Available online: http://bookshop.europa.eu/en/supporting-the-thematic-strategy-on-wasteprevention-and-recycling-pbKH3013468/ (accessed on 18 November 2016).
  11. Saaty, T.L. The Analytic Hierarchy Process: Planning, Priority Setting, Resource Allocation; McGraw-Hill: New York, NY, USA, 1980. [Google Scholar]
  12. Hossaini, N.; Reza, B.; Akhtar, S.; Sadiq, R.; Hewage, K. AHP based life cycle sustainability assessment (LCSA) framework: A case study of six storey wood frame and concrete frame buildings in Vancouver. J. Environ. Plan. Manag. 2015, 58, 1217–1241. [Google Scholar] [CrossRef]
  13. Herzberg, R.; Pham, T.G.; Kappas, M.; Wyss, D.; Tran, C.T.M. Multi-Criteria Decision Analysis for the Land Evaluation of Potential Agricultural Land Use Types in a Hilly Area of Central Vietnam. Land 2019, 8, 90. [Google Scholar] [CrossRef]
  14. Purnamasari, R.A.; Ahamed, T.; Noguchi, R. Land suitability assessment for cassava production in Indonesia using GIS, remote sensing and multi-criteria analysis. Asia-Pac. J. Reg. Sci. 2019, 3, 1–32. [Google Scholar] [CrossRef]
  15. Peng, S.-H. Landscape Assessment for Stream Regulation Works in a Watershed Using the Analytic Network Process (ANP). Sustainability 2019, 11, 1540. [Google Scholar] [CrossRef]
  16. Hosseini, S.E.; Abdul Wahid, M. Pollutant in palm oil production process. J. Air Waste Manag. Assoc. 2015, 65, 773–781. [Google Scholar] [CrossRef] [PubMed]
  17. Garcia-Nunez, J.A.; Rodriguez, D.T.; Fontanilla, C.A.; Ramirez, N.; Lora, E.E.; Frear, C.S.; Stockle, C.; Amonette, J.; Garcia-Perez, M. Evaluation of alternatives for the evolution of palm oil mills into biorefineries. Biomass Bioenergy 2016, 95, 310–329. [Google Scholar] [CrossRef]
  18. Nasution, M.A.; Wibawa, D.S.; Ahamed, T.; Noguchi, R. Comparative environmental impact evaluation of palm oil mill effluent treatment using a life cycle assessment approach: A case study based on composting and a combination for biogas technologies in North Sumatera of Indonesia. J. Clean Prod. 2018, 184, 1028–1040. [Google Scholar] [CrossRef]
  19. Yi, S.; Kurisu, K.; Hanaki, K. Application of LCA by Using Midpoint and Endpoint Interpretations for Urban Solid Waste Management. J. Environ. Prot. (Irvine Calif.) 2014, 5, 13. [Google Scholar] [CrossRef]
  20. Stichnothe, H.; Schuchardt, F. Life cycle assessment of two palm oil production systems. Biomass Bioenergy 2011, 35, 3976–3984. [Google Scholar] [CrossRef]
  21. Erdogan, S.A.; Šaparauskas, J.; Turskis, Z. A Multi-Criteria Decision-Making Model to Choose the Best Option for Sustainable Construction Management. Sustainability 2019, 11, 2239. [Google Scholar] [CrossRef]
  22. Ali, Z.; Shahram, J.; Ashkan, R.-K. A hierarchical decision making model for the prioritization of distributed generation technologies: A case study for Iran. Energy Policy 2009, 37, 5752–5763. [Google Scholar]
  23. Xu, G.; Yang, Y.-P.; Lu, S.-Y.; Li, L.; Song, X. Comprehensive evaluation of coal-fired power plants based on grey relational analysis and analytic hierarchy process. Energy Policy 2011, 39, 2343–2351. [Google Scholar] [CrossRef]
  24. Wang, J.-J.; Jing, Y.-Y.; Zhang, C.-F.; Shi, G.-H.; Zhang, X.-T. A fuzzy multi-criteria decision-making model for trigeneration system. Energy Policy 2008, 36, 3823–3832. [Google Scholar] [CrossRef]
  25. Chung, Y.; Hong, S.; Kim, J. Which of the technologies for producing hydrogen is the most prospective in Korea?: Evaluating the competitive priority of those in near-, mid-, and long-term. Energy Policy 2014, 65, 115–125. [Google Scholar] [CrossRef]
  26. Saaty, T.L.; Vargas, L.G. The Analytic Network Process. In Decision Making with the Analytic Network Process: Economic, Political, Social and Technological Applications with Benefits, Opportunities, Costs and Risks; Springer: Boston, MA, USA, 2013; pp. 1–40. [Google Scholar]
  27. Cayir Ervural, B.; Zaim, S.; Demirel, O.F.; Aydin, Z.; Delen, D. An ANP and fuzzy TOPSIS-based SWOT analysis for Turkey’s energy planning. Renew. Sustain. Energy Rev. 2018, 82, 1538–1550. [Google Scholar] [CrossRef]
  28. Kementerian Energi dan Sumber Daya Mineral. Strategic Plan Ministry Energy and Mineral Resources of Indonesia 2015–2019; Indonesian Ministry of Energy and Mineral Resources: Jakarta, Indonesia, 2015; (In Bahasa Indonesia).

Article Metrics

Citations

Article Access Statistics

Multiple requests from the same IP address are counted as one view.