The concepts of value and value creation have been discussed extensively in literature on strategic management, organizational, and partnership theory [
1]. Contributions in the value field count Bowman and Ambrosini (2000), Makadok (2001), and Makadok and Coff (2002), who discuss value creation as value capture derived from value in use and value in exchange from a classic economic perspective on an organizational level [
1]. The value of a company provides a more accurate estimate of takeover cost than market capitalization because it includes a number of other important factors, such as preferred stock, and debt (including bank loans and corporate bonds), and it backs out cash reserves. A company’s market capitalization consists only of the number of stock shares it has outstanding multiplied by its current share price [
2]. In simple words, the value of a company is a theoretical price at which it can be bought. It is significantly different from market capitalization and considers many other factors to arrive at the correct valuation of the business [
3].
1.1. Literature Review
Lepak et al. (2007) extend the concept beyond the classical economic perspective, applying the individual and society level as sources and targets of value creation and value capture in a more holistic perspective, which supports the idea of sustainable value creation [
1].
Sustainable value measures corporate sustainable performance in monetary terms. Figge and Hahn published their first Sustainable Value Added (SVA) model based on comparing earned value of a company with a benchmark entity, assuming the same impact of both the company and the benchmark entity on the environment [
4]. This approach simplifies the measurements and enables sustainable performance to be measured in monetary terms depending on data availability on the enterprise level as well as on the benchmark ([
5,
6]). It shows how much value or damage is created as a result of using economic, environmental, and social resources, compared to a benchmark ([
6,
7,
8,
9]). According to the method published by Figge and Hahn (2004), the SVA calculation can be expressed as follows [
6]: “The gross value added of the company should be calculated (in unit €). After that, the amount of each environment or social resources should be determined (e.g., t, m
3, etc.). Then efficiency computed by dividing the gross value added on the amount of resources (unit €/t, €/m
3). The same steps should be done for the benchmark. Finally, the last two values are subtracted from each other and the result multiplied by the amount of considered indicator.” The calculation of Sustainable Value Added for a company in two different periods t
1 and t
0 is presented in Equation (1) [
6]:
where n and m = the number of relevant environmental and social indicators, respectively; EIA
i,t0, EIA
i,t1, SIA
j,t0, SIA
j,t1 = the eco-effectiveness for environmental and social impacts in t
0 and t
1; EE
i,b and SE
j,b = the eco- or social efficiency of the benchmark for i environmental and j social resources, respectively. These values are calculated using Equation (2):
where b = benchmark; EG = (Va
t1 – Va
t0) = economic growth; VA = the gross value added.
Porter and Kramer [
10] came up with a concept of value as something beneficial for both the company and for society. They point out that the internal economic costs approach needs to be extended to include social costs and benefits that contribute to long-term sustainability [
4].
Other studies in this area were developed by Kuosmanen, T., Kuosmanen, N. [
5]; Kassem, Trenz, Hřbíček and Faldík [
6]; Kocmanová, Pavláková Dočekalová, Škapa, Smolíková [
11]; Ang, Van Passel [
12]; Kocmanová, Simanavičiené, Pavláková Dočekalová [
13]. They brought a review on the method developed by Figge and Hahn (2004), presented in [
5,
6,
11,
12]. T. Kuosmanen and N. Kuosmanen [
5] critically examined Figge and Hahn’s estimator for opportunity cost and showed that the proposed estimator rests on a number of strong, unrealistic assumptions. They did not criticize the theoretical concept of Sustainable Value; they appreciated the idea of valuing resources based on their opportunity cost. However, they argued the distinction between the theoretical object of interest (the estimand) and the computational rule (the estimator). The study “Not measuring sustainable value at all: A response to Kuosmanen and Kuosmanen” of Figge and Hahn (2009) [
14] undertaken in reaction to the study of T. Kuosmanen and N. Kuosmanen [
3] showed that the argument in [
5] rests on a fundamental misspecification of the Sustainable Value approach. According to [
14], they identified three conceptual misfits in [
5]: A mismatch in the perspective of the analysis, a misspecification of opportunity costs and the irrelevance of production functions.
Kassem, Trenz, Hřbíček and Faldík [
6] are of opinion that the main calculation remains the same; whereas the improvements of the SVA calculation include several modifications, in order to achieve the following factors [
6]:
Comprehensive sustainability assessment—environmental, social, economic, and corporate governance indicators should be integrated;
Simplicity and suitability—the assessment should be done for different companies; however, the model cannot be universal, because the indicators should reflect the specifics of the industry in which the company operates;
Applicability—the modified model should be easy, suitable, and accurate; it reflects not only three dimensions (economic, environment, social), but also the corporate governance pillar is added; the gross value added is replaced by Economic Value Added (EVA) to describe the financial situation of the companies more efficiently.
After applying all the modifications to Equation (1), the Sustainable Value Added is presented in Equation (3) [
6]. The authors supposed that “different indicators don’t effect equally on enterprises score. It means, each indicator should have a different weight on sustainability calculation. This weight differs according to the country, size and sector of the company” (see also [
15]).
where EI, SI, GI = value of environment, social, and governance indicators, respectively; symbol b = refers to benchmark; symbol c = refers to the studied company; w
EI, w
SI, w
GI = the weight of environment, social, and governance indicators.
This opinion to include the Economic Value Added (EVA) into the model of the Sustainable Environmental, Social and Corporate Governance Value Added (SESG
VA) have Kocmanová, Pavláková Dočekalová, Škapa, Smolíková [
11]. They found that [
11] “The link between the Sustainable Value and EVA provides a huge potential for synergy. In addition to opportunity costs, the Sustainable Value also takes into account the environmental, social, and economic dimensions of corporate sustainability and is a much more comprehensive tool for corporate performance measurement.” The model is based on the strengths of the original SVA developed by Figge and Hahn, but overcomes its weaknesses [
11]: “The SESG
VA model concept is based on the assumption that not all environmental, social, and corporate governance indicators (ESG indicators) have the same impact on sustainability and this is why weights are allocated to individual indicators. The SESG
VA model is intended for owners, investors, and other stakeholders to support their decision-making and sustainability assessment. The inclusion of ESG factors means that strengths and weaknesses of companies can be more readily identified and permits a broader view of the company than the one-dimensional methods based only on their economic performance”.
1.2. Findings
Comparing the results of research (
Section 1) and own experiences [
16,
17,
18,
19,
20,
21] we came to the following findings:
In Jankalová, Jankal [
16], according to R. B. Pojasek, it is stated that sustainability is only one of several terms now being used to denote the same concept; other terms include corporate social responsibility (CSR), social responsibility, corporate citizenship, corporate responsibility, environmental sustainability, sustainable development, and each of these terms in turn can be defined in scores of different ways. Opinions on the identification of individual items of sustainability are differing due to various views of this issue, which is demonstrated by statements by many authors (see also [
22]). Usually, corporate sustainability incorporates the triple bottom line approach (three dimensions like economic, environmental, and social). On the other hand, the research by [
6] and [
11] also emphasized corporate governance indicators. These approaches calculate a company’s value by using not only financial but also non-financial resources.
Finally, sustainability assessment should be based on financial and non-financial indicators.
In Jankalová, Jankal [
16], it is stated that although there are various international efforts on sustainability assessment (sustainability indices, sustainable development indicators, Business Excellence models) that can evaluate the sustainable development of companies, only few of them have an integral approach taking into account environmental, economic, and social aspects. In most cases, the focus is on one of the three aspects, although, it could be argued that they could serve supplementary to each other.
Figge and Hahn [
23] are of opinion that companies contribute to sustainability only if the value created exceeds the external damage caused; on the other hand, there are proponents of eco-efficiency. They stipulated that companies should create as much value per environmental impact as possible. However, many of these approaches are either difficult to apply or, if they can be applied, their significance is limited. Therefore, Sustainable Value Added as developed in [
23] provides a new approach to measure corporate contributions to sustainability.
As has become clear from the shortcomings discussed above, a sustainable measure must consider the efficiency and the effectiveness of all three dimensions of sustainability simultaneously [
23]. However, our paper focuses only on the one dimension of the Sustainable Value Added concept—economic dimension. We assume that the Sustainable Value Added can also be calculated by transforming the economic indicator (economic growth; the gross value) through the Economic Value Added (EVA). The reason? Economic Value Added, as one of the most important and useful financial indicators, is used to determine a company’s value. From the perspective of financial management combines all the basic components required to describe the economic situation of the company [
6]. EVA is recognized as an important tool of performance measurement and management all over the world, particularly in advanced economies, by adopting it as corporate strategy [
24].
Finally, to describe the financial situation of the companies and to calculate the actual economic profit of a company, the Economic Value Added methodology appears as a suitable solution. It measures all of the costs of running a business—operating and financing—which separates EVA from other performance metrics such as EPS, EBITDA, and ROIC [
24]. EVA also differs from the other measures, and therefore can be used for past and future [
25], Cash Value Added, Cash flow return on investment and Economic Profit because it allows a more detailed and thorough adjustment and conversion from the Accounting data [
26].
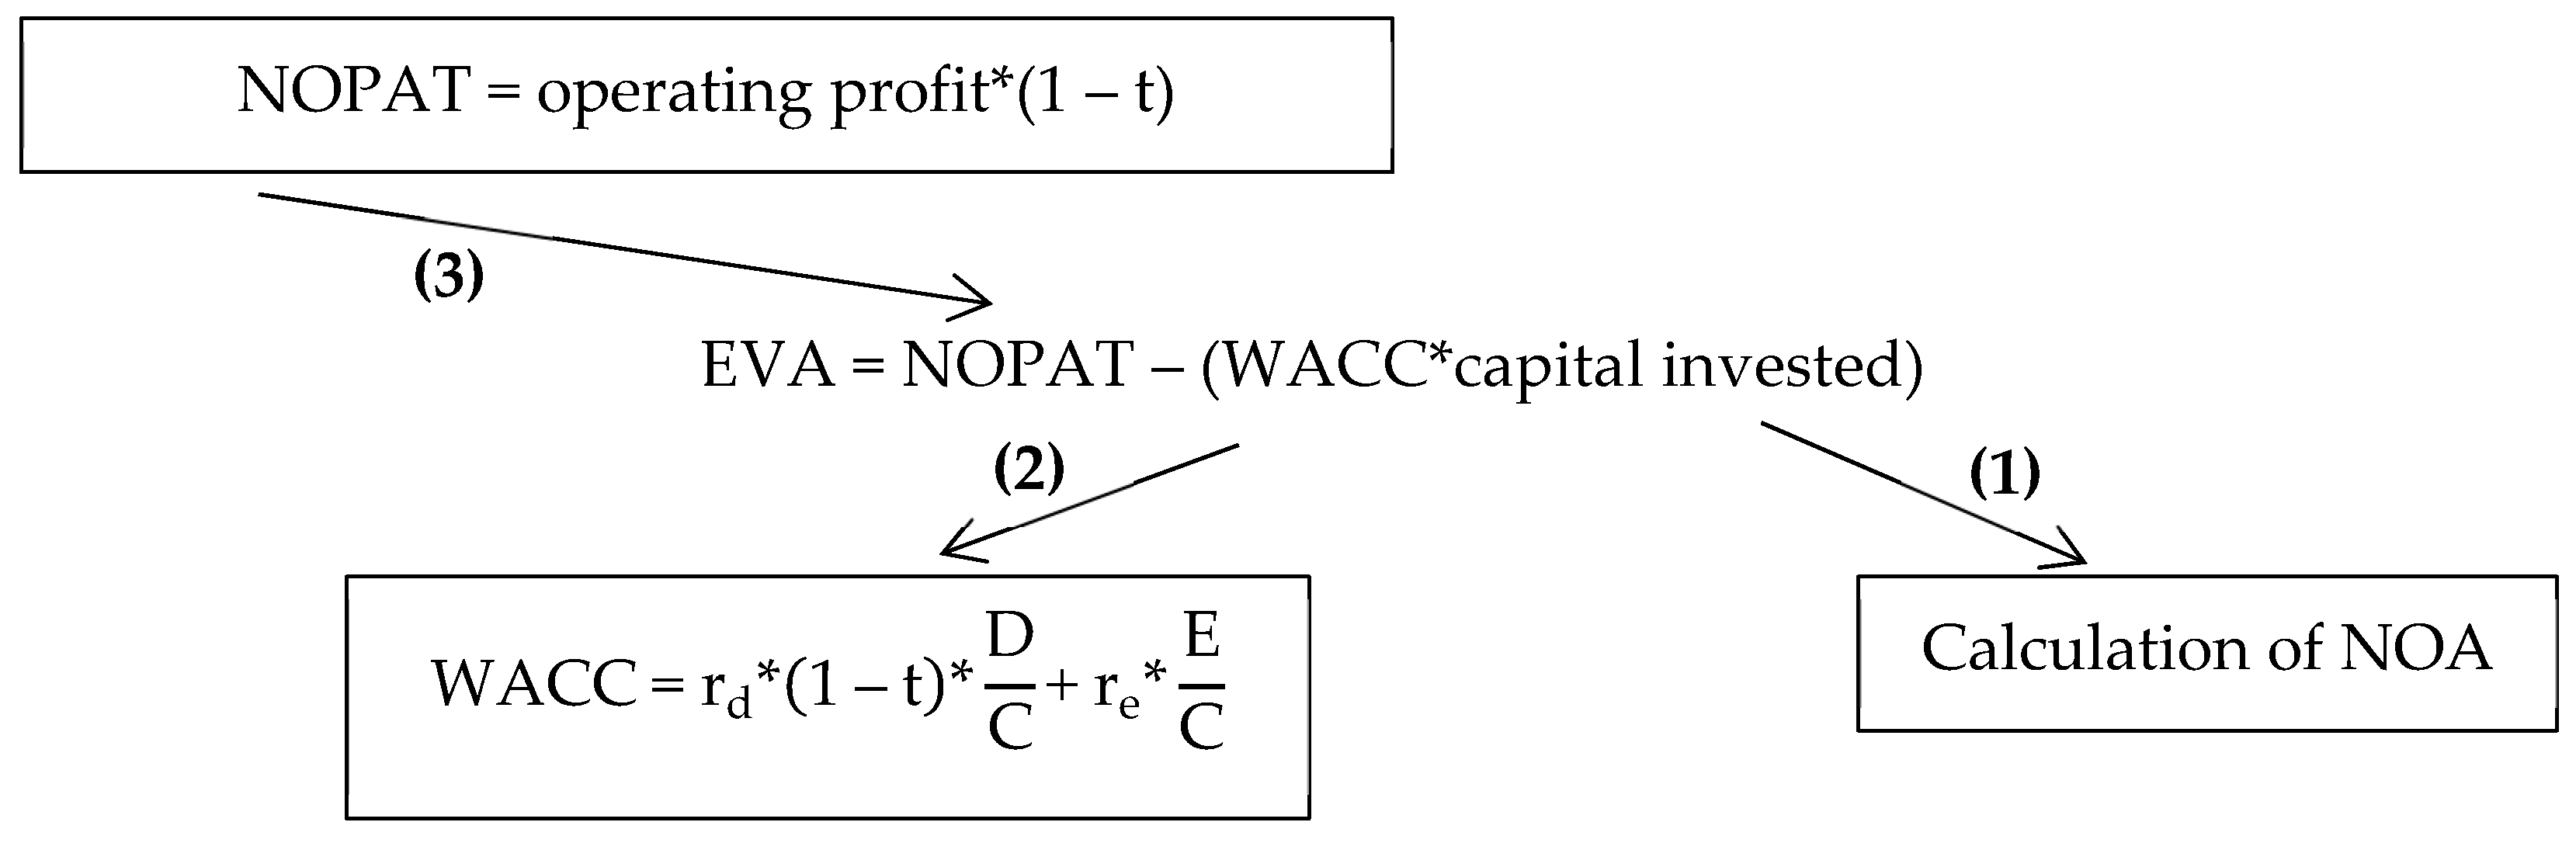
The aim of the paper is to apply the Economic Value Added methodology to real-life corporate data and present a company’s value through a case study. The Economic Value Added methodology for measuring a company’s value is based on the assumption that a company’s value consists of two basic parts: One is reflecting the amount of capital invested by shareholders and creditors, and one is the present value of future economic value added.
The paper is organized as follows:
Section 2 describes the methodology approach;
Section 3 presents the concept of the Economic Value Added and explains calculation of the Economic Value Added;
Section 4 discusses the link between the results and the company’s Sustainable Value; in
Section 5 are the main findings and implications summarized.


