Input materials are stored in silo facilities when delivered before they are transferred to digestion units. If biogenic waste of animal origin is used as input material, it must run through a hygienization process and be heated up for sanitation purposes according to EU regulations [
27] before it is digested. Biogas is produced in the digesters that is then stored in a biogas storage or transferred to the CHP units. Double membrane biogas storages were considered in this work, which are installed at the top of the digesters (internal gas storage). One CHP unit was considered in the basic plant concepts, while a second CHP unit was added in two flexibilization concepts described in
Section 2.1. The fermentation residue (digestate) is stored in residue storage tanks before it is transferred to agricultural fields and spread as fertilizer. Biogas is converted to electricity and heat by CHP units. A share of the produced heat is used to cover the heat demand from the plant’s biogas production units. The remaining heat is either used to cover an external heat demand or is considered as losses. In case of discontinuous heat generation due to flexible electricity generation, a heat storage was considered to ensure continuous heat output. Part of the generated electricity is used to cover the plant’s electricity demand and the rest is fed into the electricity grid.
Three different input material mixes were considered for each of the four investigated biogas plant sizes, resulting in a total of 12 plant configurations. The three mixes consist of varied compositions of energy crops, farm manure and biogenic waste, defined as MAIZE, MIX, and WASTE. The input material compositions for each of the plant configurations are shown in
Figure 2. Different types of biogenic waste are categorized by common Austrian numeric codes [
28]; a description of these categories is in the caption for
Figure 2. The composition of each mix was chosen to represent input material mixes that are typically used at Austrian biogas plants, whereas the configurations for 500 kW biogas plant MAIZE and MIX refer to Stuermer [
29]. The configuration MAIZE has a high share of maize silage, whereas the configuration WASTE has no maize silage but a share of biogenic waste. No biogenic waste of animal origin was considered in the WASTE mixes for the smaller biogas plants with 150 kW and 250 kW, as this would result in inefficiently high investment needs for substrate pretreatment (hygienization). The input material mixes for the 150 kW plant were chosen to correspond to the regulations stipulated in Austria’s 2017 Amendment to the Green Electricity Act (share of grain and corn (combined) less or equal 30%).
Table 1 shows input material characteristics. The dimensioning of the plants’ tanks and technological equipment differed due to the different plant sizes and input material mixes. The assumptions regarding tank volumes, energy demand, and output of the plants and efficiencies of the CHP units are summarized in
Table 2 and are based upon a plant operator inquiry [
30,
31]. Austrian biogas plants are characterized by a high hydraulic retention time (HRT). In this study a HRT of 100 days in the fermenters was assumed, which is in line with Stuermer et al. [
29]. This also responds to the rising importance of feedstocks with higher cellulose contents (grass, stover, catch crops) in Austria. High manure or biogenic waste shares could potentially reduce the HRT along with investment costs of the fermenter, however a HRT of 100 days provides the advantage of a more stable biogas production, especially for poultry manure, oils/fats, or slaughterhouse wastes as input material. Fermentation residue tanks were designed for a retention time of six months.
A value of 8400 full-load hours was considered when generating power continuously. It was assumed that 10% of the generated electricity is used to cover biogas plant electricity demand and 66% of the generated heat is used externally (the rest of the generated heat was considered to cover the plant’s heat demand or regarded as loss).
2.1. Economic Assessment
An economic assessment of biogas plant configurations was conducted regarding newly constructed biogas plants. Different power generation scenarios were investigated and compared to each other in terms of participation in the electricity spot market and markets for secondary control energy reserves. The annuity method was used for the economic assessment according to VDI 2067 [
32]. The assessment includes a summary of one-off investments and ongoing payments within the context of the chosen method and compared to revenues over an observation period using an annuity factor, taking replacement procurements and price changes into account. The result is a total annuity of the investment, which can be positive (profitable investment) or negative (not profitable investment).
The annuity of capital-related costs
AI was calculated according to Equation (1), whereby
Ii represents the investment costs of biogas plant facilities and R the residual value after the observation period T. No residual value was considered in this work as it was assumed that biogas plant investment is paid off within the observation period. The annuity factor a was calculated according to Equation (2) considering the interest factor
q.
The annuity of ongoing payments and revenues
AO,i was calculated according to Equation (3) (payments yield negative and revenues yield positive values), whereby
A1,i represents the costs/revenues in the first year. Ongoing payments include maintenance, personnel, substrate, energy, start-up, and other costs, whereas ongoing revenues include revenues from electricity and heat sales. Price-dynamic cash value factors
bi were used, which are calculated considering price change factors
ri that must be specified beforehand.
The total annuity
AT is calculated as the sum of all annuities of revenues less cost-related annuities (Equation (5)).
Table 3 summarizes the key parameters that were used in the economic assessment including the assumptions for interest and price change factors, technical lifetime, operational costs, and observation period. CHP unit start-up costs account for the reduction of technical lifetime of the CHP units, which arises from the mechanical exposure during a start-up procedure.
Four potential modes of plant operation (power generation scenarios) were investigated and compared, which are schematically shown in
Figure 3. Scenario CONT assumes continuous power generation (base load) and represents a reference scenario, as the majority of biogas plants in Austria are currently operated as base load power plants. Scenario 12H assumes power generation only occurs by day between 08:00–20:00 by doubling the CHP unit capacity compared to the nominal capacity. Continuous power generation was also assumed in scenarios NEG and POS, whereby participation in the markets for negative (NEG) and positive (POS) secondary control energy reserves was considered. Doubling of the CHP unit capacities was also assumed in scenario POS.
Electricity prices used in the economic assessment were taken from historical data of the EPEX spot market [
33] assessing the period of July 2016 to July 2017. An electricity price of 34.8 € MWh
−1 was considered for scenarios CONT, NEG, and POS, which represents the average spot market price during the assessed period. For scenario 12H a price of 38.3 € MWh
−1 was assumed, which was the average price between 08:00–20:00 during the assessed period. Data published by the Austrian TSO Austrian Power Grid (APG) [
34] and on the internet platform for allocating of control energy reserves [
35] was used to determine the control energy reserve activation times. An energy price (remuneration for generated electricity) of 200 € MWh
−1 was specified for providing positive control energy reserves, while 45 € MWh
−1 was defined for negative control energy reserves. The average power price (remuneration for holding power capacities available) that was granted at every weekly tender for control energy reserves was considered in this work. It was assumed that control energy reserves were activated for three minutes whenever they were called off by the TSO.
A heat price of 20 € MWh
−1 was considered for revenues that are obtained from external heat utilization. In scenario 12H heat is only produced from 08:00 to 20:00 with doubled capacity. This results in a higher share of total produced heat that is used externally and higher heat revenues compared to the other scenarios. However, heat has to be imported in times when the CHP units are not operated and additional heat costs (see
Table 3) were taken into account for scenario 12H.
Investment and operational costs surveyed in the course of a biogas plant operator inquiry [
30,
31] and consultation of plant manufacturers were used in the assessment. A cost function for internal double membrane biogas storages determined by Barchmann et al. [
19] was selected for gas storage investment costs. CHP unit general overhaul costs were determined using a cost function stated in Doehler et al. [
2]. A general overhaul was assumed to take place after half of the technical lifespan stated in
Table 3 if the CHP unit is operated for 8400 full-load hours per year. For scenarios 12H, NEG, and POS, an additional working time requirement of one hour per day was assumed due to flexible plant operation as proposed in Rohrig et al. [
36]. Transportation costs of the input materials were included within the substrate costs.
Figure 4 shows biogas plant investment costs calculated for each biogas plant configuration and power generation scenario. Investment costs for scenarios 12H and POS are considerably higher than for scenarios CONT and NEG, mainly due to additional investments in CHP unit and gas storage capacity. Investment costs for biogas plant configurations with MIX and WASTE as input material mixes are higher than configurations considering MAIZE as input material mix, as additional investments in substrate pretreatment units (hygienization) are necessary.
2.2. Global Warming Potential Assessment
To include an ecological perspective, the twelve biogas plants configurations were evaluated using a life cycle assessment (LCA). This well-established tool to assess the environmental impact of a product, service, or process is standardized by ISO 14040 and ISO 14044 [
37,
38]. The four main phases are first conducted in sequence and repeated iteratively as required: goal and scope definition, inventory analysis, impact assessment, and interpretation. The LCA was conducted with the software GaBi version 8.7.0.18 from thinkstep AG to model biogas plant inventories and for the impact assessment.
Defining the goal and setting the scope of the LCA was done at its beginning and adjusted appropriately throughout the assessment. This LCA’s primary goal is to evaluate the environmental impact of biogas plant configurations from a GWP perspective, while providing an ecological perspective for the economic assessment. This is achieved by analyzing the influence on the GWP from differences within the described biogas plant configurations shown in
Figure 2 and
Table 2. As the base case the CONT scenario was chosen and investigated in the LCA. The other scenarios (12H, NEG and POS) don’t influence the assessed inventories and therefore yield the same results regarding GWP. However, the CHP units might be operated in partial load if other flexible power generation schedules are considered than the ones investigated in this study. Partial load operation of the CHP unit leads to a reduced electrical efficiency because the engines are usually optimized for full load operation. Therefore, a sensitivity analysis was conducted that varies the thermal and electrical efficiency of the CHP unit to assess the implications of this parameter.
Another sensitivity analysis was similarly conducted for the thermal energy source that was substituted by the excess thermal energy from biogas plants. Finally, the total GWP of the considered biogas plants was compared to conservative electricity sources (electricity grid mix, natural gas, and hard coal) to put the results into perspective. The comparison with natural gas and coal is of particularly interest, as Austria relies on natural gas-fired power plants to meet its electricity demand [
39], especially in the winter. In addition, near the beginning of the twenty-first century, Austria became an electricity importing country. The majority of electricity is imported from Germany and the Czech Republic, which both have high shares of coal in their energy mix [
40,
41].
The scope, described within
Figure 5, begins at feedstock supply and cultivation. This includes cultivation and harvesting for energy crops. Farm manure is considered as a waste product from livestock farming and therefore was assumed to have zero emissions from livestock farming. However, it is usually stored in a way where methane emissions are common and therefore, within this LCA, these emissions were considered as avoided GWP where farm manure is not stored but processed within biogas plants. Biogenic waste is considered as a waste product from the food industry and thus was also assumed to have zero emissions. The transportation of these different feedstock types to biogas plants was included in the assessment, as well as the conversion into biogas within biogas plants. Fermentation residue is included as part of the LCA scope by substituting mineral fertilizers (nitrogen, phosphorus, and potassium) while also accounting for the ammonia emissions from the fermentation residue application on the agricultural fields. The combustion of biogas in a CHP unit to yield electricity and heat was inside the scope. The CHP unit supplies the electricity and thermal energy to cover biogas plant demands. The functional unit was set to 1 MWh of electricity fed into the grid and the coproduced thermal energy was substituted for other conventional thermal energy sources.
Biogas plant construction and its end-of-life phase were outside the scope of the study. This is justified because of the lack of inventory data on the construction and end-of-life phase of the modeled biogas plants. Additionally, Bachmaier [
42] shows that the GWP potential of construction is between 0.002 to 0.004 t CO
2 eq. MWh
−1 and therefore has a negligible influence when investigating the emissions of CO
2 eq. from biogas plant configurations. However, to compare power generation biogas plants to the electricity grid mix, the natural gas and the hard coal plants, the GWP of plant construction was included using data from Bachmaier [
42] because the datasets from the alternatives include the construction of the corresponding plants.
For the inventory analysis of biogas plant, data from the modeled biogas plants, the professional GaBi database (DB version 8.7, service pack 36) from thinkstep AG, a public domain lifecycle and material flow database GEMIS (version 4.95), and various literature sources were used, as shown in
Table 4.
Inventory collection of the feedstock materials was done through literature sources and database inventories. While datasets for maize silage and grass silage were found within GEMIS, no such dataset was available for rye silage and catch crops. Therefore, the similar crop wheat silage was used as a dataset instead for rye silage and catch crops. Maize straw was assumed to have zero emissions allocated from its maize plant cultivation, however the harvesting and field-to-farm transportation was modeled and included with GaBi datasets for agriculture processes. Farm manure, which is normally stored, is utilized within biogas plants. The resulting averted methane emissions were considered for each manure type from Bachmaier [
42].
The transportation distance is modeled with an average truck transporter according to the investigated biogas model plants. For biogenic waste and farm manure, the distance was constantly kept at 0.5 km, which is an average distance observed at biogas plants in Austria and in line with Stuermer et al. [
43] or Walla and Schneeberger [
44]. Typically, the majority of area for substrate production is close to the biogas plant. For the energy crops, the distances were given in respect to biogas plant size, i.e., 1.0/1.3/2.0/3.0 km in transportation distances for a 150/250/500/750 kW plant, respectively.
The biogas production (electricity demand, thermal energy demand, substrate demand, digestate coproduction, and biogas production) and CHP (electrical and thermal efficiency) units were modeled considering their respective parameters from
Table 2 and
Figure 2. Gas leakage within the biogas production units was set to 0.33% according to Liebetrau et al. [
22], while a leakage of 0.5% was assumed for the CHP unit.
Besides methane, biogas production also yields fermentation residues (digestate). These residues have a fertilization value of nitrogen, phosphor, and potassium and can be applied for crop fertilization. The average contents of these elements within fermentation residues were set according to Wendland and Lichti [
45]. Subsequent mineral fertilizers can be replaced and their avoided emissions were calculated from datasets found in GEMIS. However, digestate fertilization tends to have extra ammonia emissions, which were considered in this LCA scope and calculated according to Bachmaier [
42] for fertilization of winter wheat and grain maize.
After meeting the thermal energy needs for biogas production, excess thermal energy can be utilized elsewhere and alternative thermal energy conversion can be substituted. Within this inventory, thermal energy generated from burning wood pellets was substituted and the avoided emissions from this alternative thermal energy provision were accounted for in the base case. Preferably energy from biogas as a renewable energy source should substitute a fossil energy resource. Within a sensitivity analysis, alternative sources for thermal energy were varied from wood pellets to natural gas and light fuel oil to investigate the influence of this credit on the LCA results. The inventories for the alternative thermal energy sources are available from the GaBi professional database.
To assess the GWP, the IPCC AR 5 (100 years, excluding biogenic carbon) method was selected for the impact assessment [
46]. The GWP is of particular interest for biogas plants because it can quantify the renewable and circular nature of the considered carbon dioxide. Other impact categories were not included, as they were outside the scope of this study. However, eutrophication potential, acidification potential, and water use are relevant impact categories for agricultural processes (e.g., cultivation of energy crops) that need to be considered and were included in other scientific studies of biogas plants. Bacenetti et al. [
47] and Lijó et al. [
48] have shown the relevance of acidification and eutrophication potentials for biogas plants and the most relevant contributors within these categories were found in the cultivation of the energy crops and the application of digestate for fertilizing agricultural fields. Assessments by Dressler et al. [
49] and Provolo et al. [
50] also included additional impact categories. Dressler et al. presented results for biogas production from maize and concluded that application of the digester output and emissions from the CHP unit were the most relevant factors in regards to acidification and eutrophication potential. Provolo et al. assessed the GWP and acidification potential of different manure management systems including biogas production. They underlined the importance of including additional impact categories as particular matter production and eutrophication in further works for the purpose of a holistic assessment. Unfortunately, the life cycle inventory of the presented biogas plant setups investigated in this study was insufficient for inclusion of additional impact categories besides GWP due to missing data and consequently they were excluded from this study, as an incomplete life cycle inventory would lead to misleading results.

 and
and 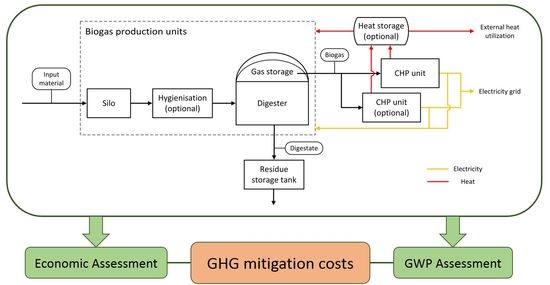


