Article

An Effects Analysis of Logistics Collaboration: The Case of Pharmaceutical Supplies in Seoul

1
Department of Transportation Engineering, University of Seoul, 02504 Seoul, Korea
2
Public Investment Management Center, Busan Development Institute, 47210 Busan, Korea
3
School of Civil, Environmental and Architectural Engineering, Korea University, 136-701 Seoul, Korea
*
Author to whom correspondence should be addressed.
Sustainability 2019, 11(8), 2442; https://doi.org/10.3390/su11082442
Submission received: 29 March 2019 / Revised: 15 April 2019 / Accepted: 18 April 2019 / Published: 25 April 2019
(This article belongs to the Special Issue Sustainable Urban Logistics)

Abstract

:
This paper estimates the environmental, social and financial effects of logistics collaboration of the existing logistics companies in Seoul, Korea. The truck routing models for collaborative and non-collaborative deliveries are proposed to estimate the collaboration effects. Findings show that both major and minor companies can benefit from logistics collaboration by saving delivery costs and time through economies of scale. The results from the study further indicate that logistics collaboration can mitigate negative environmental impacts resulting from urban logistics by reducing the number of delivery trucks, and shortening delivery times and travel distances. Discussion of related challenges that must be addressed during the implementation of logistic collaboration is included as well.

1. Introduction

The abrupt growth in goods movement within urban areas, accompanied by a rapid increase in traffic congestion, pollution and noise, has resulted in deteriorating living conditions in many cities [1,2]. Such adverse impacts have prompted substantial interest in improving the operational efficiency of urban goods movement on the part of both the public and private sectors. Government agencies have sought measures to mitigate negative effects caused by freight transport systems in their municipalities [3,4,5,6,7]. Private logistics service providers have endeavored to improve their operational efficiency to satisfy the heightened expectations of customers and to deliver products with shorter life cycles in a timely manner [8,9,10,11]. Meanwhile, the contribution of diesel trucks to air pollution in urban areas has increasingly been identified by researchers, resulting in efforts to reduce vehicle miles traveled (VMT) for trucks in urban areas [12,13].
An increasing number of logistics companies are working cooperatively to optimize their operational efficiency and to reduce the social and environmental costs within their cities [14,15,16]. However, in practice, many logistics collaboration initiatives unfortunately fail in an early stage of implementation [17]. The primary challenge is to encourage logistics companies to participate in collaboration [18]. Allen, Browne [19] also note that a significant barrier for logistics collaboration is a lack of participation from the stakeholders. For logistics companies, if the current state of their logistics system is satisfactory, taking risks by changing the system adapting collaboration can be a burden. Encouraging logistics companies to join collaboration requires a detailed supporting data explaining how they can benefit by shifting logistics system into collaboration. For this issue, logistics collaboration impacts have been studied in literature [20,21,22,23]. However, these studies might limit in real-world implementations with an absence of detailed calibration procedures. The logistics collaboration impact analysis is commonly conducted under hypothetical scenarios comparing before and after collaboration. With such an underlying assumption, these studies cannot fully characterize the logistics collaboration without detailed logistics companies’ delivery data. However, to the best of our knowledge, there have been no systematic methods to evaluate the collaboration benefits (e.g., including social, financial and environmental cost savings) from detailed survey data.
In this study, we develop microscopic truck-routing models that quantify the operational, social, and environmental cost savings resulting from logistics collaboration. The proposed model is applied to pharmaceutical supplies in Seoul, the capital of the Republic of Korea, where 20% of the nation’s population resides. We surveyed two existing logistics companies serving pharmaceutical supplies in the case-study area. The surveyed major logistics company represents the logistics collaboration entity with its large amount of freight that retains 50% of the market share in pharmaceutical supplies in Korea. The surveyed minor logistics company represents the attribute of non-collaboration logistics companies. The proposed framework incorporates three models to capture collaboration and non-collaboration logistics behaviors: (i) p-regions problem [24], which is applied for modeling the major company’s regional allocation. This allocates the delivery regions before assigning trucks, (ii) the vehicle routing problem (VRP) [25,26,27], that utilizes the truck routings within allocated regions, (iii) next destination-choice and trip-purpose models [28], that capture the minor company’s truck routing without regional allocations. The first two models utilize the major logistics company model that represents logistics collaboration, and the third model explains the minor logistics company model under non-collaboration logistics.
The remainder of this paper is structured as follows. Discussion of relevant previous studies in freight modeling, logistics collaboration, and air pollution from trucks are presented in Section 2. Section 3 describes the study area and explains the study assumptions. The proposed model is explained in Section 4. Findings from applying the proposed model in the study area are discussed in Section 5, and the paper ends with a brief discussion of the findings and future study plans.

2. Literature Review

Developing a model to evaluate logistics collaboration incorporates truck routing problems reflecting different operational strategies. The truck movements in urban areas have been previously modeled by traditional four-step, commodity-based, and tour-based approaches [1]. Recently, many studies have adopted the tour-based approach due to its ability to explicitly represent trips and trip chaining [28,29,30,31]. The present study utilizes the tour-based approach in modeling truck movements.
The impact of logistics collaboration has been evaluated in several studies incorporating different truck-routing strategies. Muñoz-Villamizar, Montoya-Torres [21] compare the collaboration and non-collaboration logistics in urban-freight distribution scenarios using empirical data from the city of Bogota, Colombia. Both scenarios are modeled by capacitated vehicle routing problems (CVRPs). The result indicates that logistics collaboration can achieve the benefit in terms of transportation costs and service level. Soysal, Bloemhof-Ruwaard [23] estimate the benefit of logistics collaboration by applying the inventory routing problem (IRP). The primary criteria used for evaluation are emissions, driving time, total cost (fuel and wage of driver), inventory and waste costs. The case-study results show that logistics collaboration for suppliers may reduce total logistics cost (up to 17% saving) and emissions (up to 29% reduction), while its benefit can be sensitive according to the parameter changes–e.g., supplier size or maximum product shelf life. Park, Park [22] formulate courier, express, and parcel (CEP) delivery behaviors in last-mile networks to estimate the effects of logistics collaboration in Seoul, Korea. Two models are formulated to explain both vertical and horizontal delivery behaviors. The results show that the CEP collaboration can save a significant social cost in the case of applying to the apartment complexes which contain 900+ household numbers. Montoya-Torres, Muñoz-Villamizar [20] suggests the urban logistics collaboration system by utilizing the proposed mathematical model. The result shows that logistics collaboration can benefit both transportation costs, congestion and environmental impacts.
Urban distribution centers play a key role in implementing logistics collaboration. Researchers are aware that the urban consolidation center (UCC) can reduce truck usages, logistics costs and adverse environment impacts by allowing multiple companies to share a distribution facility [19,32]. Allen, Browne [19] identify that the 114 UCC schemes in 17 countries (e.g., 12 in the European Union-EU and 5 outside of the EU) have conducted for feasibility study or operational field experiments over the last forty years. Lin, Chen [33] analyze the logistics collaboration’s impacts in monetary terms considering diverse operational (e.g., the UCC rent cost and freight demand) and political variables (e.g., truck-size restriction within city centers). The result shows that the potential benefits of the UCC could generate from either improving the utilization of vehicle capacity through consolidation, or by shifting the location of distribution center to less expensive area. Van Heeswijk, Larsen [34] adopt the agent-based model simulations in the city of Copenhagen, to evaluate the UCC related urban logistics schemes. The results indicate that many schemes during the simulations can yield the benefits by reducing truck kilometers driven by up to 65% and emission reductions up to 70%.
Diesel trucks in urban logistics are widely recognized as one of the primary causes of air pollution in urban areas since the last-mile logistics are predominantly delivered by trucks. The cities in the EU countries (e.g., London-England, Milan-Italy, Swedish, Dutch, and Danish cities) have implemented the low emission zones (LEZs) to restrict an old-truck access in urban areas. Additionally, alternative delivery modes, such as Cargotram, waterway deliveries, and Monoprix rails, are proposed to reduce the truck VMT as well as environmental impact in the cities of France and Germany [35,36]. One effective strategy to reduce truck VMT in urban areas is a tolling. Wang and Zhang [37] conduct the stated preference survey to estimate the truck VMT changes according to the hypothetical toll price increase scenarios on a different truck size in New York State. The result shows that larger trucks can be more affected by toll increase that 4-axle and more than 5-axle groups reduce the current VMT to about 65% level from 100% of a toll increase while 2-axle group VMT to 78% and 3-axle to 77%, respectively.
However, there has been relatively less attention evaluating air pollution caused by trucks in urban areas. Brunekreef, Janssen [38] study the lung function of children and assessed their exposure to traffic-related air pollution in six different regions, using separate counts for automobiles and trucks. The study shows that lung function is more likely to be associated with truck density than automobile density. Small and Kazimi [39] measures the cost of regional air pollution from motor vehicles in Los Angeles. The results indicate that air pollution costs are especially high for diesel vehicles and trucks due to their direct and indirect contribution to ambient particulate concentrations. Exposure to air pollutions is assessed based on distance from motorways in six districts in the West of the Netherlands [40]. In the Seoul metropolitan area, trucks account for 15% of the registered vehicles, however they generate approximately 60% of the region’s air pollution. Furthermore, diesel vehicles contribute the greatest amount of pollution (29% of the total) in all industry sectors [41]. A report by the Organization for Economic Cooperation and Development (OECD) [42] ranked South Korea as the worst country for air pollution among thirty-eight countries in both 2016 and 2017.
The primary focus of previous studies on logistics collaboration has been the truck routings strategy, the UCCs, truck VMT and/or an environmental impact analysis. However, the research gap exists: (i) to model both collaborative and non-collaborative logistics behaviors based on detailed empirical data surveyed from large- and small-sized logistics companies, and (ii) to estimate logistics collaboration impact in social, financial and environmental cost savings under the single framework with real networks. To fill this research gap, we develop the microscopic truck-routing models explaining both collaborative and non-collaborative deliveries based on the survey data and estimate the impact of logistics collaboration under various collaboration levels. Section 3 provides a description of the case-study area in which the proposed model was applied, followed by a detailed explanation of the model.

3. Description of the Case-Study Area and Assumptions

Seoul is comprised of twenty-five administrative districts. Figure 1a shows a map of Seoul and the case-study area location in Seoul. The area enclosed by the light blue line shown in Figure 1 is the administrative district (i.e., Dongdaemun-gu) which is the subject of the present study. The grey polygons inside of the light blue line in Figure 1a represent the census output areas which are the smallest geographical units with similar-population size used for statistical purposes and for providing geographical information [43]. These census output areas (see Figure 1a) are grouped into 81 zones (see Figure 1b) to assign the similar quantity of pharmaceutical demand in each zone.
The present study uses pharmaceutical supplies as a case-study commodity primarily due to a data availability and the attributes of the commodity. We could acquire specific daily delivery schedules including all customer locations with cooperation of two existing logistics companies delivering the case-study area during the last quarter of 2014. Additionally, pharmaceutical supplies better represent other commodities that do not require additional equipment for distributions. This enables model transferability to be more accessible to other similar commodities. The population distribution and the daily demand of pharmaceutical supplies in each zone are shown in Figure 1c,d respectively.
The distribution centers of six logistics companies (one major and five minors), from which their delivery trucks depart to the zones are all located outside of the case-study area but in close proximity (less than 1 km) of each other. The major company currently holds approximately 50% of the total market share in the case-study area, while the remaining five companies together hold the remaining 50%. Major company’s distribution center is assumed to be used as a UCC in the simulation. Note that we consider the round-trip delivery costs from the UCC to the zones, while the costs associated with distributing the pharmaceutical supplies within internal-zone level are assumed to remain unchanged. The total delivery costs under existing operational strategies are compared with the costs under logistics collaboration.
The daily demands of each zone (see Figure 1d) are determined by the survey data from two pharmaceutical logistics companies serving the region. The survey data include pharmaceutical truck activities incorporating vehicle types, travel distance, exact departure and arrival location, and departure and arrival time during the last quarter of 2014. The total daily demand in the case-study area is 1406 boxes. The average time for delivery in each stop was around 60 s, with 15 s per box for unloading from trucks. Note that both minor and major companies predominantly use 1.5-ton small trucks for the last-mile delivery. The capacity of a 1.5-ton truck used by both the major and minor companies is approximately 250 boxes [18]. Trucks are limited to delivering the supplies up to 50 zones maximum.
The different delivering strategies currently being employed by the major and minor logistics companies are illustrated in Figure 2. The small dots shown in Figure 2a,b represent the location of zones where multiple customers are located. Supposing that both the major and minor companies serve the same region, the major company considers regional allocation (see the dotted line in Figure 2a) in deliveries to optimize their delivery route, while the minor companies deliver the commodities without considering regional allocation (see the trucks routes in Figure 2b). The major company serves a large and stable quantity of commodities over a broad area. The dense demands for the major logistics company allow it to allocate a single truck to cover a smaller area compared with the minor companies. Since the demands for minor companies are sporadically scattered across the entire region, the minor companies are unable to consider regional allocation and their trucks must cover a wider area with less dense commodities. Note that the delivery pattern of the major company represents logistics behavior after collaboration and the minor company’s delivery pattern represents the logistics companies before joining the collaboration.

4. Methodology

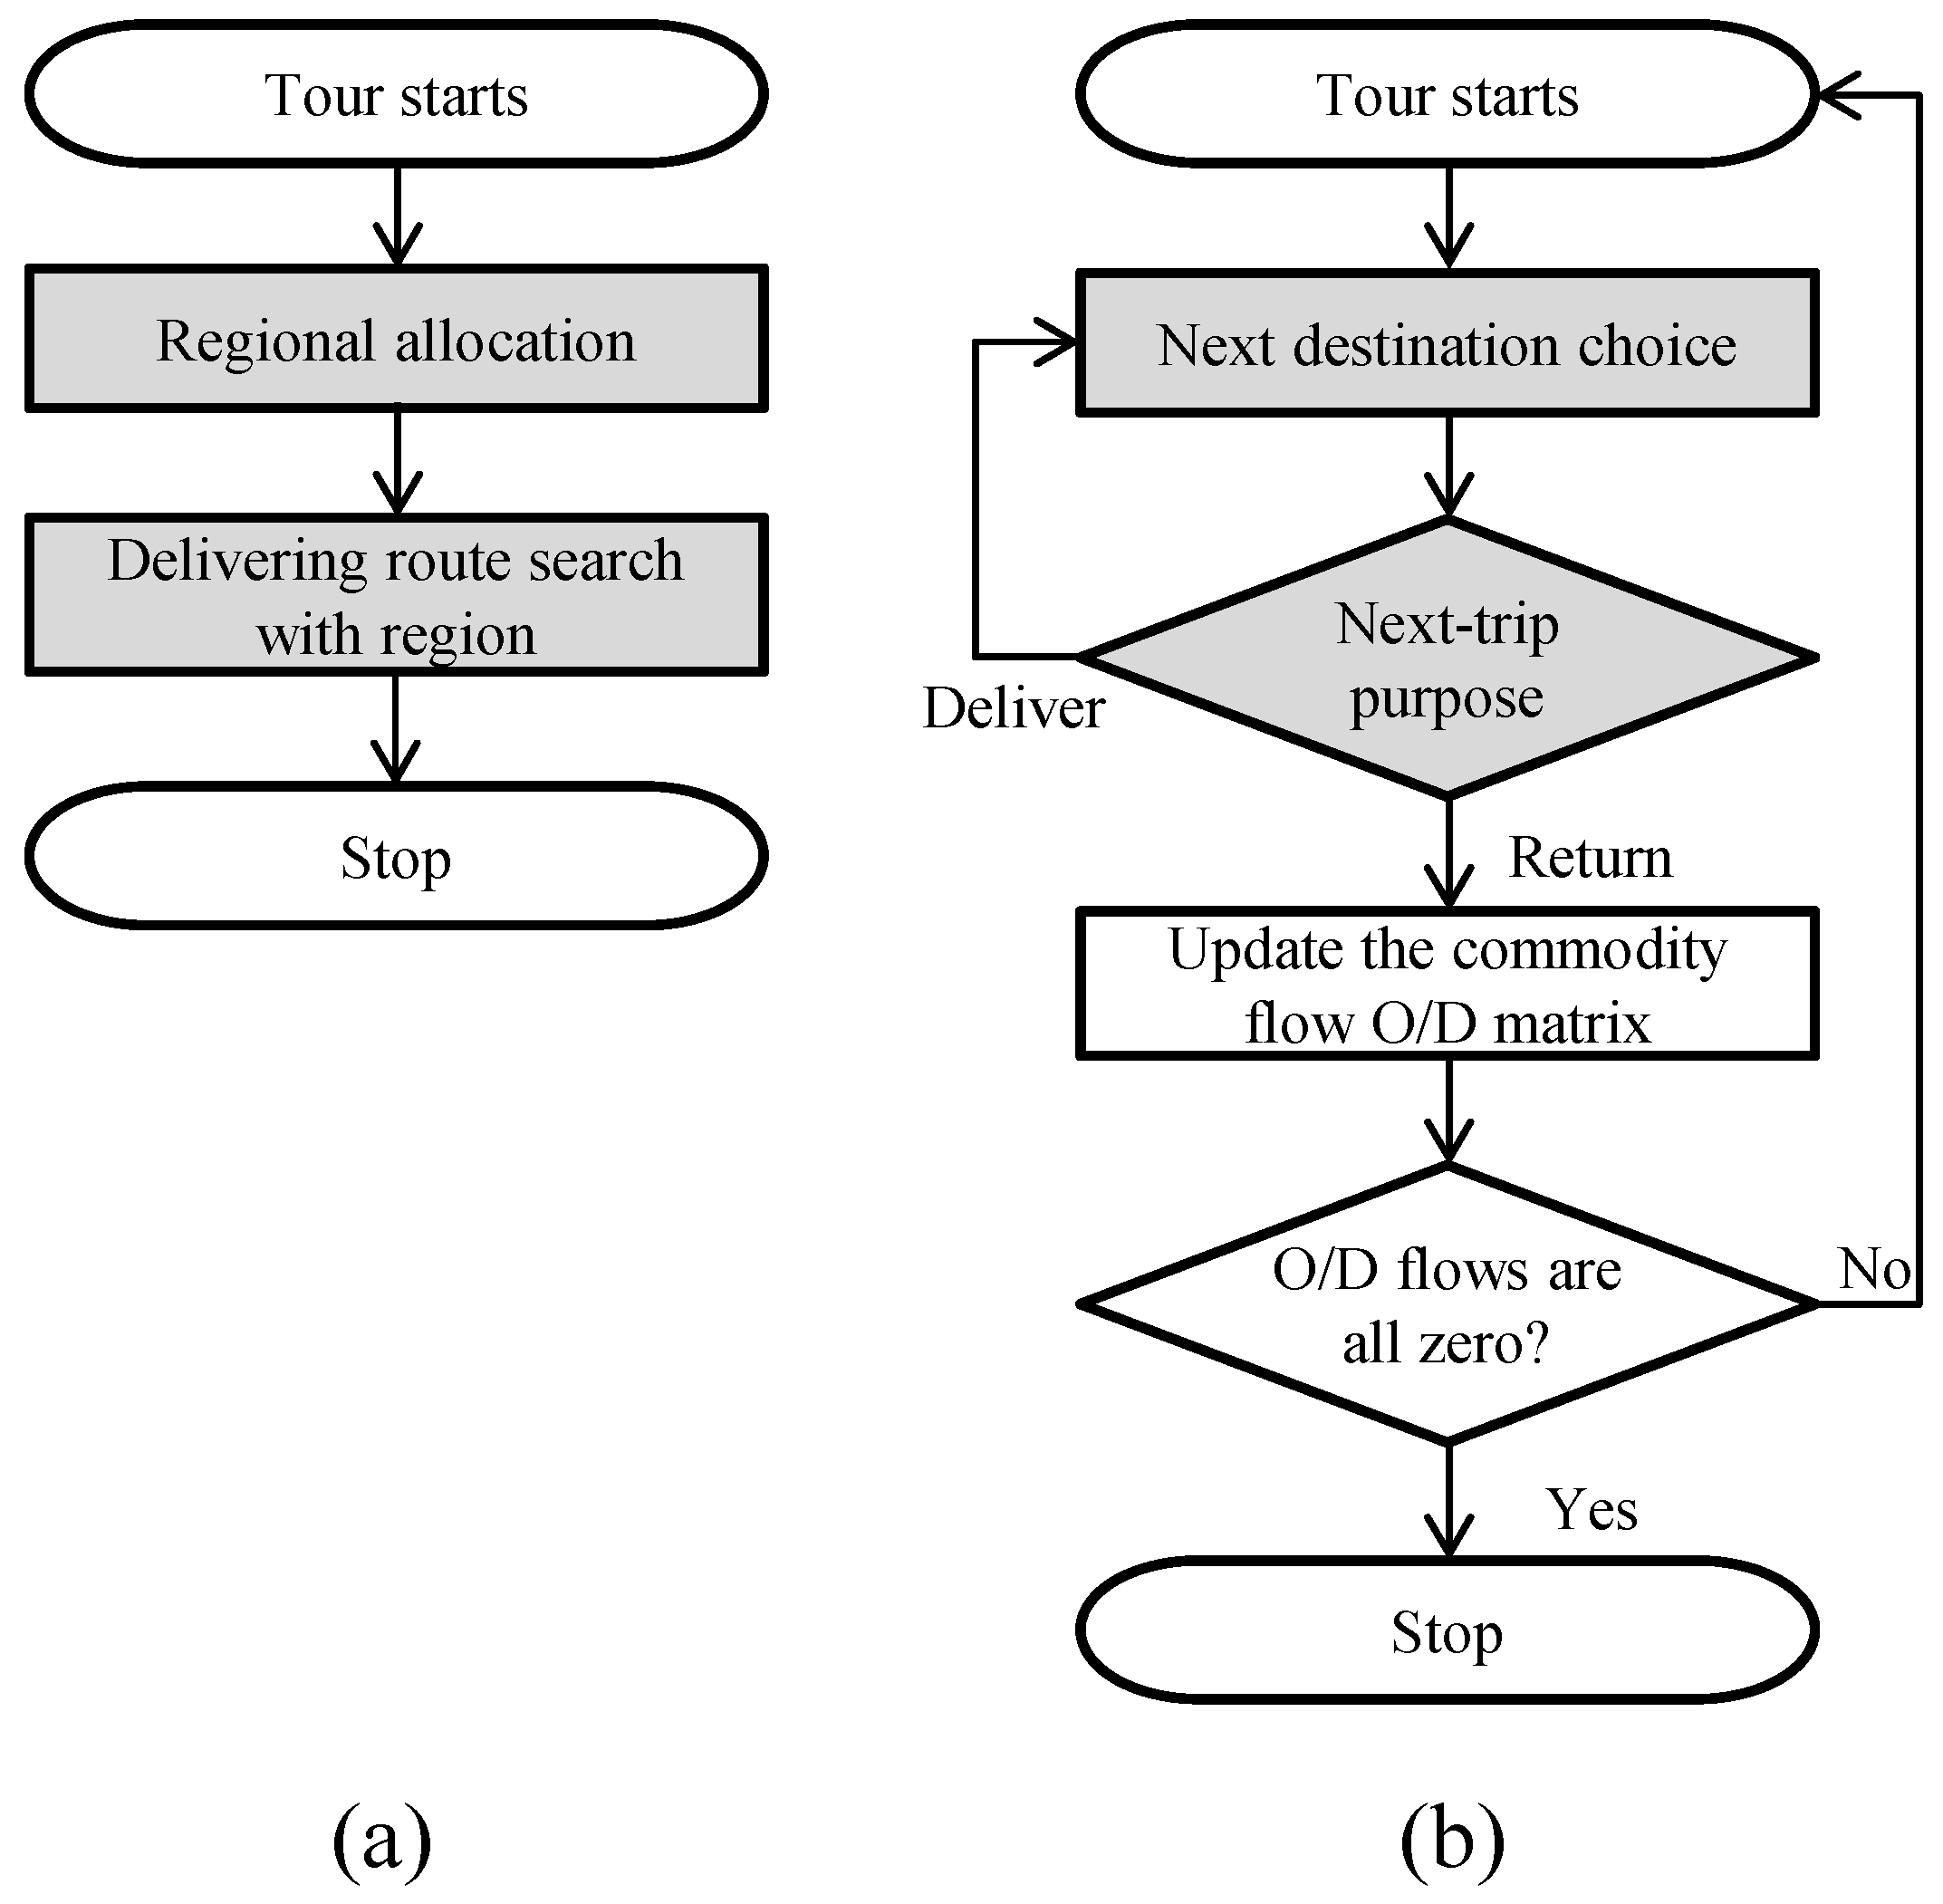
Two different truck routing models that consider the existing delivery strategies of the major and minor companies are developed. The truck movements of the major company are modeled in two steps: (i) regional allocation; and (ii) delivery route search (see the grey boxes in Figure 3a). On the other hand, the truck routing model of the minor companies do not consider regional allocation. The minor company model describes its truck route based on the available demand to deliver in the next destination and the trip distance from the current location to the next destination (see the grey box in Figure 3b). These two models are explained in Section 4.1 and Section 4.2.

4.1. Major Company Truck Routing Model

4.1.1. Regional Allocation

The problem of grouping a finite set of n small zones (see the small dots in Figure 2a) into a set of p geometrically connected regions (see the dotted lines in Figure 2a), based on a predefined objective function is referred to as a p-regions problem [24]. This is a family of problems that are classified as non-deterministic polynomial-time hard (NP-hard) [44]. Different p-regions models are developed to ensure the contiguity of clustering of small areas [44,45,46].
Equation (1) by Gordon [24] shows the objective function used to group each of the zones into p-regions. Note that this step only applies to the major company truck routing model. The symbol d i j denotes a distance between zone i and j. H ( C k ) denotes a heterogeneity of the region k (e.g., A 0 , B 0 or C 0 in Figure 4a). The heterogeneity is calculated by summing the distance ( d i j ) of all possible zone-pairs within a region k. Regional allocation is conducted by minimizing heterogeneity within each region.
H ( C k ) = i j = C k | i < j d i j
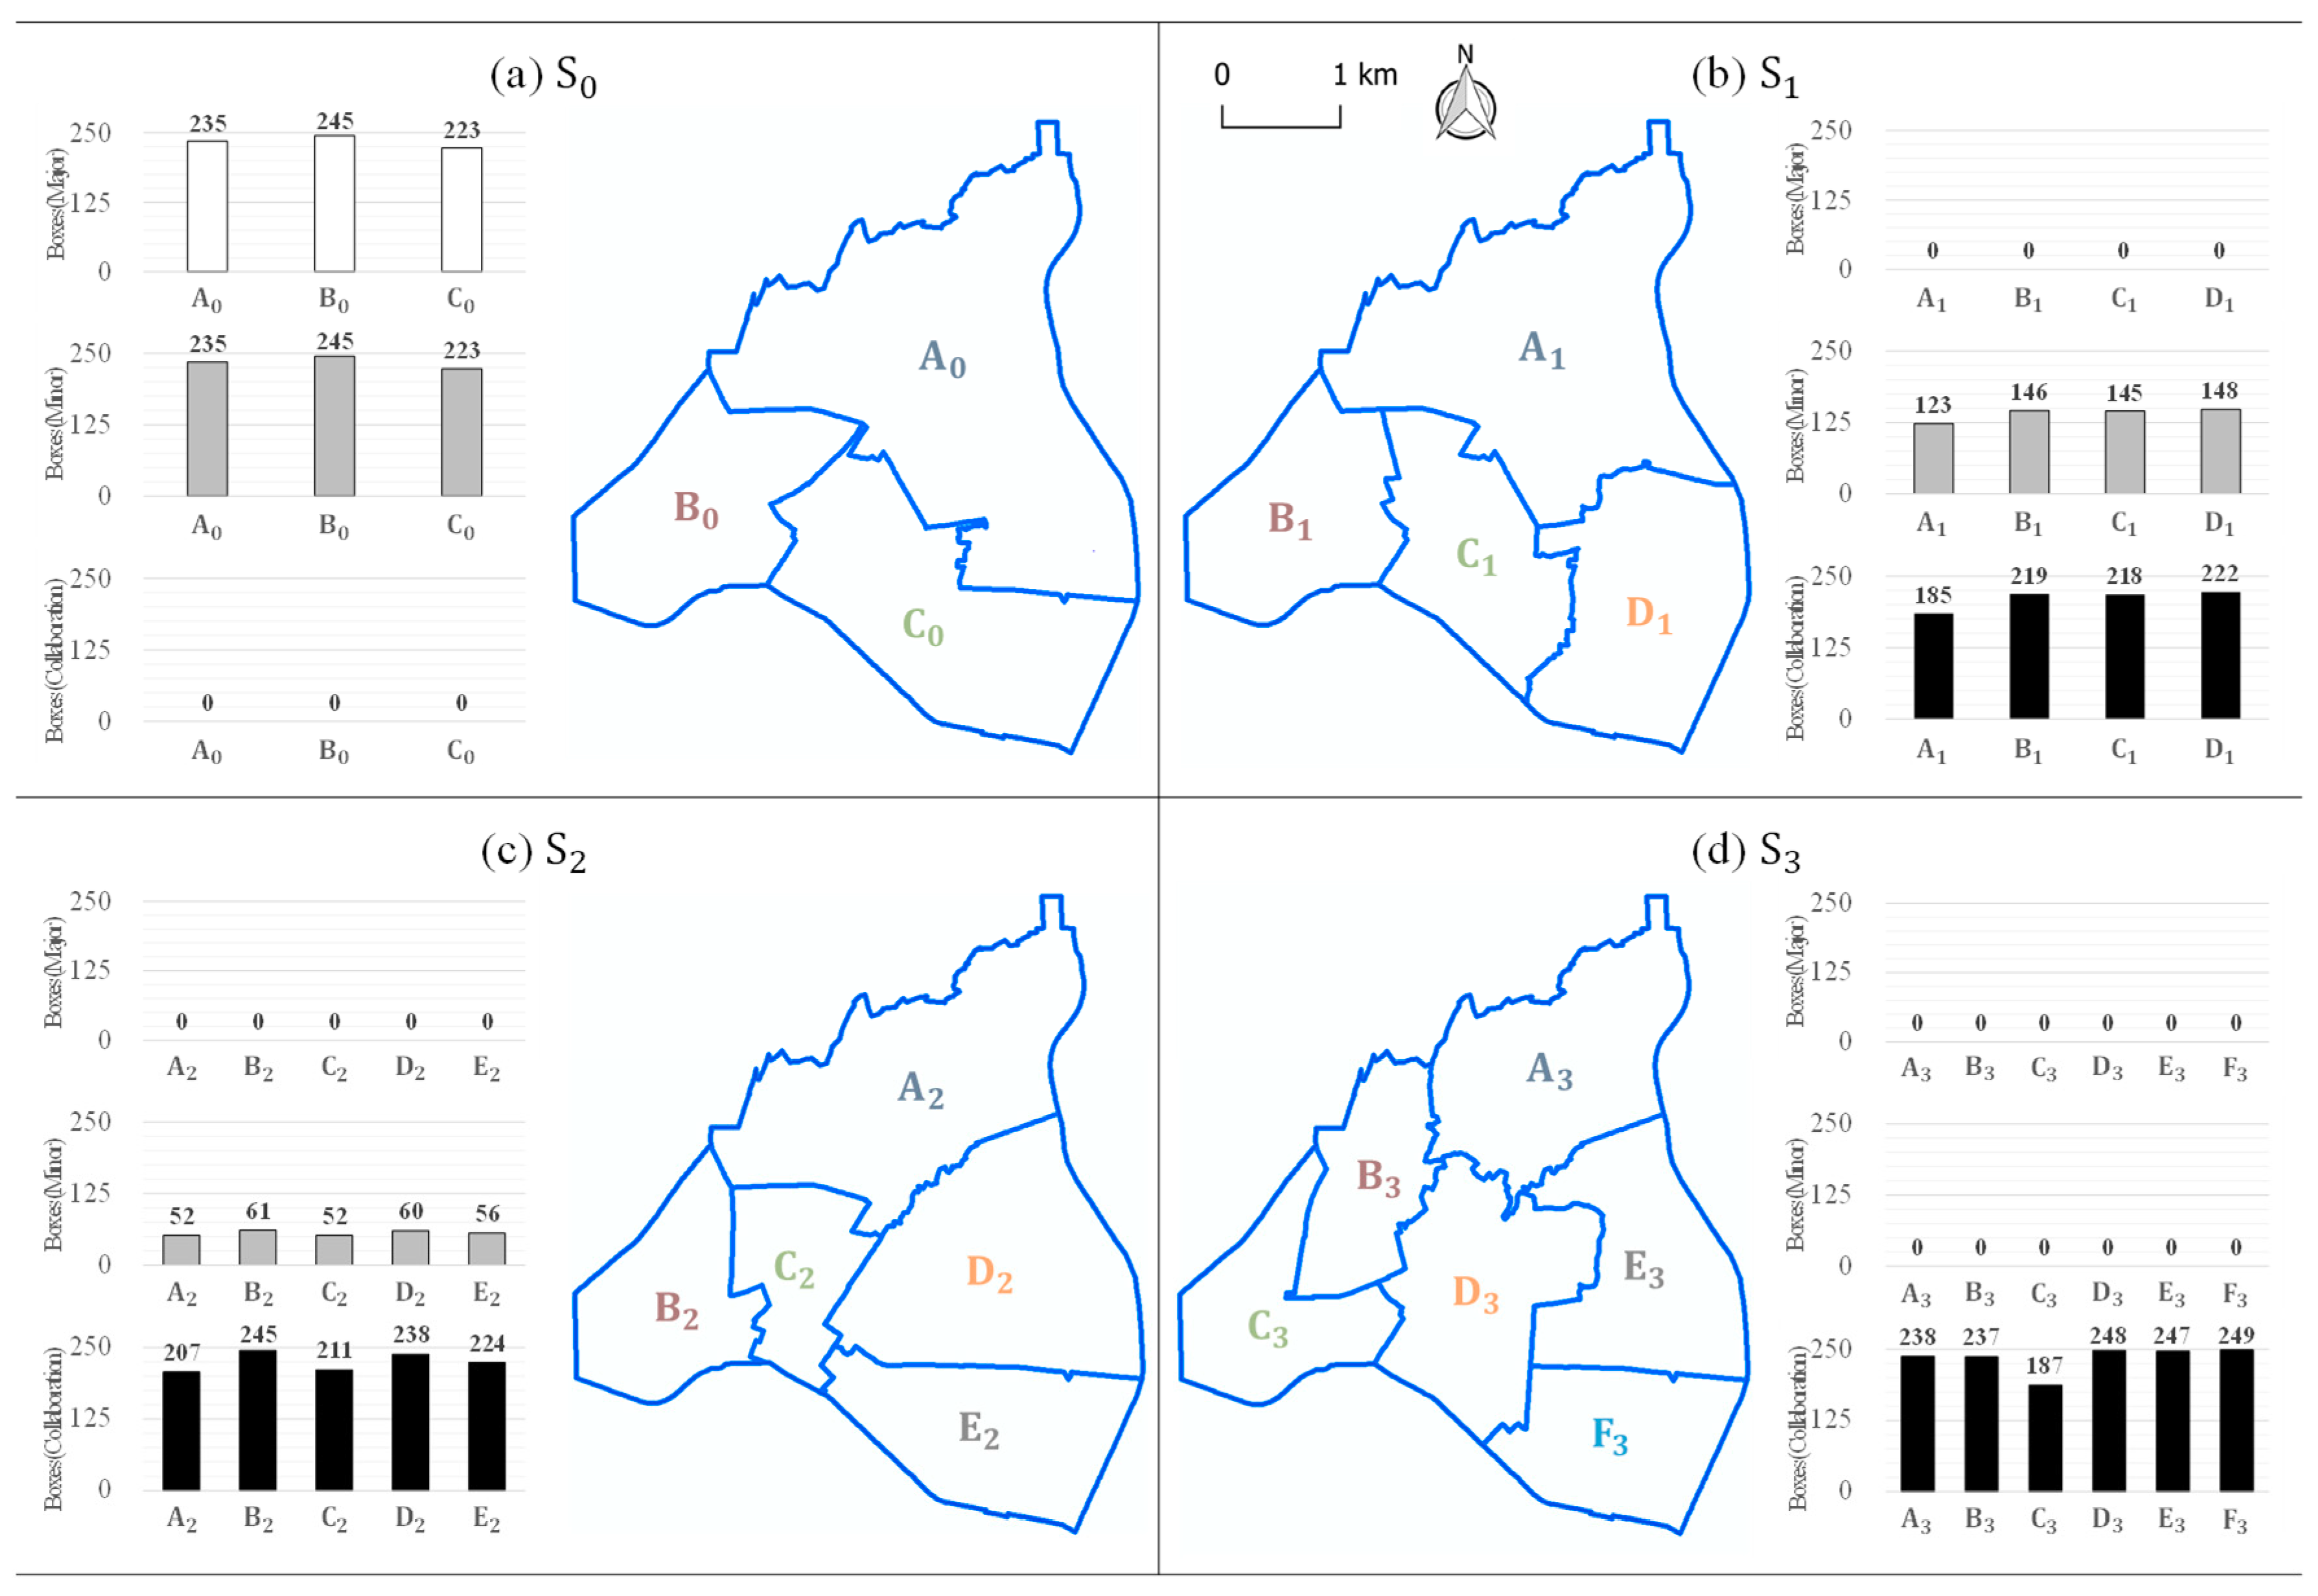
For the regional allocation, this study used the p-regions problem with 81 subdivided zones. To resolve the p-regions problem, the geographic information system (GIS) is used. Figure 4 illustrates how regions are grouped based on different levels of collaboration. The collaboration entity consists of 100% of the major company’s market share and equal percentages of each of the minor companies. Figure 4a shows that the case-study area is divided into three regions under the existing condition (i.e., 50% market share for major company and 50% for minor). With a limited truck capacity (250 boxes), increasing demand in each zone results in fewer zones being included in each region.
Table 1 shows the result of regional allocation in demand of each region under the different level share of collaboration. Currently, 703 boxes out of the 1406 comprising daily demand are delivered by the major company. Under the baseline scenario, S 0 , no collaboration, the case-study area is divided into three regions, A 0 , B 0 and C 0 (see Table 1 and Figure 4a). Each region under S 0 consists of 42, 14 and 25 zones, respectively. The amount of supplies being delivered by the major logistics companies (see the white bars in Figure 4) and the minor logistics companies (see the grey bars in Figure 5) in each region is shown in the left side of Figure 4a. Under Scenario 1, S 1 , in which 10% of the minor company joins the collaboration entity, the entity will deliver 185, 219, 218 and 222 boxes (see the black bars in Figure 4b) of supplies to region A 1 , B 1 , C 1 , and D 1 respectively. The boundaries of regions under different levels of collaboration are shown in Figure 4.

4.1.2. Delivery Route Search

In order to describe truck routes within a region, we utilize the VRP. After assigning a single truck to a region, its route within the region was determined based on Equations (2) and (3), subject to Equations (4) through (9). A single truck is assigned to each region in the model and each truck’s capacity, M, together with its delivery cost (delivery time and stop duration) is considered in determining each truck’s route within a region [25,26,27].
M i n i m i z e ( C h )
C h = i V h   j V h b i j   x i j
subject to
i V h x i j = 1             j V h { 0 }
j V h x i j = 1             i V h { 0 }
i V h x i 0 = 1
j V h x 0 j = 1
u j u i + M ( 1 x i j ) d j       i ,   j V h { 0 } ,   i j
d i u i M             i V h { 0 }
Notations
  • i ,   j : index for each zone in region h
  • H : index for delivery region
  • V h : set of each zone with delivery demand of more than 1 in region h including depot (i = 0)
  • C h : total delivery cost in region h
  • b i j : delivery cost from zone i to zone j
  • M : capacity of truck for delivery
  • u i : the available truck load after it visits zone i
  • d i : demand at each zone i
  • x i j : binary variable indicating whether a truck goes from zone i to zone j
Equations (2) and (3) show that truck routes are determined by minimizing the total delivery cost. Equations (4) and (5) guarantee that only one truck visits each zone, and Equations (6) and (7) guarantee that one truck departing from the depot returns to the depot [47]. Decision variables x i j are active when a truck travels directly from zone i to zone j . Equation (8) is active when a truck travels directly from zone i to zone j . When x i j = 0 constraint, then i is not binding since M u i and u j d j whereas x i j = 1 , this imposes that u j u i + d j . These impose both the connectivity and the capacity requirements [48,49].

4.2. Minor Company Truck Routing Model

4.2.1. Selecting Next Destination

The probability of a truck choosing to the next-destination (e.g., zone i) among the set of zones D (see Equation (11)) was often formulated by the multinomial logit model, assuming that each truck’s next destination is selected by maximizing its utility (see Equation (10)). The utility of a truck traveling to zone i is based on a function incorporating the distance from the truck’s current location to next destination zone i (DIST), and the demand for zone i (DEMAND).
U = β 1 × D I S T + β 2 × ln ( D E M A N D )
where,
  • D I S T : The distance from current location to next destination i.
  • D E M A N D : The amount of freight demand available to deliver in the next destination i
In the minor company model, the next destination choice model is employed (see Equation (11)) using a multinomial logit model. Destination choice is a discrete choice based on the principle of utility maximization, and it is assumed that an individual truck driver chooses their next destination while maximizing their utility. The zones are used as the choice alternatives in this study. Each of the explanatory variables for destination choice models were applied in the same manner. The conditional probability of truck driver n, selecting destination i from a choice alternative set D, π n ( i | D ) can be estimated by Equation (11). In this study, available alternatives in the choice zone set are restricted by 3.5 km distance boundary. As a size measure, the amount of freight demand of the zone is used.
π n ( i | D ) = e x p { β x i n + μ   ln M i } j = 1 J e x p { β x j n + μ   ln M j }
Notations
  • π n ( i | D ) : probability of truck driver n selecting zone i from choice zone set D
  • β : coefficient of the distance attribute
  • x i n : value of the distance attribute of truck driver n selecting zone i
  • M i : size measure of zone i
  • μ : coefficient of size measures
  • D : truck driver n’s choice zone set
  • J : number of zone alternatives in the subset region
Table 2 shows the parameters calibrated by survey results from existing logistics companies’ route choices. The purpose of this model is to define the next destination location in a tour. The model, which includes the distance from current to next destination in the model, has a negative sign in the destination choice model for the entire trip, indicating that the destination with the shorter travel time is more likely to be chosen. The unit of freight available to deliver to the next destination shows a positive sign, indicating a preference for the presence of a large quantity of freight. Coefficients have t-statistics greater than 1.0 and less than −1.0 indicating that variables have significant explanatory power from the model. Note that the multinomial logit model generally takes a single value of 1.0 instead of the t critical value from the t-statistics table.

4.2.2. Determining the Purpose of Next-Trip

A truck driver can decide to either continue delivering commodities or return to the base after visiting a zone. The utility of either returning to the base or continuing delivery to another zone is determined using Equations (12) and (13) [50,51]. The parameters calibrated for the next trip purpose choice model from survey data are shown in Table 3. The result shows that the perceived utility of returning to the base decreases with an increase in distance from the current location to the point of origin. This indicates that trucks are likely to choose their final visits as close to their origin as possible. Increases in the cumulative traveled distance up to the current location increased the likelihood that a truck would return to the base as expected, since drivers who complete more delivery tasks are more likely to return to their bases for rest or vehicle maintenance. The t-statistics suggests that all variables have explanatory power from the model.
U d e l i v e r y = A S C d e l i v e r y
U r e t u r n = β 1 × D I S T r e t u r n + β 2 × D I S T c u m u l a t i v e
where,
  • A S D d e l i v e r y : Alternative specific constant for delivery
  • D I S T r e t u r n : Returning distance from the current location to base
  • D I S T C u m u l a t i v e : The cumulative distance up to the current location

5. Findings and Discussion

5.1. Findings

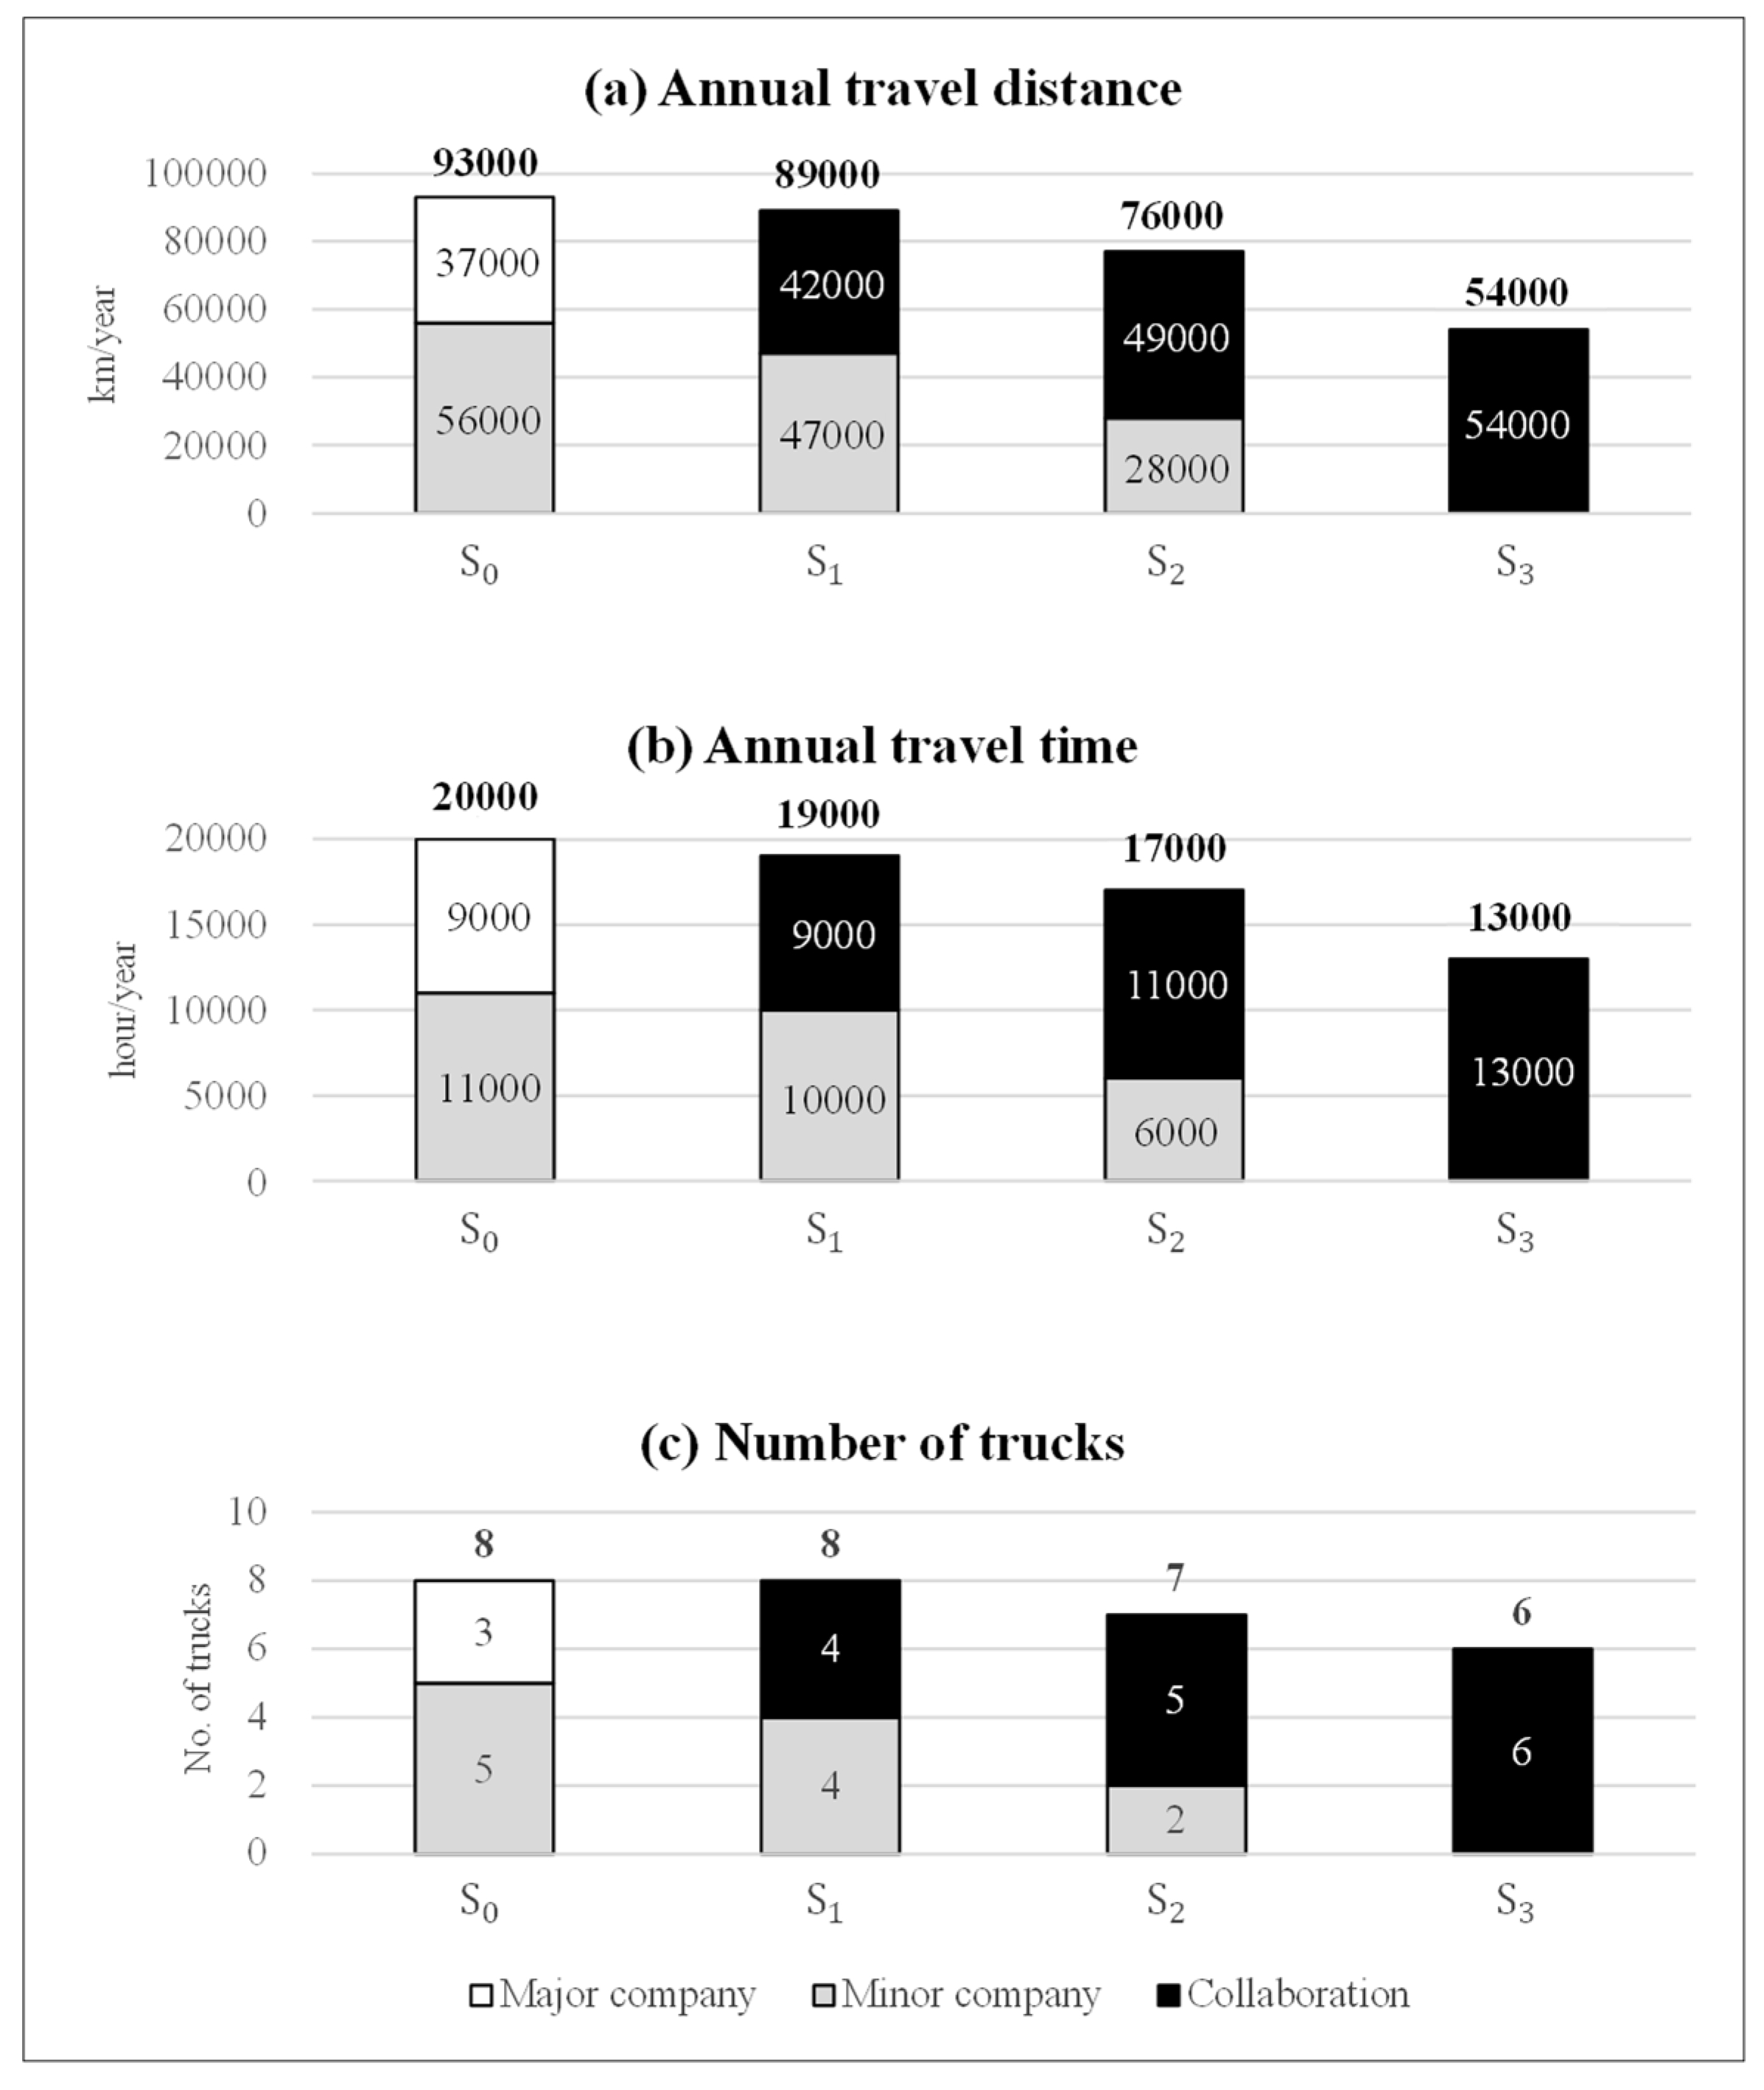
Figure 5 shows annual distance and time travelled with the number of trucks used for delivery in each scenario. Note that the base scenario, S 0 represents the existing current state of pharmaceutical logistics in the case-study area which share the half of the freight delivered by major company and rest half by the minor companies. The remaining scenarios S 1 3 show that the entire market share of the major company joining in logistics collaboration, while minor companies join gradually according to the increasing collaboration level. The white and grey bars represent the statistics related to the major and minor logistics companies, while the black bar represents the statistics related to the collaboration entity. The result shows that increasing the collaboration level can reduce the vehicle-kilometer travelled (VKT) and delivery time, which also reduces the number of trucks required for delivery.
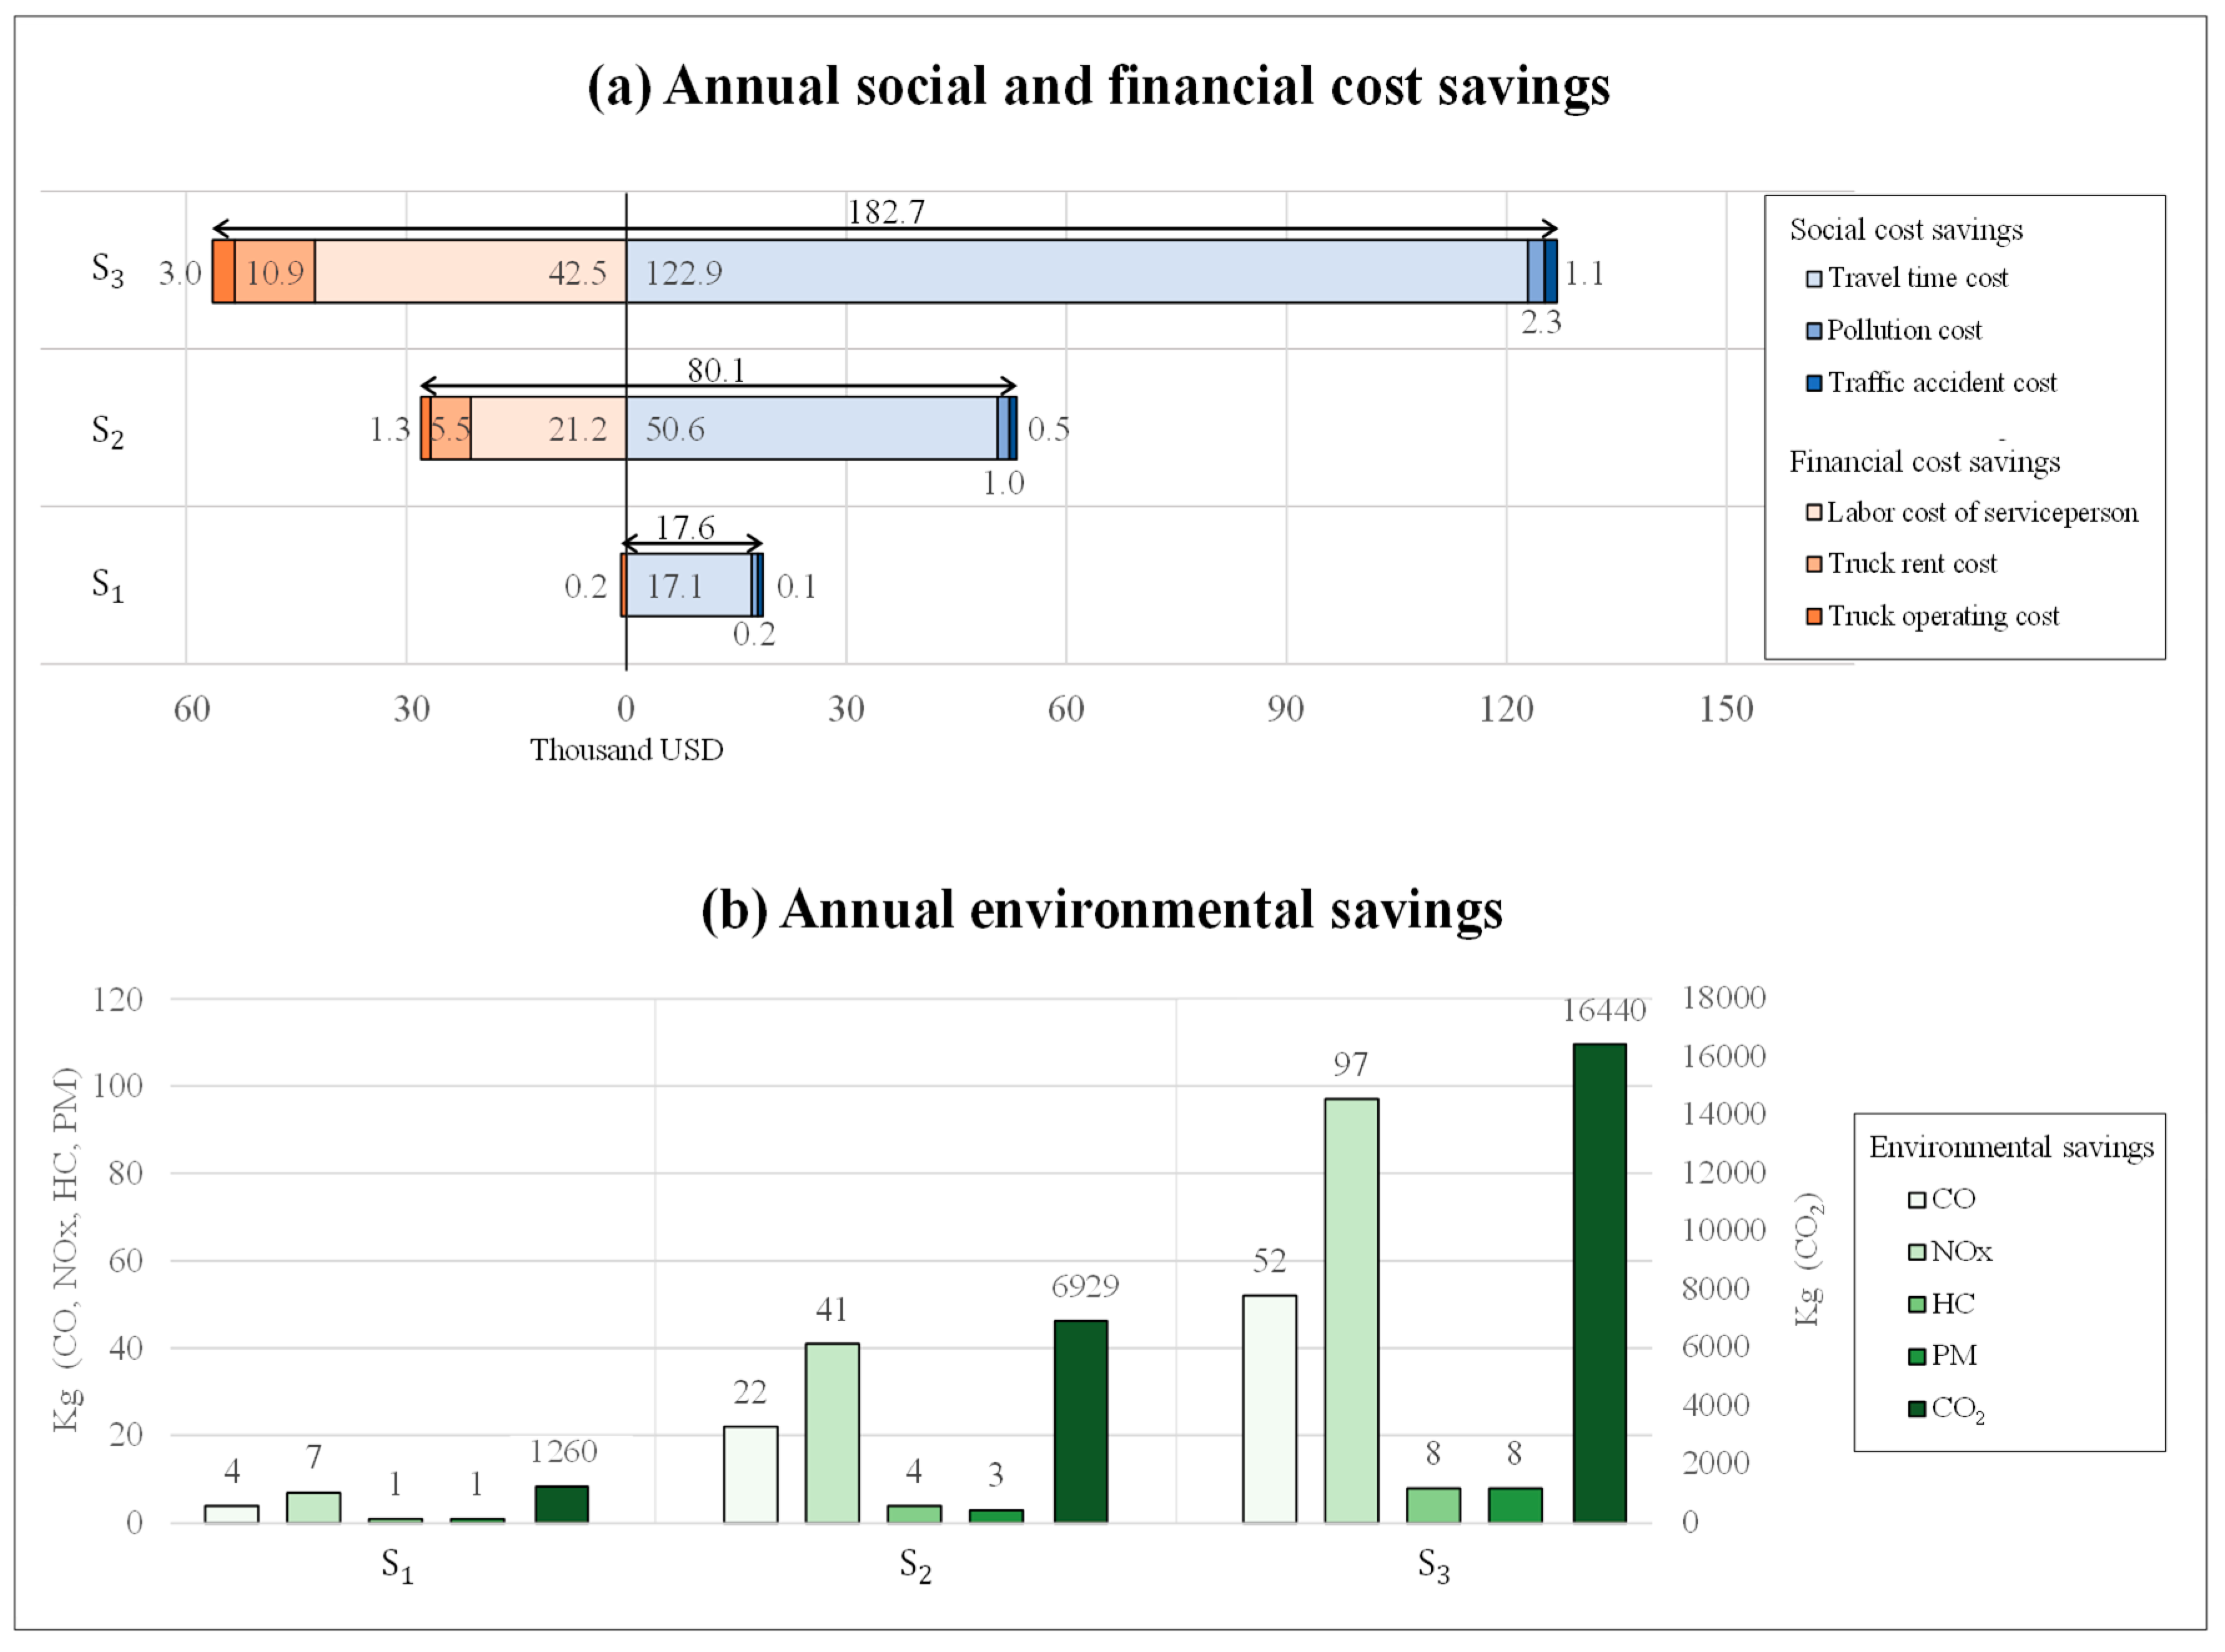
To estimate the social effect of the logistics collaboration in monetary figures, this study uses the unit cost from the Korea Development Institute (KDI). The unit cost of travel time is $17 per hour, estimated by the time-value of truck drivers. The traffic-accident unit cost is $0.03 per kilometer, which is estimated by combining the traffic accident cost and the accident rate per VKT. In estimating the financial savings, logistics companies are assumed to use existing facilities that can afford existing demand; the construction cost for the UCC is assumed to be zero. The labor cost of the service person is set at approximately $18,000 per month. Truck rental and operating costs for delivery are calculated using rental and fuel costs. Truck rental, including insurance expenses, costs $452 per vehicle per month, based on 2013 figures, and fuel costs $0.1 per km according to the KDI. The resulting net savings in social and financial costs are shown in Figure 6a.
Figure 6 shows the estimated environmental savings as a result of logistics collaboration. The adverse impacts of these pollutants have raised public concern, and have resulted in government agencies around the world prioritizing pollution reductions in their policies [52]. The reduction in environmental impact is estimated using the total VKT from the model result and emissions generated from a small-truck traveling 1 km (i.e., 1.3, 2.5, 0.2, 0.2 and 432.4 g respectively for CO, NOx, HC, PM, and CO 2 ) [53]. The weight of each element can be converted into a monetary term by using the unit cost per gram. With a summation of environmental costs ($/kilometer) for five elements, we can calculate the unit cost of emissions that is 0.06$ per kilometer [53]. The result shows that an increasing market share of logistics collaboration leads to a reduction in negative environmental impacts in the case-study area.
Note that the social and financial savings (see Figure 6a) and the reduction in air pollutants (see Figure 6b) are estimated based on statistics from the case-study area. If the logistics collaboration was expanded across the entire municipality of Seoul (see Figure 1a), the impact of logistics collaboration can be expected to yield $3.9 M annually in social cost savings and $1.6 M in financial benefits.

5.2. Discussion and Policy Implications

Truck based last-mile deliveries in urban areas cause adverse impacts in major cities worldwide. Furthermore, intense competition in logistics markets is pushing companies to improve operational efficiency. Our study results show that logistics collaboration can reduce social and financial costs as well as air pollutions in last-mile deliveries. Although we estimate the effects of logistics collaboration focusing on one type of commodities within a single administrative district in Seoul, the expansions to other commodities and regions are expected to have significant effects.
However, the implementation of logistics collaboration remains as a challenge in real-life experience. The Korea International Trade Association (KITA) [18] surveyed 604 logistics companies to investigate their perspectives on logistics collaboration. The result shows that (i) 63.7% of the companies had never heard of the concept of logistics collaboration; (ii) 24% of the companies is not favorable to the necessity of collaboration; (iii) 6.9% was considering collaboration but had not yet adopted collaboration; (iv) only 5.4% had adopted collaboration. The survey result implies that logistics collaboration is not well recognized by logistics companies and does not appear to be an attractive option. The KITA also surveyed companies that are aware of collaboration but do not support implementing it. Respondents provided the following reasons for objecting to collaboration: (i) difficulties in retaining the company’s direct control (23.6%); (ii) difficulties in providing their own service advantages (15.5%); (iii) customer information security (12.7%); (iv) satisfaction with the current system (12.5%); (v) further complexity of the collaboration process (11.2%); (vi) difficulties in finding collaboration partners (5.9%).
Lindawati, van Schagen [8] investigates the factors considered by stakeholders to participate in urban logistics collaboration for Singapore. The survey was conducted by the focus-group discussion with senior industrialists and researchers in logistics industry, and six industry partners from the food, electronics, logistics, and retail sectors. The result shows that the two main factors that affect the participation decision for collaboration are the expected benefit (positive effect from joining in collaboration) and the competitive intelligence risks (the problem of sharing information, possibly resulting in a loss of competitive advantage). Basso, D’Amours [54] found that the cost allocation for collaboration is the most studied practical issue. Furthermore, the study result indicates that trust and the coordination mechanism are significant variables for the implementation of logistics collaboration. The collaboration agreement should be made while guaranteeing the companies autonomy and their enterprise philosophy. Nimtrakool, Gonzalez-Feliu [55] emphasize financial aspects as a primary barrier for logistics collaboration. For the cooperative logistics project, it is difficult to assure viable level of demand and profitability from the collaboration implementation since large companies with enough freight volume might not want to join to collaboration especially for the UCC.
The role of public sector, including central and local governments is essential for logistics collaboration. The urgent action to encourage logistics collaboration is to promote the concept of logistics collaboration and its benefits, and assistance to companies participating in collaboration. For such actions, public sectors must be aware of the resulting benefits and costs for logistics collaboration. By applying the numerical results of this study, a foundation can be laid to encourage forms of collaboration among logistics companies. To support the participation, detailed financial assessment of areas such as collaboration cost and benefit, social cost savings and environmental benefits must be specified. Financial incentives such as tax reductions or subsidies can be determined, followed by social and environmental impact estimation.
Logistics collaboration will take some time to implement in the current logistics system. Furthermore, the process could be a burden for minor logistics companies and shippers if they are required to adopt logistics collaboration without state-based support or incentives. Collaboration requires consolidations, rescheduling, law/regulation revisions and new facilities. Therefore, from a longer-term perspective, it may be necessary for the public sector to establish social enterprises or cooperative associations to facilitate collaboration. These organizations should set up relevant guidelines and laws for collaboration and manage the course of actions. Without such support, collaboration would be impossible. Financial incentives for participating logistics companies, such as tax reduction or subsidies, might also be effective. Since 2010, the Korean government has rewarded environmentally friendly logistics companies. Through the proposed framework, the logistics companies planning to implement logistics collaboration can estimate their expected operational benefit after collaboration. Furthermore, the public sector can employ the developed framework to propose (i) detailed and comprehensive business models, (ii) implementation strategies, (iii) specific assistance plans to encourage logistics collaboration for private logistics companies.

6. Concluding Remarks

This paper estimates the environmental, social and financial effects resulting from the collaboration of six logistics companies (i.e., one major and five minors) using the proposed mixed frameworks of truck routing models and synthetic data surveyed from existing logistics companies in Seoul, Korea. To describe the delivery behavior of the major and minor logistics companies, two frameworks are developed. In the major company model, regional allocation and the VRP are used to demonstrate truck movements, while the destination choice model was used for the minor companies. The models estimate each companies’ total delivery time, distance traveled, number of trucks used for delivery, and social and financial cost savings at various levels of collaboration.
Our study has three important limitations. First, the proposed framework needs further calibration work when being applied into other commodity types or regions. However, the model encompasses multiple commodity types or regions and could therefore sacrifice the explanatory power compared to the model dealing with a single commodity or region. That is because each commodity or region has different market characteristics, delivery patterns, and customer needs. The second limitation is that our analysis omits some intangible factors that might be considered as the impact of logistics collaboration (e.g., congestion externalities, a loss of truck drivers’ job opportunity and/or vibrations from trucks). These intangible factors are hardly possible to convert into monetary terms. Future studies estimating such intangible factors could provide us with further insights about the impact of logistics collaboration. Third, although the proposed model explains the delivery behavior of collaborative and non-collaborative logistics, modeling truck drivers’ heuristic route-choices might need additional modeling efforts because individual truck drivers have different route-choice strategies due to their own experiences. Precise modeling might be unachievable, but an advanced truck routing model can improve our study.
Findings show that both major and minor logistics companies can benefit from logistics collaboration by saving delivery costs and time through economies of scale (see Figure 5 and Figure 6). Both types of savings can be increased by collaborating with other commodities. Note that this study focused solely on pharmaceutical supplies, which is merely one of numerous commodities distributed in the city of Seoul. The results further indicate that logistics collaboration can mitigate negative environmental impacts resulting from urban logistics. In addition to the social and financial perspectives, the environmental benefit is also a primary reason for governments to encourage private logistics companies to implement collaboration. The quantified benefits from the proposed model can contribute to estimate financial incentives including tax reduction or subsidies. Findings from the present study can be further improved by extending the survey to a wider geographical region and to a larger number of logistics companies. Evaluating the transferability of the findings from a sub-region of Seoul to the entire municipality of Seoul is the subject of future study.

Author Contributions

Conceptualization, W.D., D.P.; methodology, W.D., D.P., H.P.; formal analysis, W.D.; writing—original draft preparation, W.D.; writing—review and editing, K.C., D.P.; visualization, K.C., W.D.; supervision, D.P.; funding acquisition, D.P.

Funding

This research was supported by the Basic Science Research Program through the National Research Foundation of Korea (NRF) funded by the Ministry of Science, ICT and Future Planning, grant number NRF-2017R1A2A2A05001395.

Conflicts of Interest

The authors declare no conflict of interest.

References

  1. Boerkamps, J.; Van Binsbergen, A. GoodTrip—A new approach for modelling and evaluation of urban goods distribution. City Logist. I 1999, 175–186. [Google Scholar]
  2. Anand, N.; van Duin, R.; Tavasszy, L. Ontology-based multi-agent system for urban freight transportation. Int. J. Urban Sci. 2014, 18, 133–153. [Google Scholar] [CrossRef]
  3. Teo, J.; Taniguchi, E.; Qureshi, A. Multi-agent systems modelling approach to evaluate urban motorways for city logistics. Int. J. Urban Sci. 2014, 18, 154–165. [Google Scholar] [CrossRef]
  4. Russo, F.; Comi, A. City sustainability and urban freight transport: Environmental evidences from the cities. In Proceedings of the 2011 NUF-4th METRANS National Urban Freight Conference, Long Beach, CA, USA, 12–14 October 2011. [Google Scholar]
  5. Lindholm, M.; Behrends, S. Challenges in urban freight transport planning—A review in the Baltic Sea Region. J. Transp. Geogr. 2012, 22, 129–136. [Google Scholar] [CrossRef]
  6. Dolati Neghabadi, P.; Samuel, K.E.; Espinouse, M.-L. Systematic literature review on city logistics: Overview, classification and analysis. Int. J. Prod. Res. 2018, 1–23. [Google Scholar] [CrossRef]
  7. Nuzzolo, A.; Comi, A.; Rosati, L. City logistics long-term planning: Simulation of shopping mobility and goods restocking and related support systems. Int. J. Urban Sci. 2014, 18, 201–217. [Google Scholar] [CrossRef]
  8. Lindawati; van Schagen, J.; Goh, M.; de Souza, R. Collaboration in urban logistics: Motivations and barriers. Int. J. Urban Sci. 2014, 18, 278–290. [Google Scholar] [CrossRef]
  9. Ergun, Ö.; Kuyzu, G.; Savelsbergh, M. Shipper collaboration. Comput. Oper. Res. 2007, 34, 1551–1560. [Google Scholar] [CrossRef]
  10. Cruijssen, F.; Cools, M.; Dullaert, W. Horizontal cooperation in logistics: Opportunities and impediments. Transp. Res. Part E Logist. Transp. Rev. 2007, 43, 129–142. [Google Scholar] [CrossRef]
  11. Park, D.; Kim, N.S.; Park, H.; Kim, K. Estimating trade-off among logistics cost, CO2 and time: A case study of container transportation systems in Korea. Int. J. Urban Sci. 2012, 16, 85–98. [Google Scholar] [CrossRef]
  12. Allen, G.; Sioutas, C.; Koutrakis, P.; Reiss, R.; Lurmann, F.W.; Roberts, P.T. Evaluation of the TEOM® method for measurement of ambient particulate mass in urban areas. J. Air Waste Manag. Assoc. 1997, 47, 682–689. [Google Scholar] [CrossRef]
  13. Gehring, U.; Gruzieva, O.; Agius, R.M.; Beelen, R.; Custovic, A.; Cyrys, J.; Eeftens, M.; Flexeder, C.; Fuertes, E.; Heinrich, J.; et al. Air pollution exposure and lung function in children: The ESCAPE project. Environ. Health Perspect. 2013, 121, 1357–1364. [Google Scholar] [CrossRef] [PubMed]
  14. Oliveira, L.K.d.; Pereira, L.d.S.F. An estimation of freight flow using secondary data: A case study in Belo Horizonte (Brazil). Int. J. Urban Sci. 2014, 18, 291–307. [Google Scholar] [CrossRef]
  15. Yilmaz, O.; Savasaneril, S. Collaboration among small shippers in a transportation market. Eur. J. Oper. Res. 2012, 218, 408–415. [Google Scholar] [CrossRef]
  16. Zhou, G.; van Hui, Y.; Liang, L. Strategic alliance in freight consolidation. Transp. Res. Part E Logist. Transp. Rev. 2011, 47, 18–29. [Google Scholar] [CrossRef]
  17. Köhler, U. New ideas for the city-logistics project in Kassel. In Logistics Systems for Sustainable Cities, Proceedings of the 3rd International Conference on City Logistics, Madeira, Portugal, 25–27 June 2003; Emerald Group Publishing Limited: Bingley, UK, 2004. [Google Scholar]
  18. KITA. A Survey on Current Status of Third Party and Logistics Collaboration; Korea International Trade Association: Seoul, Korea, 2014. [Google Scholar]
  19. Allen, J.; Browne, M.; Woodburn, A.; Leonardi, J. The role of urban consolidation centres in sustainable freight transport. Transp. Rev. 2012, 32, 473–490. [Google Scholar] [CrossRef]
  20. Montoya-Torres, J.R.; Muñoz-Villamizar, A.; Vega-Mejía, C.A. On the impact of collaborative strategies for goods delivery in city logistics. Prod. Plan. Control 2016, 27, 443–455. [Google Scholar] [CrossRef]
  21. Muñoz-Villamizar, A.; Montoya-Torres, J.R.; Vega-Mejía, C.A. Non-collaborative versus collaborative last-mile delivery in urban systems with stochastic demands. Procedia CIRP 2015, 30, 263–268. [Google Scholar] [CrossRef]
  22. Park, H.; Park, D.; Jeong, I.-J. An effects analysis of logistics collaboration in last-mile networks for CEP delivery services. Transp. Policy 2016, 50, 115–125. [Google Scholar] [CrossRef]
  23. Soysal, M.; Bloemhof-Ruwaard, J.M.; Haijema, R.; van der Vorst, J.G. Modeling a green inventory routing problem for perishable products with horizontal collaboration. Comput. Oper. Res. 2018, 89, 168–182. [Google Scholar] [CrossRef]
  24. Gordon, A. Classification; C&H/CRC Monographs on Statistics & Applied Probability; CRC Press: Boca Raton, FL, USA, 1999. [Google Scholar]
  25. Bramel, J.; Simchi-Levi, D. The Logic of Logistics: Theory, Algorithms, and Applications for Logistics Management; Springer: Berlin/Heidelberg, Germany, 1997. [Google Scholar]
  26. Qureshi, A.G.; Taniguchi, E.; Thompson, R.G.; Teo, J.S. Application of exact route optimization for the evaluation of a city logistics truck ban scheme. Int. J. Urban Sci. 2014, 18, 117–132. [Google Scholar] [CrossRef]
  27. Sungur, I.; Ordónez, F.; Dessouky, M. A robust optimization approach for the capacitated vehicle routing problem with demand uncertainty. IIE Trans. 2008, 40, 509–523. [Google Scholar] [CrossRef] [Green Version]
  28. Kim, S.; Park, D.; Kim, S.; Park, H. Modeling Courier Vehicles’ Travel Behavior: Case of Seoul, South Korea. Transp. Res. Rec. 2014, 2410, 67–75. [Google Scholar] [CrossRef]
  29. Kuppam, A.; Lemp, J.; Beagan, D.; Livshits, V.; Vallabhaneni, L.; Nippani, S. Development of a Tour-Based Truck Travel Demand Model Using Truck GPS Data; The National Academies of Sciences, Engineering, and Medicine: Washington, DC, USA, 2014. [Google Scholar]
  30. Nuzzolo, A.; Comi, A. Urban freight demand forecasting: A mixed quantity/delivery/vehicle-based model. Transp. Res. Part E Logist. Transp. Rev. 2014, 65, 84–98. [Google Scholar] [CrossRef]
  31. Park, H.; Park, D.; Kim, C.; Kim, H.; Park, M. A comparative study on sampling strategies for truck destination choice model: Case of Seoul Metropolitan Area. Can. J. Civ. Eng. 2012, 40, 19–26. [Google Scholar] [CrossRef]
  32. Roca-Riu, M.; Estrada, M. An evaluation of urban consolidation centers through logistics systems analysis in circumstances where companies have equal market shares. Procedia-Soc. Behav. Sci. 2012, 39, 796–806. [Google Scholar] [CrossRef]
  33. Lin, J.; Chen, Q.; Kawamura, K. Sustainability SI: Logistics cost and environmental impact analyses of urban delivery consolidation strategies. Netw. Spat. Econ. 2016, 16, 227–253. [Google Scholar] [CrossRef]
  34. Van Heeswijk, W.; Larsen, R.; Larsen, A. An Urban Consolidation Center in the City of Copenhagen: A Simulation Study; Technical Report; TU Eindhoven, Research School for Operations Management and Logistics (BETA): Eindhoven, The Netherlands, 2017. [Google Scholar]
  35. Dablanc, L.; Giuliano, G.; Holliday, K.; O’Brien, T. Best practices in urban freight management: Lessons from an international survey. Transp. Res. Rec. 2013, 2379, 29–38. [Google Scholar] [CrossRef]
  36. Macharis, C.; Melo, S. City Distribution and Urban Freight Transport: Multiple Perspectives; Edward Elgar Publishing: Bingley, UK, 2011. [Google Scholar]
  37. Wang, X.C.; Zhang, D. Truck freight demand elasticity with respect to tolls in New York State. Transp. Res. Part A Policy Pract. 2017, 101, 51–60. [Google Scholar] [CrossRef]
  38. Brunekreef, B.; Janssen, N.A.; de Hartog, J.; Harssema, H.; Knape, M.; van Vliet, P. Air pollution from truck traffic and lung function in children living near motorways. Epidemiology 1997, 298–303. [Google Scholar] [CrossRef] [PubMed]
  39. Small, K.A.; Kazimi, C. On the costs of air pollution from motor vehicles. J. Transp. Econ. Policy 1995, 7–32. [Google Scholar]
  40. Roorda-Knape, M.C.; Janssen, N.A.; De Hartog, J.J.; Van Vliet, P.H.; Harssema, H.; Brunekreef, B. Air pollution from traffic in city districts near major motorways. Atmos. Environ. 1998, 32, 1921–1930. [Google Scholar] [CrossRef]
  41. Seoul Metropolitan Government. National Symposium for Better Air-Quality of South Korea; Seoul Metropolitan Government: Seoul, Korea, 2017.
  42. OECD. Better Life Index; OECD Publishing: Paris, France, 2017. [Google Scholar]
  43. Statistical Geographic Information Service. 2014. Available online: https://sgis.kostat.go.kr/view/index (accessed on 4 March 2015).
  44. Duque, J.C.; Church, R.L.; Middleton, R.S. The p-Regions Problem. Geogr. Anal. 2011, 43, 104–126. [Google Scholar] [CrossRef]
  45. Cliff, A.D.; Haggett, P.; Ord, J.K.; Bassett, K.A.; Davies, R.; Bassett, K.L. Elements of Spatial Structure: A Quantative Approach; Cambridge University Press: Cambridge, UK, 1975; Volume 6. [Google Scholar]
  46. Keane, M. The size of the region-building problem. Environ. Plan. A 1975, 7, 575–577. [Google Scholar] [CrossRef]
  47. Toth, P.; Vigo, D. Models, relaxations and exact approaches for the capacitated vehicle routing problem. Discret. Appl. Math. 2002, 123, 487–512. [Google Scholar] [CrossRef] [Green Version]
  48. Chang, T.-S.; Yen, H.-M. City-courier routing and scheduling problems. Eur. J. Oper. Res. 2012, 223, 489–498. [Google Scholar] [CrossRef]
  49. Christofides, N. The Vehicle Routing Problem; RAIRO—Operations Research—Recherche Opérationnelle: Paris, France, 1976; Volume 10, pp. 55–70. [Google Scholar]
  50. Gliebe, J.; Cohen, O.; Hunt, J. Dynamic choice model of urban commercial activity patterns of vehicles and people. Transp. Res. Rec. J. Transp. Res. Board 2007, 2003, 17–26. [Google Scholar] [CrossRef]
  51. Hunt, J.D.; Stefan, K. Tour-based microsimulation of urban commercial movements. Transp. Res. Part B Methodol. 2007, 41, 981–1013. [Google Scholar] [CrossRef]
  52. Waddell, P. UrbanSim: Modeling urban development for land use, transportation, and environmental planning. J. Am. Plan. Assoc. 2002, 68, 297–314. [Google Scholar] [CrossRef]
  53. Korea-Development-Institute. A Study on Standard Guidelines for Pre-Feasibility Study on Road and Railway Projects; KDI Public & Private Infrastructure Investment Management Center Seoul: Seoul, Korea, 2008. [Google Scholar]
  54. Basso, F.; D’Amours, S.; Rönnqvist, M.; Weintraub, A. A survey on obstacles and difficulties of practical implementation of horizontal collaboration in logistics. Int. Trans. Oper. Res. 2019, 26, 775–793. [Google Scholar] [CrossRef]
  55. Nimtrakool, K.; Gonzalez-Feliu, J.; Capo, C. Barriers to the adoption of an urban logistics collaboration process: A case study of the Saint—Etienne urban consolidation centre. City Logist. 2 Modeling Plan. Initiat. 2018, 313–332. [Google Scholar]
Figure 1. (a) a map of Seoul and the case-study area; (b) zoning in the case-study area; (c) population distribution in the case-study area; (d) distribution of pharmaceutical supplies in the case-study area.
Sustainability 11 02442 g001
Figure 2. Existing delivery strategies of the major (a) and minor (b) logistics companies.
Sustainability 11 02442 g002
Figure 3. Truck routing models for (a) major company; (b) minor company.
Sustainability 11 02442 g003
Figure 4. Results of regional allocation with demand of major, minor, and collaboration entity: (a) baseline scenario, (b) scenario 1, (c) scenario 2, and (d) scenario 3.
Sustainability 11 02442 g004
Figure 5. (a) annual travel distance; (b) annual travel time; (c) number of trucks for delivery under various levels of collaboration.
Sustainability 11 02442 g005
Figure 6. (a) Annual social and financial cost savings, (b) annual environmental savings.
Sustainability 11 02442 g006
Table 1. Regional allocation results under the different collaboration level.
ScenarioClassificationAllocated RegionSumMarket Share
A k B k C k D k E k F k
Baseline Scenario, S0No. of boxes235245223---70350%
No. of zones421425---81
Scenario 1, S1No. of boxes185 219 218 222 --84460%
No. of zones33121521--81
Scenario 2, S2No. of boxes207 245 211 238 224 -112580%
No. of zones281072016-81
Scenario 3, S3No. of boxes238 237 187 248 247 249 1406100%
No. of zones2271013151481
Table 2. Parameters for the destination choice model.
ClassificationDefinitionCoefficientt-Statistic
Next destination choiceDistance from current location to next destination −0.00246−5.3721
The freight demand available to deliver to next destination0.0484107.6832
Table 3. Binary logit model for next trip purpose.
ClassificationDefinitionCoefficientt-Statistic
DeliverAlternative specific constant4.853127.4568
ReturnThe distance from current location to origin−0.009123−2.1934
The cumulative distance up to the current location0.0031325.0546