Competition and Sustainability Development of a Multi-Airport Region: A Case Study of the Guangdong–Hong Kong–Macao Greater Bay Area


Abstract
1. Introduction
2. Materials and Methods
2.1. Measuring the Levels of Competition
2.1.1. Market Competition Index
2.1.2. Market Concentration Index
2.2. Functional Differentiation of Airports
- = the natural log of the ratio of passengers on air route to or from airports and in 2017;
- = the natural log of the ratio of average fares on air route to or from airports and in 2017;
- = the natural log of the ratio of flights on air route to or from airports and in 2017;
- = the natural log of the ratio of on air route to or from airports and in 2017;
- = the natural log of the ratio of airport access time to flight time on air route to or from airports and , where airport access time is measured as the car driving time from the GBA-MAR center to airport or airport , which was extracted from the “OpenStreetMap” on the first Monday in December 2017;
- = indicator variable coded “1” if air route is a domestic short-haul route;
- = indicator variable coded “1” if air route is a domestic long-haul route;
- = indicator variable coded “1” if air route is an international short-haul route; and
- = indicator variable coded “1” if air route is an international long-haul route.
2.3. Data Processing
2.3.1. Official Aviation Guide (OAG) Flight Schedule
2.3.2. Marketing Information Data (MIDT)
3. The Supply Perspective: The Levels of Competition
3.1. Overlapping Air Transport Markets in the GBA-MAR
3.2. Airline Competition in Overlapping Markets
3.3. Spatial Competition
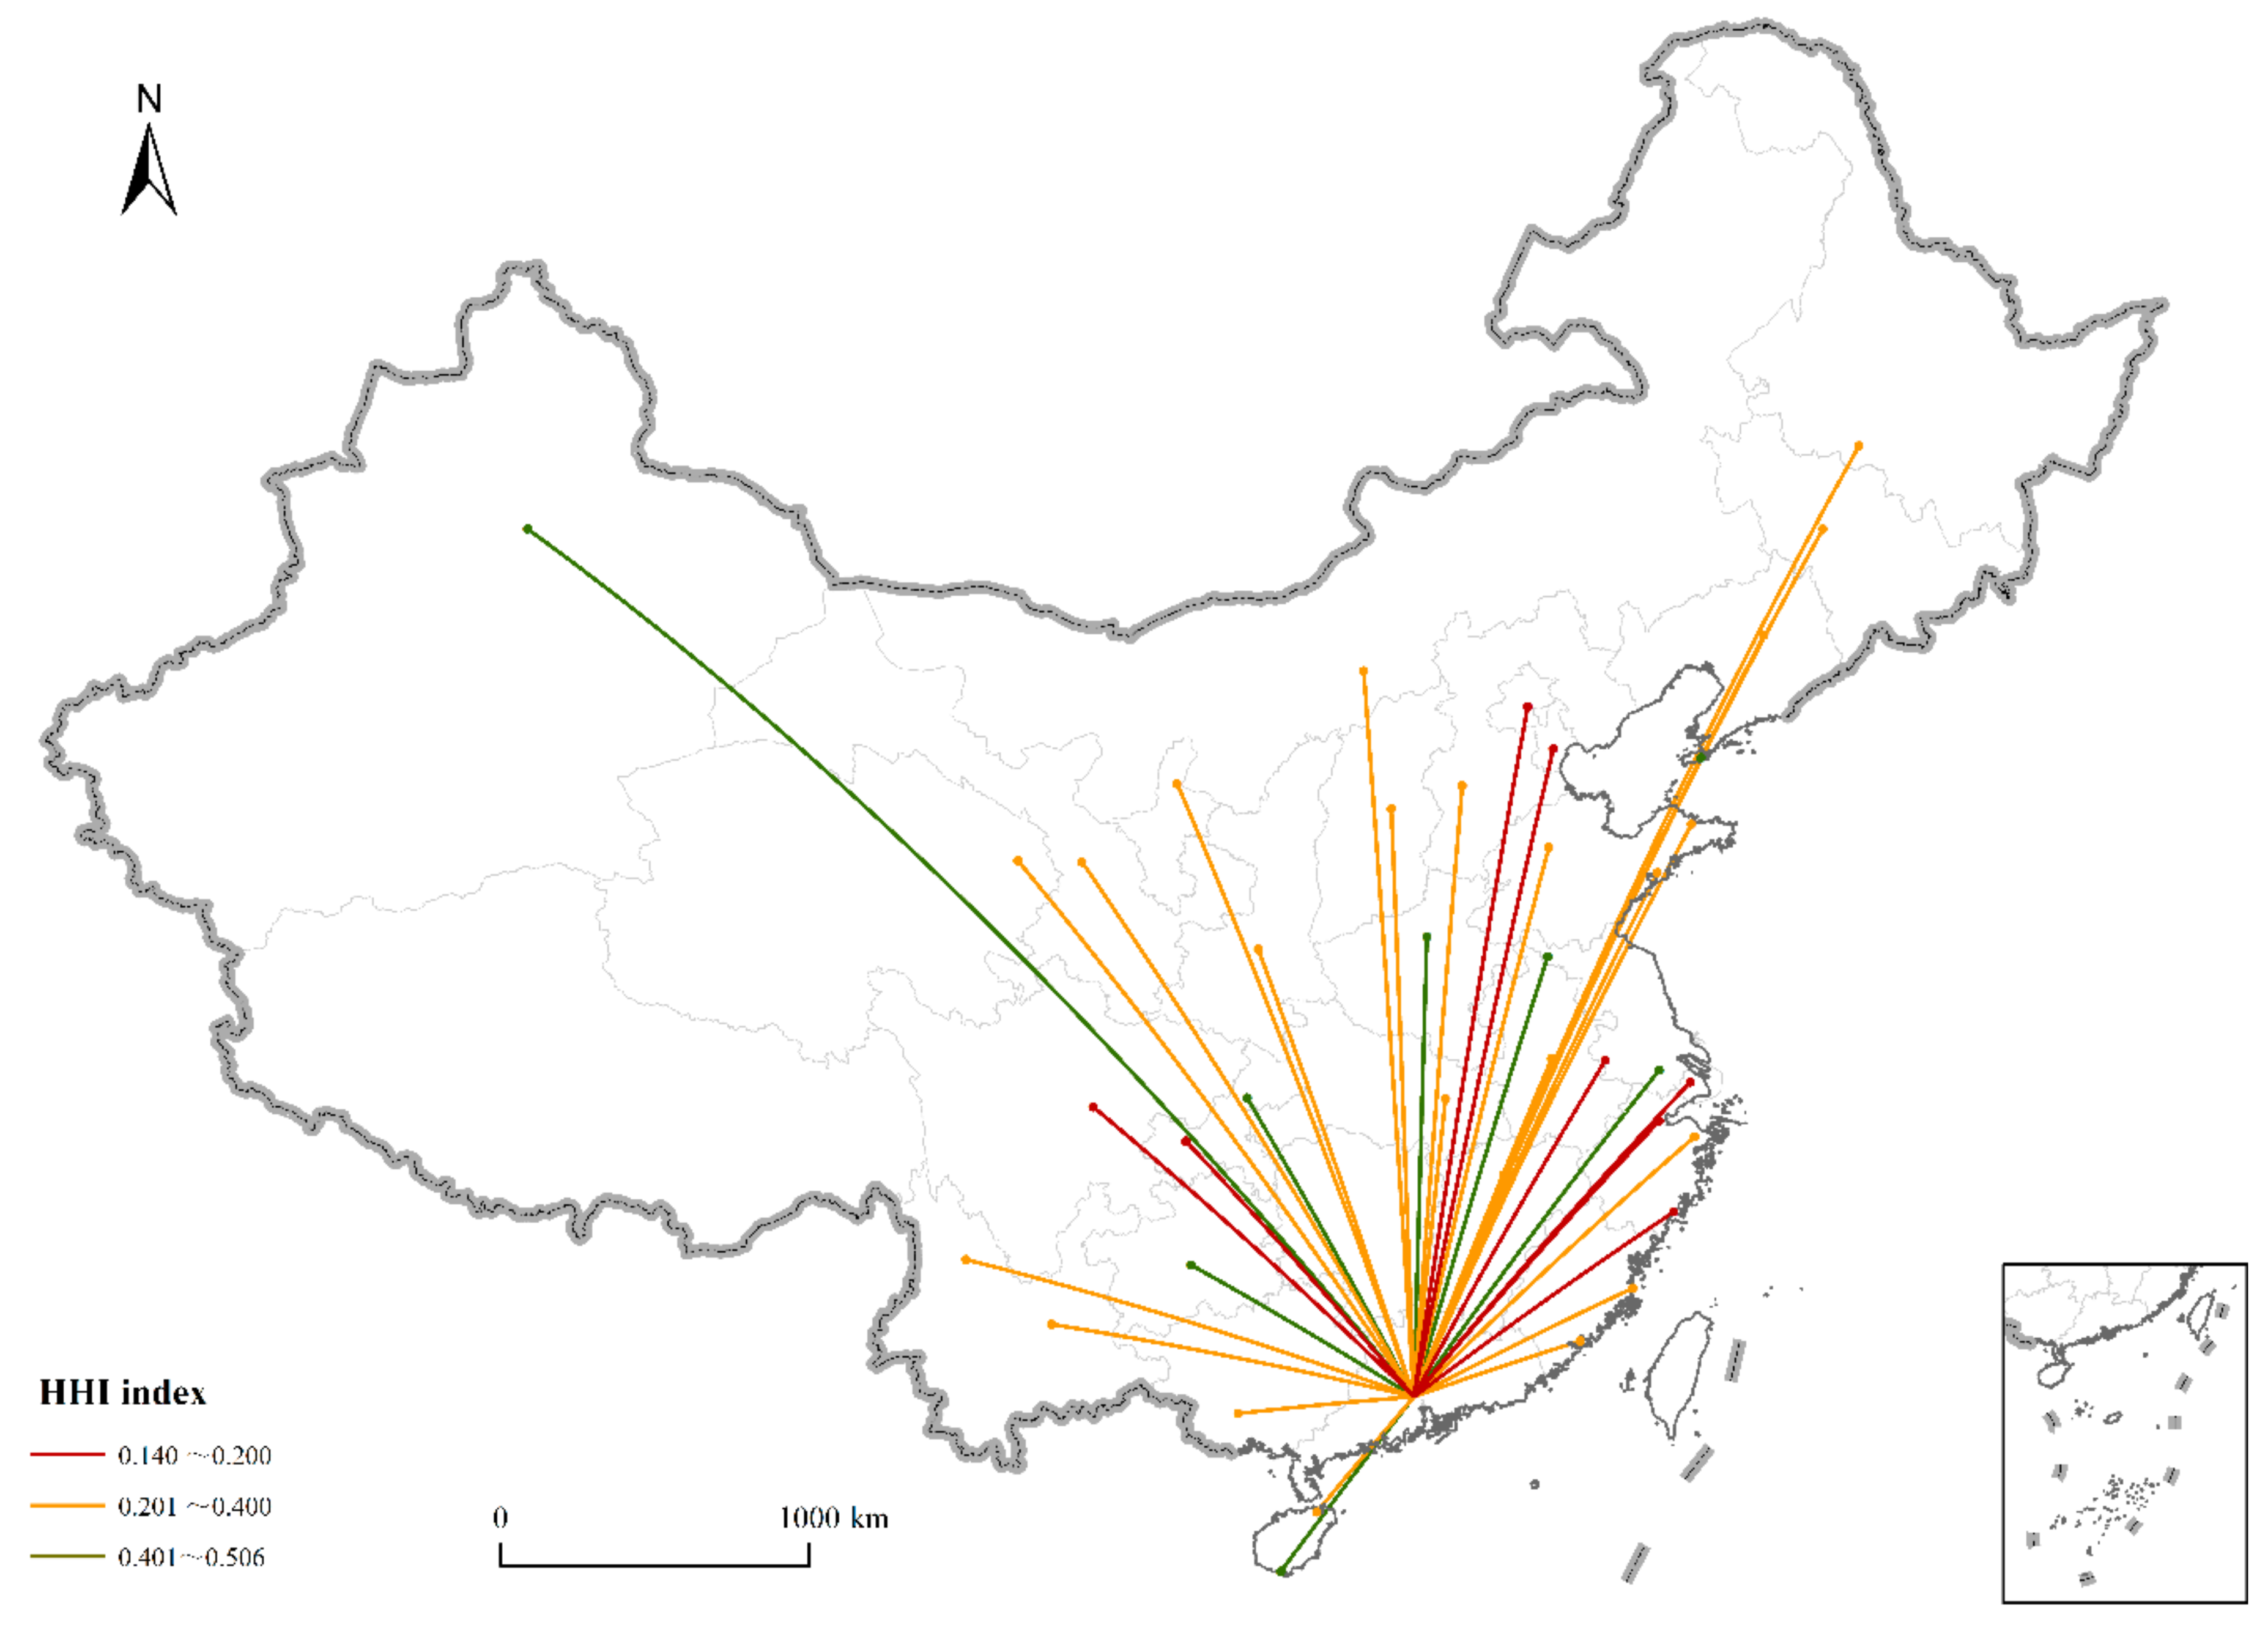
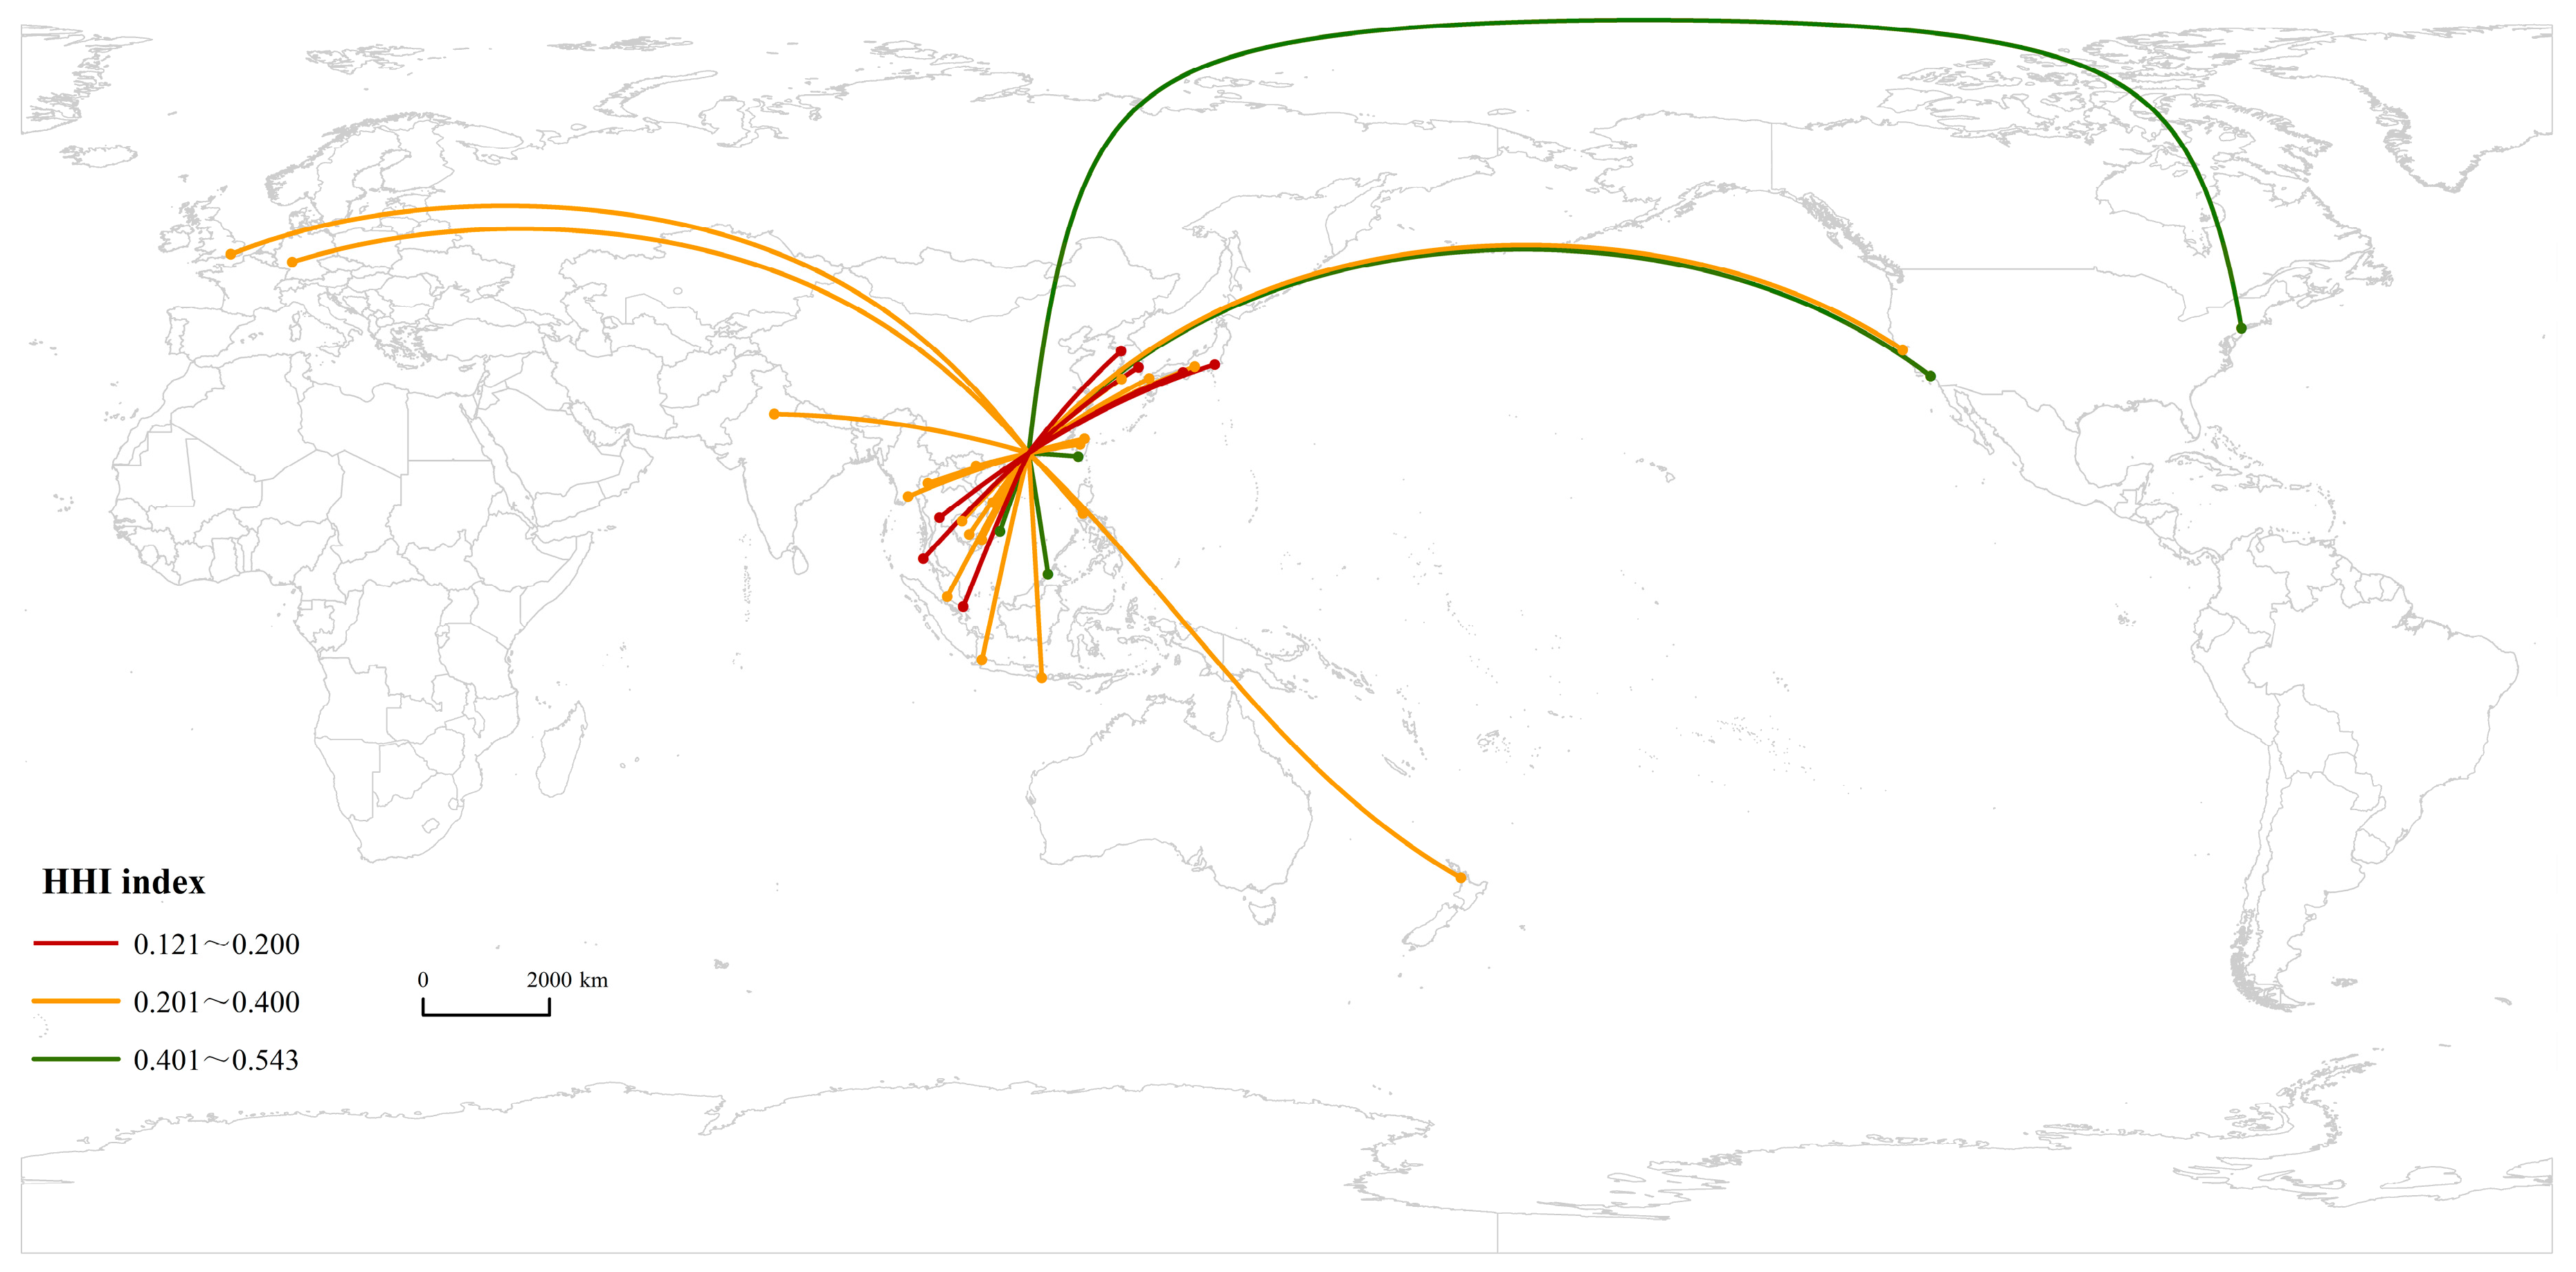
3.3.1. According to Region
3.3.2. According to Route
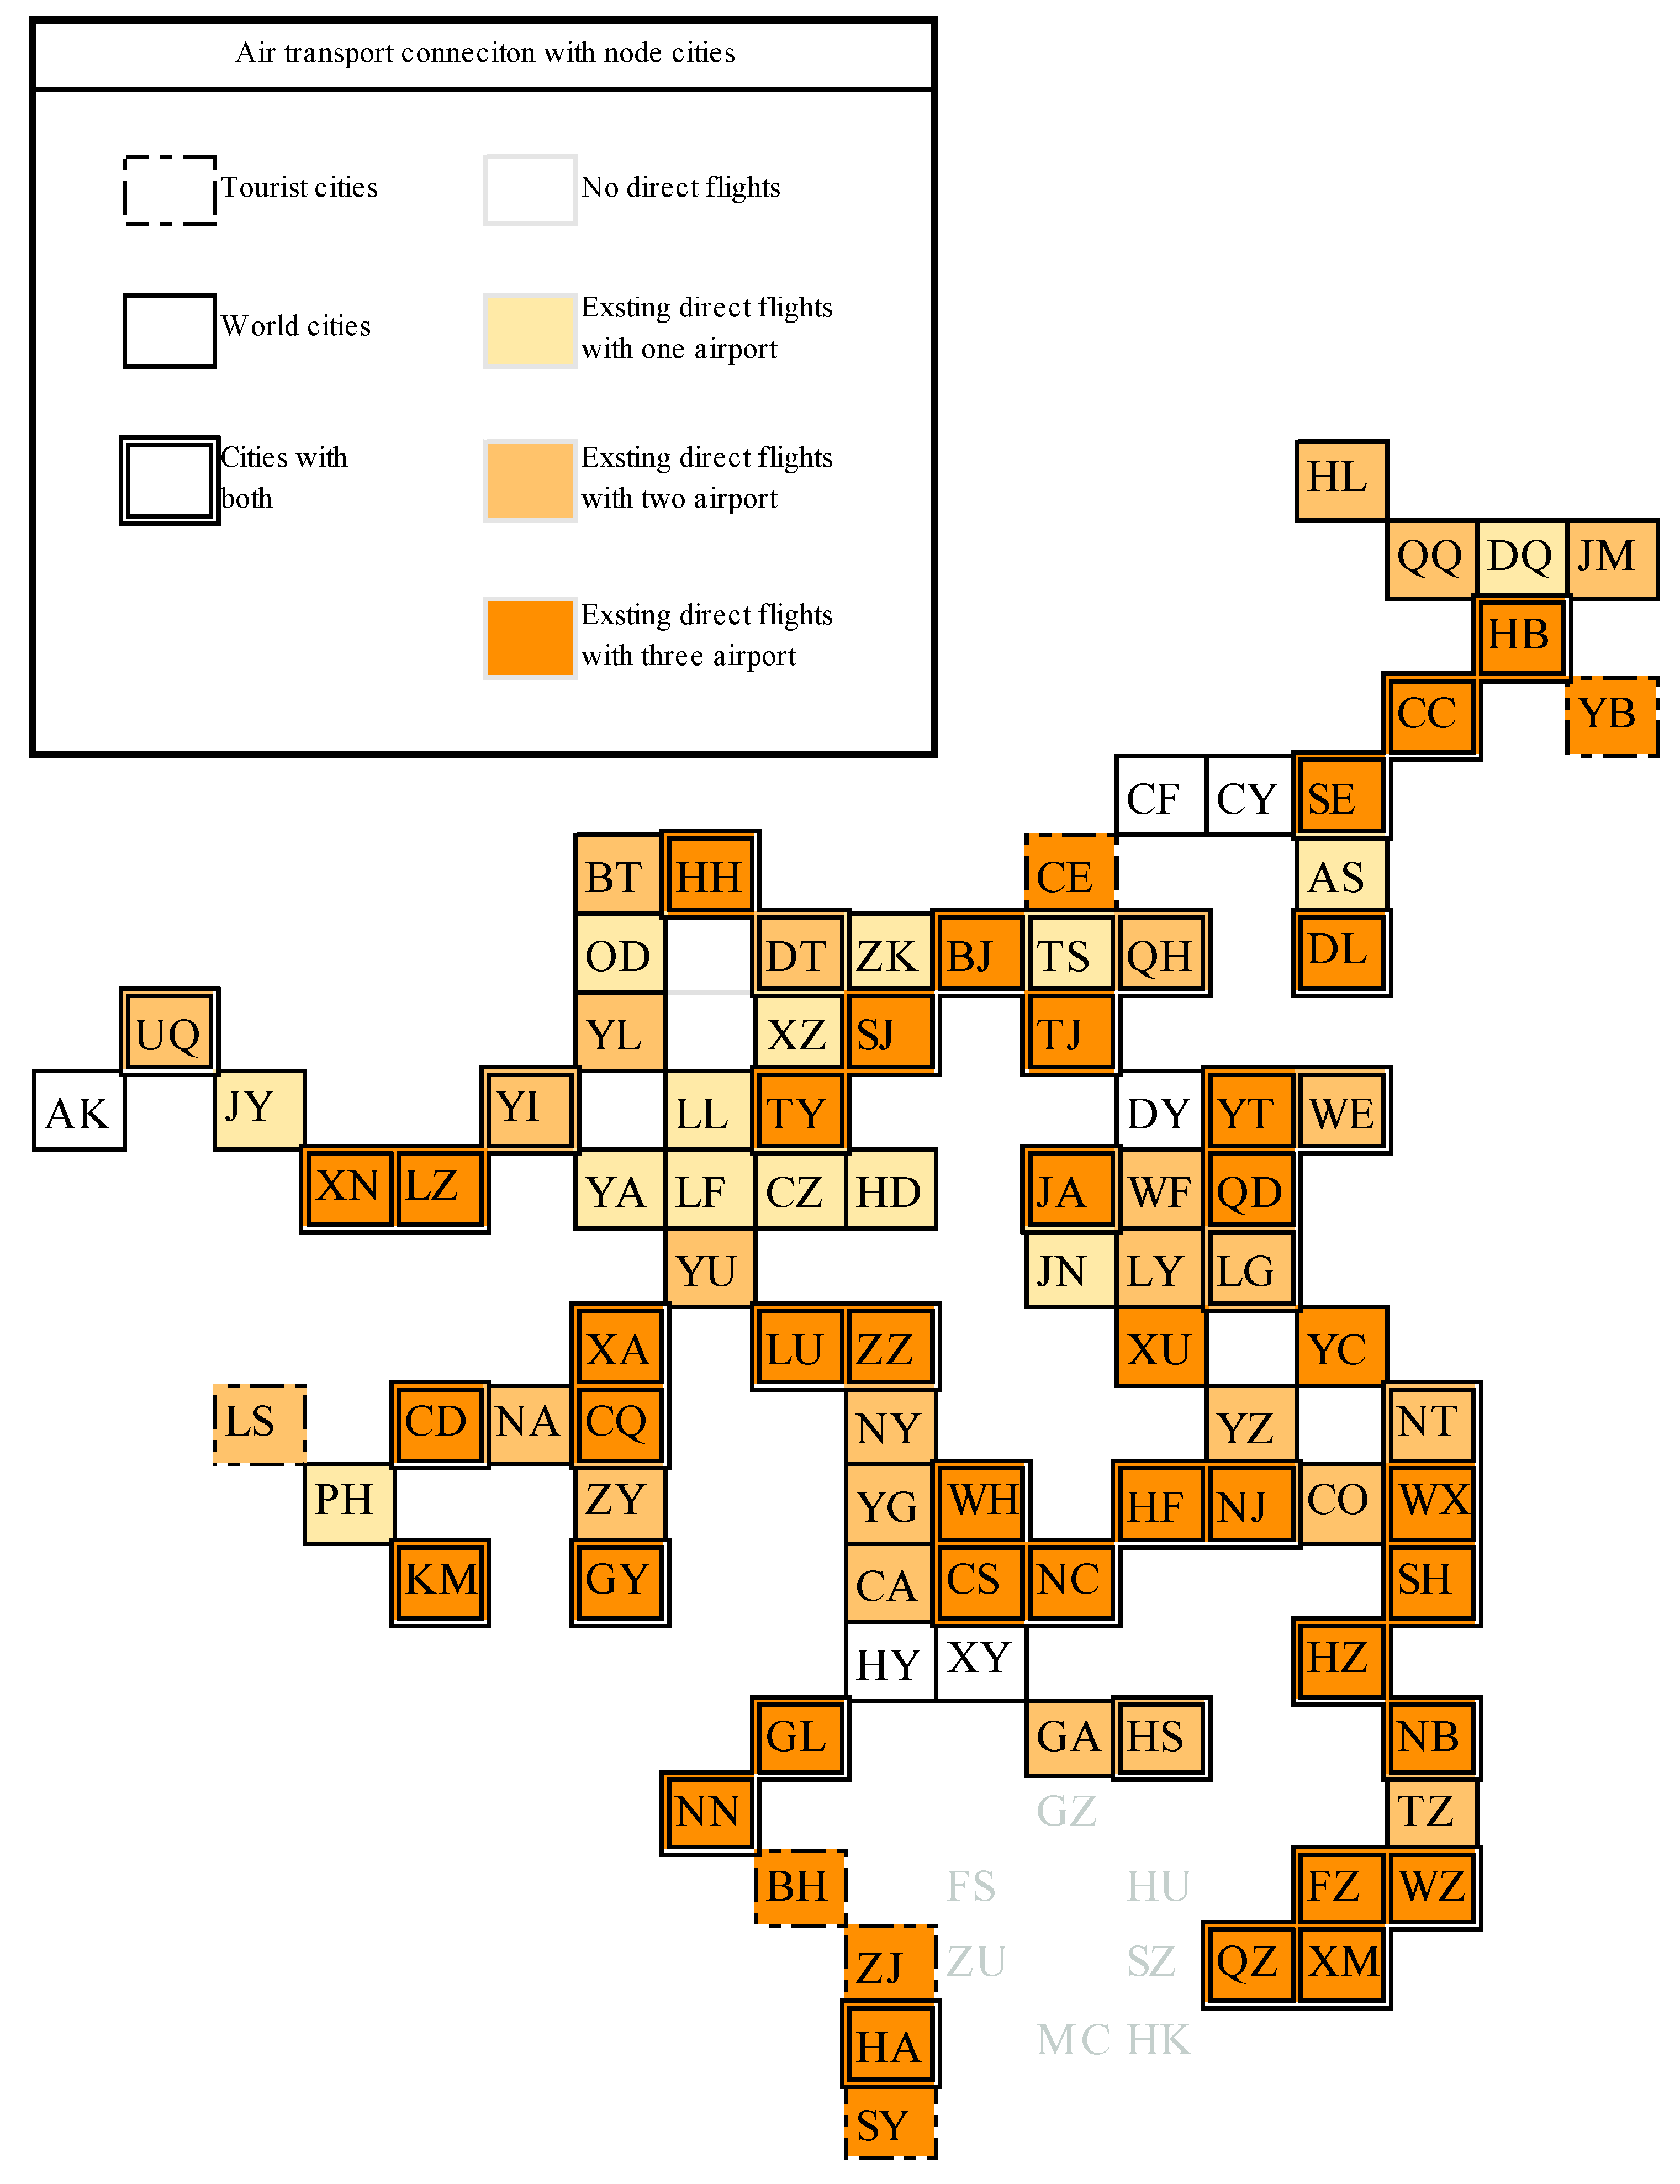
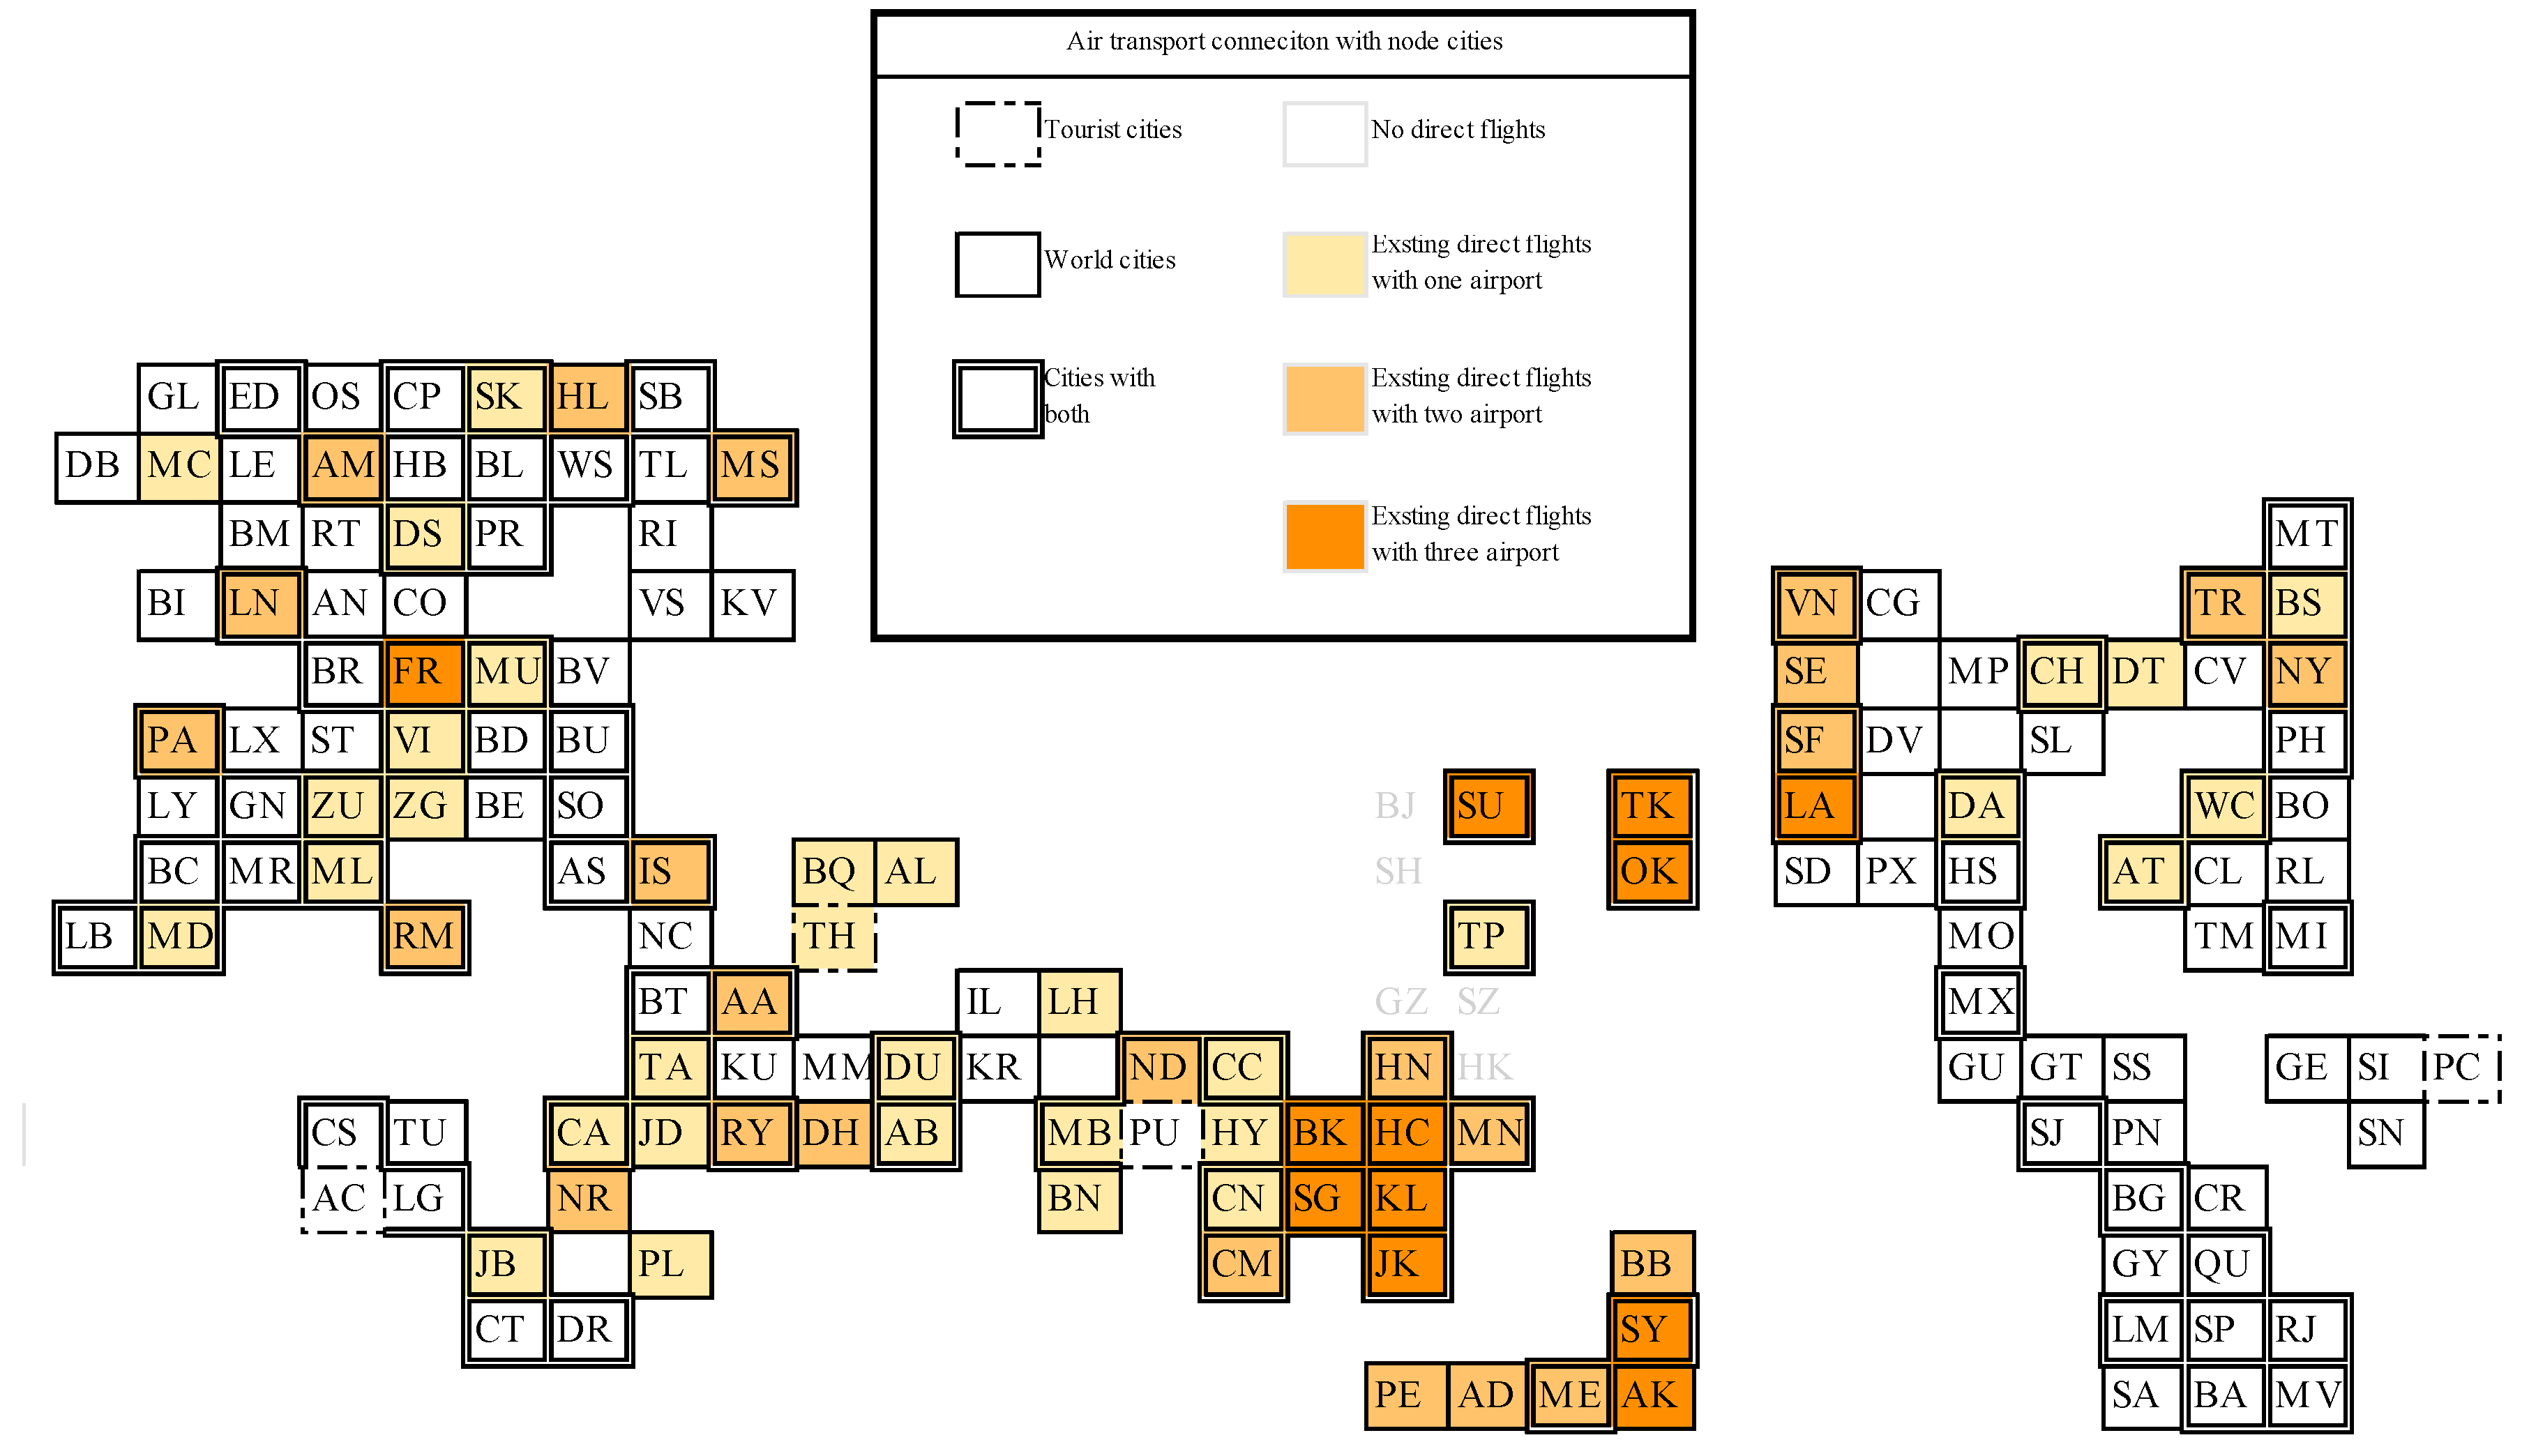
3.3.3. According to Nodal Cities
4. The Demand Perspective: The Functional Differentiation of Airports
5. Discussion and Avenues for Further Research
- Most of the air transport markets are operated simultaneously by these three airports, which obviously improves the competition level. Meanwhile, among the three airports in the MAR, CAN is the dominant one in the domestic market, and HKG is the dominant one in the international market. This has been recognized by passengers and significantly influences their choices regarding SZX;
- When it comes to spatial competition, for the tripoly airport operation market, the Northeast and East Coastal region and the Asia-Pacific region are retrospectively the biggest markets for domestic air transport and international air transport in the GBA-MAR. Competition still affects only a limited number of air routes in these two regions. Moreover, as a significant factor in passenger choice, competition is an important topic for CAN in the future, especially compared to HKG;
- Looking at connections between the GAB-MAR and major urban cities or tourist destinations, we found that the air transport network has been relatively perfect, while the international air transport market of the MAR is still left with a lot of room. The main competition in the future will most probably come from the international market. Meanwhile, with newly built or expanded airports in Aksu, Chaoyang, Chengde, Chifeng, Dongying, Hengyang, and Xiangyang, future airport construction plans may stimulate more competition.
- For the domestic market, Datong, Huangshan, Lianyungang, Nantong, Qinhuangdao, Weihai, Urumqi, and Yinchuan are destinations with low competition but important positions in the air transport network: They can be nodal cities in improving domestic air transport networks. Besides, since there are limits for low-cost airlines, the airlines established as the result of cooperation between big airlines and local governments may be more likely ways to improve competition in CAN and SZX than low-cost airlines in domestic markets because of government policies;
- Meanwhile, for international markets, we should break the predicament of relying on a few airports as transfer hubs and expand the reachable boundaries of the direct air routes of the GBA-MAR. Developing long-haul routes to European and American cities can be a way to solve competition concentrated only in the Asia-Pacific region. This is more important for SZX because of the “Framework Agreement on Strategic Cooperation for Promoting the High-Quality Development of Guangdong Civil Aviation”, which was published by the Civil Aviation Administration of China (CAAC). Besides, combined with the “Belt and Road”, the Middle East should also be included in the future development of the GBA-MAR.
Author Contributions
Funding
Acknowledgments
Conflicts of Interest
Appendix A

| Name | Code | Name | Code | Name | Code | Name | Code |
|---|---|---|---|---|---|---|---|
| Aksu | AK | Haikou | HA | Nanchang | NC | Weihai | WE |
| Anshan | AS | Hailar | HL | Nanchong | NA | Wenzhou | WZ |
| Baotou | BT | Handan | HD | Nanjing | NJ | Wuhan | WH |
| Beihai | BH | Hangzhou | HZ | Nanning | NN | WuXi | WX |
| Beijing | BJ | Harbin | HB | Nantong | NT | Xiamen | XM |
| Changchun | CC | Hefei | HF | Nanyang | NY | Xi’an | XA |
| Changde | CA | Hengyang | HY | Ningbo | NB | Xiangyang | XY |
| Changsha | CS | Hohhot | HH | Ordos | OD | Xining | XN |
| Changzhi | CZ | Hong Kong | HK | Panzhihua | PH | Xinzhou | XZ |
| Changzhou | CO | Huangshan | HS | Qingdao | QD | Xuzhou | XU |
| Chaoyang | CY | Huizhou | HU | Qinhuangdao | QH | Yan’an | YA |
| Chengdu | CD | Jiamusi | JM | Qiqihar | Yanbian | YB | |
| Chifeng | CF | Jiayuguang | JY | Quanzhou | QZ | Yancheng | YC |
| Chongqing | CQ | Jinan | JA | Sanya | SY | Yangzhou | YZ |
| Dalian | DL | Jining | JN | Shanghai | SH | Yantai | YT |
| Daqing | DQ | Kunming | KM | Shenyang | SE | Yichang | YG |
| Datong | DT | Lanzhou | LZ | Shenzhen | SZ | Yinchuang | YI |
| Dongying | DY | Lasa | LS | Shijiazhuang | SJ | Yulin | YL |
| Foshan | FS | Lianyungang | LG | Taiyuan | TY | Yuncheng | YU |
| Fuzhou | FZ | Linfen | LF | Taizhou | TZ | Zhangjiakou | ZK |
| Ganzhou | GA | Linyi | LY | Tangshan | TS | Zhanjiang | ZJ |
| Guangzhou | GZ | Luliang | LL | Tianjin | TJ | Zhengzhou | ZZ |
| Guilin | GL | Luoyang | LU | Urumqi | UQ | Zhuhai | ZU |
| Guiyang | GY | Macau | MC | Weifang | WF | Zunyi | ZY |
Appendix B
| Name | Code | Name | Code | Name | Code | Name | Code |
|---|---|---|---|---|---|---|---|
| Amman | AA | Cologne | CO | Lima | LM | Riga | RI |
| Abu Dhabi | AB | Cape Town | CT | London | LN | St Petersburg | SB |
| Adelaide | AD | Dallas | DA | Mumbai | MB | San Francisco | SF |
| Almaty | AL | Dublin | DB | Luxembourg | LX | Singapore | SG |
| Amsterdam | AM | Denver | DV | Lyon | LY | Rotterdam | RT |
| Athens | AS | Detroit | DT | Madrid | MD | San Diego | SD |
| Antwerp | AN | Doha | DH | Manama | MM | San Jose | SJ |
| Atlanta | AT | Durban | DR | Manchester | MC | Stockholm | SK |
| Buenos Aires | BA | Düsseldorf | DS | Melbourne | ME | San Juan | SN |
| Auckland | AK | Dubai | DU | Marseille | MR | San Salvador | SS |
| Baku | BQ | Edinburgh | ED | Miami | MI | Santiago | SA |
| Baltimore | BO | Frankfurt | FR | Milan | ML | Santo Domingo | SI |
| Barcelona | BC | Geneva | GN | Manila | MN | Sofia | SO |
| Budapest | BD | Hamburg | HB | Moscow | MS | Seattle | SE |
| Bogota | BG | Georgetown | GE | Minneapolis | MP | Sao Paulo | SP |
| Bangkok | BK | Glasgow | GL | Monterrey | MO | Seoul | SU |
| Belgrade | BE | Guadalajara | GU | Montreal | MT | Sydney | SY |
| Berlin | BL | Guatemala | GT | Munich | MU | Tel Aviv-Yafo | TA |
| Birmingham | BM | Guayaquil | GY | Montevideo | MV | St. Louis | SL |
| Bangalore | BN | Ho Chi Minh City | HC | Mexico City | MX | Tokyo | TK |
| Brussels | BR | Hanoi | HN | New Delhi | ND | Stuttgart | ST |
| Bratislava | BV | Helsinki | HL | Nairobi | NR | Taipei | TP |
| Brisbane | BB | Houston | HS | New York | NY | Toronto | TR |
| Bristol | BI | Istanbul | IS | Osaka | OK | Tallinn | TL |
| Boston | BS | Hyderabad | HY | Nicosia | NC | Tampa | TM |
| Beirut | BT | Islamabad | IL | Paris | PA | Vienna | VI |
| Bucharest | BU | Johannesburg | JB | Oslo | OS | Vancouver | VN |
| Cairo | CA | Jakarta | JK | Panama City | PN | Washington | WC |
| Calcutta | CC | Jeddah | JD | Philadelphia | PH | Warsaw | WS |
| Chicago | CH | Kuala Lumpur | KL | Perth | PE | Tunis | TU |
| Calgary | CG | Karachi | KR | Prague | PR | Zurich | ZU |
| Colombo | CM | Kiev | KV | Phoenix | PX | Accra | AC |
| Caracas | CR | Los Angeles | LA | Port Moresby | PL | Vilnius | VS |
| Chennai | CN | Kuwait City | KU | Quito | QU | Pune | PU |
| Charlotte | CL | Lisbon | LB | Rio Janeiro | RJ | Punta Cana | PC |
| Copenhagen | CP | Lahore | LH | Rome | RM | Zagreb | ZG |
| Casablanca | CS | Leeds (North Carolina) | LE | Riyadh | RY | Tehran | TH |
| Cleveland | CV | Lagos | LG | Raleigh | RL |
Appendix C
| Variable | Description |
|---|---|
| Air route | |
| Service airline | |
| Set of airlines in the GBA-MAR | |
| Dichotomous variable that takes “1” when the airline operates any flight on air route out of the three major airports in the GBA-MAR, and otherwise, it takes “0” | |
| The number of airlines operating on air route | |
| The Herfindahl–Hirschman Index () of air route | |
| Total flight volume on air route | |
| Flight volume of airline on air route | |
| Market share of airline on air route within the three major airports in the GBA-MAR | |
| Independent variable, the natural log of the ratio of passengers on air route to or from airports and | |
| Natural log of the ratio of flights on air route to or from airports and | |
| Natural log of the ratio of average fares on air route to or from airports and | |
| Natural log of the ratio of airport access time to flight time on air route to or from airports and , and the airport access time is measured as the car driving time from the regional center to airports or | |
| Natural log of the ratio of the on air route to or from airports and | |
| Dummy variable for air route for a domestic long-haul route type, coded “1” if air route is a domestic long-haul route | |
| Dummy variable for air route for an international long-haul route type, coded “1” if air route is an international long-haul route | |
| Dummy variable for air route for a domestic short-haul route type, coded “1” if air route is a domestic short-haul route | |
| Dummy variable for air route for an international short-haul route type, coded “1” if air route is an international short-haul route |
References
- De Neufville, R. Management of multi-airport systems: A development strategy. J. Air Transp. Manag. 1995, 2, 99–110. [Google Scholar] [CrossRef]
- Bonnefoy, P.A.; De Neufville, R.; Hansman, R.J. Evolution and Development of Multi-Airport Systems: A Worldwide Perspective. J. Transp. Eng. 2010, 136, 1021–1029. [Google Scholar] [CrossRef]
- Fasone, V.; Giuffrè, T.; Maggiore, P. Multi-airport system as a way of sustainability for airport development: Evidence from an Italian case study. Procedia-Soc. Behav. Sci. 2012, 53, 96–105. [Google Scholar] [CrossRef]
- Wang, J.E.; Mo, H.H.; Jin, F.J. Spatial pattern of the worldwide airports and its enlightenment. World Reg. Stud. 2008, 17, 8–18. [Google Scholar]
- O’Connor, K.; Fuellhart, K. Airports and regional air transport markets: A new perspective. J. Transp. Geogr. 2016, 53, 78–82. [Google Scholar] [CrossRef]
- Zhang, L.; Gao, C.; Hu, H.Q. Comparison and suggestions on the coordinated development of three biggest airport groups and city groups of China. Compr. Transp. 2015, 9, 4–10. [Google Scholar]
- Loo, B.P.Y. Passengers’ airport choice within multi-airport regions (MARs): Some insights from a stated preference survey at Hong Kong International Airport. J. Transp. Geogr. 2008, 16, 117–125. [Google Scholar] [CrossRef]
- Loo, B.P.Y.; Ho, H.W.; Wong, S.C. An application of the continuous equilibrium modelling approach in understanding the geography of air passenger flows in a multi-airport region. Appl. Geogr. 2005, 25, 169–199. [Google Scholar] [CrossRef]
- Bonnefoy, P.A.; Hansman, R.J. Scalability of the Air Transportation System and Development of Multi-Airport Systems: A Worldwide Perspectiv; MIT International Center for Air Transportation (ICAT): Cambridge, MA, USA, 2008; pp. 72–75. [Google Scholar]
- Taaffe, J. A map analysis of United States airline competition. J. Air Low Commer. 1958, 25, 121–147. [Google Scholar]
- McHardy, J.; Trotter, S. Competition and deregulation: Do air passengers get the benefits? Transp. Res. Part A Policy Pract. 2006, 40, 74–93. [Google Scholar] [CrossRef]
- Goetz, A.R.; Vowles, T. The good, the bad and the ugly: 30 years of US airline deregulation. J. Transp. Geogr. 2009, 17, 259–263. [Google Scholar] [CrossRef]
- Alderighi, M.; Cento, A.; Nijkamp, P.; Rietveld, P. Competition in the European aviation market: The entry of low-cost airlines. J. Transp. Geogr. 2012, 24, 223–233. [Google Scholar] [CrossRef]
- Frédéric, D.; Graham, A. Air transport liberalisation and airline network dynamics: Investigating the complex relationships. J. Transp. Geogr. 2016, 50, 1–3. [Google Scholar]
- Tracey, P.; Clark, G.L. Alliances, Networks and Competitive Strategy: Rethinking Clusters of Innovation. Growth Chang. 2010, 34, 1–16. [Google Scholar] [CrossRef]
- Dobruszkes, F.; Lennert, M.; Hamme, G.V. An analysis of the determinants of air traffic volume for European metropolitan areas. J. Transp. Geogr. 2011, 19, 755–762. [Google Scholar] [CrossRef]
- Bubalo, B.; Gaggero, A.A. Low-cost carrier competition and airline service quality in Europe. Transp. Policy 2015, 43, 23–31. [Google Scholar] [CrossRef]
- Alderighi, M.; Cento, A.; Nijkamp, P.; Rietveld, P. Assessment of New Hub-and-Spoke and Point-to-Point Airline Network Configurations. Transp. Rev. 2007, 27, 529–549. [Google Scholar] [CrossRef]
- Xu, Z.W.; Harriss, R. Exploring the structure of the U.S. intercity passenger air transportation network: A weighted complex network approach. GeoJournal 2008, 73, 87–102. [Google Scholar] [CrossRef]
- Burghouwt, G.; De Wit, J.; Veldhuis, J.; Matsumoto, H. Air network performance and hub competitive position: Evaluation of primary airports in East and South-East Asia. Airpt. Manag. 2009, 4, 384–400. [Google Scholar]
- Bryan, D.L.; O’Kelly, M.E. Hub-and-Spoke Networks in Air Transportation: An Analytical Review. J. Reg. Sci. 2010, 39, 275–295. [Google Scholar] [CrossRef]
- Burghouwt, G.; Redondi, R. Connectivity in air transport networks: An assessment of models and applications. J. Transp. Econ. Policy 2013, 47, 35–53. [Google Scholar]
- Zanin, M.; Lillo, F. Modelling the air transport with complex networks: A short review. Eur. Phys. J. Spec. Top. 2013, 215, 5–21. [Google Scholar] [CrossRef]
- O’Kelly, M.E. Global Airline Networks: Comparative Nodal Access Measures. Spat. Econ. Anal. 2016, 11, 253–275. [Google Scholar] [CrossRef]
- Van Geenhuizen, M.; Reggiani, A.; Rietveld, P. Policy Analysis of Transport Networks, 1st ed.; Ashgate: Aldershot, UK, 2007; pp. 235–256. [Google Scholar]
- Dobruszkes, F. Does liberalisation of air transport imply increasing competition? Lessons from the European case. Transp. Policy 2009, 16, 29–39. [Google Scholar] [CrossRef]
- Harvey, G. Airport choice in a multiple airport region. Transp. Res. Part A Gen. 1987, 21, 439–449. [Google Scholar] [CrossRef]
- Pels, E.; Nijkamp, P.; Rietveld, P. Access to and competition between airports: A case study for the San Francisco Bay area. Transp. Res. Part A Policy Pract. 2003, 37, 71–83. [Google Scholar] [CrossRef]
- Hess, S.; Polak, J.W. Exploring the potential for cross-nesting structures in airport-choice analysis: A case-study of the Greater London area. Transp. Res. Part E Logist. Transp. Rev. 2006, 42, 63–81. [Google Scholar] [CrossRef]
- Lian, J.I.; Ronnevik, J. Airport competition—Regional airports losing ground to main airports. J. Transp. Geogr. 2011, 19, 85–92. [Google Scholar] [CrossRef]
- Yang, C.W.; Lu, J.L.; Hsu, C.Y. Modeling joint airport and route choice behavior for international and metropolitan airports. J. Air Transp. Manag. 2014, 39, 89–95. [Google Scholar] [CrossRef]
- Kim, A.M.; Ryerson, M.S. A long drive: Interregional airport passenger “leakage” in the U.S. Tour. Manag. 2018, 65, 237–244. [Google Scholar] [CrossRef]
- Jin, F.J. A study on network of domestic air passenger flow in China. Geogr. Res. 2001, 20, 31–39. [Google Scholar]
- Shaw, S.L.; Feng, L.; Chen, J.; Zhou, C. China’s airline consolidation and its effects on domestic airline networks and competition. J. Transp. Geogr. 2009, 17, 293–305. [Google Scholar] [CrossRef]
- Chang, Y.C.; Hsu, C.J.; Lin, J.R. A historic move—The opening of direct flights between Taiwan and China. J. Transp. Geogr. 2011, 19, 255–264. [Google Scholar] [CrossRef]
- Lin, J. Network analysis of China’s aviation system, statistical and spatial structure. J. Transp. Geogr. 2012, 22, 109–117. [Google Scholar] [CrossRef]
- Wang, J.E.; Mo, H.H.; Wang, F.H. Evolution of air transport network of China 1930–2012. J. Transp. Geogr. 2014, 40, 145–158. [Google Scholar] [CrossRef]
- Zhang, Q.; Yang, H.J.; Wang, Q.; Zhang, A.M. Market power and its determinants in the Chinese airline industry. Transp. Res. Part A Policy Pract. 2014, 64, 1–13. [Google Scholar] [CrossRef]
- Wang, J.E.; Wang, H.; Jiao, J.Y. China’s international aviation transport to the Belt and Road Initiative area. Prog. Geogr. 2015, 34, 554–562. [Google Scholar]
- Wang, J.E.; Bonilla, D.; Banister, D. Air deregulation in China and its impact on airline competition 1994–2012. J. Transp. Geogr. 2016, 50, 12–23. [Google Scholar] [CrossRef]
- Miller, R.A. Herfindahl–Hirschman Index as a market structure variable: An exposition for antitrust practitioners. Antitrust Bull 1982, 27, 593–618. [Google Scholar]
- Frenken, K.; Van Terwisga, S.; Verburg, T.; Burghouwt, G. Airline competition at European airports. Tijdschr. Voor Econ. En Soc. Geogr. 2004, 95, 233–242. [Google Scholar] [CrossRef]
- Frenken, K. Entropy statistics and information theory. In The Elgar Companion to Neo-Schumpeterian Economics, 1st ed.; Hanusch, H., Pyka, A., Eds.; Edward Elgar: Cheltenham, UK, 2007; Volume 1, pp. 544–556. [Google Scholar]
- Du, C.; Wang, J.E. Spatial pattern of China Southern Airlines’ network and its market coverage. Geogr. Res. 2015, 34, 1319–1330. [Google Scholar]
- Fuellhart, K.; O’Connor, K.; Woltemade, C. Route-level passenger variation within three multi-airport regions in the USA. J. Transp. Geogr. 2013, 31, 171–180. [Google Scholar] [CrossRef]
- Suzuki, Y.; Audino, M.J. The effect of airfares on airport leakage in single airport regions. Transp. J. 2003, 42, 31–41. [Google Scholar]
- Suzuki, Y.; Crum, M.R.; Audino, M.J. Airport leakage and airline pricing strategy in single-airport regions. Transp. Res. Part E Logist. Transp. Rev. 2004, 40, 19–37. [Google Scholar] [CrossRef]
- Brueckner, J.K.; Lee, D.; Singer, E.S. Airline competition and domestic US airfares: A comprehensive reappraisal. Econ. Transp. 2013, 2, 1–17. [Google Scholar] [CrossRef]
- Francis, G.; Fidato, A.; Humphreys, I. Airport–airline interaction: The impact of low-cost carriers on two European airports. J. Air Transp. Manag. 2003, 9, 267–273. [Google Scholar] [CrossRef]
- Dobruszkes, F. An analysis of European low-cost airlines and their networks. J. Transp. Geogr. 2006, 14, 249–264. [Google Scholar] [CrossRef]
- Pels, E.; Njegovan, N.; Behrens, C. Low-cost airlines and airport competition. Transp. Res. Part E Logist. Transp. Rev. 2009, 45, 335–344. [Google Scholar] [CrossRef]
- Suau-Sanchez, P.; Voltes Dorta, A. The role of London airports in providing connectivity for the UK: Regional dependence on foreign hubs. J. Transp. Geogr. 2016, 50, 94–104. [Google Scholar] [CrossRef]
- Dobruszkes, F.; Givoni, M.; Vowles, T. Hello major airports, goodbye regional airports? Recent changes in European and US low-cost airline airport choice. J. Air Transp. Manag. 2017, 59, 50–62. [Google Scholar] [CrossRef]
- Liu, Y. A study on zoning “new three macro-regional development zones” of regional economy of China. Acta Geogr. Sin. 2005, 60, 361–370. [Google Scholar]
- Chen, Z.H. Impacts of high-speed rail on domestic air transportation in China. J. Transp. Geogr. 2017, 62, 184–196. [Google Scholar] [CrossRef]
- Min, S.; Wei, X.L.; Liu, Y.Y.; Rui, Z.; Zhen, C.Z. Sustainability Development of High-Speed Rail and Airline—Understanding Passengers’ Preferences: A Case Study of the Beijing–Shanghai Corridor. Sustainability 2019, 11, 1352. [Google Scholar]
- Wu, J.S.; Liu, H.; Peng, J.; Ma, L. Hierarchical structure and spatial pattern of China’s urban system: Evidence from DMSP/OLS nightlight data. Acta Geogr. Sin. 2014, 69, 760–770. [Google Scholar]
- China National Tourism Administration (CNTA). The Yearbook of China Tourism Statistics (in Chinese); China Travel & Tourism Press: Beijing, China, 2018.
- Taylor, P.J.; Derudder, B. World City Network: A Global Urban Analysis, 2nd ed.; Routledge: New York, NY, USA, 2016; pp. 62–64. [Google Scholar]
- Wong, Y.H.; Choong, D. Global Destination Cities Index by MasterCard; MasterCard: New York, NY, USA, 2018; pp. 62–63. [Google Scholar]


| Airport | Passenger Enplanement (Millions) | Market Share Within | Distances (km) and Driving Times (min) | ||
|---|---|---|---|---|---|
| HKG | CAN | SZX | |||
| HKG | 72.0 | 35.8% | 195.2 km/151 min | 75.7 km/93 min | |
| CAN | 65.8 | 32.7% | 195.2 km/151 min | 131.3 km/100 min | |
| SZX | 45.6 | 22.7% | 75.7 km/93 min | 131.3 km/100 min | |
| Other airports | 17.8 | 8.8% | |||
| Total | 20,122.3 | 100% | |||
| Type | Domestic Market | International Market | ||
|---|---|---|---|---|
| Routes | Flight | Routes | Flight | |
| Monopoly | 42 | 1.9% | 85 | 9.7% |
| HKG | 61 | 8.7% | ||
| CAN | 33 | 1.5% | 22 | 1.0% |
| SZX | 9 | 0.4% | 2 | 0.0% |
| Duopoly | 60 | 11.3% | 37 | 26.5% |
| CAN–HKG | 5 | 1.0% | 36 | 26.3% |
| SZX–HKG | 1 | 0.2% | ||
| CAN–SZX | 55 | 10.4% | ||
| Tripoly | 46 | 86.8% | 24 | 63.8% |
| Total | 148 | 100.0% | 146 | 100.0% |
| Type | Monopoly Airport Operation | Duopoly Airport Operation | Tripoly Airport Operation | Total | ||||
|---|---|---|---|---|---|---|---|---|
| Routes | Flights | Routes | Flights | Routes | Flights | Routes | Flights | |
| One airline | 40 | 1.8% | 22 | 3.7% | 1 | 0.5% | 63 | 6.0% |
| CZ | 19 | 0.9% | 15 | 2.8% | 1 | 0.5% | 35 | 4.2% |
| KA | ||||||||
| ZH | 3 | 0.2% | 2 | 0.2% | 5 | 0.4% | ||
| LCC | 1 | 0.0% | 1 | 0.0% | ||||
| Two airlines | 2 | 0.1% | 33 | 4.9% | 2 | 0.7% | 37 | 5.7% |
| CZ | 2 | 0.0% | 22 | 1.7% | 1 | 0.1% | 25 | 1.8% |
| KA | 1 | 0.1% | 1 | 0.1% | ||||
| ZH | 12 | 1.6% | 1 | 0.3% | 13 | 1.9% | ||
| LCC | 6 | 0.3% | 6 | 0.3% | ||||
| Three airlines | 3 | 0.9% | 6 | 1.9% | 9 | 2.8% | ||
| CZ | 3 | 0.3% | 5 | 1.2% | 8 | 1.5% | ||
| KA | 1 | 0.1% | 1 | 0.1% | ||||
| ZH | 3 | 0.4% | 2 | 0.1% | 5 | 0.5% | ||
| LCC | 2 | 0.1% | 2 | 0.1% | ||||
| More than three airlines | 2 | 1.8% | 37 | 83.6% | 39 | 85.4% | ||
| CZ | 2 | 1.0% | 36 | 26.6% | 38 | 27.6% | ||
| KA | 17 | 4.2% | 17 | 4.2% | ||||
| ZH | 2 | 0.2% | 35 | 12.7% | 37 | 12.9% | ||
| LCC | 1 | 0.1% | 33 | 3.9% | 34 | 4.0% | ||
| Total | 42 | 1.9% | 60 | 11.3% | 46 | 86.8% | 148 | 100.0% |
| CZ | 21 | 0.9% | 42 | 5.8% | 43 | 28.4% | 106 | 35.1% |
| KA | 0 | 0.0% | 0 | 0.0% | 19 | 4.4% | 19 | 4.4% |
| ZH | 3 | 0.2% | 19 | 2.4% | 38 | 13.1% | 60 | 15.7% |
| LCC | 1 | 0.0% | 7 | 0.4% | 35 | 4.0% | 43 | 4.4% |
| Type | One Airport | Two Airports | Three Airports | Total | ||||
|---|---|---|---|---|---|---|---|---|
| Routes | Flights | Routes | Flights | Routes | Flights | Routes | Flights | |
| One airline | 67 | 5.1% | 5 | 1.2% | 72 | 6.4% | ||
| CX | 9 | 1.3% | 9 | 1.3% | ||||
| CZ | 5 | 0.2% | 5 | 0.2% | ||||
| ZH | 1 | 0.0% | 1 | 0.0% | ||||
| LCC | 10 | 0.4% | 10 | 0.4% | ||||
| 0 | 0.0% | |||||||
| Two airlines | 14 | 2.7% | 11 | 3.4% | 25 | 6.1% | ||
| CX | 5 | 1.0% | 6 | 0.9% | 11 | 1.9% | ||
| CZ | 6 | 0.7% | 6 | 0.7% | ||||
| ZH | 0 | 0.0% | ||||||
| LCC | 6 | 0.6% | 6 | 0.6% | ||||
| 0 | 0.0% | |||||||
| Three airlines | 4 | 1.9% | 10 | 6.1% | 2 | 3.2% | 16 | 11.1% |
| CX | 2 | 0.5% | 6 | 2.2% | 2 | 1.2% | 10 | 3.9% |
| CZ | 9 | 1.6% | 2 | 0.8% | 11 | 2.4% | ||
| ZH | 0 | 0.0% | ||||||
| LCC | 2 | 0.1% | 1 | 0.2% | 3 | 0.3% | ||
| 0 | 0.0% | |||||||
| More than three airlines | 11 | 15.8% | 22 | 60.6% | 33 | 76.4% | ||
| CX | 7 | 4.9% | 13 | 13.7% | 20 | 18.6% | ||
| CZ | 11 | 3.0% | 19 | 8.2% | 30 | 11.2% | ||
| ZH | 9 | 2.0% | 9 | 2.0% | ||||
| LCC | 7 | 2.1% | 15 | 11.2% | 22 | 13.3% | ||
| 0 | 0.0% | |||||||
| Total | 85 | 9.7% | 37 | 26.5% | 24 | 63.8% | 146 | 100.0% |
| CX | 16 | 2.8% | 19 | 8.0% | 15 | 14.9% | 50 | 25.7% |
| CZ | 5 | 0.2% | 26 | 5.3% | 21 | 9.0% | 52 | 14.5% |
| ZH | 1 | 0.0% | 0 | 0.0% | 9 | 2.0% | 10 | 2.0% |
| LCC | 18 | 1.1% | 8 | 2.3% | 15 | 11.2% | 41 | 14.6% |
| Airport Operation Type | Northeast and East Coastal Region | Middle and Near-Reach-West Region | Far-Reach-West Region | Total | ||||||||
|---|---|---|---|---|---|---|---|---|---|---|---|---|
| Flights (Routes) | Avg. Carrier | Avg. HHI | Flights (Routes) | Avg. Carrier | Avg. HHI | Flights (Routes) | Avg. Carrier | Avg. HHI | Flights (Routes) | Avg. Carrier | Avg. HHI | |
| Monopoly | 0.8% (13) | 1 | 1.000 | 1.0% (25) | 1 | 0.974 | 0.1% (4) | 1 | 1.000 | 1.9% (42) | 1 | 0.984 |
| Duopoly | 3.5% (20) | 2 | 0.735 | 6.2% (34) | 2 | 0.765 | 1.7% (6) | 3 | 0.510 | 11.3% (60) | 2 | 0.729 |
| Tripoly | 57.0% (26) | 6 | 0.345 | 28.6% (18) | 6 | 0.332 | 1.2% (2) | 5 | 0.278 | 86.8% (46) | 6 | 0.337 |
| Total | 61.2% (59) | 4 | 0.621 | 35.8% (77) | 3 | 0.732 | 3.0% (26) | 3 | 0.635 | 100.0% (148) | 3 | 0.680 |
| Airport Operation Type | North America | Africa | Europe | Asia-Pacific | Middle East | Total | ||||||||||||
|---|---|---|---|---|---|---|---|---|---|---|---|---|---|---|---|---|---|---|
| Flights (Routes) | Avg. Carrier | Avg. HHI | Flights (Routes) | Avg. Carrier | Avg. HHI | Flights (Routes) | Avg. Carrier | Avg. HHI | Flights (Routes) | Avg. Carrier | Avg. HHI | Flights (Routes) | Avg. Carrier | Avg. HHI | Flights (Routes) | Avg. Carrier | Avg. HHI | |
| Monopoly | 0.9% (6) | 1 | 0.917 | 0.4% (3) | 1 | 0.833 | 1.4% (13) | 1 | 0.924 | 6.1% (53) | 1 | 0.914 | 1.0% (10) | 1 | 0.951 | 9.7% (85) | 1 | 0.917 |
| Duopoly | 4.1% (5) | 3 | 0.474 | 0.8% (3) | 1 | 0.893 | 4.3% (6) | 3 | 0.525 | 16.1% (19) | 4 | 0.408 | 1.3% (4) | 2 | 0.857 | 26.5% (37) | 3 | 0.524 |
| Tripoly | 1.3% (1) | 4 | 0.408 | 0.5% (1) | 4 | 0.309 | 60.4% (21) | 7 | 0.284 | 1.5% (2) | 3 | 0.409 | 63.8% (24) | 6 | 0.295 | |||
| Total | 6.3% (12) | 2 | 0.690 | 1.2% (6) | 1 | 0.863 | 6.1% (20) | 2 | 0.774 | 82.6% (93) | 3 | 0.669 | 3.8% (15) | 1 | 0.890 | 100.0% (146) | 3 | 0.715 |
| Effect | CAN–HKG | SZX–CAN | SZX–HKG | |||
|---|---|---|---|---|---|---|
| Coefficient (t) | Coefficient (t) | Coefficient (t) | ||||
| Avg. fare | −0.620 | (−2.897) | −0.182 | (−0.649) | −0.216 | (−0.791) |
| HHI | −0.417 | (−1.679) *** | −0.154 | (−0.496) | −0.386 | (−1.419) |
| Car driving time | −0.455 | (−1.307) * | −1.247 | (−2.147) * | −0.086 | (−0.358) |
| Flights | 0.807 | (9.638) *** | 0.553 | (3.895) *** | 0.696 | (8.407) *** |
| Dummy GND | −0.096 | (−0.345) | −0.691 | (−2.062) ** | −0.197 | (−0.635) |
| Dummy GJD | −0.180 | (−0.458) | 0.317 | (0.776) | −0.194 | (−0.380) |
| Dummy GJC | −0.288 | (−0.887) | 0.121 | (0.354) | −0.632 | (−1.719) |
| Constant | 1.409 | (1.255) | 3.582 | (1.901) ** | 0.534 | (0.307) * |
| Number of observations | 83 | 51 | 49 | |||
| Adjusted R2 | 0.827 | 0.445 | 0.888 | |||
© 2019 by the authors. Licensee MDPI, Basel, Switzerland. This article is an open access article distributed under the terms and conditions of the Creative Commons Attribution (CC BY) license (http://creativecommons.org/licenses/by/4.0/).
Share and Cite
Liao, W.; Cao, X.; Li, S. Competition and Sustainability Development of a Multi-Airport Region: A Case Study of the Guangdong–Hong Kong–Macao Greater Bay Area. Sustainability 2019, 11, 2958. https://doi.org/10.3390/su11102958
Liao W, Cao X, Li S. Competition and Sustainability Development of a Multi-Airport Region: A Case Study of the Guangdong–Hong Kong–Macao Greater Bay Area. Sustainability. 2019; 11(10):2958. https://doi.org/10.3390/su11102958
Chicago/Turabian StyleLiao, Wang, Xiaoshu Cao, and Shengchao Li. 2019. "Competition and Sustainability Development of a Multi-Airport Region: A Case Study of the Guangdong–Hong Kong–Macao Greater Bay Area" Sustainability 11, no. 10: 2958. https://doi.org/10.3390/su11102958
APA StyleLiao, W., Cao, X., & Li, S. (2019). Competition and Sustainability Development of a Multi-Airport Region: A Case Study of the Guangdong–Hong Kong–Macao Greater Bay Area. Sustainability, 11(10), 2958. https://doi.org/10.3390/su11102958