Article

Model-Based Selection of Cost-Effective Low Impact Development Strategies to Control Water Balance

Graz University of Technology, Institute of Urban Water Management and Landscape Water Engineering, Stremayrgasse 10/I, 8010 Graz, Austria
*
Author to whom correspondence should be addressed.
Sustainability 2019, 11(8), 2440; https://doi.org/10.3390/su11082440
Submission received: 4 April 2019 / Revised: 16 April 2019 / Accepted: 18 April 2019 / Published: 25 April 2019

Abstract

:
Urbanization induces an increase of runoff volume and decrease of evapotranspiration and groundwater recharge. Low impact development (LID) strategies aim to mitigate these adverse impacts. Hydrologic simulation is a reasonable option to assess the LID performance with respect to the water balance and is applicable to planning purposes. Current LID design approaches are based on design storm events and focus on the runoff volume and peak, neglecting evapotranspiration and groundwater recharge. This contribution presents a model-based design approach for the selection of cost-effective LID strategies. The method is based on monitored precipitation time series and considers the complete water balance and life-cycle-costs, as well as the demand for land. The efficiency of LID strategies (ELID) is introduced as an evaluation measure which also accounts for emphasizing different goals. The results show that there exist several pareto-optimal LID strategies providing a reasonable basis for decision-making. Additionally, the application of LID treatment trains emerges as an option of high potential.

1. Introduction

The increase of impervious land cover caused by urbanization considerably affects the water balance [1]. While the runoff increases, the evapotranspiration and groundwater recharge decreases. This results in several negative impacts, like higher runoff peak rates, larger runoff volumes, higher potential of flooding events, urban heat islands, etc. [2,3,4].
Low impact development (LID) strategies are a widely known and implemented concept in stormwater management. They aim to replicate hydrologic characteristics of natural catchments, thus mitigating the adverse impacts of urbanization [5,6]. LID strategies are applied to maintain or restore the pre-development hydrologic regime [5,7]. In order to evaluate the LID performance with respect to this purpose, the pre- and post-development hydrologic conditions of a catchment are analyzed. Hydrologic simulations are a reasonable and common option for such assessments. Several modeling tools allow for the simulation of hydrologic processes of LIDs (compare overview of Jayasooriya and Ng [8]). The US EPA Storm Water Management Model (SWMM) [9] was selected for this study as it is currently one of the most sophisticated tools for the hydrologic simulation of LIDs [8].
The design of LIDs (particularly infiltration systems), e.g., infiltration swales or infiltration trenches, implies the calculation of the required retention volume. Basically, it is the difference between the stormwater volume collected by the LID and the stormwater volume that infiltrates through the LID into the soil underneath. Planning guidelines or design manuals often propose to use design storm events of a certain duration and return period in order to determine the required LID retention volume (e.g., [10,11,12], for an overview of international approaches compare Ballard et al. [13]). Such approaches do not consider the actual storm characteristics, e.g., the time-variant intensity, affecting the performance of LIDs. In addition, conditions at the start of a storm event, e.g., soil moisture or storage capacity due to antecedent storm events and dry periods, are not taken into account. This can result in a divergent assessment of LID performance compared to monitoring in the field. Thus, long-term and continuous simulations have to be used, even if dealing with single storm event evaluations (compare [14]).
Planning guidelines (e.g., [10,11]), evaluation approaches (e.g., [15]), as well as previous studies dealing with LID performance (compare reviews by Ahiablame et al. [6] and Eckart et al. [7]) or LID effectiveness (e.g., [16]) focus on the runoff and neglect the groundwater recharge and evapotranspiration, although they control groundwater levels and the micro-climate by means of cooling and prevent urban heat island effects [4,17]. Therefore, in terms of an environmentally sustainable and reasonable application of LIDs, all components of the water balance have to be considered. Consequently, holistic approaches (e.g., [18,19]) are a suitable basis for planning purposes. Furthermore, the assessment of LID performance is conducted on site scale, as suggested by Burns et al. [20], in order to restore/protect natural hydrologic processes at small scales. That is reasonable considering micro-climate issues and the restoration of natural flow regimes at larger scales downstream.
Various LID design approaches aim to design a certain LID strategy but do not provide recommendations for the selection of the proper LID strategy. Furthermore, little attention is paid to the possibility of combining LIDs to LID treatment trains, which can be well-performing LID strategies as well (e.g., [21,22,23,24]). Of course, the selection of LID strategies is also influenced by the cost-effectiveness (e.g., [25,26,27,28]), considering the life cycle costs. Several cost-estimating tools for LIDs have been developed (e.g., [29,30]).
Although individual approaches considering the water balance, cost-effectiveness (life cycle costs), or LID treatment trains exist, recommendations for a combined and holistic assessment are not available. This paper presents an approach for selecting suitable LID strategies considering a combined evaluation of the complete water balance (runoff volume, evapotranspiration, groundwater recharge) and the cost-effectiveness for both stand-alone LIDs and treatment trains.

2. Materials and Methods

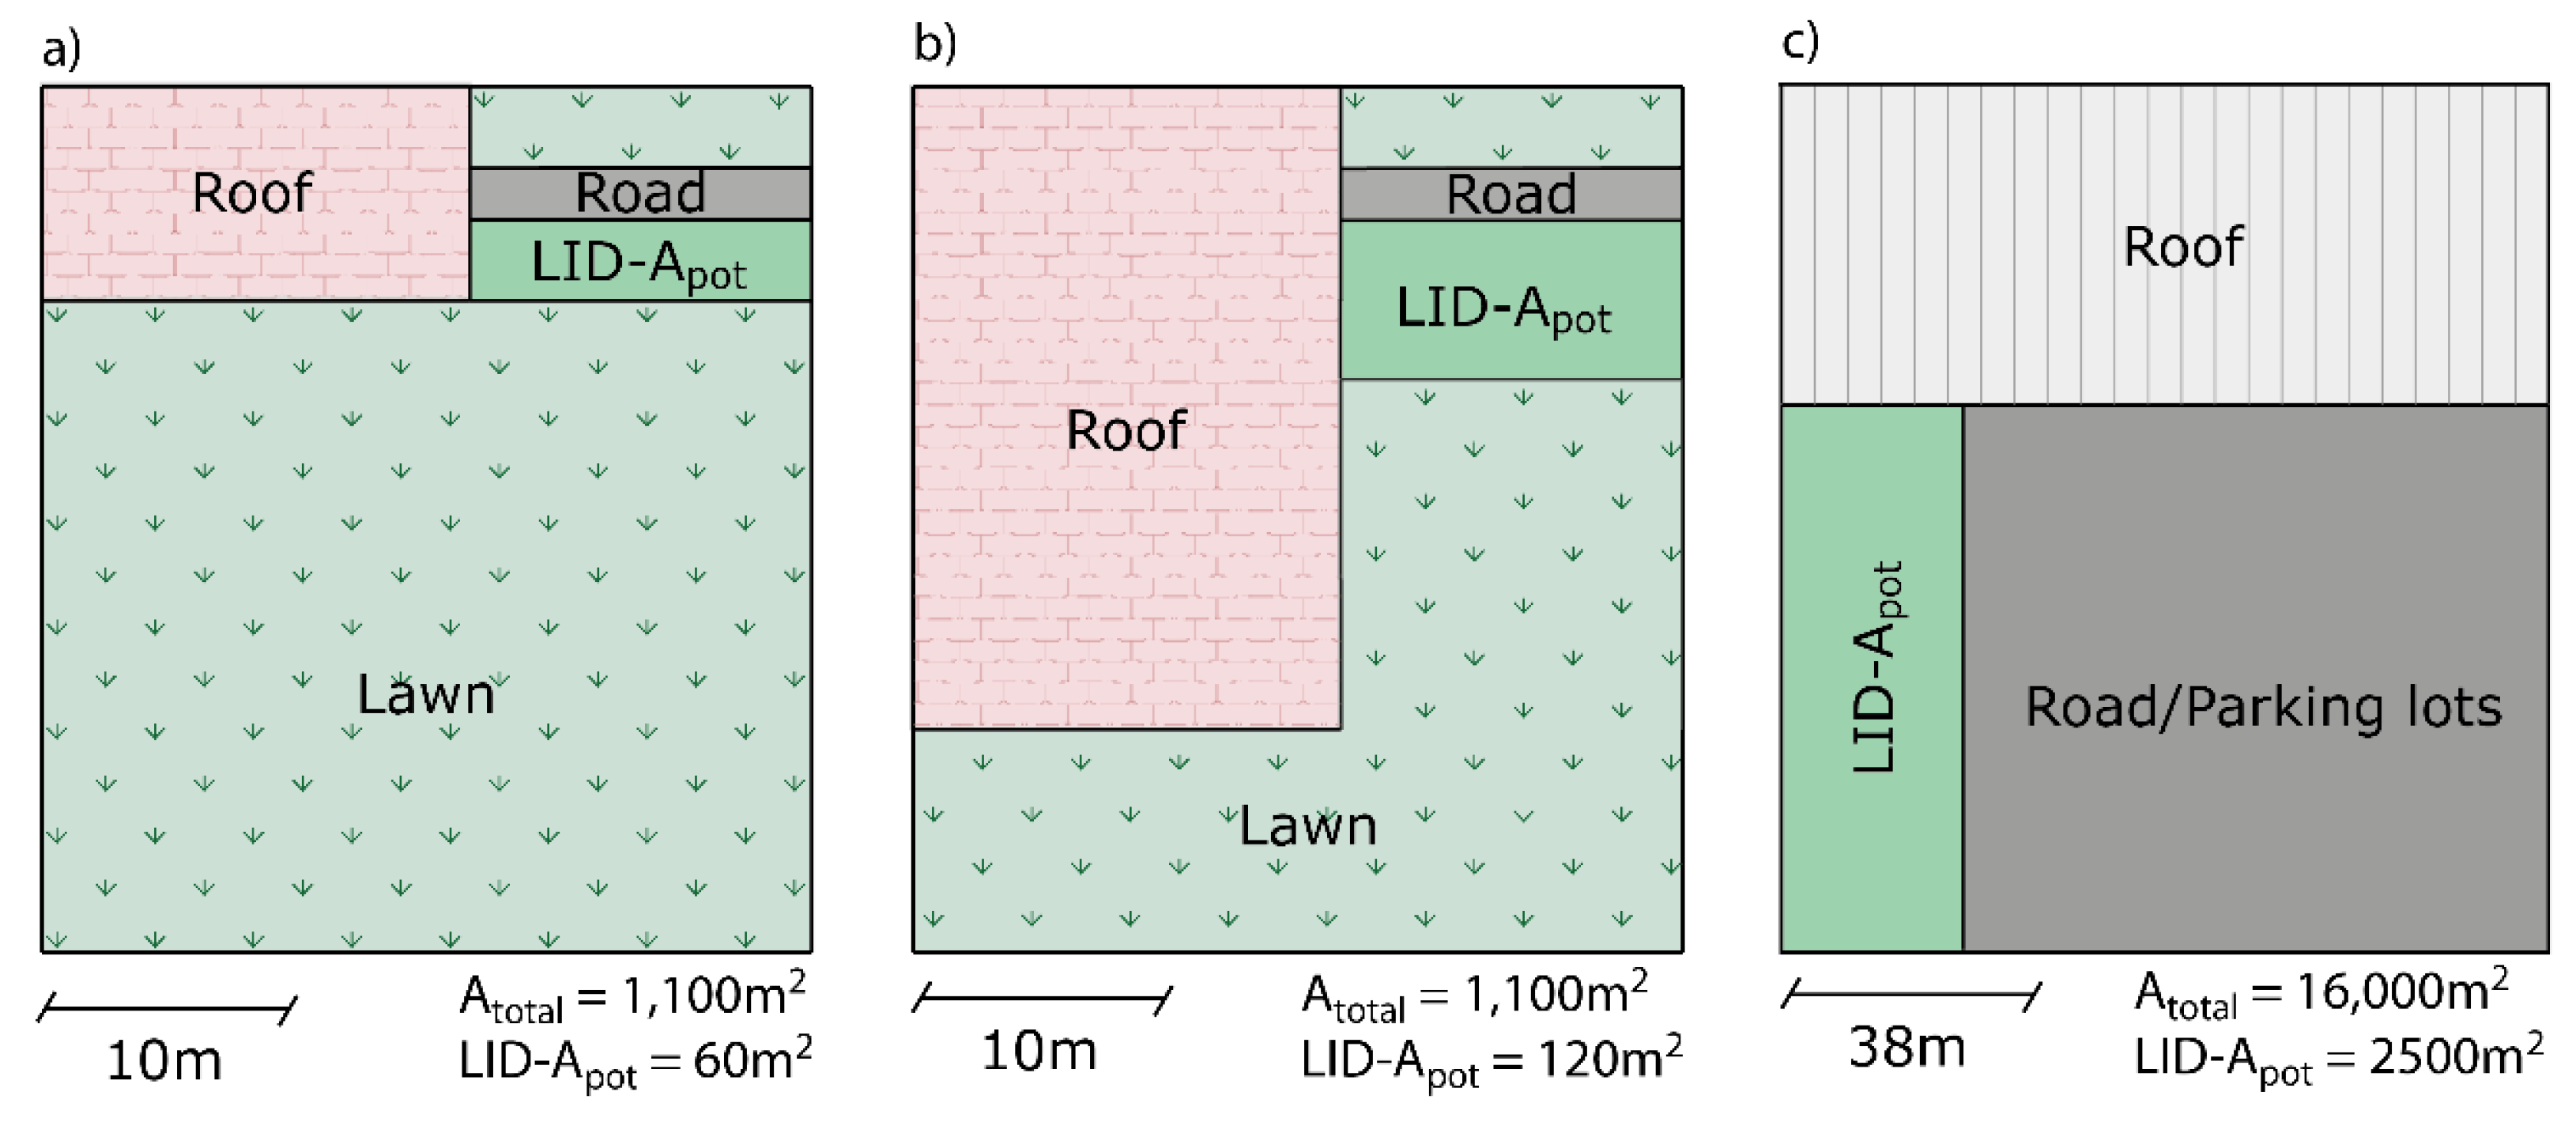
2.1. Case Studies and Data

The study was conducted using three case studies that represent characteristic urban areas: Two residential areas and one commercial area (Figure 2). The commercial area is 100% impervious and covers 16000 m², including a roofage of 6000 m². Both residential areas cover 1100 m² each. They differ in the degree of development (dod), which is the proportion between built-up area and building site area. The first residential area (low-developed) has a roofage of 200 m2 (dod = 0.18) whereas the second residential area (high-developed) has a roofage of 600 m2 (dod = 0.55). Both residential areas comprise a driveway of 40 m2, while the remaining plot is covered by lawn. All roofs are tiled in the initial state.
The precipitation series used for the long-term simulations was obtained in Graz/Austria, has a length of 10 years (1996–2006), and an average annual precipitation depth of 783 mm. It was provided by the Austrian Water and Waste Management Association (OEWAV) [31]. Daily minimum–maximum temperatures for the computation of evaporation rates, using the Hargreaves method [32], were provided by the Central Institute for Meteorology and Geodynamics (ZAMG) [33].

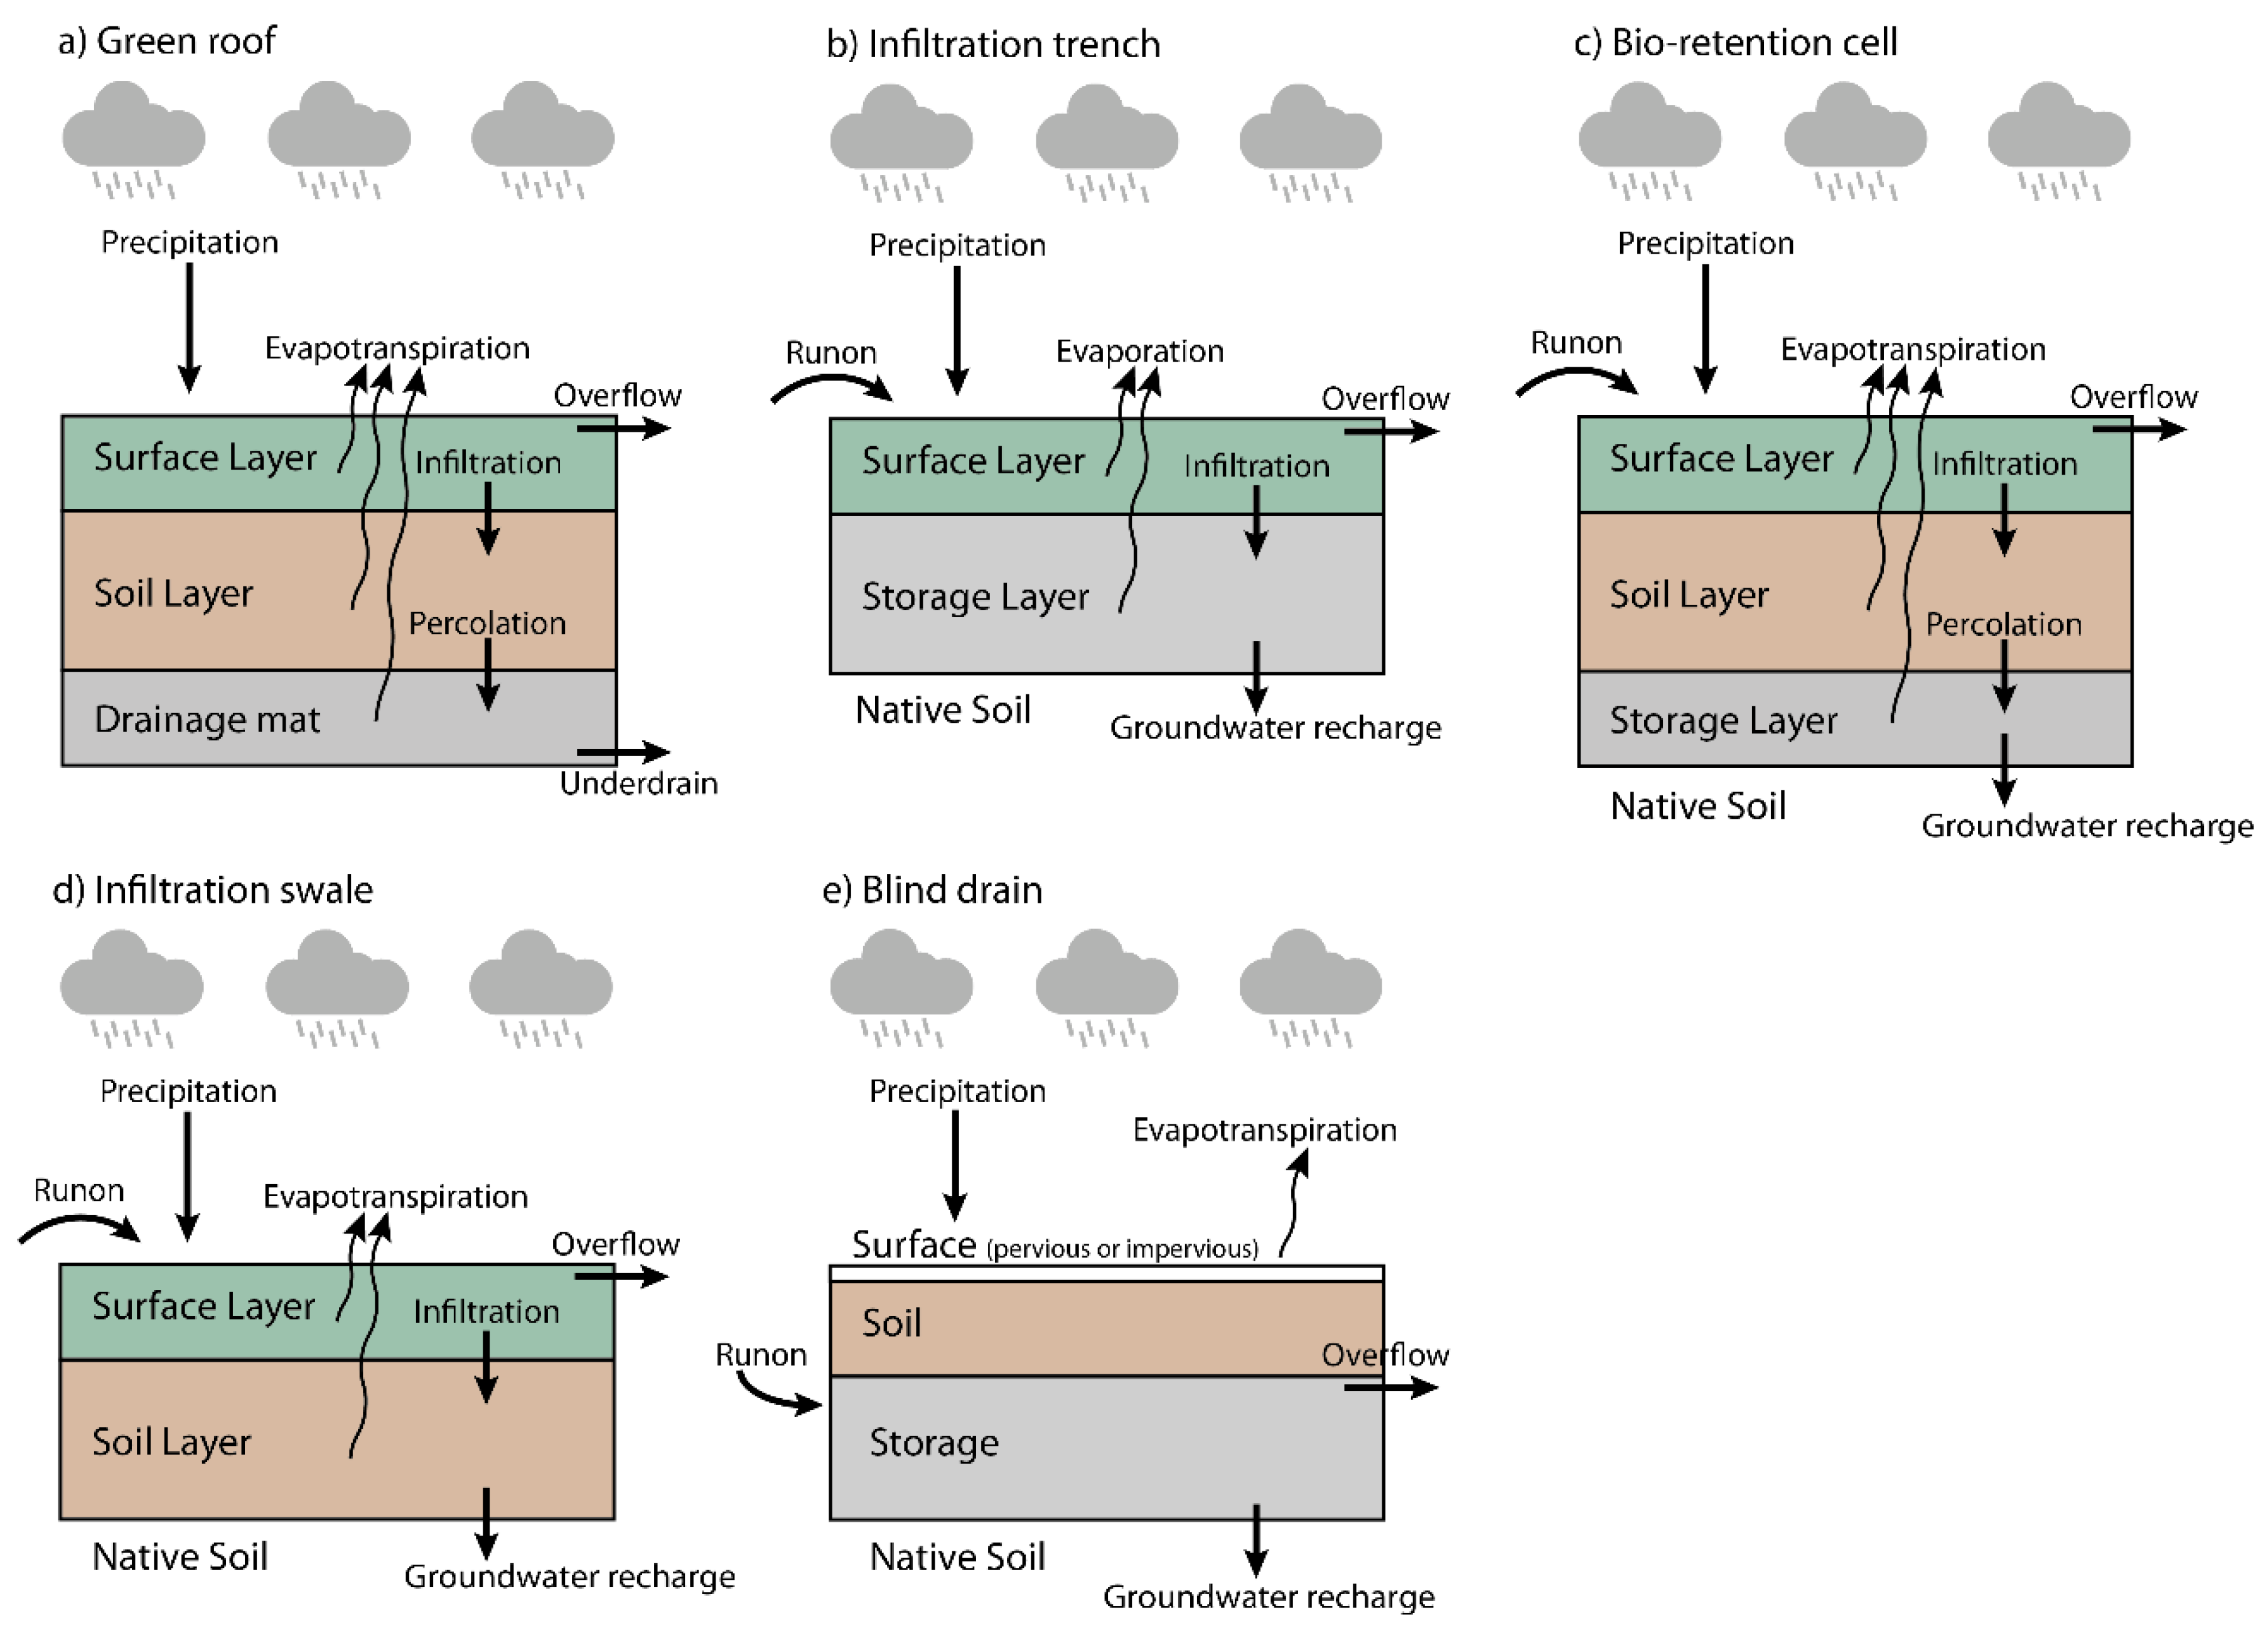
2.2. Investigated LID strategies and Model Development

The US EPA Storm Water Management Model (SWMM) [9], which was used in this study, is a dynamic rainfall-runoff model. It can be used for a single event or a continuous long-term simulation and simulates hydrologic processes on the surface as well as routing of runoff in the sewer system. SWMM accounts for a variety of hydrologic processes, like time-varying precipitation, interception of depression storage, evaporation of surface water, evapotranspiration out of the soil and/or LIDs, infiltration of stormwater into the soil, and percolation of infiltrated water into groundwater.
The following LIDs, which are frequently implemented in stormwater management projects, were selected for this study: Green roof, infiltration trench, bio-retention cell, infiltration swale, and blind drain.
Green roofs consist of an engineered and (partially) vegetated soil mixture above a drainage mat that serves as stormwater conveying layer. Infiltration swales are depressions that retain and infiltrate stormwater, whereas infiltration trenches are ditches filled with gravel, providing retention volume for stormwater to infiltrate into the native soil below. Bio-retention cells are a combination of infiltration swale and infiltration trench. They provide retention volume through a surface depression as well as an engineered and (partially) vegetated soil mixture and an underlying gravel storage bed. Blind drains are underground infiltration bodies filled with gravel or other filling material.
The mentioned LIDs, except for the blind drain, were simulated with a soil moisture model comprising different layers, e.g., surface, soil, and storage, which is implemented in SWMM (see Figure 1a–d). The layers simulate the different hydrologic functions of the LID. The surface layer accounts for the runoff generation and allows for infiltration into the soil or storage layer. Optionally, a retention volume on the surface can be defined. The soil and storage layer provide retention volume as well and permit infiltration into the native soil. The drainage mat conveys percolated stormwater off the roof. The LID parameters were chosen in agreement with literature parameter ranges (e.g., [34,35,36]). In order to facilitate a comparison, all LIDs were similarly parameterized to provide comparable retention capacities and hydrologic behavior (Table 1). LIDs collect direct rainfall as well as runoff from other catchments. The runoff from LIDs was directed to the sewer system or to another LID catchment (LID treatment train). For additional information about the LID simulation in SWMM, the reader is referred to Rossman et al. [34]. The blind drain was simulated with a storage node that allows for infiltration to the native soil and prevents evapotranspiration while simulating the surface above the blind drain as well (Figure 1e). The blind drain storage depth was defined to 30cm.
A potential total LID area (Apot) was assigned to the three areas according to the space available (Figure 2): 2500 m² for the commercial area, 60 m² for the low-developed residential area, and 120 m² for the high-developed residential area. The maximal extent of the underground blind drain was selected accordingly. Each Apot was divided into 50 sections that consequently had a dimension of 50 m², 1.2 m², and 2.4 m² per section, respectively. Each section could be occupied by an LID type or left in the initial state. The sections were incrementally used for the application of a LID type (e.g., infiltration swale applied to 1, 2, 3…50 sections) and a simulation was conducted for every state. In addition, two different LID types were applied to the sections, directing the runoff from the first LID to the second LID. Thus, different LID treatment trains were simulated (Figure 3). Again, the application of LIDs to the sections was executed incrementally.
A L I D 1 = A p o t 50 · n L I D 1   A L I D 2 = A p o t 50 · n L I D 2 max ( n L I D 1 + n L I D 2 ) = 50 for   sin gle   LID   strategies :   n L I D 2 = 0 ,
where ALID1 is the area of LID1 in m², ALID2 is the area of LID2 in m², Apot is the potential LID area for the respective case study, nLID1 is the number of sections occupied by LID1, and nLID2 is the number of sections occupied by LID2.
With respect to the roof, the green roof system was not applied incrementally. Only the two options “tiled roof” and “green roof” covering the complete roofage were simulated (Figure 3).
The potential total LID area could theoretically be divided into an infinite number of sections in order to get continuous results, but this would result in high computational effort. Therefore, the discrete results for the water balance using the grid of 50 sections were used as supporting points for a linear interpolation.

2.3. Relations between Water Balance, Life Cycle Costs, and Demand for Land

All three areas (Figure 2) were simulated for the investigated LID strategies. Based on the SWMM simulation results, the water balance can be computed:
S = P E T R G R ,
where P is the precipitation (mm), R is the runoff volume (mm), ET is the evapotranspiration (mm), GR is the groundwater recharge (mm), and ∆S is the change in system storage (mm).
The water balance components can also be expressed as fraction of the precipitation:
1 = S + E T + R + G R P
The life cycle costs, including construction and maintenance costs, were calculated for every LID strategy based on the size (number of sections) of each LID and following a dynamic cost comparison calculation [37]. The interest rate was assumed to be 3% and the intended life of LID practice based on routine maintenance was assumed to be 30 years [38]. According to the investigated references (see Table 2), 5% of the construction costs were used as annual maintenance costs. The reference date was defined at the start of the LID life span. The singular construction costs were distributed uniformly and added to the annual maintenance costs:
T C a = C o ·   i · ( 1 + i ) n ( 1 + i ) n 1 +   C o · p
where TCa is the total annual cost per unit (€/year), C0 is the construction cost per unit (€), n is the life span (years), i is the interest rate (%) to discount future costs, and p is the proportion of maintenance to construction costs (%).
Besides the LID performance with respect to the water balance and the economic aspect regarding the construction and maintenance costs, the demand for land is an additional important factor that has to be evaluated. Especially in highly urbanized areas, available land is rare and/or expensive. Consequently, the demand for land (dland) is used as a further indicator of LID performance:
For bio-retention cell , infiltration swale , and infiltration trench : d l a n d = A L I D For   blind   drain : d l a n d = 0
where dland is the demand for land and ALID is the area of the LID (see also Equation (1)).

2.4. Assessment and Efficiency of LID Strategies

LID strategies can be used in order to achieve, or at least approximate, a certain targeted water balance with a limited budget regarding the costs and/or demand for land. The challenge is to identify an LID strategy that meets the desired water balance while resulting in minimum costs and demand for land. Usually, there is not one optimal solution that equally satisfies the mentioned requirements. Thus, the relation between the water balance, costs, and demand for land has to be identified in order to find a reasonable LID strategy as a kind of trade-off.
The obtained simulation results are used to calculate the deviation from a targeted water balance. This deviation is defined as the sum of the absolute deviations of the particular water components:
D W B = R s i m R t ¯ +   E T s i m E T t ¯ + G R s i m G R t ¯ ,
where DWB is the deviation from a targeted water balance (in percentage points), R is the runoff volume (in % of precipitation depth), ET is the evapotranspiration (in % of precipitation depth), GR is the groundwater recharge (in % of precipitation depth), sim denotes the simulated value, and t denotes the value of target state.
The targeted water balance can be either defined by stakeholders based on case-specific boundary conditions like the capacity of the present sewer system or based on hydrologic simulations, aiming for natural conditions (e.g., [19]). For demonstration purposes, an arbitrary defined targeted water balance with a runoff volume of 5%, an evapotranspiration of 45%, and a groundwater recharge of 50% is used.
The deviation from the targeted water balance (Equation (6)), the costs (Equation (4)), and the demand for land (Equation (5)) have to be minimized. This requirement is used to identify all nondominated (pareto-optimal) results. The approach of gridding methods (e.g., compare [42]) was used for this purpose, as the mentioned objectives were evaluated for a defined number of points (grid of 50 sections).
The deviation from the targeted water balance and the demand for land are used to evaluate the effect of invested money. The efficiency of LID strategies, as a function of costs, is computed as the sum of the normalized deviation from the targeted water balance and the normalized demand for land. Additionally, weighting factors are introduced to emphasize a certain goal:
E L I D ( C ) = 1   ( w l a n d *   d l a n d max ( d l a n d ) +   w W B * D W B max ( D W B ) )   with :   w l a n d + w W B = 1 ,
where ELID is the efficiency of LID strategies, C is the cost, dland is the demand for land, DWB is the deviation from the targeted water balance, wland is the weighting factor for the demand for land, and wWB is the weighting factor for the deviation from targeted water balance.

3. Results and Discussion

The change in system storage is almost zero or at least negligibly small compared to the other water balance components for the long-term assessment. Consequently, it is not further taken into consideration. Concerning the investigated LID treatment trains, only results for selected strategies, that show high potential, are illustrated.

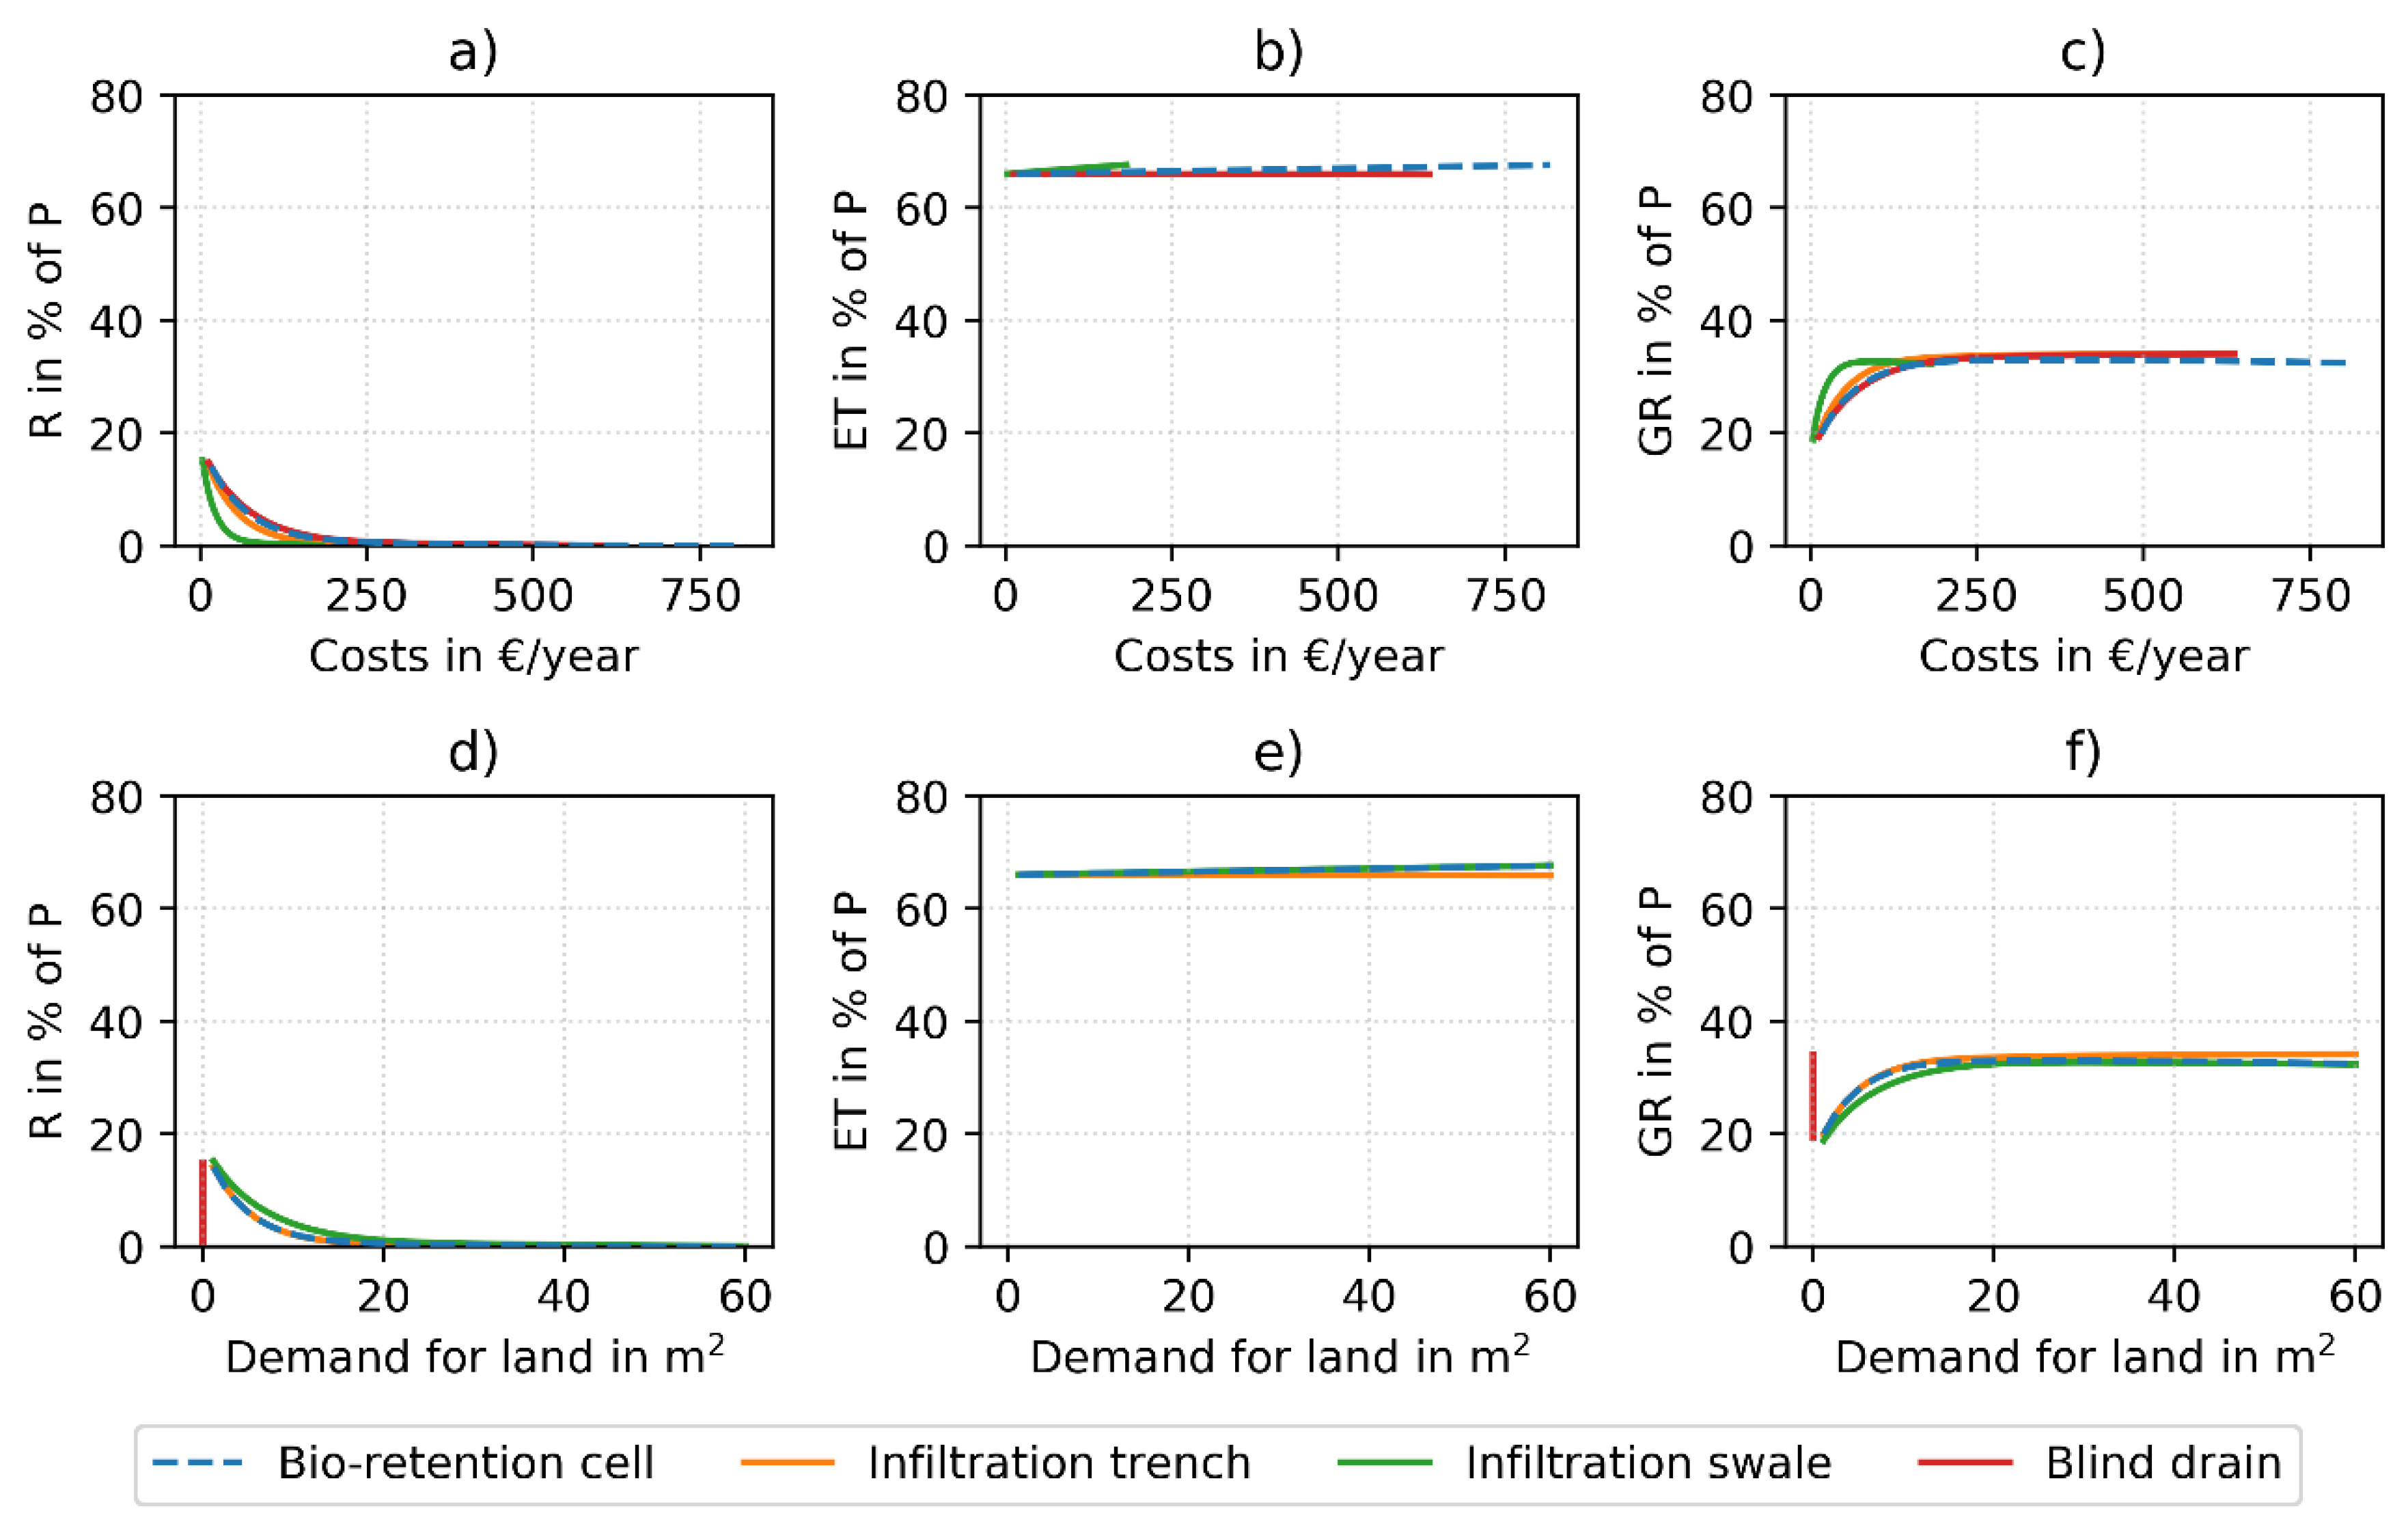
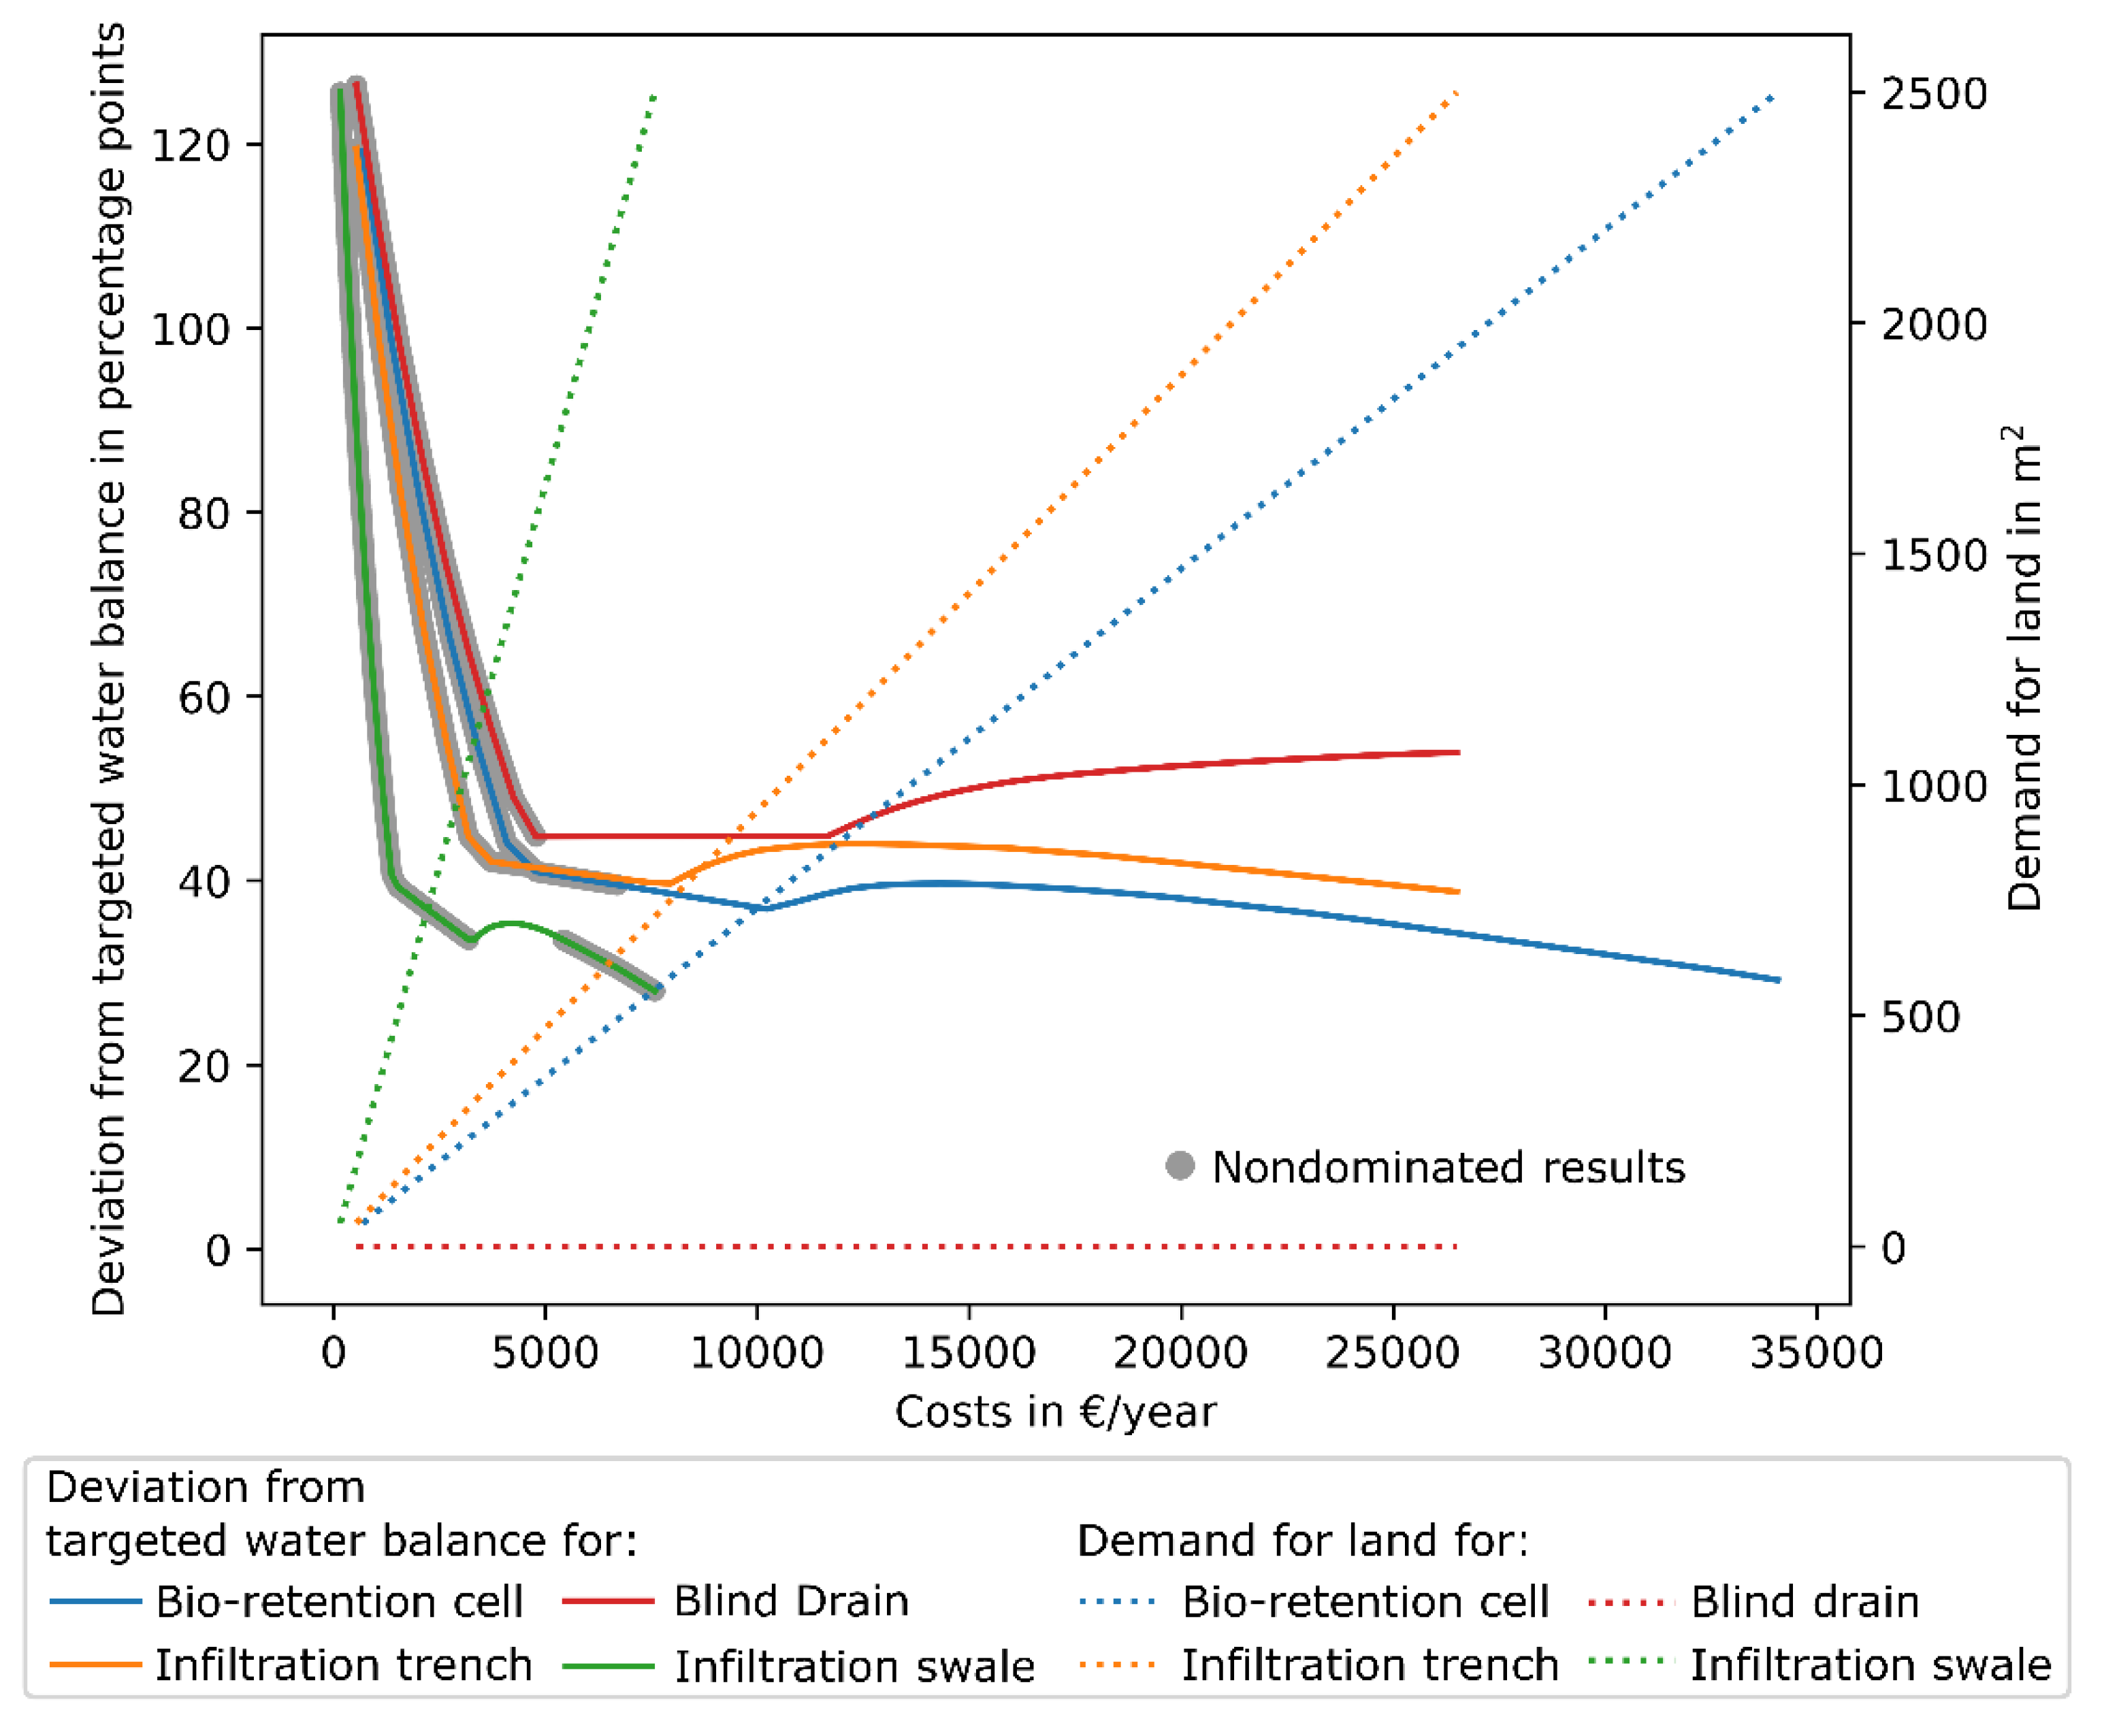
3.1. Relations between Water Balance, Life Cycle Costs, and Demand for Land

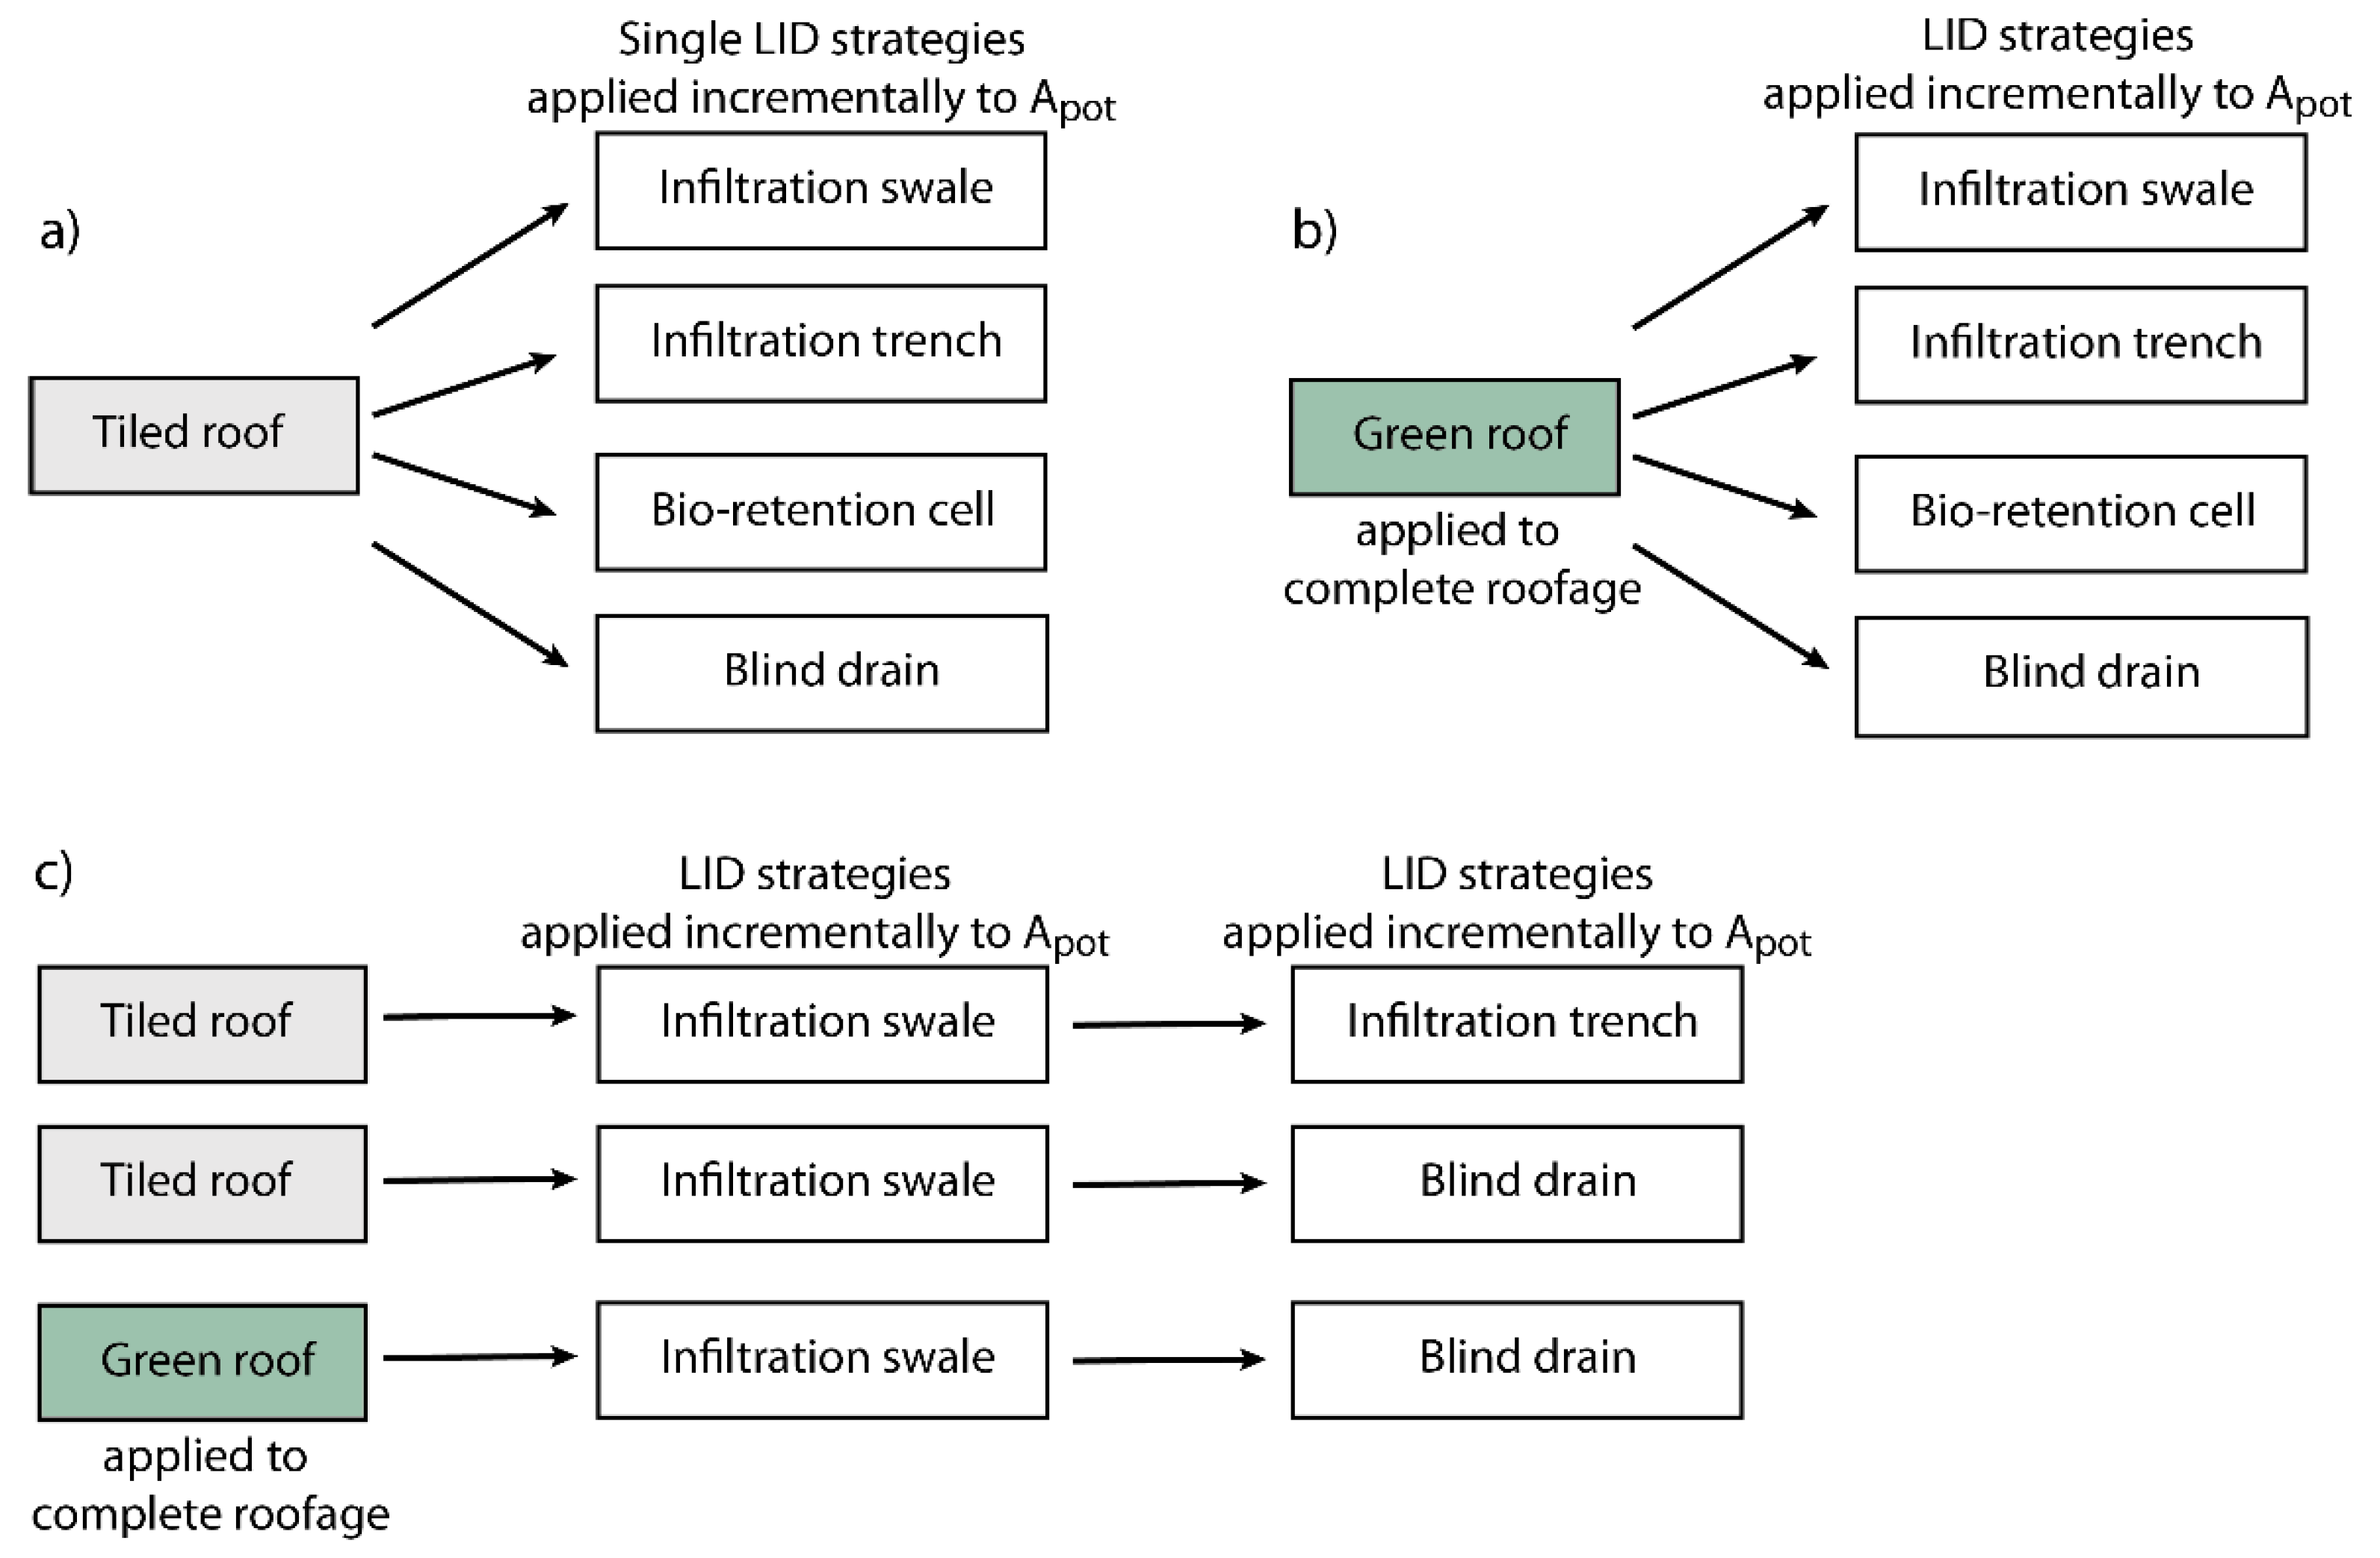
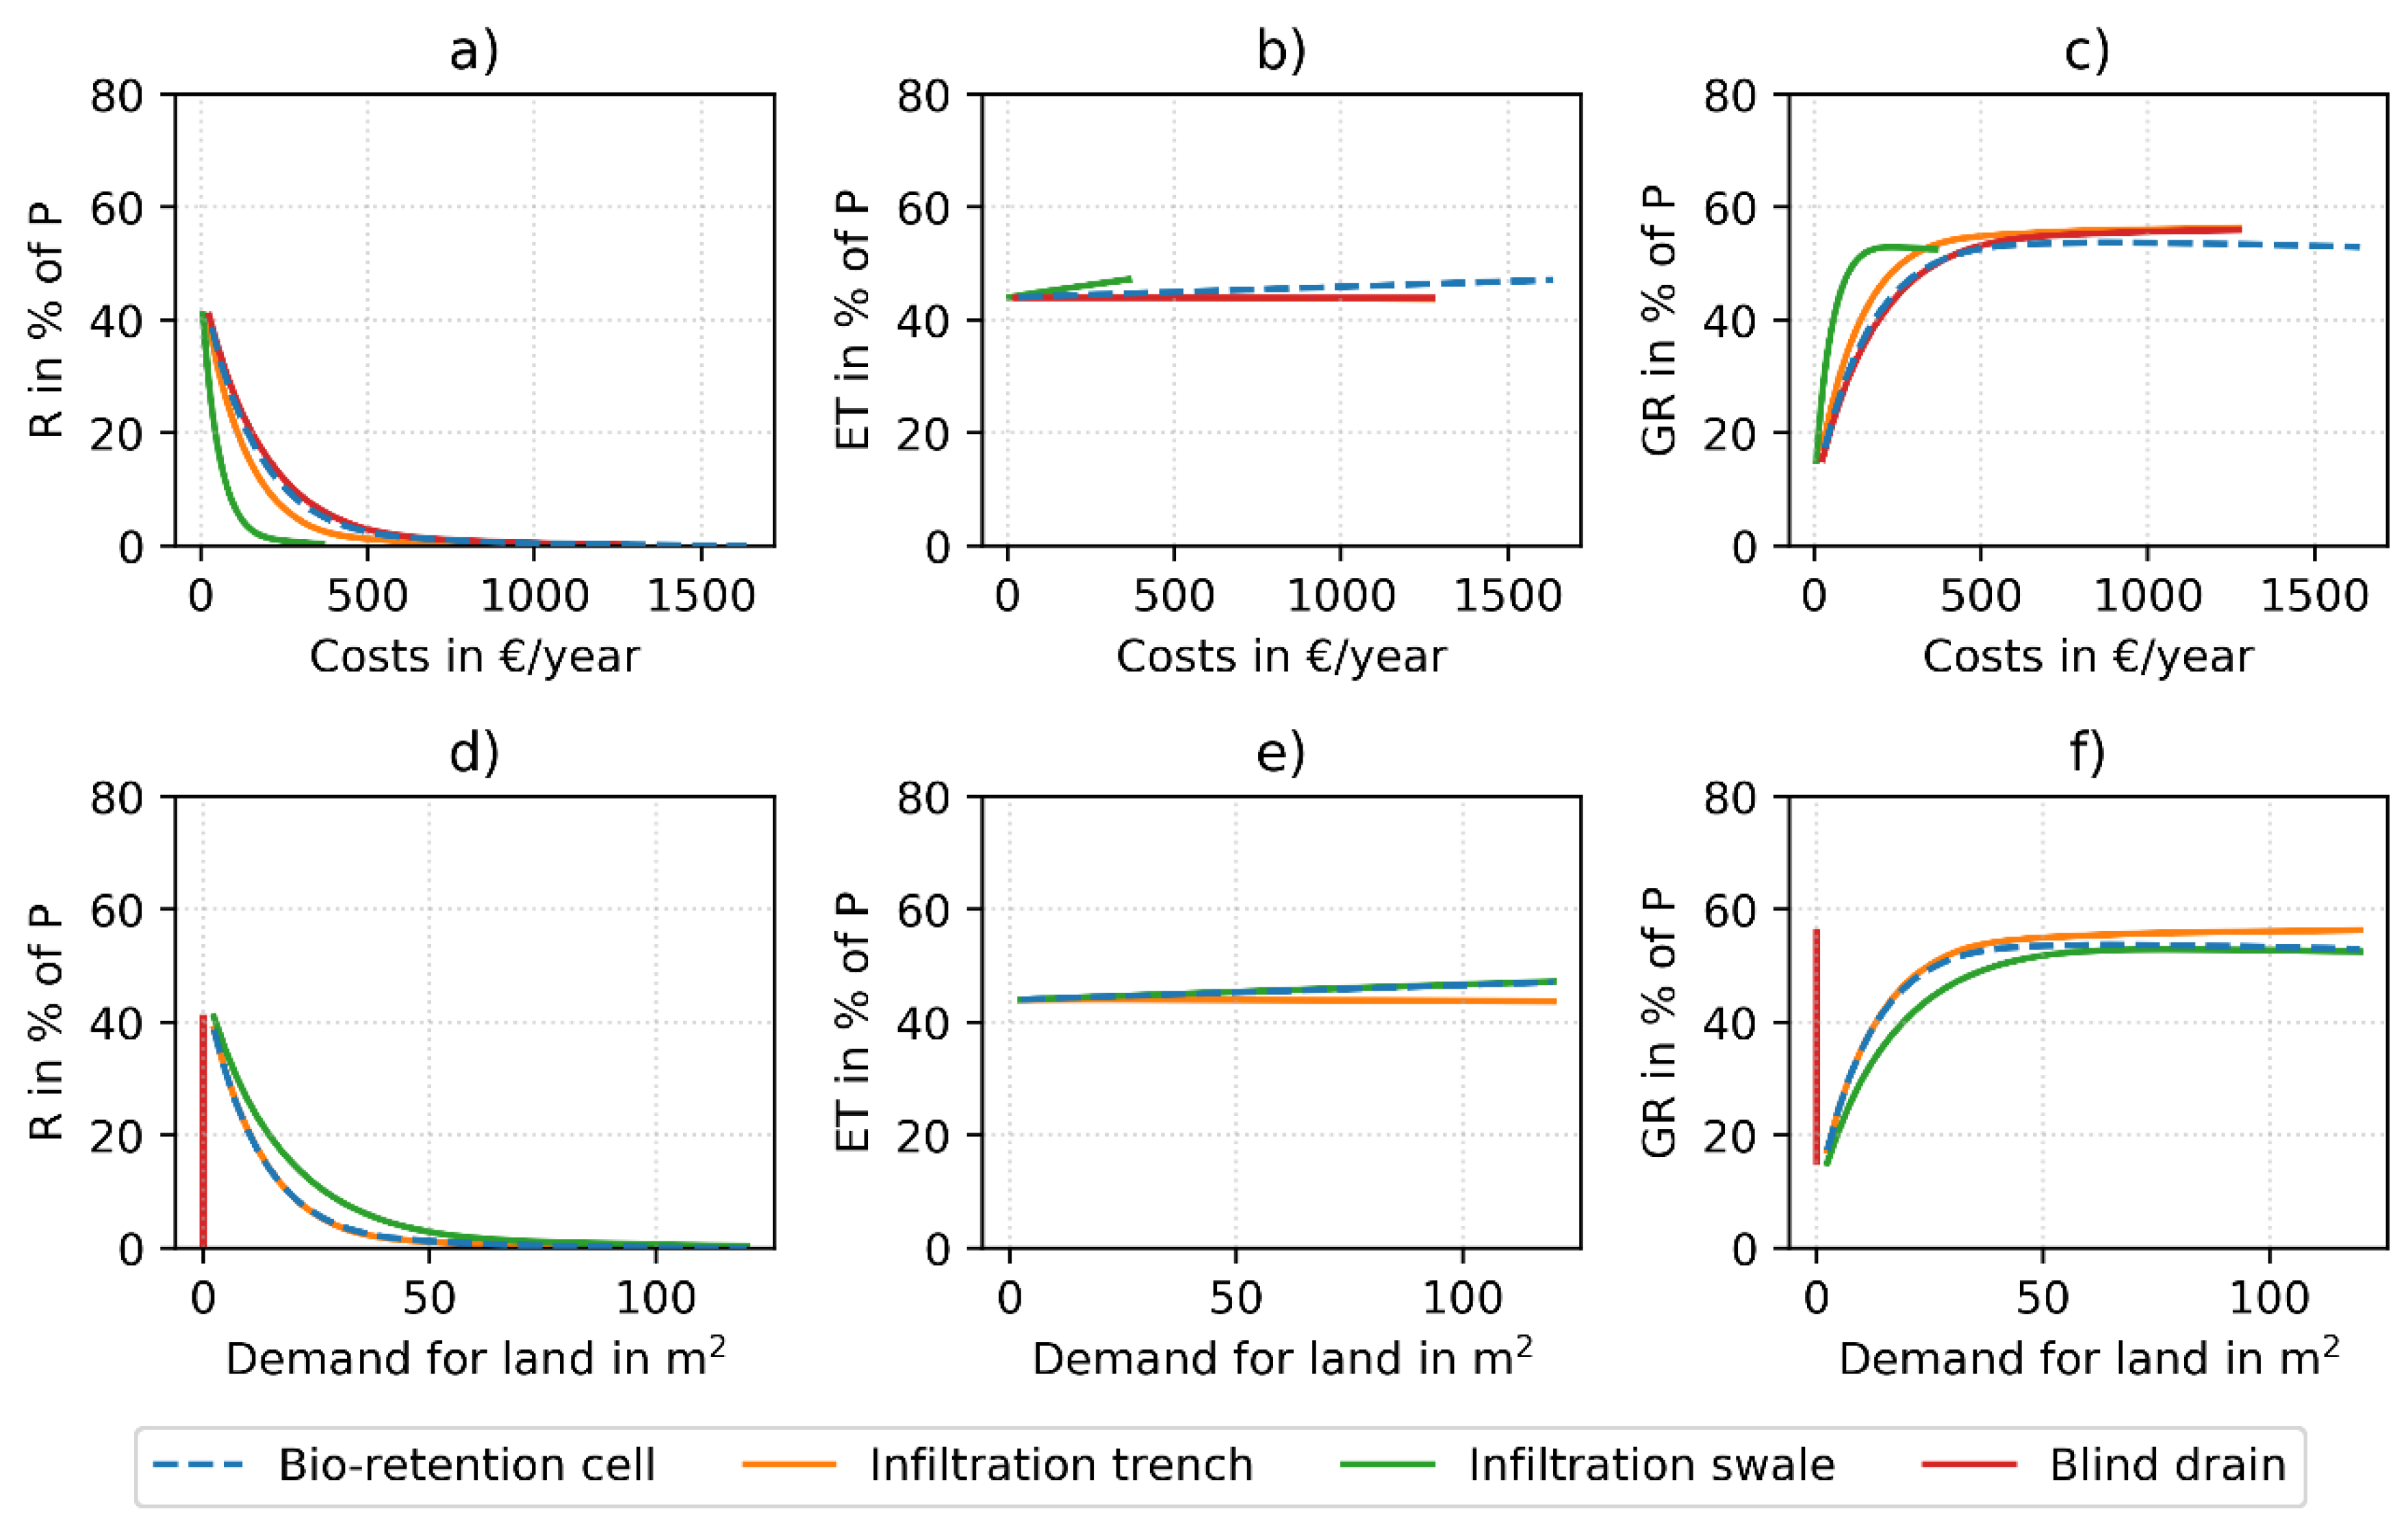
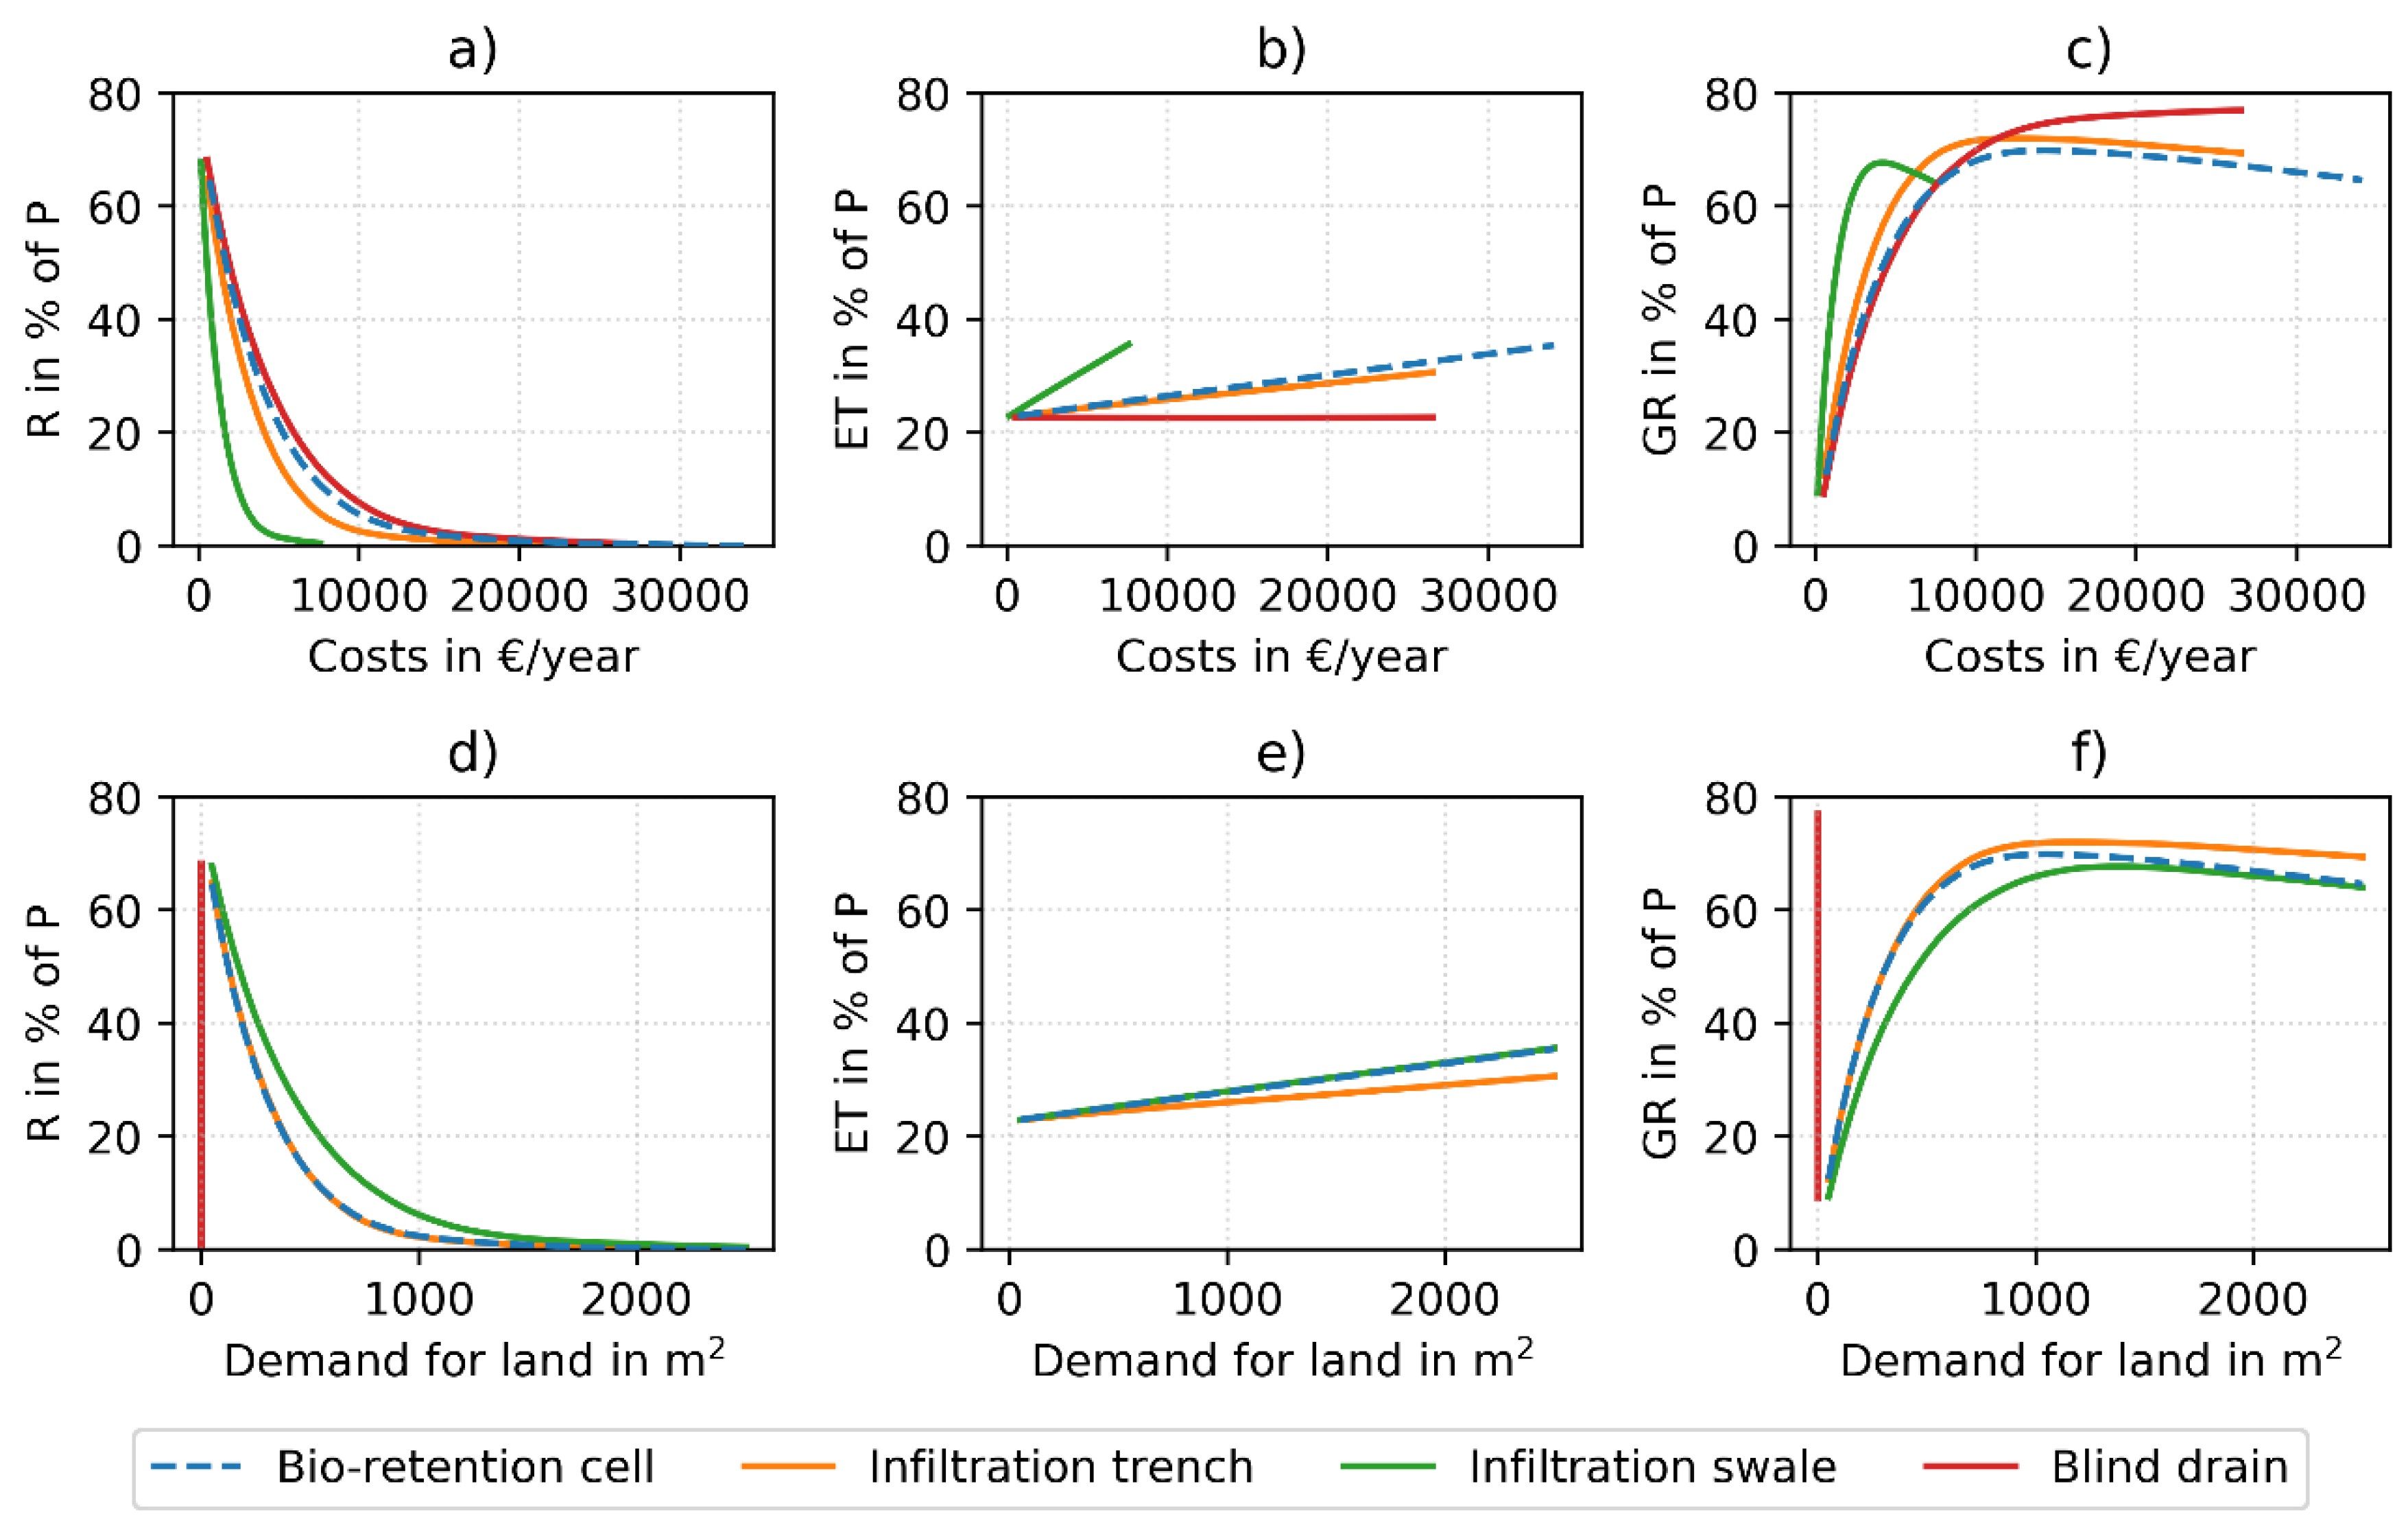
3.1.1. Single LID Strategies

The qualitative results regarding the runoff volume are the same for all three investigated areas while the absolute values reveal some differences. A decrease in runoff volume is identified with an increasing number of LID sections and an associated increase of costs (Figure 4a, Figure 5a and Figure 6a). The larger the LID area, the more stormwater can be retained, resulting in smaller runoff volumes. The decrease curves start steep and flatten, converging to a runoff volume of zero. Thus, the effect of invested money on the runoff volume decreases with an increasing LID area. The results for the infiltration swale show the steepest costs-runoff-curve due to the smallest costs per implemented section. However, regarding the demand for land, the bio-retention cell and infiltration trench show a better and similar performance (Figure 4d, Figure 5d and Figure 6d) because they provide a larger and similar retention volume per LID section. The infiltration trench has smaller costs per section compared to the bio-retention-cell and a larger retention volume due to the surface storage (berm height) compared to the blind drain. Consequently, the performance is better regarding the costs (Figure 4a, Figure 5a and Figure 6a). The underground blind drain does not require land and is a suitable option when land is rare and/or expensive (Figure 4d,e, Figure 5d,e and Figure 6d,e).
The evapotranspiration is expectedly constant for the underground blind drain for all three areas (Figure 4b,e, Figure 5b,e and Figure 6b,e). The value of this constant evapotranspiration depends on the investigated area, thus on the kind of surface above the blind drain (impervious road/parking lot for commercial area, pervious lawn for residential areas) and the ratio of impervious to pervious surface in the area (different dod for residential areas). The kind of surface of sections that are not used for applying LIDs is also the reason for different results between the residential and commercial area with respect to the infiltration trench and evapotranspiration (Figure 4b,e, Figure 5b,e and Figure 6b,e). Applying an infiltration trench to residential areas shows an almost constant evapotranspiration as the evapotranspiration performance of an infiltration trench is similar to those of the appropriate lawn area; stormwater infiltrates into the native soil and is not available for evapotranspiration for a longer period. In contrast, applying an infiltration trench to the commercial area results in an increasing evapotranspiration as the reference evaporation from the road/parking lot is very small. The infiltration swale and bio-retention cell show an equal increase of evapotranspiration with an increasing LID area for all investigated areas as stormwater is retained in the soil layer and available for evapotranspiration (Figure 4b,e, Figure 5b,e and Figure 6b,e). The increase is linear, as SWMM does not account for the response of evapotranspiration to the soil moisture variation [43].
The consequence of a constant evapotranspiration for the blind drain and infiltration trench applied to residential areas is that the groundwater recharge shows the complete opposite of the runoff volume (Figure 4c,f, Figure 5c,f and Figure 6c,f). An increasing LID size results in an increase of the groundwater recharge. The increase curve mirrors the runoff volume decrease curve. The result for the infiltration trench applied to the commercial area, the infiltration swale, and the bio-retention cell is similar, except a small decrease of groundwater recharge for larger LIDs (Figure 4c,f, Figure 5c,f and Figure 6c,f). This is caused by the increasing retention volume, resulting in a runoff volume that converges to zero and an evapotranspiration that increases linearly.
It is obvious that the extent of the mentioned effects of applying single LIDs on the water balance differs between the investigated types of area. It increases with an increasing degree of imperviousness. The low-developed residential area already has a large lawn area resulting in a small runoff volume and high evapotranspiration in the initial state, whereas the commercial area shows the highest potential of applying LIDs.

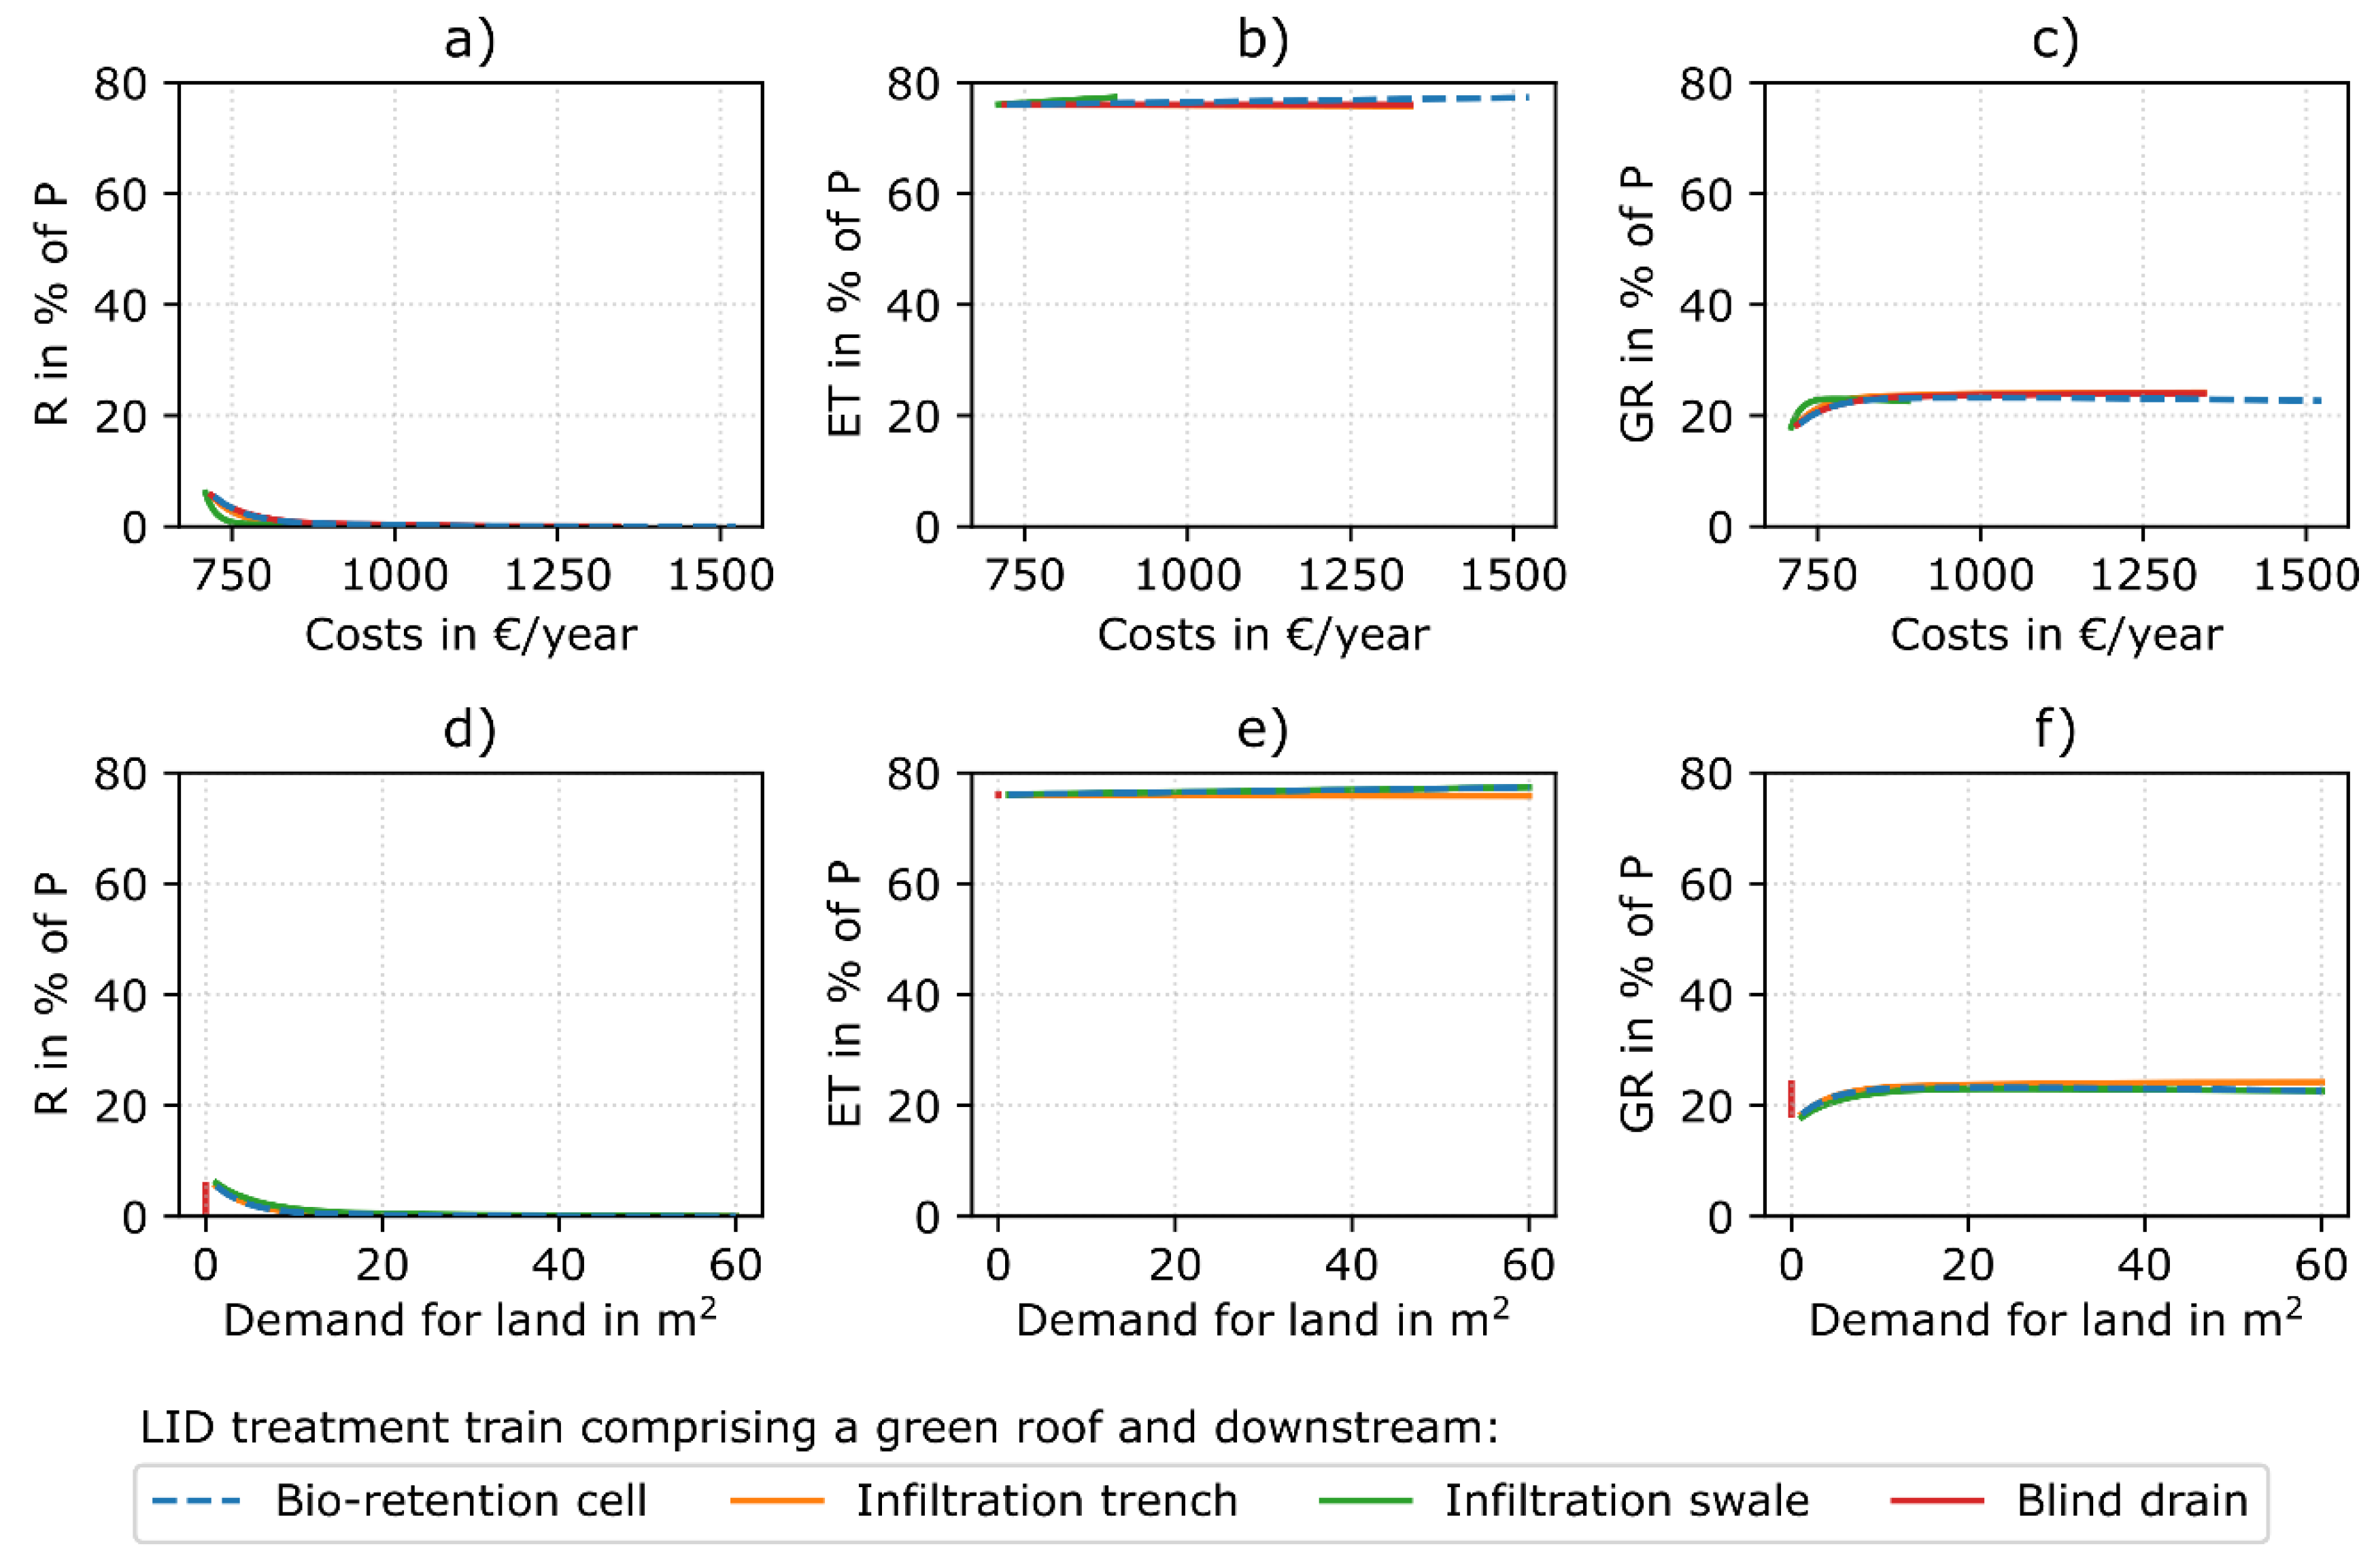
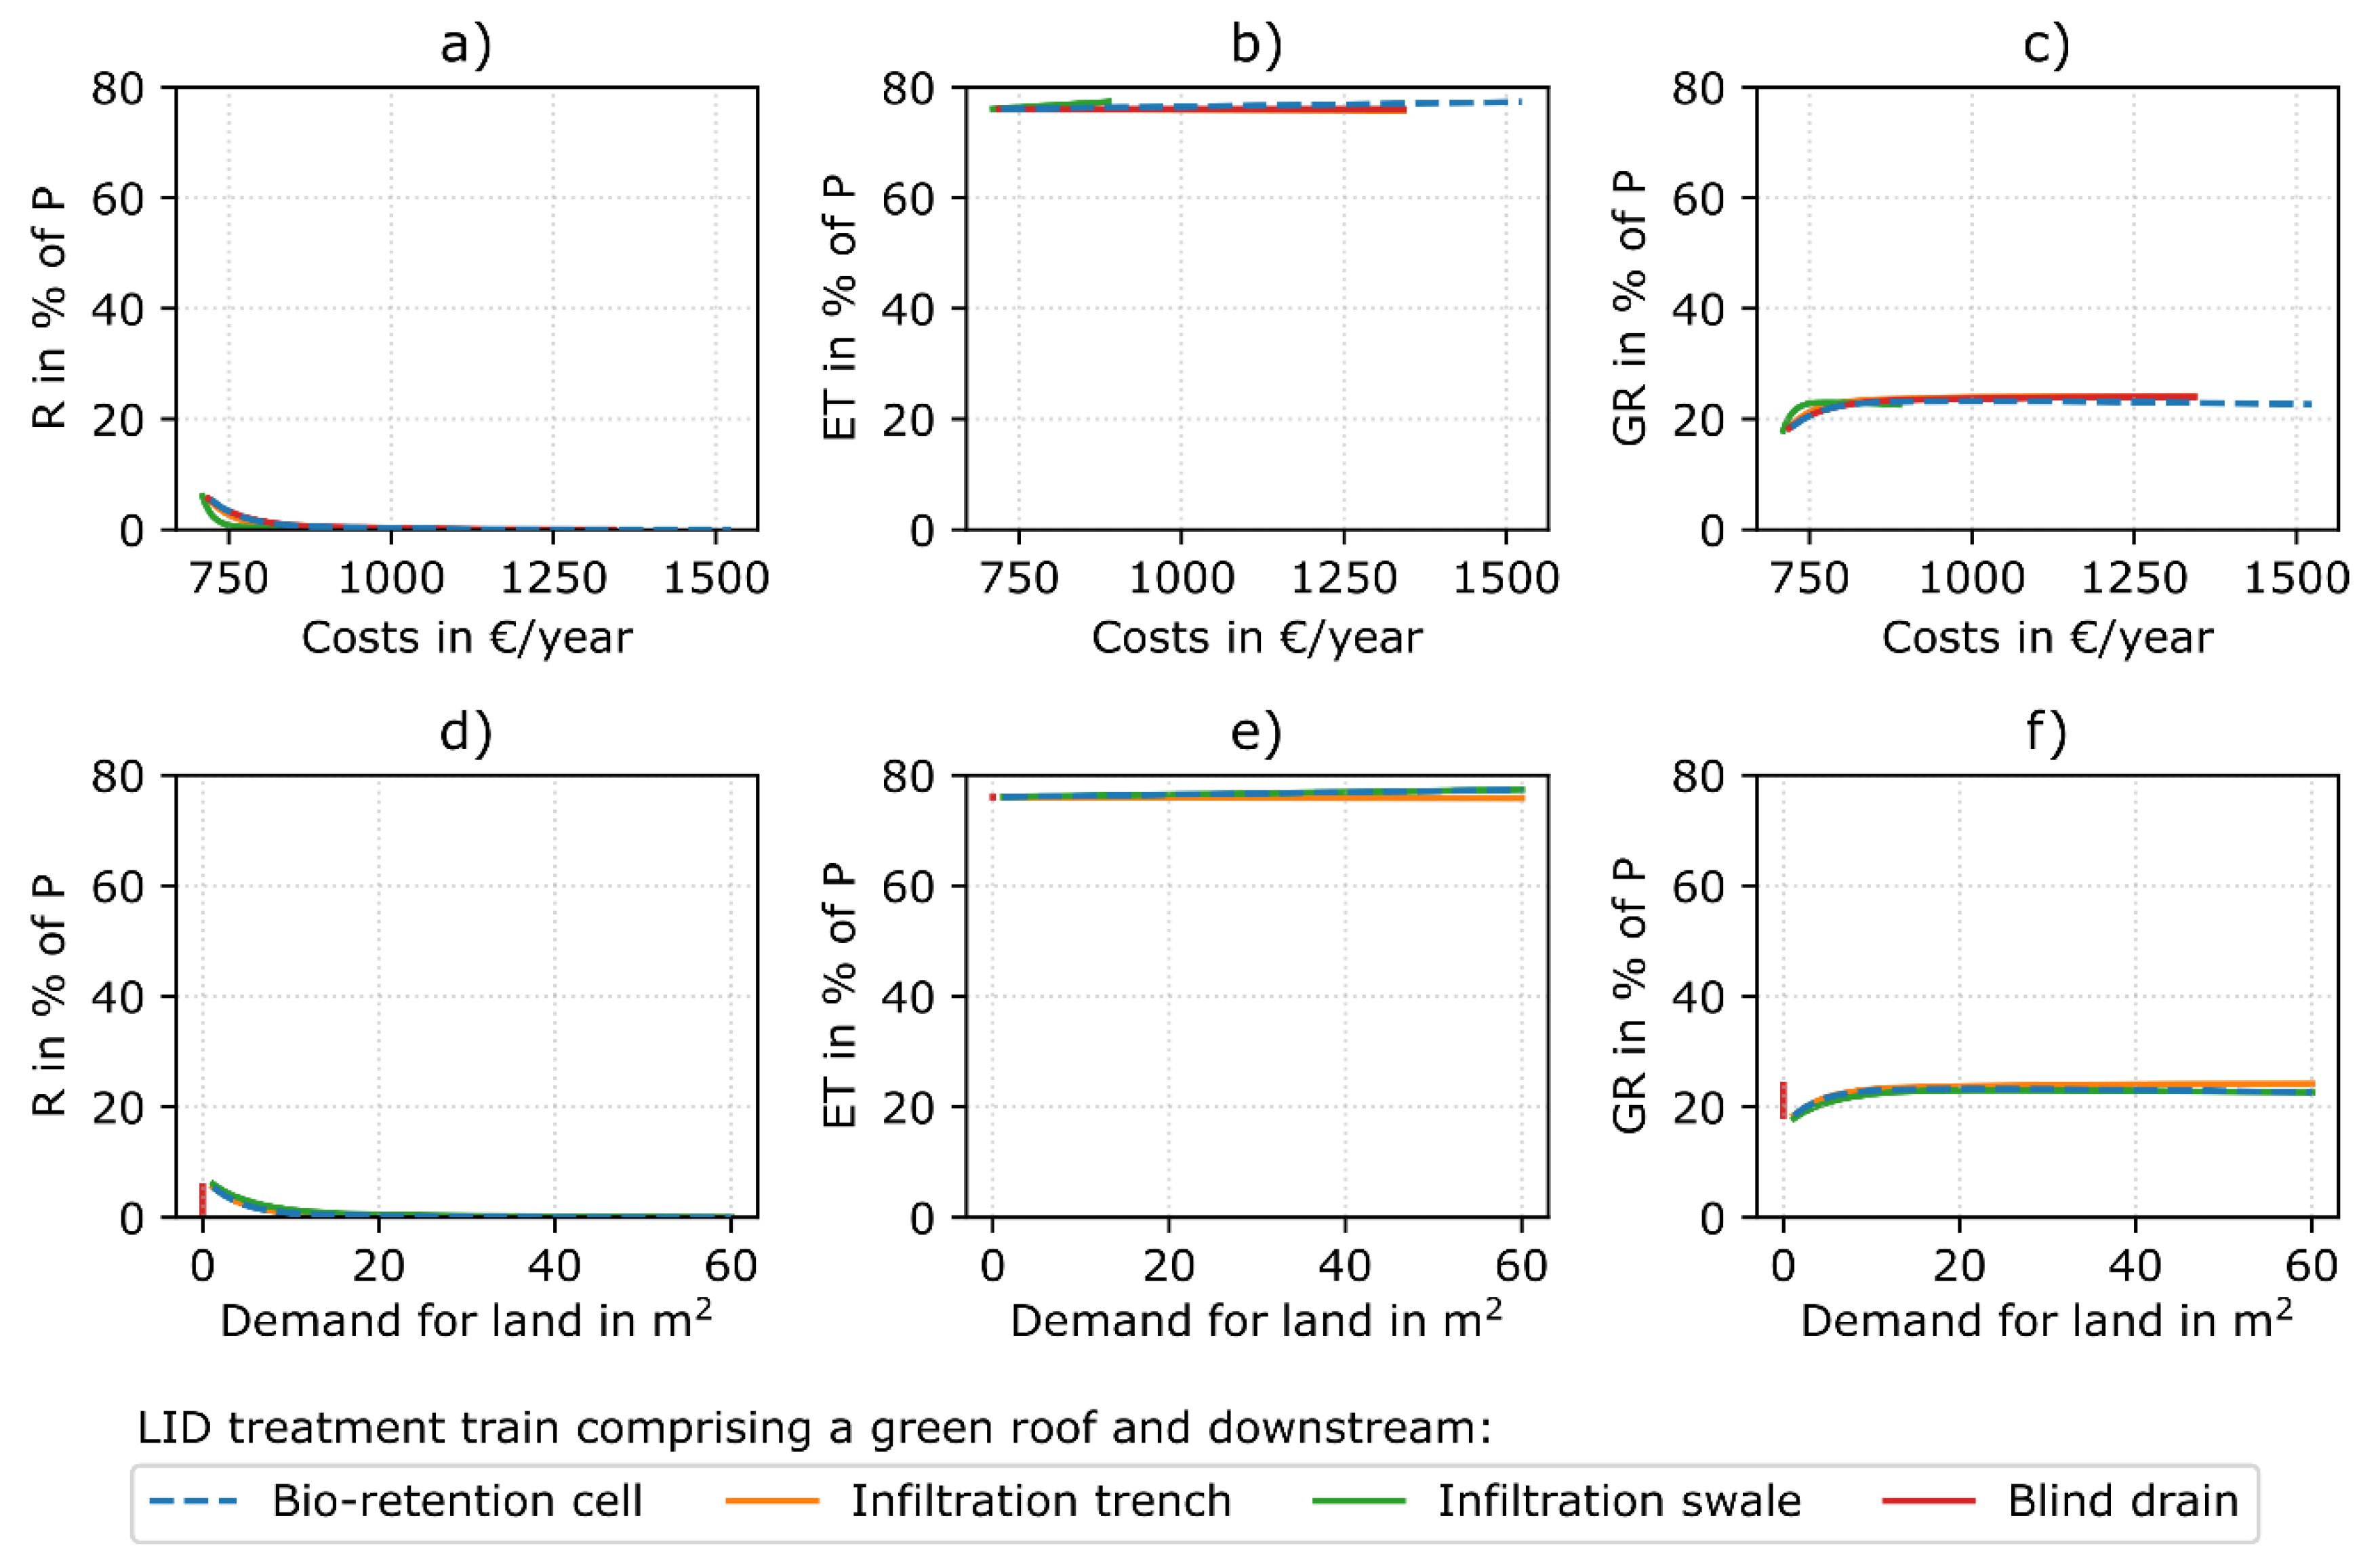
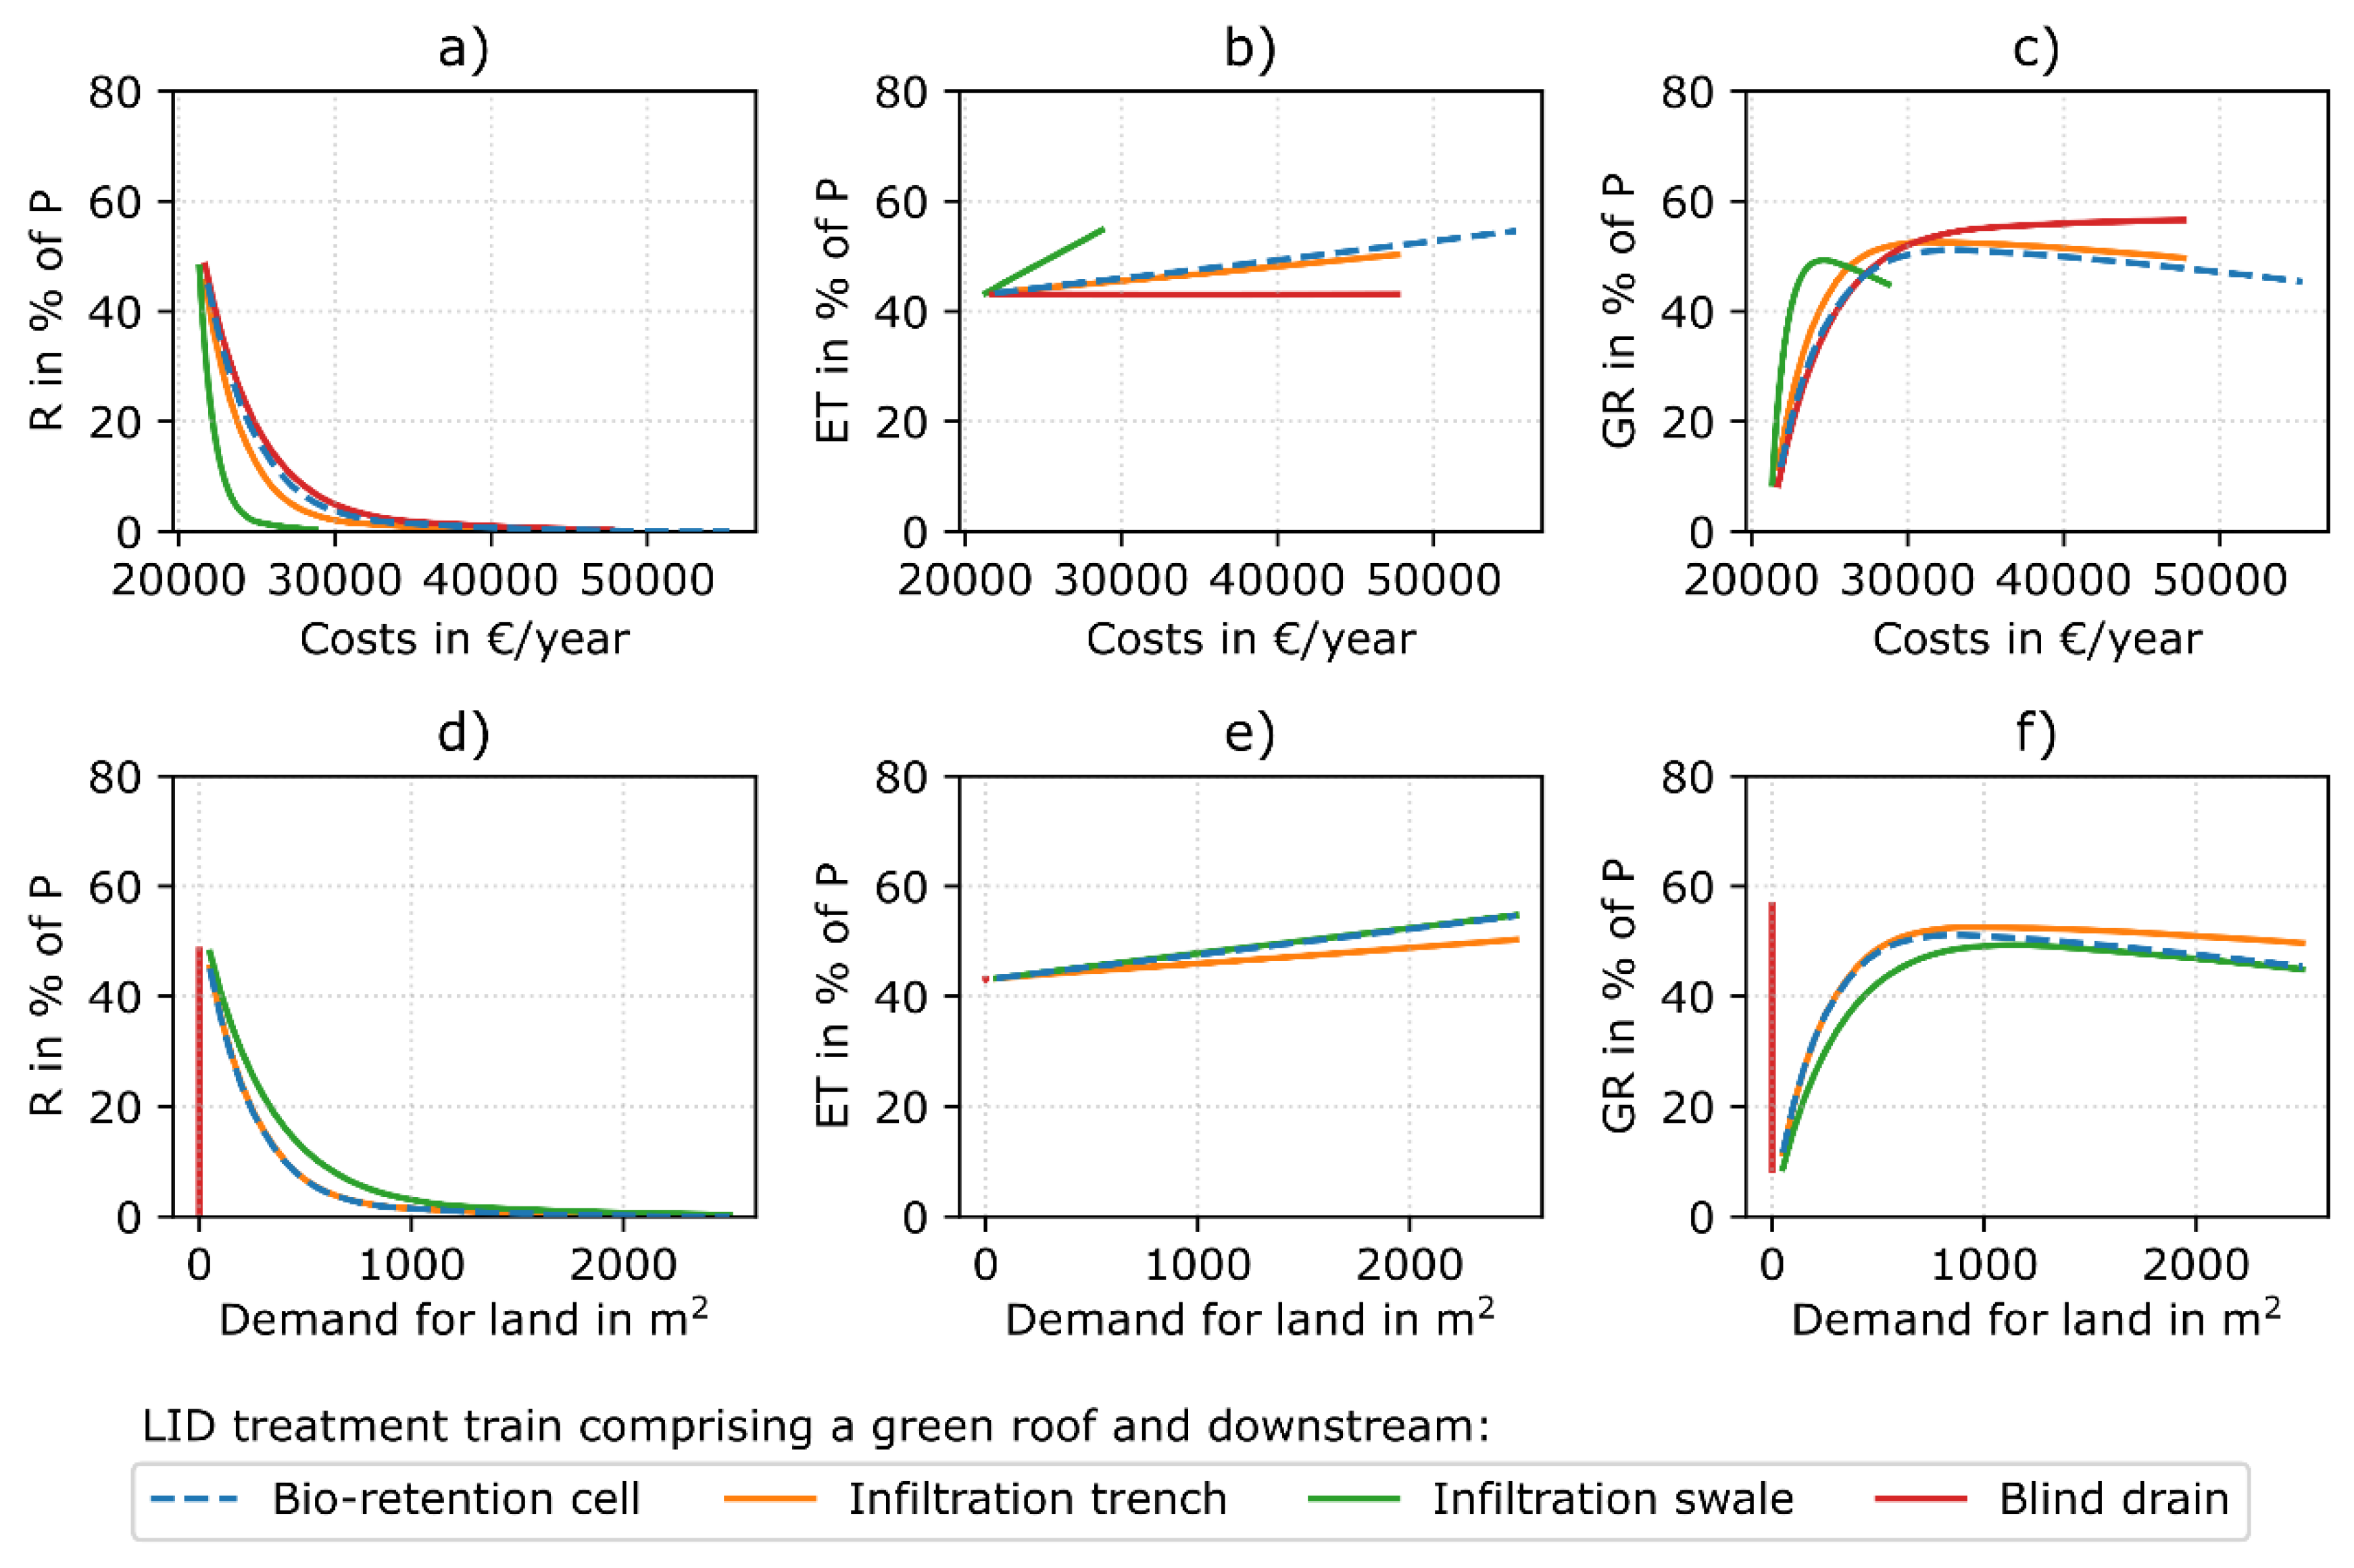
3.1.2. Two-Part LID Treatment Train with Green Roof

The application of a green roof within the scope of a LID treatment train shows two general effects on the water balance. The first is related to the different hydrologic performance of the green roof itself compared to a tiled roof. The second is related to the consequently changed runoff volume to the downstream LID.
The green roof retains stormwater, which is consequently available for evapotranspiration. Thus, the runoff volume from the roof decreases, whereas evapotranspiration increases compared to the scenarios with a tiled roof (compare subplots a and b of Figure 4, Figure 5 and Figure 6 with tiled roof and Figure 7, Figure 8 and Figure 9 with green roof).
Consequently, the runoff to the downstream LID is reduced compared to scenarios with a tiled roof, resulting in an overall reduced runoff volume, whereas the groundwater recharge is decreased. The overall evapotranspiration increases due to the substantially increase of roof evapotranspiration. The effect of increasing the downstream LID area of infiltration swale, infiltration trench, bio-retention cell, and blind drain is basically the same as for the single LID investigations; the runoff volume decreases whereas the groundwater recharge increases. The evapotranspiration increases for the downstream bio-retention cell and infiltration swale and is constant for the blind drain. The application of the infiltration trench shows the already mentioned difference between residential and commercial areas, namely a constant evapotranspiration for the residential areas and an increasing evapotranspiration for the commercial area.
The magnitude of effects applying a green roof differs again between the investigated areas. The results for the low-developed residential area show that downstream LIDs have very little impact on the water balance (Figure 7). The green roof and lawn area generate small runoff volumes and a high evapotranspiration. Implementing an LID treatment train with green roof on a high-developed residential area shows larger but still small effects on the water balance (Figure 8). In contrast, as a large part of the commercial area consists of an impervious road/parking lot, the application of downstream LIDs shows the largest effect (Figure 9).

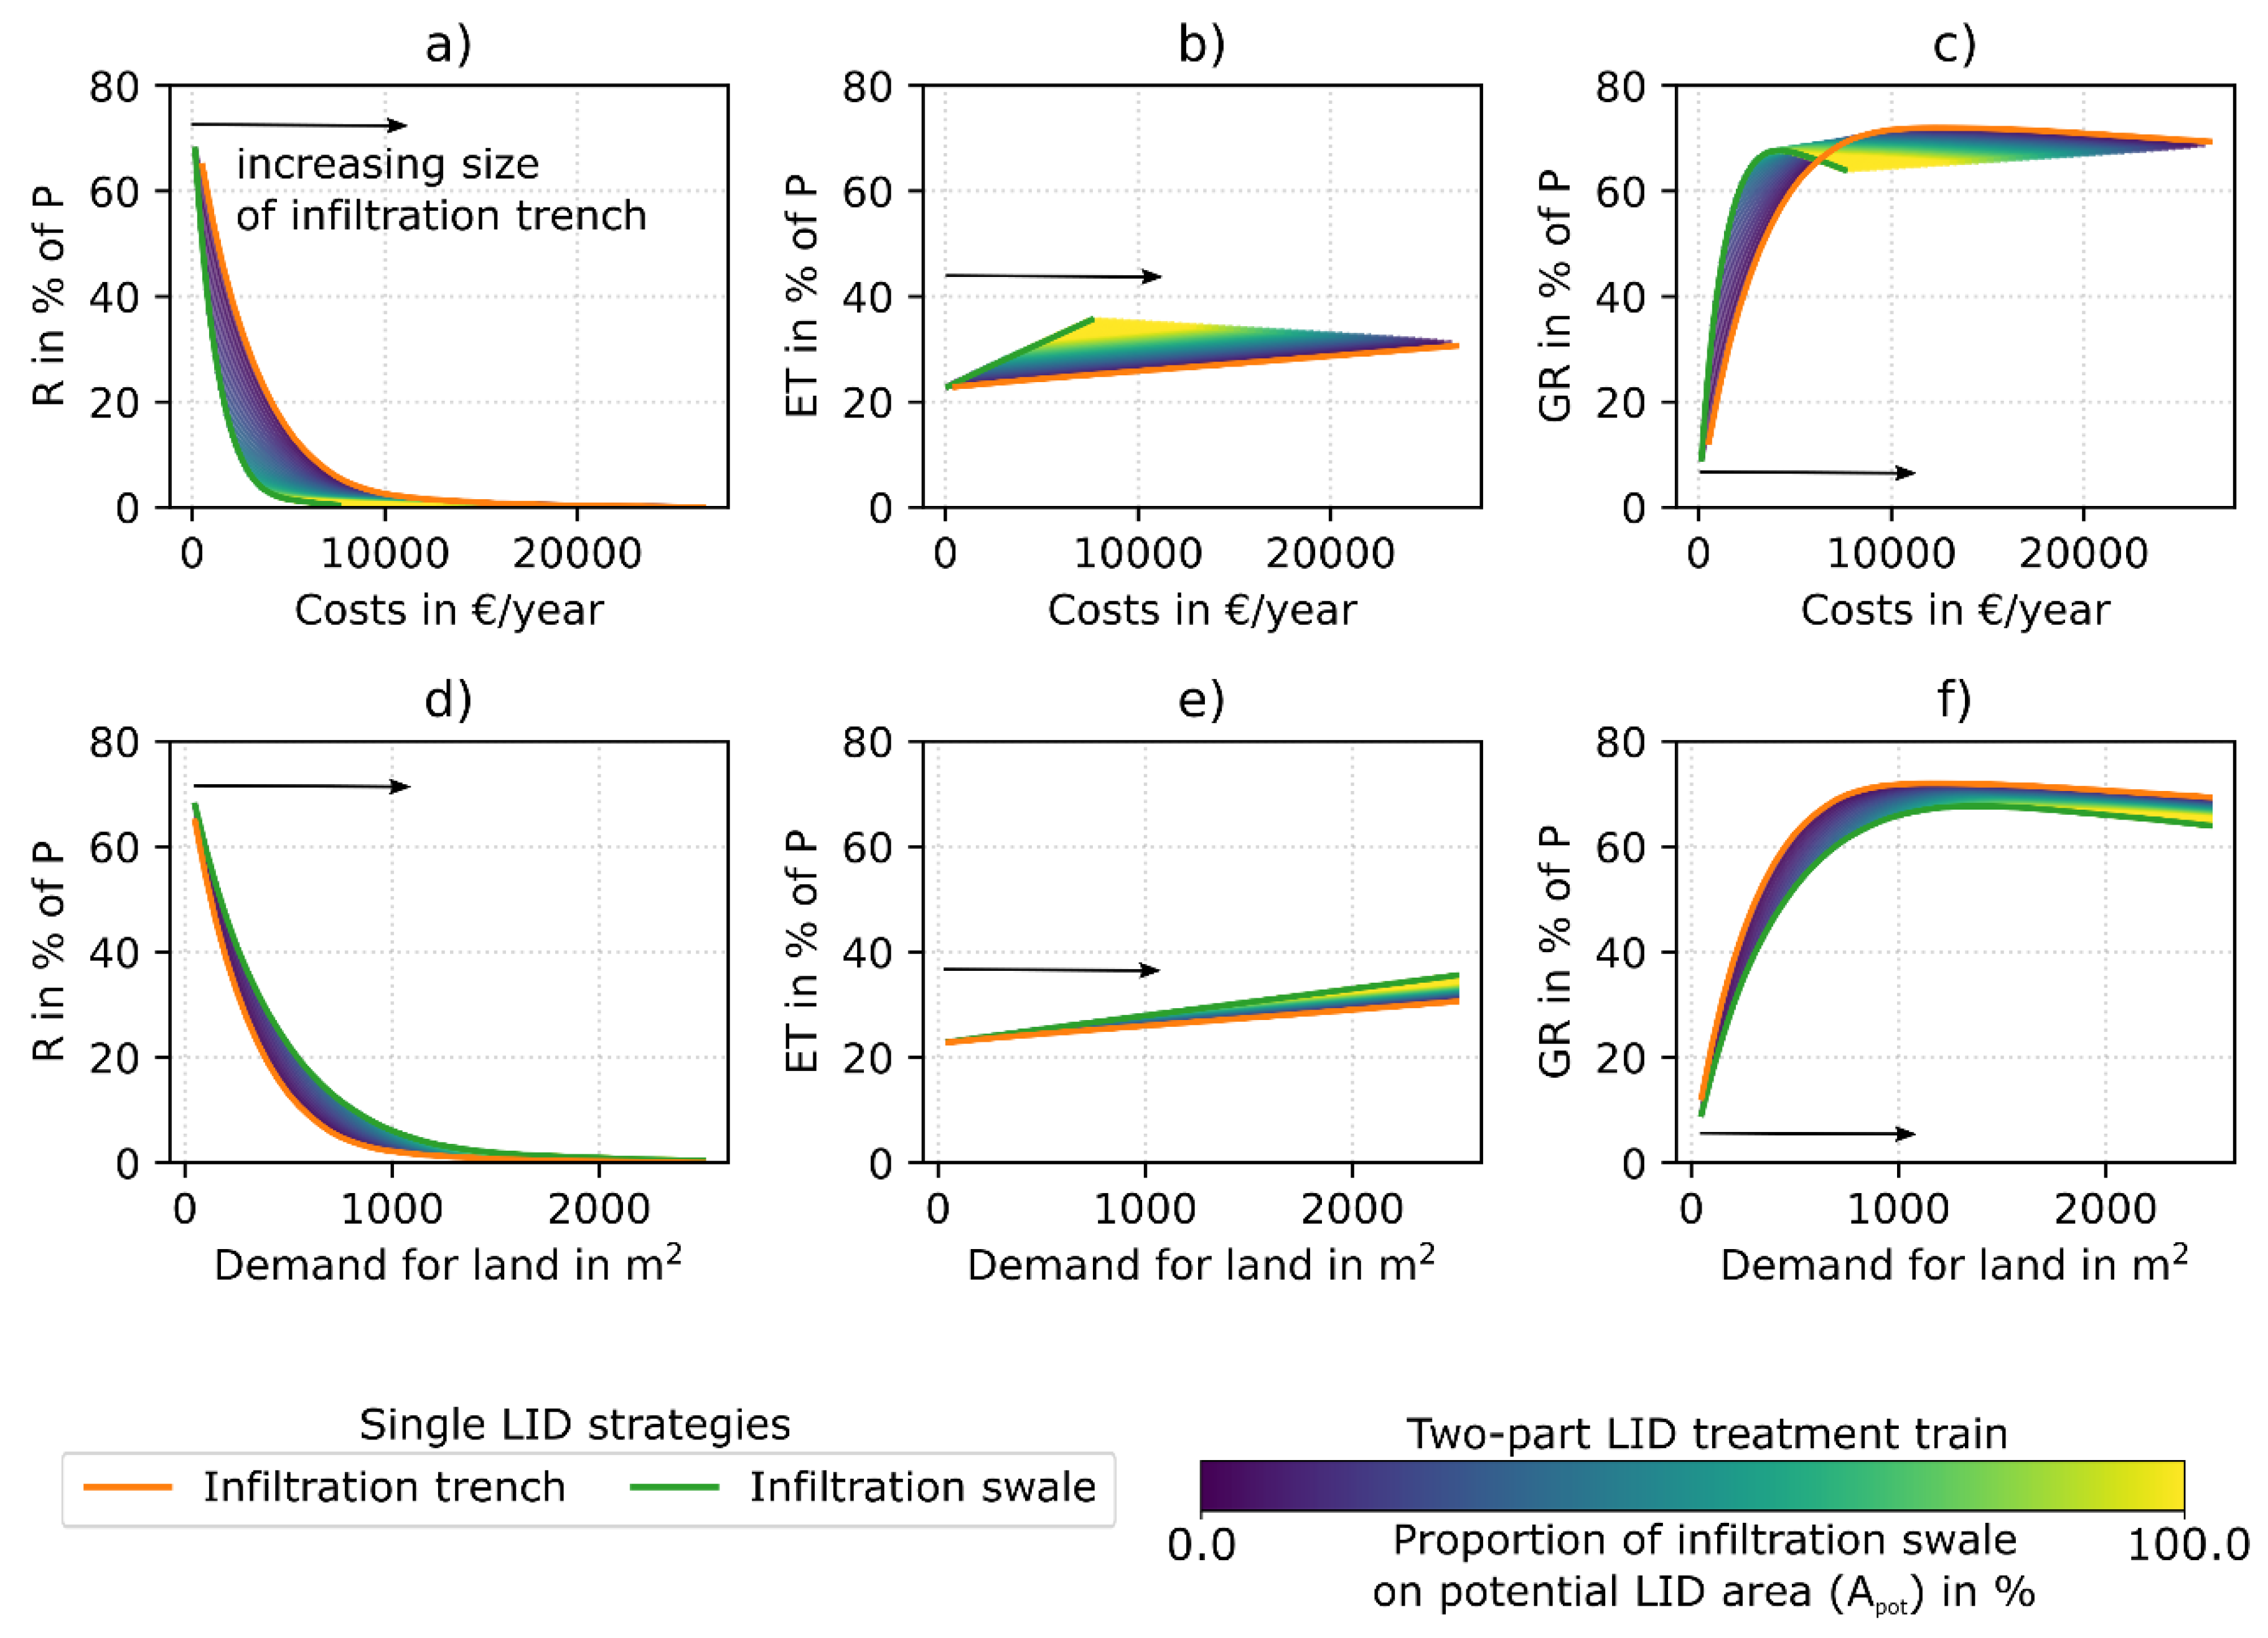
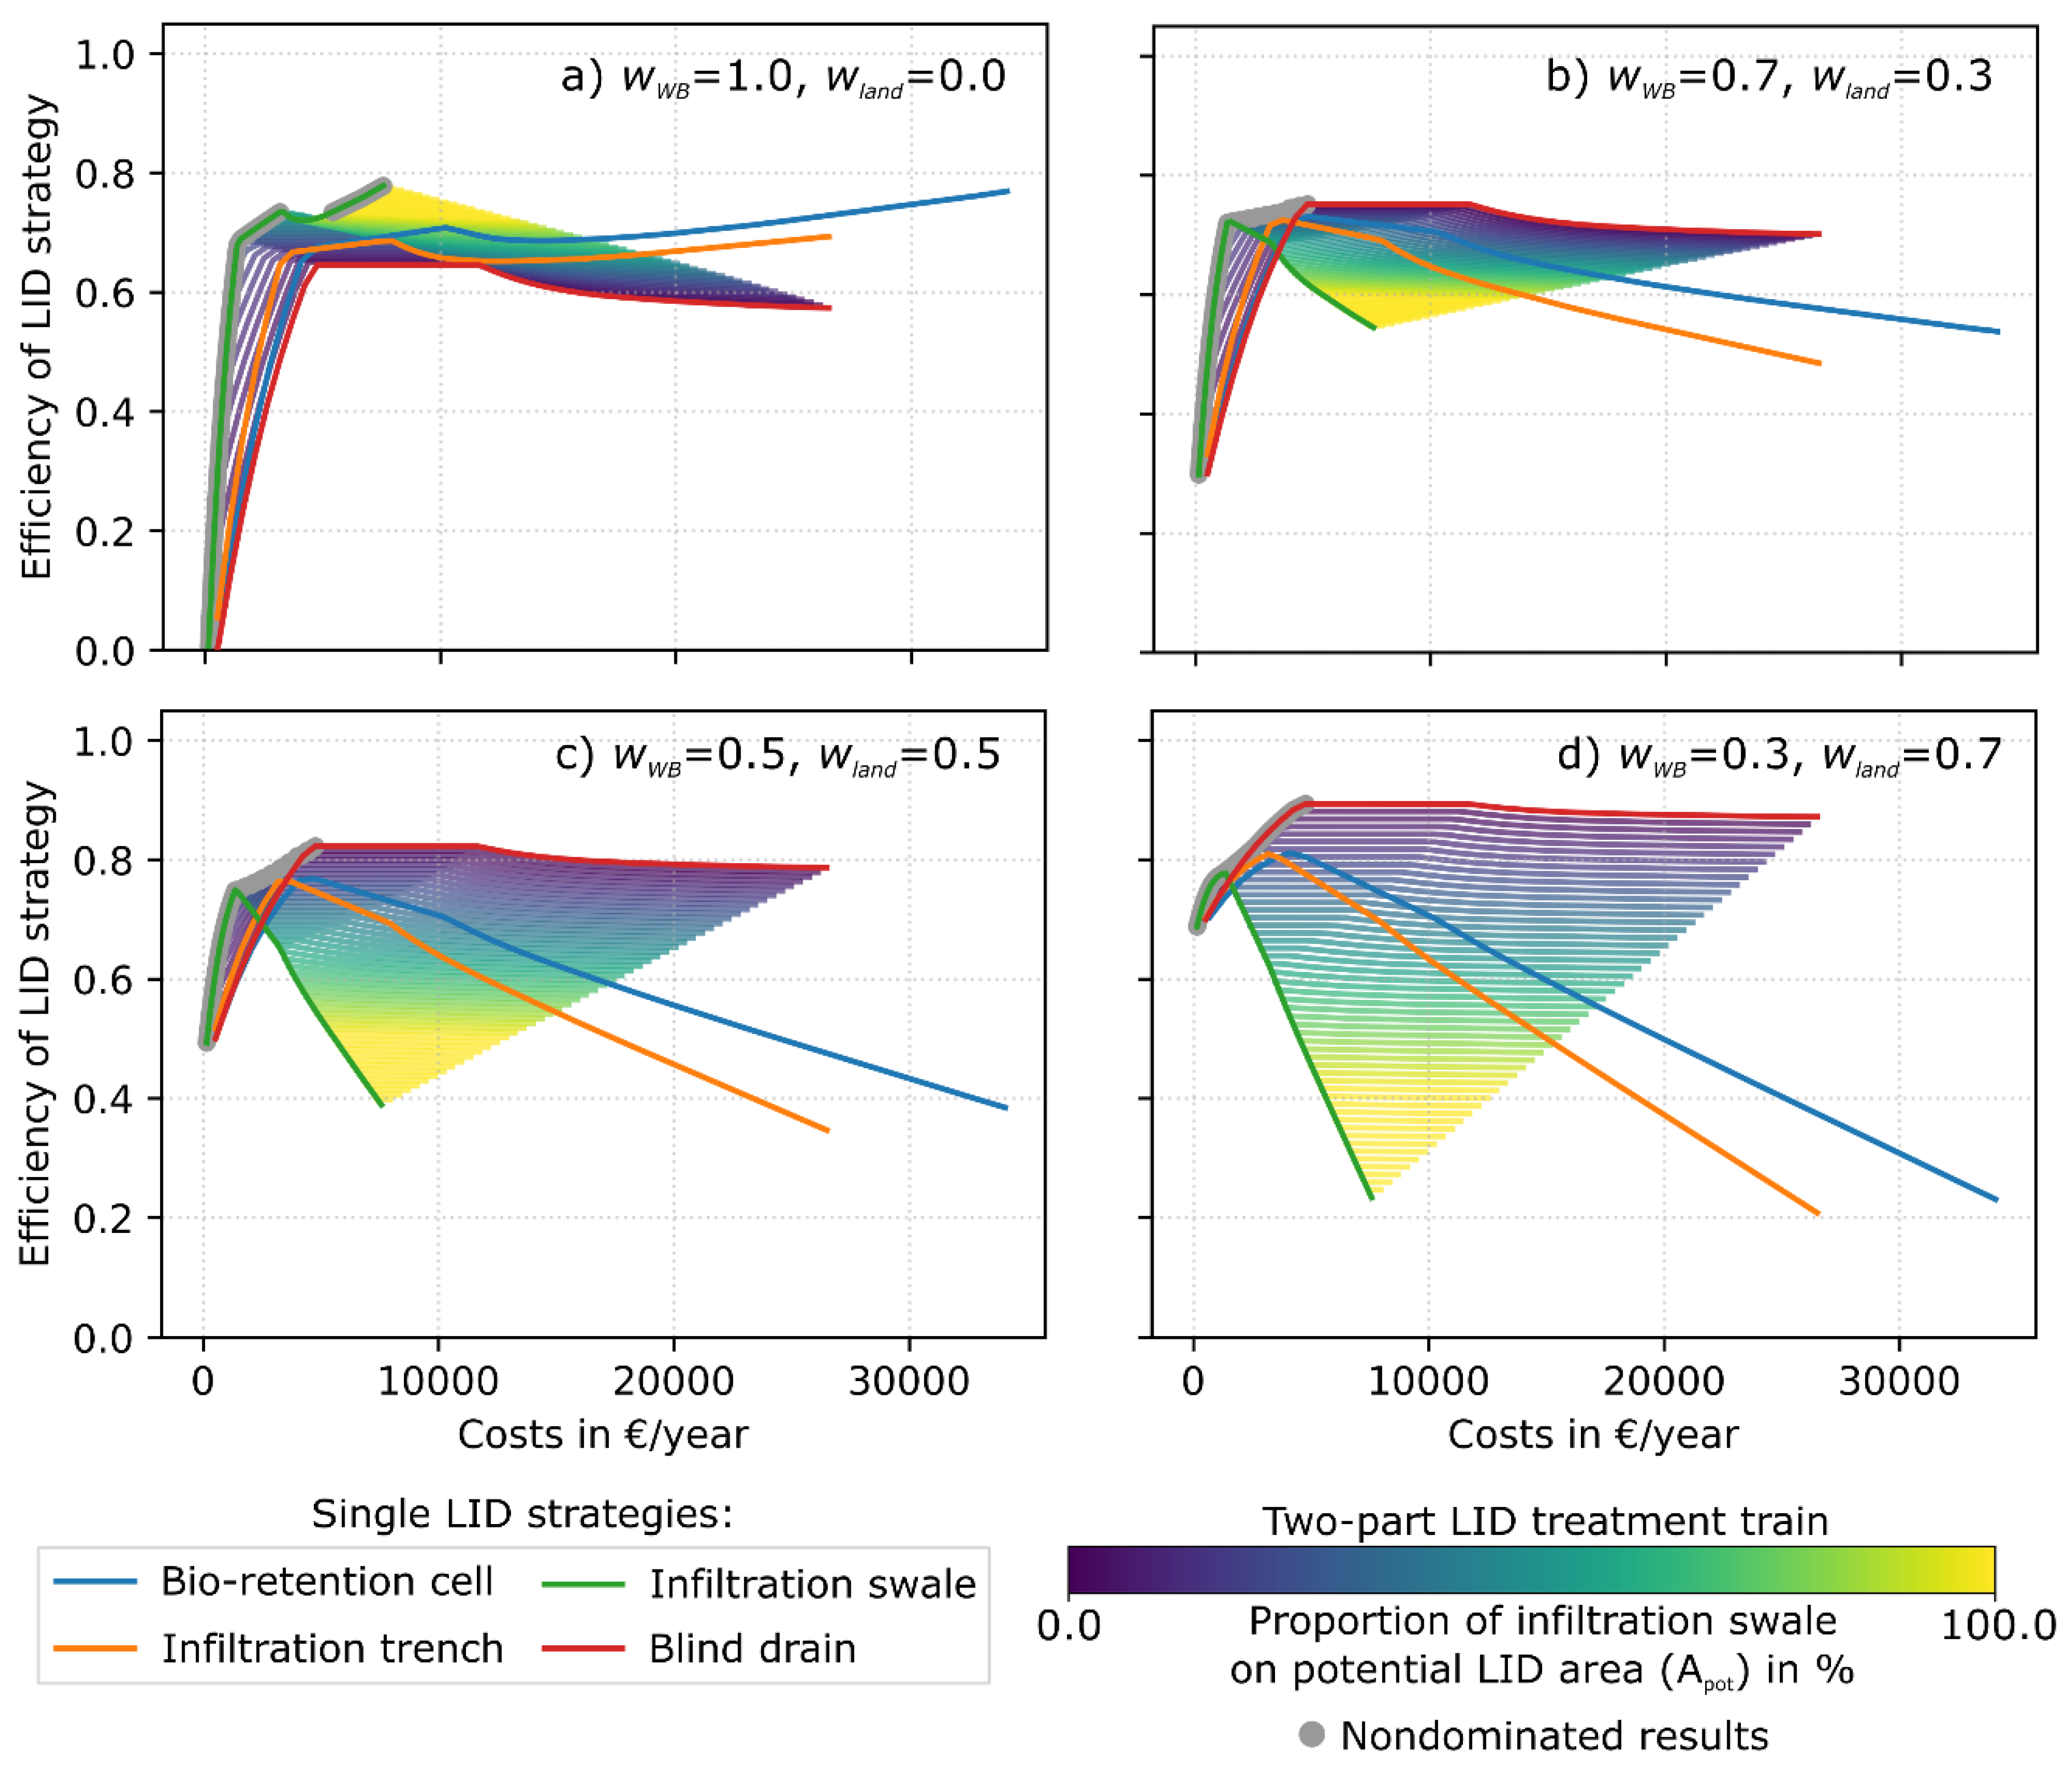
3.1.3. Two-Part LID Treatment Train: Infiltration Swale—Infiltration Trench

The results for the single LID strategies and the two-part LID treatment trains with green roof showed that the largest effect on the water balance is obtained for the commercial area, whereas the impact is small for the residential areas, especially for the low-developed residential area. As the qualitative performance is similar, the commercial area is used for illustrating effects of other LID strategies.
The investigations on applying single LIDs showed that the infiltration swale performs well regarding the costs, but has some shortcomings regarding the demand for land, e.g., compared to an infiltration trench. Consequently, an LID treatment train comprising an infiltration swale and a downstream infiltration trench is promising. This assumption is verified by the conducted simulations (Figure 10).
LID treatment trains provide the possibility of selecting LID strategies as a kind of trade-off between water balance, costs, and demand for land. An example illustrates this conclusion: Assuming a targeted runoff volume of 10%, applying only an infiltration swale results in costs of €2500 per year and a demand for land of 815 m², whereas applying an infiltration trench results in costs of €6100 per year and a demand of land of 573 m² (Figure 10). The mentioned strategies with a single LID would result in an evapotranspiration of 27% (infiltration swale) or 24.7% (infiltration trench). In contrast, an LID treatment train with a demand for land of 694 m² comprising equal fractions of infiltration swale and infiltration trench results in costs of €4733 per year. The mentioned LID treatment train results in the targeted 10% runoff volume and an evapotranspiration of 25.8%.
Selecting different proportions for the infiltration trench and infiltration swale on the total LID area moves the results in a certain direction. Assuming a certain limit for costs, increasing the proportion of the infiltration swale results in smaller runoff volumes and larger evapotranspiration, but is associated with a larger demand for land. On the other hand, assuming a certain limit for the demand of land, increasing the proportion of the infiltration swale results in larger runoff volumes and larger evapotranspiration, associated with lower costs. Thus, certain goals (e.g., desired runoff volume, evapotranspiration, groundwater recharge, maximal costs, or demand for land) can be achieved by selecting the proportion of the infiltration trench and infiltration swale within the scope of an LID treatment train.

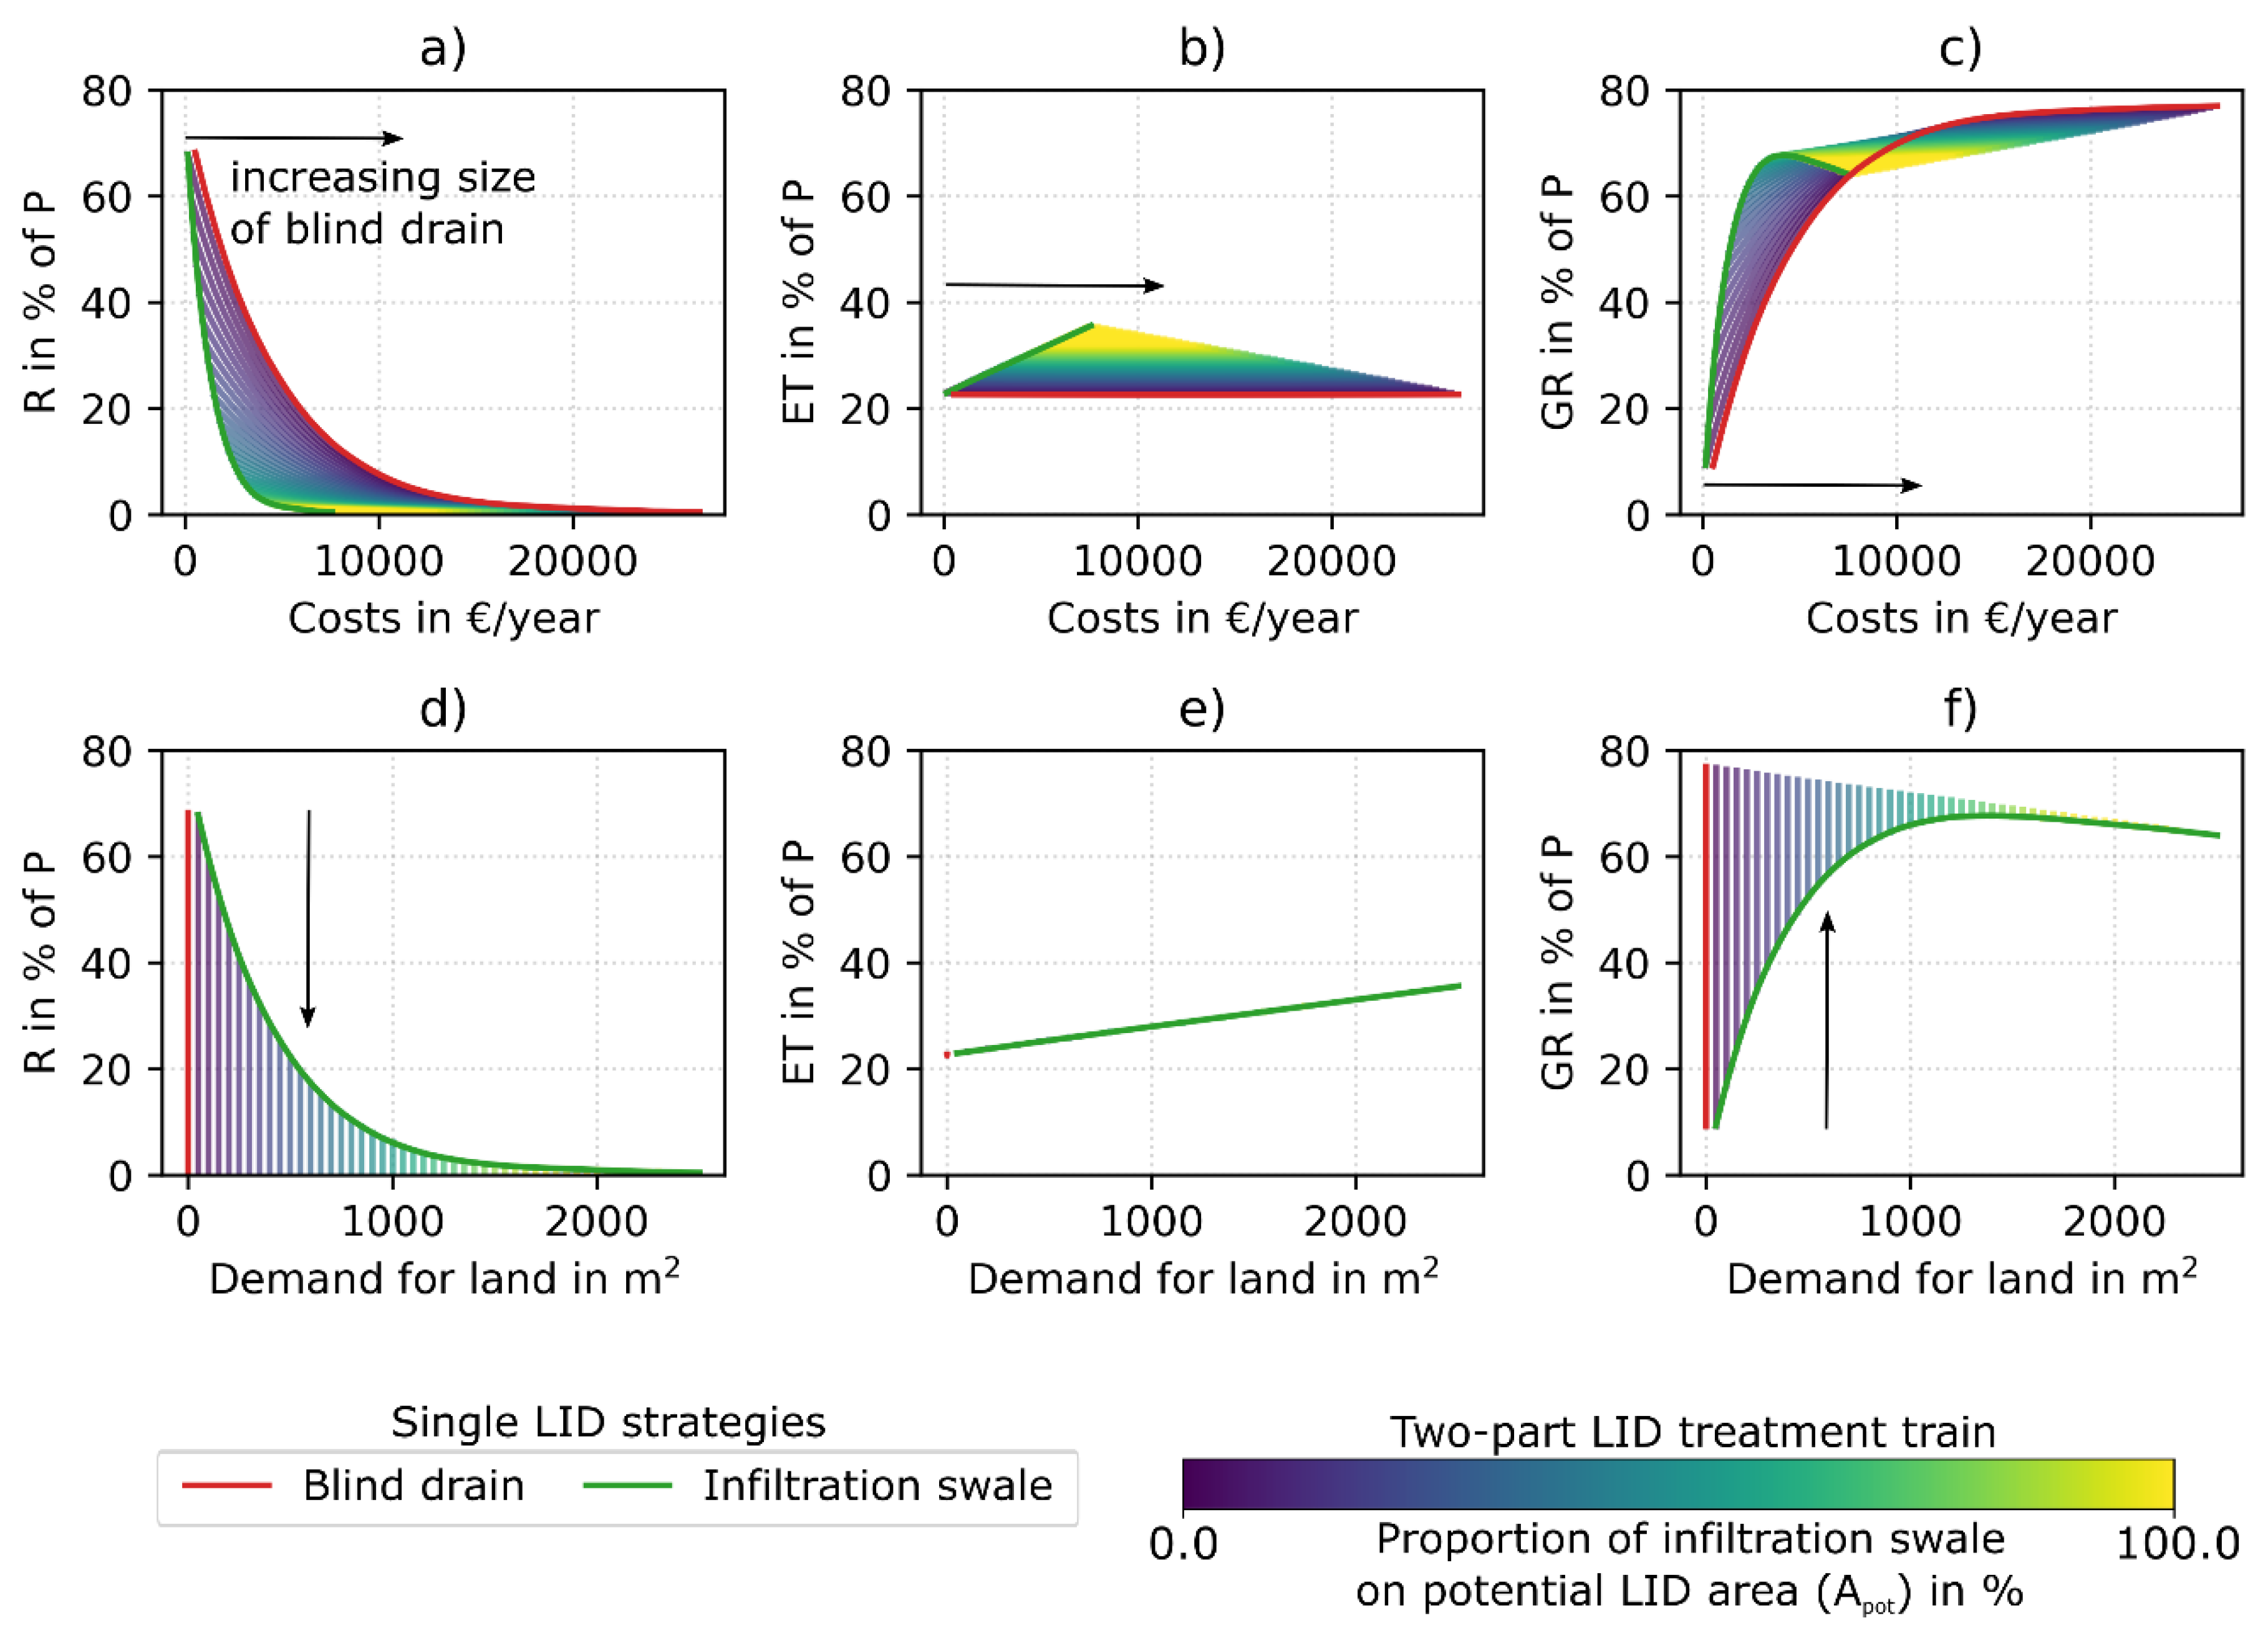
3.1.4. Two-Part LID Treatment Train: Infiltration swale—Blind Drain

The investigations on single LIDs revealed a good performance in runoff volume reduction and an increase of groundwater recharge with an outstanding demand for land of zero for the application of a blind drain. However, the evapotranspiration performance is basically null. Combining the blind drain with an infiltration swale in an LID treatment train can mitigate this fundamental shortcoming (Figure 11).
The infiltration swale accounts for an increase of evapotranspiration (Figure 11b,e), while the downstream blind drain decreases the runoff volume and increases the groundwater recharge without causing an additional demand for land (Figure 11d,f). Thus, this LID treatment train is suitable to control/improve the complete water balance, especially when land is rare and/or expensive. The size of the infiltration swale can be chosen due to the maximal land available and/or due to economic aspects. The size of the blind drain is either limited by a defined limit of costs or can be determined to control the runoff volume of the LID treatment train.

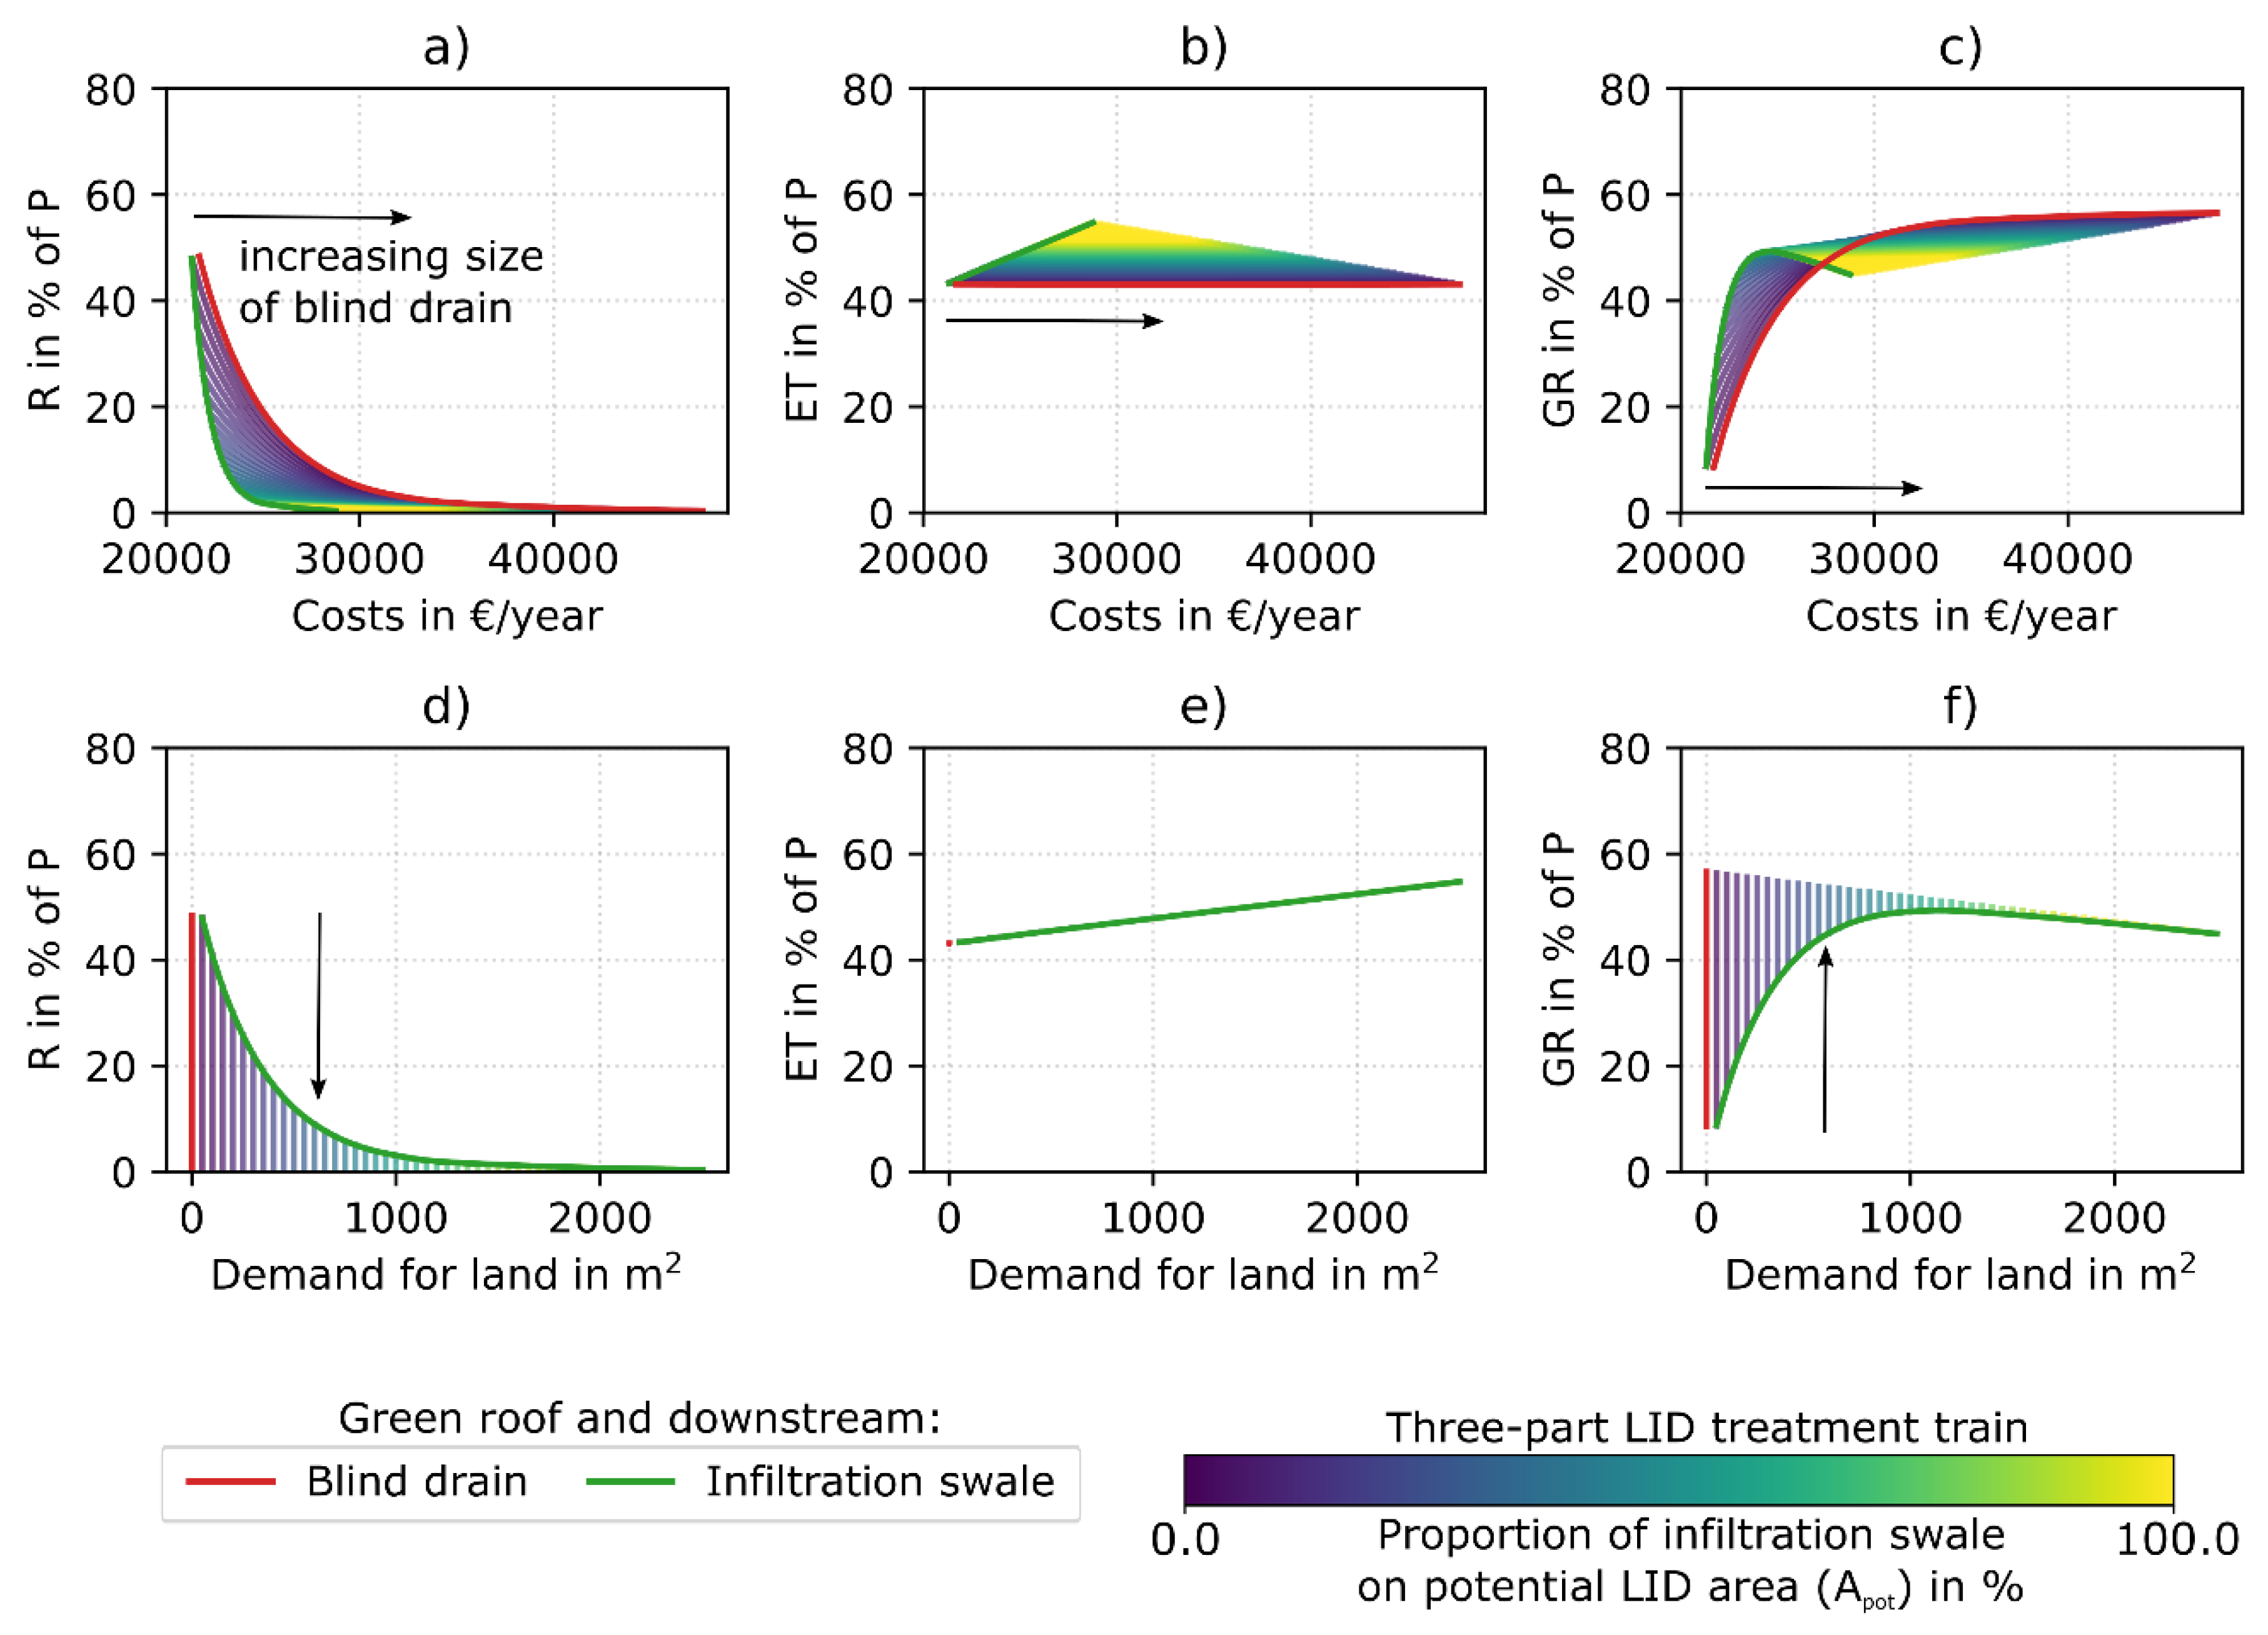
3.1.5. Three-Part LID Treatment Train: Green Roof—Infiltration Swale—Blind Drain

The application of a green roof within a three-part LID treatment train with a downstream infiltration swale and a blind drain shows the same effects as identified for the two-part LID treatment trains with a green roof (see Section 3.1.3): The overall runoff volume and groundwater recharge decrease, whereas the evapotranspiration increases (Figure 11a,b and Figure 12a,b) as stormwater is retained and evaporated on the green roof.
The green roof is especially valuable for the evapotranspiration (Figure 11b and Figure 12b, increase of ca. 21 percentage points) while causing substantially higher costs (additional €21,240 per year). The demand for land in order to achieve a certain runoff volume decreases when implementing an upstream green roof as the runoff to the infiltration swale is reduced.
The effects of applying LIDs are in agreement with many field and laboratory studies, as well as evaluations based on hydrologic simulations (for an overview compare [6,7]). All LID strategies decrease the runoff volume due to the provided retention volume. The decrease curve starts steep and flattens, converging to zero. The green roof, bio-retention cell, and infiltration swale provide an increase of evapotranspiration. The increase is linear, as SWMM does not account for the response of evapotranspiration to the soil moisture variation [43]. In contrast, the infiltration trench applied to residential areas and the underground blind drain do not affect the evapotranspiration, but substantially increase the groundwater recharge.
The results indicate that the potential of applying LIDs is increasing, with an increasing imperviousness of the investigated area as slightly impervious areas already show a relatively small runoff volume and high evapotranspiration. Nevertheless, LIDs are applicable for both residential and commercial areas (in agreement with Dietz et al. [44]).
The green roof as part of an LID treatment train shifts the water balance components compared to the LID applications without a green roof (Figure 7, Figure 8, Figure 9 and Figure 12) as stormwater is retained in the soil layer and available for evapotranspiration. This is in agreement with several field, laboratory, and modeling studies (for overview compare Ahiablame et al. [6] or Eckart et al. [7]). Consequently, the overall runoff volume and groundwater recharge are decreased.

3.2. Assessment and Efficiency of LID Strategies

The results for the commercial area (Figure 13) show a minimum deviation from the targeted water balance of 28 percentage points for the application of an infiltration swale, but at the same time result in a maximal demand for land. Assuming the same cost limit, the infiltration swale generally shows best results regarding the deviation from targeted water balance compared to other LID strategies. On the other hand, with respect to the demand for land, the blind drain shows expectable good results. However, at a certain point (ca. €4800 per year), the application of additional blind drain volume only results in higher costs without further reducing the deviation from targeted water balance.
It is obvious that strategies with a very small runoff volume going below the targeted runoff volume may increase the deviation from targeted water balance. The same can occur for strategies resulting in a groundwater recharge larger than the targeted one. However, following a holistic approach considering the complete water balance, the challenge is to find a solution that addresses the deviation from the complete targeted water balance and not a solution that only considers the deviation from target state of a particular water balance component. However, investigations on a larger scale can shift the point of view. LID strategies applied to a site, resulting in an exceedance of a certain component of the targeted water balance, can also be reasonable. They are applicable to counterbalance the respective component of the targeted water balance component of another site where it cannot be achieved or only associated with very high costs or demand for land. Nevertheless, the assessment on a site scale should be preferred, as suggested by Burns et al. [20].
All single LID strategies show a range of nondominated options. Thus, all single LID strategies provide pareto-optimal options. However, LID strategies resulting in small costs but a large deviation from targeted water balance will not be suitable in practice. Nevertheless, the results can be used to select a reasonable LID strategy. Stakeholders have the opportunity to emphasize a certain goal (deviation from targeted water balance, costs, demand for land) in the decision process.
The trend in the results for the high-developed area is similar to those of the commercial area (Figure 14). In contrast to the commercial area, a deviation from targeted water balance of almost zero is achieved, applying an infiltration swale or a bio-retention cell. The costs to obtain this condition are higher for the bio-retention cell (€360 per year) than for the infiltration swale (€116 per year), but the demand for land is smaller for the bio-retention cell (26.4 m²) than for the infiltration swale (38.4 m²).
Once again, all single LID strategies show a range of nondominated options. As already mentioned, the decision process can be seen as a trade-off between the deviation from targeted water balance, costs, and demand for land.
The efficiency of LID strategies shows that the infiltration swale provides the best results when only the deviation from the targeted water balance is considered (wland = 0.0, wWB = 1.0, Figure 15a, compare also Figure 13). An increasing weighting factor for the demand for land results in an increasing ELID for LID strategies comprising a blind drain (Figure 15). This is valid for a single blind drain as well as for an LID treatment train comprising an infiltration swale and a downstream blind drain, providing pareto-optimal results. Thus, when land is rare, the application of a blind drain can be a reasonable option. Implementing it as part of an LID treatment train with an infiltration swale is especially valuable. The infiltration swale is cost-saving and accounts for evapotranspiration, while the blind drain collects and infiltrates possibly occurring runoff from the infiltration swale while causing no further demand for land and.
If only the deviation from the targeted water balance is considered for ELID (wland = 0.0, wWB = 1.0, Figure 15a), the improvement of ELID is small at a certain point (ca. €4000 per year for the infiltration trench and the bio-retention cell) as the deviation from the targeted water balance can only be reduced slightly while the demand for land and costs increase. Concerning the blind drain, ELID even decreases as the deviation from the targeted water balance increases, caused by an overly high groundwater recharge (compare also Figure 6). Emphasizing the demand for land, ELID also decreases more and more for the other single LIDs (infiltration trench, bio-retention cell, infiltration swale) as the increase of demand for land exceeds the reduction of deviation from targeted water balance.
The assessment of LID strategies with respect to a targeted water balance shows that the decision is dependent on the main goal of the stormwater management project. Besides the deviation from the targeted water balance, the demand for land and costs have to be taken into consideration. Depending on the emphasis given on the individual goals, different LID strategies can appear to be “most effective”.

4. Conclusions

This paper introduces a method for a model-based selection of cost-effective LID strategies to control water balance. The method is based on a holistic approach considering the complete water balance. The objectives within the design and selection process are the deviation from the targeted water balance, the demand for land and the costs. The efficiency of LID strategies (ELID) is defined as a measure to evaluate the investigated LID strategies, providing also the possibility of weighting the individual objectives.
The conducted simulations illustrate how LID strategies affect the water balance depending on the applied size of LID: Reduction of runoff volume, increase of evapotranspiration, and groundwater recharge. The results are valuable for the planning process in order to estimate the respective effect on the water balance components of different LID strategies.
The investigations revealed that there is not one specific optimal LID strategy when the water balance, as well as costs and demand for land, are taken into consideration. Nevertheless, the method’s results provide a well-founded and holistic basis for the selection of a reasonable LID strategy. Stakeholders can choose from several nondominated results, emphasizing a certain objective.
The application of an LID treatment train shows high potential. It is especially valuable combining a cost-saving LID that accounts for evapotranspiration (e.g., infiltration swale) and a downstream LID that accounts for infiltration and results in no further demand for land (e.g., blind drain).
The quantitative results are restricted to the investigated areas and their hydrologic boundary conditions, the precipitation time series, the assumed costs, and the LID strategies used. However, the developed method is applicable to other areas, other precipitation time series, and other LID strategies. Further research is related to this assumption, as well as using the method’s findings on a larger scale.

Author Contributions

Conceptualization and methodology, J.L., G.K., and D.M.; investigation, J.L.; resources, D.C.; data curation, J.L. and D.C.; validation, J.L. and G.K.; writing—original draft preparation, J.L.; writing—review and editing, J.L., G.K., D.C., and D.M.; visualization, J.L. and D.C.; supervision, D.M.

Funding

The project was funded by the Austrian Federal Ministry for Sustainability and Tourism and the State of Styria.

Acknowledgments

The research is part of the project “FlexAdapt – Entwicklung flexibler Adaptierungskonzepte für die Siedlungsentwässerung der Zukunft”. The project was funded by the Austrian Federal Ministry for Sustainability and Tourism and the State of Styria.

Conflicts of Interest

The authors declare no conflict of interest.

References

  1. Shuster, W.D.; Bonta, J.; Thurston, H.; Warnemuende, E.; Smith, D.R. Impacts of impervious surface on watershed hydrology: A. review. Urban Water J. 2005, 2, 263–275. [Google Scholar] [CrossRef]
  2. Cheng, S.J.; Wang, R.Y. An approach for evaluating the hydrological effects of urbanization and its application. Hydrol. Process. 2002, 16, 1403–1418. [Google Scholar] [CrossRef]
  3. Haase, D. Effects of urbanisation on the water balance—A long-term trajectory. Environ. Impact Assess. Rev. 2009, 29, 211–219. [Google Scholar] [CrossRef]
  4. Fletcher, T.D.; Andrieu, H.; Hamel, P. Understanding, management and modelling of urban hydrology and its consequences for receiving waters: A state of the art. Adv. Water Resour. 2013, 51, 261–279. [Google Scholar] [CrossRef]
  5. US EPA. Low Impact Development (LID)—A Literature Review; US EPA Office of Water (4203): Washington, DC, USA, 2000.
  6. Ahiablame, L.M.; Engel, B.A.; Chaubey, I. Effectiveness of low impact development practices: Literature review and suggestions for future research. Water Air Soil Pollut. 2012, 223, 4253–4273. [Google Scholar] [CrossRef]
  7. Eckart, K.; McPhee, Z.; Bolisetti, T. Performance and implementation of low impact development—A review. Sci. Total Environ. 2017, 607, 413–432. [Google Scholar] [CrossRef]
  8. Jayasooriya, V.M.; Ng, A.W.M. Tools for Modeling of Stormwater Management and Economics of Green Infrastructure Practices: A Review. Water Air Soil Pollut. 2014, 225, 2055. [Google Scholar] [CrossRef]
  9. Rossman, L. Storm Water Management Model—User’s Manual Version 5.1; US EPA Office of Research and Development: Washington, DC, USA, 2015.
  10. DWA. Arbeitsblatt DWA-A 138—Planung, Bau und Betrieb von Anlagen zur Versickerung von Niederschlagswasser; Deutsche Vereinigung für Wasserwirtschaft, Abwasser und Abfall e.V.: Hennef, Germany, 2005. [Google Scholar]
  11. ON. ÖNORM B 2506-1: Regenwasser-Sickeranlagen für Abläufe von Dachflächen und befestigten Flächen—Teil 1: Anwendung, hydraulische Bemessung, Bau und Betrieb; Austrian Standards: Vienna, Austria, 2013. [Google Scholar]
  12. MDE. Maryland Stormwater Design Manual; Maryland Department of the Environment (MDE): Baltimore, MD, USA, 2000.
  13. Ballard, B.W.; Udale-Clarke, H.; Kellagher, R.; Dou, V.; Powers, D.; Gerolin, A.; McCloy, A.; Schmitt, T. International approaches to the hydraulic control of surface water runoff in mitigating flood and environmental risks. E3S Web Conf. 2016, 7, 12004. [Google Scholar] [CrossRef] [Green Version]
  14. Leimgruber, J.; Krebs, G.; Camhy, D.; Muschalla, D. Sensitivity of Model-Based Water Balance to Low Impact Development Parameters. Water 2018, 10, 1838. [Google Scholar] [CrossRef]
  15. Coffman, L. Low-Impact Development Design Strategies, An Integrated Design Approach; Department of Environmental Resources, Programs and Planning Division: Prince George’s County, MD, USA, 2000. [Google Scholar]
  16. Seo, M.; Jaber, F.; Srinivasan, R. Evaluating various low-impact development scenarios for optimal design criteria development. Water Switz. 2017, 9, 270. [Google Scholar] [CrossRef]
  17. Goebel, P.; Coldewey, W.G.; Dierkes, C.; Kories, H.; Meßer, J.; Meißner, E. Impacts of green roofs and rain water use on the water balance and groundwater levels in urban areas. Grundwasser 2007, 12, 189–200. [Google Scholar] [CrossRef]
  18. Henrichs, M.; Langner, J.; Uhl, M. Development of a simplified urban water balance model (WABILA). Water Sci. Technol. 2016, 73, 1785–1795. [Google Scholar] [CrossRef]
  19. Henrichs, M.; Steinbrich, A.; Leistert, H.; Scherer, I.; Schuetz, T.; Uhl, M.; Weiler, M. Model Based Estimation of a Natural Water Balance as Reference for Planning in Urban Areas. In New Trends in Urban Drainage Modelling—UDM 2018, Proceedings of International Conference on Urban Drainage Modelling, Palermo, Italy, 23–26 September 2018; Springer International Publishing: Cham, Switzerland, 2019; pp. 953–957. [Google Scholar]
  20. Burns, M.J.; Fletcher, T.D.; Walsh, C.J.; Ladson, A.R.; Hatt, B.E. Hydrologic shortcomings of conventional urban stormwater management and opportunities for reform. Landsc. Urban Plan. 2012, 105, 230–240. [Google Scholar] [CrossRef]
  21. Kim, R.; Lee, J.; Lee, D. Development of Treatment-Train-Package Novel System for the Road Runoff Controlling in Urban Area. Int. J. Control. Autom. 2015, 8, 155–162. [Google Scholar] [CrossRef]
  22. Xu, C.; Hong, J.; Jia, H.; Liang, S.; Xu, T. Life cycle environmental and economic assessment of a LID-BMP treatment train system: A case study in China. J. Clean. Prod. 2017, 149, 227–237. [Google Scholar] [CrossRef]
  23. She, N.; Liu, J.; Lucas, W.; Li, T.; Wu, L. Performance of LID Treatment Trains in Shenzhen University during Extreme Storm Events. In Proceedings of the International Low Impact Development Conference 2015, Houston, TX, USA, 19–21 January 2015. [Google Scholar]
  24. Auger, S.; Van Seters, T.; Singh, A.; Antoszek, J. Water Quality Target Assessment Using LID TTT for Better SWM Designs in Ontario. In Proceedings of the International Low Impact Development Conference 2018, Nashville, TN, USA, 12–15 August 2018. [Google Scholar]
  25. MacMullan, E.; Reich, S. The Economics of Low-Impact Development: A Literature Review; ECONorthwest: Eugene, OR, USA, 2007. [Google Scholar]
  26. Liao, Z.; Chen, H.; Huang, F.; Li, H. Cost–effectiveness analysis on LID measures of a highly urbanized area. Desalin. Water Treat. 2015, 56, 2817–2823. [Google Scholar] [CrossRef]
  27. Chui, T.F.M.; Liu, X.; Zhan, W. Assessing cost-effectiveness of specific LID practice designs in response to large storm events. J. Hydrol. 2016, 533, 353–364. [Google Scholar] [CrossRef]
  28. Montalto, F.; Behr, C.; Alfredo, K.; Wolf, M.; Arye, M.; Walsh, M. Rapid assessment of the cost-effectiveness of low impact development for CSO control. Landsc. Urban Plan. 2007, 82, 117–131. [Google Scholar] [CrossRef]
  29. Houdeshel, C.; Pomeroy, C.; Hair, L.; Moeller, J. Cost-Estimating Tools for Low-Impact Development Best Management Practices: Challenges, Limitations, and Implications. J. Irrig. Drain. Eng. 2010, 137, 183–189. [Google Scholar] [CrossRef]
  30. Yu, Z.; Aguayo, M.; Montalto, F.; Piasecki, M.; Behr, C. Developments in LIDRA 2.0: A Planning Level Assessment of the Cost-Effectiveness of Low Impact Development. In Proceedings of the World Environmental and Water Resources Congress 2010, Providence, RI, USA, 16–20 May 2010; pp. 3261–3270, ISBN 978-0-7844-1114-8. [Google Scholar]
  31. OEWAV. ÖWAV—Leitfaden—Niederschlagsdaten zur Anwendung der ÖWAV-Regelblätter 11 und 19; Österreichischer Wasser-und Abfallwirtschaftsverband: Vienna, Austria, 2007. [Google Scholar]
  32. Hargreaves, G.H.; Samani, Z.A. Reference Crop Evapotranspiration from Temperature. Appl. Eng. Agric. 1985, 1, 96–99. [Google Scholar] [CrossRef]
  33. ZAMG. Jahrbuch—ZAMG. Available online: https://www.zamg.ac.at/cms/de/klima/klimauebersichten/jahrbuch (accessed on 28 November 2017).
  34. Rossman, L.A.; Huber, W.C. Storm Water Management Model Reference Manual Volume III—Water Quality; US EPA National Risk Management Research Laboratory: Cincinnati, OI, USA, 2016.
  35. FLL. Dachbegrünungsrichtlinie—Richtlinie für die Planung Ausführung und Pflege von Dachbegrünungen; Forschungsgesellschaft Landschaftsentwicklung und Landschaftsbau e.V.: Bonn, Germany, 2008. [Google Scholar]
  36. Rossman, L.A.; Huber, W.C. Storm Water Management Model Reference Manual Volume I—Hydrology; US EPA National Risk Management Research Laboratory: Cincinnati, OI, USA, 2016.
  37. Leitlinien zur Durchführung dynamischer Kostenvergleichsrechnungen (KVR-Leitlinien); 8. überarb. Aufl.; Deutsche Vereinigung für Wasserwirtschaft, Abwasser und Abfall (Ed.) DWA: Hennef, Germany, 2012; ISBN 978-3-941897-55-7. [Google Scholar]
  38. Leimbach, S.; Brendt, T.; Ebert, G.; Jackisch, N.; Zieger, F.; Kramer, S. Regenwasserbewirtschaftungsanlagen in der Praxis: Betriebssicherheit, Kosten und Unterhaltung; Universität.: Freiburg, Germany, 2018. [Google Scholar]
  39. Matzinger, A.; Riechel, M.; Remy, C.; Schwarzmüller, H.; Rouault, P.; Schmidt, M.; Offermann, M.; Strehl, C.; Nickel, D.; Sieker, H.; et al. Zielorientierte Planung von Maßnahmen der Regenwasserbewirtschaftung—Ergebnisse des Projektes KURAS; Konzepte für urbane Regenwasserbewirtschaftung und Abwassersysteme: Berlin, Germany, 2017. [Google Scholar]
  40. Sieker Sieker—Die Regenwasserexperten. Available online: https://www.sieker.dede/home.html (accessed on 5 December 2018).
  41. Muschalla, D.; Gruber, G.; Scheucher, R. ECOSTORMA—Handbuch—Ökologische und ökonomische Maßnahmen der Niederschlagswasserbewirtschaftung; Ministerium für ein lebenswertes Österreich: Wien, Germany, 2014. [Google Scholar]
  42. Schuetze, M.; Butler, D.; Beck, M.B. Modelling, Simulation and Control of Urban Wastewater Systems; Springer: London, UK, 2002; ISBN 1-85233-553-X. [Google Scholar]
  43. Youcan, F.; Steven, B. Improving Evapotranspiration Mechanisms in the U.S. Environmental Protection Agency’s Storm Water Management Model. J. Hydrol. Eng. 2016, 21, 06016007. [Google Scholar]
  44. Dietz, M.E. Low Impact Development Practices: A Review of Current Research and Recommendations for Future Directions. Water. Air. Soil Pollut. 2007, 186, 351–363. [Google Scholar] [CrossRef] [Green Version]
Figure 1. Scheme and simulated processes of the investigated low impact development (LID) strategies: (a) Green roof; (b) infiltration trench; (c) bio-retention cell; (d) infiltration swale; (e) blind drain.
Sustainability 11 02440 g001
Figure 2. Schematic setting of the investigated case studies: (a) Low-developed residential area; (b) high-developed residential area; (c) commercial area. Atotal is the total area of the case study and LID-Apot is the total potential LID area.
Sustainability 11 02440 g002
Figure 3. Investigated LID strategies. (a) Single LID strategies; (b) LID treatment trains with green roof; (c) two-part and three-part LID treatment trains.
Sustainability 11 02440 g003
Figure 4. Simulated long-term water balance for the low-developed residential area applying single LID strategies of increasing size. Relation between costs and (a) runoff volume, (b) evapotranspiration, (c) groundwater recharge. Relation between demand for land and (d) runoff volume, (e) evapotranspiration, (f) groundwater recharge.
Sustainability 11 02440 g004
Figure 5. Simulated long-term water balance for the high-developed residential area applying single LID strategies of increasing size. Relation between costs and (a) runoff volume, (b) evapotranspiration, (c) groundwater recharge. Relation between demand for land and (d) runoff volume, (e) evapotranspiration, (f) groundwater recharge.
Sustainability 11 02440 g005
Figure 6. Simulated long-term water balance for the commercial area applying single LID strategies of increasing size. Relation between costs and (a) runoff volume, (b) evapotranspiration, (c) groundwater recharge. Relation between demand for land and (d) runoff volume, (e) evapotranspiration, (f) groundwater recharge.
Sustainability 11 02440 g006
Figure 7. Simulated long-term water balance for the low-developed residential area applying a green roof and different downstream LIDs of increasing size (LID treatment train). Relation between costs and (a) runoff volume, (b) evapotranspiration, (c) groundwater recharge. Relation between demand for land and (d) runoff volume, (e) evapotranspiration, (f) groundwater recharge.
Sustainability 11 02440 g007
Figure 8. Simulated long-term water balance for the high-developed residential area applying a green roof and different downstream LIDs of increasing size (LID treatment train). Relation between costs and (a) runoff volume, (b) evapotranspiration, (c) groundwater recharge. Relation between demand for land and (d) runoff volume, (e) evapotranspiration, (f) groundwater recharge.
Sustainability 11 02440 g008
Figure 9. Simulated long-term water balance for the commercial area applying a green roof and different downstream LIDs of increasing size (LID treatment train). Relation between costs and (a) runoff volume, (b) evapotranspiration, (c) groundwater recharge. Relation between demand for land and (d) runoff volume, (e) evapotranspiration, (f) groundwater recharge.
Sustainability 11 02440 g009
Figure 10. Simulated long-term water balance for the commercial area applying an LID treatment train comprising an altering proportion of infiltration swale on total LID area (Apot) and a downstream infiltration trench of increasing size. Each colored line of the LID treatment train illustrates the simulation results for a constant proportion of infiltration swale on Apot and an increasing size of the infiltration trench (indicated by the arrow). Relation between costs and (a) runoff volume, (b) evapotranspiration, (c) groundwater recharge. Relation between demand for land and (d) runoff volume, (e) evapotranspiration, (f) groundwater recharge.
Sustainability 11 02440 g010
Figure 11. Simulated long-term water balance for the commercial area applying an LID treatment train comprising an infiltration swale with altering proportion on potential LID area (Apot) and a downstream blind drain of increasing size. Each colored line of the LID treatment train illustrates the simulation results for a constant proportion of infiltration swale on Apot and an increasing size of the blind drain (indicated by the arrow). Relation between costs and (a) runoff volume, (b) evapotranspiration, (c) groundwater recharge. Relation between demand for land and (d) runoff volume, (e) evapotranspiration, (f) groundwater recharge.
Sustainability 11 02440 g011
Figure 12. Simulated long-term water balance for the commercial area applying an LID treatment train comprising a green roof, an infiltration swale with altering proportion on total LID area (Apot), and a downstream blind drain of increasing size. Each colored line of the LID treatment train illustrates the simulation results for a constant proportion of infiltration swale on Apot and an increasing size of the blind drain (indicated by the arrow). Relation between costs and (a) runoff volume, (b) evapotranspiration, (c) groundwater recharge. Relation between demand for land and (d) runoff volume, (e) evapotranspiration, (f) groundwater recharge.
Sustainability 11 02440 g012
Figure 13. Assessment of applying single LID strategies to the commercial area with respect to a targeted water balance and demand for land. The nondominated results (grey-bold) are only illustrated for the relationship between costs and deviation from targeted water balance.
Sustainability 11 02440 g013
Figure 14. Assessment of applying single LID strategies to the high-developed residential area with respect to a targeted water balance and demand for land. The nondominated results (grey-bold) are only illustrated for the relationship between costs and deviation from targeted water balance.
Sustainability 11 02440 g014
Figure 15. Assessment of applying different single LID strategies of increasing size and an LID treatment train consisting of an infiltration swale with altering proportion on total LID area (Apot) and a downstream blind drain of increasing size to the commercial area. Calculation of LID efficiency (ELID) with varying weights deviation from targeted water balance (wWB) and demand for land (wland). Each colored line of the LID treatment train illustrates ELID for a constant proportion of infiltration swale on Apot and an increasing size of the blind drain. The nondominated results are illustrated in grey-bold.
Sustainability 11 02440 g015
Table 1. Parameters of investigated LIDs.
Green roof Infiltration trench
Parameter Unit Parameter Unit
Berm height10mm Berm height300mm
Vegetation volume0.2% Vegetation volume0.0
Surface roughness0.1s/m1/3 Surface roughness0.02s/m1/3
Surface slope1.0% Surface slope1.0%
Soil thickness100mm Storage thickness1000mm
Porosity0.55- Storage void ratio0.3-
Field capacity0.4- Storage seepage rate10mm/h
Wilting point0.1-
Conductivity50mm/h
Conductivity slope30-
Suction head65mm
Drainage mat thickness30mm
Drainage mat void fraction0.4-
Drainage mat roughness0.02s/m1/3
Bio-retention cell Infiltration swale
Parameter Unit Parameter Unit
Berm height300mm Berm height300mm
Vegetation volume0.1fraction Vegetation volume0.1fraction
Surface roughness0.16s/m1/3 Surface roughness0.16s/m1/3
Surface slope1% Surface slope1.0%
Soil thickness300mm Soil thickness300mm
Porosity0.5- Porosity0.5-
Field capacity0.2- Field capacity0.2-
Wilting point0.1- Wilting point0.1
Conductivity120mm/h Conductivity120mm/h
Conductivity slope40- Conductivity slope40-
Suction head50mm Suction head50mm
Storage thickness100mm
Storage void fraction0.3-
Storage seepage rate10mm/h
Table 2. Construction costs and maintenance costs for the investigated LIDs.
Construction Costs (C0)Maintenance Costs (C0 ∙ p)Total Costs (TCa)Reference (Values Adapted)
LID
Green roof 35 €/m²1.75€/(m²∙year)3.54€/(m²∙year)[39,40,41]
Infiltration swale 30€/m²1.5€/(m²∙year)3.03€/(m²∙year)[38,39,40,41]
Infiltration trench 105€/m³5.25€/(m³∙year)10.61€/(m³∙year)[38,39,40,41]
Bio-retention cell135€/m³6.75€/(m³∙year)13.64€/(m³∙year)[38,39,40,41]
Blind drain105€/m³5.25€/(m³∙year)10.61€/(m³∙year)[38,39,40,41]

