1. Introduction
Social housing, in its collective building form, is one of the backbones in the configuration of current cities in southern Europe. The considerable volume of housing built in Europe after World War II [
1,
2] and in Spain after its Civil War carries significant implications in the actual energy behaviour of the city-homes, which cannot be neglected when assessing the energy performance expected from our cities. In Seville, as an example of many cities in southern Europe, over 48% of collective residential buildings, the most common type, were built between 1939 and 1979 [
3,
4]. When added to the buildings erected in the early twentieth century, this figure increases to over 51% of the present housing stock. Consequently, over half of the city’s houses are to some extent obsolete. Of this 51%, 60% qualifies as “social housing”. This group of dwellings, which accounts for over 30% of Andalusia’s total housing stock, poses the greatest risks in terms of underperformance.
Air leakage across envelopes, one of the factors that impacts energy consumption most heavily, can be estimated to account for 20% to 50% of a household’s energy demand, depending on the climate zone [
5,
6,
7]. Hence, it is important in energy consumption and residential environmental control and air quality design [
8,
9].
Leakage or infiltration consists in outdoor air that flows into closed premises across cracks and other unintended envelope openings. Such uncontrolled air flows depend on the enclosure permeability and indoor/outdoor air pressure differentials. The presence of (in- or exfiltration) leakage is consequently contingent upon the existence of a direct connection between in- and outdoors and a driving force (pressure differential). The five forces most frequently underlying building air flows are as follows [
10,
11]:
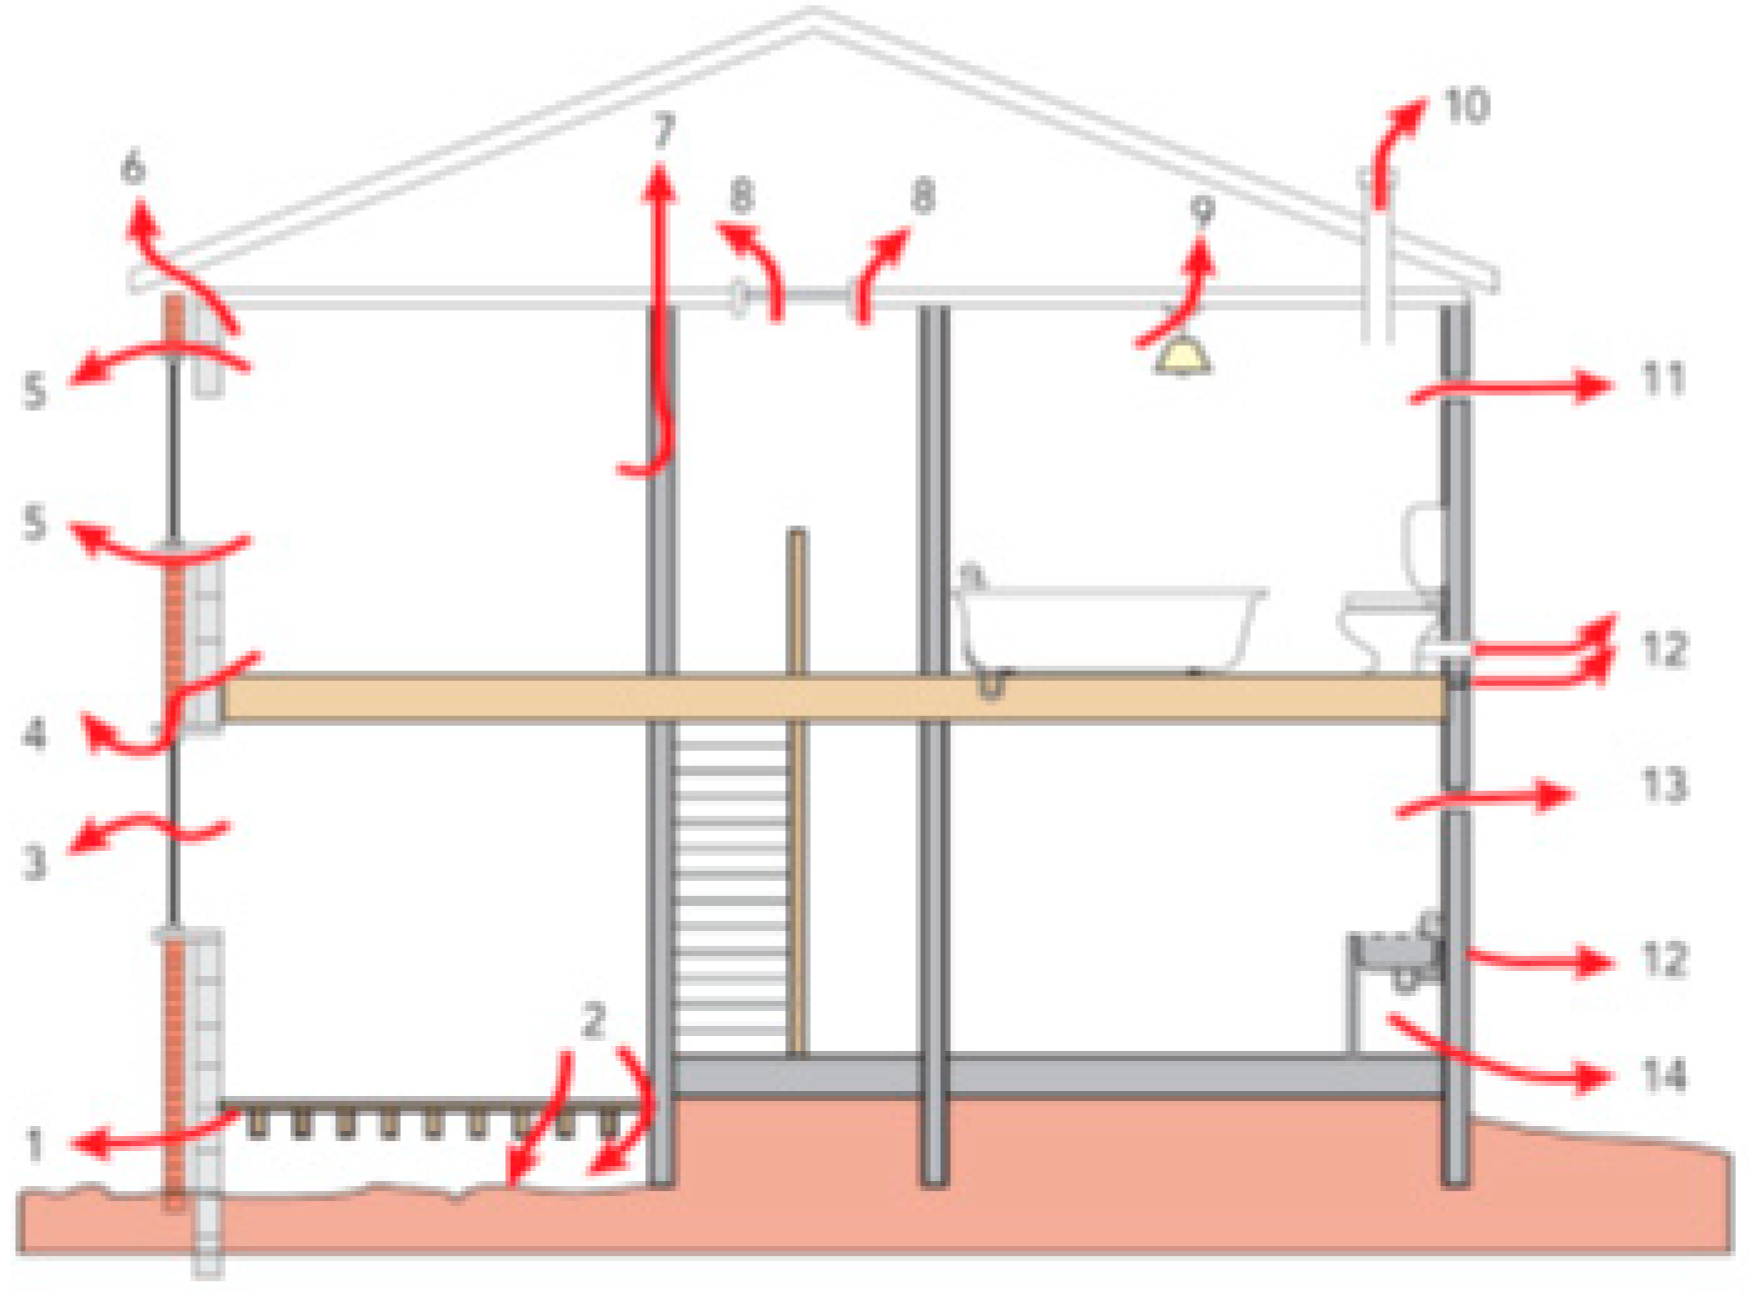
Although the main draught pathways across building envelopes have not been studied in Spain multifamily typologies, the ones most frequently identified in other countries in single family homes are depicted in
Figure 1 and are as follows [
12,
13,
14,
15]:
1 and 2: Suspended ceilings, i.e., spaces between timber planks or between structural floor and perimetric connection elements, as well as service penetrations in such ceilings.
3: Windows or doors.
4: Joints at the abutment between structural floors and enclosures.
5: Seals around windows (and other openings) and window sills.
6: Seals in eaves.
7: In-flat partitions (leaks across service penetrations for electrical switches, outlets, and similar).
8: Hatchways.
9: Openings for light fixtures.
10: Ventilation pipes and combustion chimneys.
11: Spaces around extractors and stove hoods.
12: Penetrations to accommodate piping.
13: Cracks and any other manner of openings in enclosures.
14: Joints at abutments between floors and enclosures.
All the airtightness tests conducted in Spain are run by a university research team [
5,
16,
17,
18,
19]. They are not undertaken by public or private construction companies, which have yet to be sensitised to the problems (impact on energy demand, occupant comfort, and indoor air quality) posed when housing airtightness rates go uncontrolled. Such problems are the more severe in social housing, occupied by the most vulnerable segments of society that can afford neither to install Heating, Ventilating and Air Conditioning (HVAC) systems nor to pay the high electric power bills associated with individual room heating/cooling [
20]. Despite its purportedly mild climate, Spain is the European country with the highest rate of cold weather-induced death [
21].
The main aim of this research is to present a wide-ranging study on the location and quantification of the envelope air leakage in one of the largest autonomous communities in Spain, Andalusia, characterised by a climate that is highly representative of southern Europe with mild winters and warm summers (even extreme ones), and ultimately, to serve as a guide for locating air leakage in sustainable housing design, construction, and retrofitting. Indoor thermal conditions, particularly in social housing, have normally been conditioned by economic considerations, an extended absence of thermal systems, both cooling and heating, in homes, and a failure to provide suitable capabilities to these buildings [
22].
2. Materials and Methods
The airflows were studied and characterised both quantitatively and qualitatively. The (quantitative) blower door test was run to determine the contribution to leaks of each room and its respective elements in the flats analysed. Those procedures were supplemented with (qualitative) infrared thermographic and smoke tests to locate draught pathways in building envelopes.
2.1. Location and Climate
Although the regional climate can generally be defined as Mediterranean (Köppen: Csa), there are different variants in the studied area, also covering Bsh areas in transition to Bwh (Almeria area), and others where the Csa type transitions to the Bsk (Granada area). However, climatic zoning associated with the national energy labelling procedure has been adopted for a more detailed classification, as it provides a greater degree of subregional detail [
23]. The buildings chosen were in different climate areas within the region, with winters ranging from very mild (zone A) to cold (zone C) and summers from warm (zone 3) to hot (zone 4). The selected building complexes, or sample groups, are located in the five most representative climatic zones of the region. Although Andalusia has a wide range of climatic zones, the most common ones, i.e., where most of the properties in the region are concentrated, have been selected. Separate predictive models were developed for each climatic zone. The mean, maxima, and minima temperature values of different climatic files are given in
Table 1 by the climatic zone.
2.2. Sample
In southern Andalusia, multi-dwelling units prevail over the single family homes found more frequently in suburbs and metropolitan areas. Two periods of steep housing construction development and growth can be identified: from 1940 to 1979, particularly at the end of that cycle, and in the nineteen nineties and the twenty noughties, when the city acquired its present appearance [
24].
The sample was divided in two:
Cluster 1, post-1979 developments—dwellings built between 1980 and 2005: This sample is very representative of the buildings constructed after the implementation of the first Spanish energy demand regulations NBE-CT-79 (on Thermal Conditions in Buildings) [
25].
Cluster 2, pre-1979 developments—dwellings built between 1950 and 1979: This sample is very representative of the buildings constructed prior to the implementation of the NBE-CT-79 and has no specific thermal insulation [
24].
As a rule, the façades in the area exhibit an average thermal performance, with thermal mass values in the medium or, in the oldest buildings with a single wythe masonry, in the low range. Façade thermal transmittance values are on the order of 0.5 W/m2K to 1.5 W/m2K. Typically, they consist in two masonry wythes, a thicker outer layer (normally 15 cm) and a thinner inner layer (7 cm to 4 cm) with an air space in between.
Reinforced concrete portal frames and structural floors constitute the prevailing structural approach. Most windows are single glazed and either hinged or horizontally sliding, with timber, steel, or aluminum joinery (from oldest to newest), depending on the date of construction [
24].
Balconies, a very common element, particularly in the older flats, grew in size in buildings erected beginning in the nineteen sixties. As those elements normally form part of fairly small flats, many have been enclosed to enlarge the rest of the dwelling. A substantial percentage of these flats also feature a laundry room adjacent to the kitchen, particularly those built after the enactment of ordinances on social housing design [
24]. Flats’ (normally gas-fuelled) domestic hot water heaters are found in those spaces, which were initially fitted with slats as the sole separation from the outdoors. As in the case of the balconies, however, many of these laundry rooms have been enclosed with joinery and glazing and incorporated into the kitchen.
The sample analysed consisted solely in flats in apartment buildings, normally surrounded by adjacent units on all sides as well as above and below, with the exception of the units on the top and bottom stories and along the building perimeter. The main paths in the envelope were identified on the grounds of those assumptions (
Table 2).
2.3. Blower Door Tests
Blower door tests, a procedure endorsed by the scientific community [
26], constituted the backbone of the study.
The entire envelope was analysed, including both the elements in contact with the outdoors and those adjacent to other flats and communal areas (
Figure 2). In the absence of specific protocols for measuring multifamily housing [
27], new protocols based on Spanish and European standard UNE EN 13829:2002 [
28] were developed to conduct blower door tests and to quantify air flowing both outdoors and toward adjacent flats, as described in Reference [
19].
A comparison of the results of the airtightness tests run to different protocols (
Figure 3) identified the envelope elements primarily responsible for inward air flows (
Figure 1). The findings for the various tests were analysed to determine the relative weight of each component in a total air leakage.
To establish the effect of the separations between adjacent flats and between indoors and outdoors, the units were tested under a number of conditions. Blower door tests were conducted not only on the flats as a whole but also by closing off parts of each to determine the contributions of the various envelope components, particularly the ones on building exteriors. The flats were consequently sealed off as described in
Figure 3, in keeping with protocols developed in earlier research [
19].
Overall, the leakage between adjacent flats was scantly significant; as reported in earlier research [
18], only 3.6% on the average of the total envelope volume was observed to be associated with lateral draughts. Leaks to and from other flats were, therefore, disregarded in the analysis; with such a low volumetric incidence and the absence of dynamic wind pressure between adjacent walls, the contribution of any air entry or exit to the exchange rate in occupied flats could be deemed negligible.
2.4. Locating Air Leakage
To supplement the airtightness analyses, the main flow paths across the envelope were located with infrared thermography and smoke tests. As both are only effective if air is moving across the envelope, they were conducted at the same time as the blower door test [
29].
Although essentially qualitative and geared to locating airflows and the areas where air-permeable elements are concentrated, these tests deliver data of particular interest for building reform and improvement design.
Infrared thermographic images were captured with a FLIR ThermaCAM B4 camera featuring a resolution of 320 × 240 pixels and other specifications required for infrared building inspections. The data were processed with the FLIR ExaminIR software.
Like thermography, smoke tests detect uncontrolled air entry in building envelopes. They consist in generating smoke (in this case, with a Smoke Pencil Pro draught detector) near the inside of certain elements of the envelope in a blower door-depressurised flat. The direction of the smoke as it moves readily identifies outdoor-indoor draughts. This test is very useful when a thermographic camera cannot be used due to the lack of significant indoor-outdoor temperature differences. Another advantage of this test over the thermographic procedure is that it can be conducted in any season of the year and calls for no preliminary preparation of the flat. This approach was consequently adopted for all the housing developments studied, most of which lacked the HVAC systems needed to create the temperature difference required by IR thermography.
3. Results and Discussion
The flats studied were built between 1950 and the time of the study. In light of the morphological and constructional differences observed, the sample was divided into two clusters: flats built prior to 1979 (cluster 2), when the first provisions on building construction entered into effect in Spain, and those built after that date (cluster 1).
3.1. Quantifying Air Leakage
3.1.1. Cluster 1, Post-1979 Developments
The cluster 1 findings listed in
Table 1 identify the contribution of each envelope component to the total airflow. The leakage attributable to wet (kitchens and bathrooms) and dry areas can be deduced by comparing the method MB to the M2 and M3 findings. The values recorded exhibited substantial scatter, as mirrored in the standard deviations and range of minimum-maximum flows (
Table 3).
The test findings for wet area envelope elements and functional openings (vents) in those areas are broken down in
Table 4.
The volume of air flowing across functional openings such as vents and smoke extractors accounted for a significant 25% of the total flow in flats. That percentage was highly variable, however, ranging from 0 in flats where such elements were either lacking or out of order to 756 m3/h for nearly half of the total draught in the unit in question.
When the functional openings (vents and similar) were excluded, as in method MB, most of the leaks could be attributed to the dry areas, where the largest share of window area and building service penetrations are normally located (
Table 1 and
Figure 4a).
Of the wet areas, kitchens contributed most to airflow and bathrooms contributed the least, which is consistent with the general absence of windows in the latter (
Table 3 and
Figure 4b).
3.1.2. Cluster 2, Pre-1979 Developments
The cluster 2 findings listed in
Table 5 identify the contribution of each envelope component to airflows. On the whole, the means in this group were lower than those observed for cluster 1. The two were consequently compared in relative terms.
The leakage attributable to wet (kitchens and bathrooms) and dry areas can be deduced by comparing the method MB to the M2 and M3 findings. As in cluster 1, the dataset exhibited considerable scatter, although less uniformly in this case. The widest range of values was observed for functional openings, where the standard deviation was higher than in cluster 1, whilst the narrower interval for the remaining components denoted a greater similarity in intra-cluster solutions. The findings for specific elements in wet area envelopes are broken down in
Table 6.
The volume of air flowing across functional openings such as vents and smoke extractors accounted for 17% of the total leakage, a lower proportion than that observed in cluster 1 (
Table 4). The absolute values ranged over a very wide interval in this case, with a nil effect in some flats and an infiltration of over 2000 m
3/h in others, where these elements essentially drove the entire airflow (
Table 4). At 36%, these openings impacted wet area permeability less than in cluster 1, where 54% was attributable to vents and similar.
An analysis of the envelope performance (in the absence of an intentional window opening) revealed that, here, most leakage could be attributed to the dry areas, although the contribution of wet and dry areas was more evenly distributed than in cluster 1 (
Table 3 and
Figure 4), with the latter contributing 67% and the former 33% of the total (
Figure 5a).
In this cluster, kitchens accounted for nearly half of the wet area leakage. Whilst envelope leakage was the least concentrated in bathrooms, the contribution of these areas was somewhat greater than in cluster 1 (
Table 4 and
Figure 5b).
In the dwellings built between 1950 and 1979, the air leakage paths in the wet rooms (bathrooms and kitchen) have a greater impact on the total air through the envelope (33%) compared to those built later (22%). This is mainly due to the improvement of the carpentry used in the most recent buildings and the incorporation of the casement windows, which are more airtight than the sliding ones.
The average value of the airflow that enters through the vents of the kitchens and bathrooms is higher in the homes built after 1979 (378 m3/h at 50 Pa). This finding is logical since ventilation was not mandatory in homes built before 1979. In addition, ventilation requirements were increased when the CTE2006 regulation came into force.
In the dwellings built between 1950 and 1979, the windows were made of lacquered wood, aluminum, or steel without thermal bridge break with a simple glass of 4 mm in the dry rooms (bedrooms and living room). From 1979, the windows were made of aluminum or PVC with simple glass with an air chamber, and after 2006, the windows were made of aluminum with thermal bridge break and with double glass with an air chamber. The most important elements that differentiate this behaviour are the shadings incorporated into the houses that, in homes built before 1979, were shutters, folding blinds, traditional exterior wooden rolling shutters, or rolling shutters integrated into the enclosure. In homes built after 1979, rolling shutters integrated into the enclosure and, from the 90s, compact rolling shutters were introduced.
The values of air permeability found in the bathroom envelope are very similar in both periods, although the range is high because these values included dwellings that do not have windows in the bathrooms, where the value is almost 0 m3/h.
3.2. Detecting Flow Paths
3.2.1. Infrared Thermography
These tests were conducted in winter, when it was easier to ensure contrasting temperatures in the various elements. The flats were heated to maintain indoor temperatures that were artificially high, in keeping with the recommendations set out in standard ISO EN 18434–1:1008 [
29]. Once the indoor temperature stabilised, the blower door test was conducted.
The case study discussed here was a flat located in Seville (
Figure 6), built early in the first decade of this century. Highly representative of the construction prior to the entry into the effect of the existing legislation, the building shares many features with the rest of the regional stock, justifying an extrapolation of the findings to similar structures.
The respective analysis served to optimise the supplementary smoke test which, as a simpler and more readily applicable procedure, was conducted in all the flats studied.
The façade opening depicted in
Figure 7 was an aluminium compact roller sliding glass window located in the case study living room. The thermal condition of the opening and surroundings after the temperature stabilised and prior to the blower door test is shown in
Figure 8, left. The wall surface temperatures were measured on the head jamb at the three monitoring points (Spi) labelled on the images.
The conditions prevailing around the opening after the 20-min blower door test are depicted in
Figure 8, right. The surface temperatures at the monitoring points during the blower door test are given in
Table 7.
A decline in the temperature was observed at all three points during the test. Those changes were not uniform, however, due to the irregular construction and finishes at the window–enclosure joint. After 20 min, the temperature declined by up to 33.2% at the most air-permeable point (Sp1), compared to just 7.4% and 8% at the other two. That significant temperature drop in the area around point Sp1 (upper left) denoted a substantial inward flow of air.
The images of the suite of openings analysed, samples of which are reproduced in
Figure 9a–f showed that most of the uncontrolled entry paths on the façade were located around the openings, particularly at the seals between components. Further to the thermographic images, the most permeable areas were associated with the parts of the elements most difficult to manually seal, whilst air entry was less intense in the rest of the perimeter. The area most clearly affected was around the shutter box, where the difficulty to ensure a satisfactory seal gave rise to a sizeable flow path (
Figure 9e).
The sensitivity of this area of the envelope to manual on-site assembly procedures would explain the wide scatter in the performance of the various envelope components, as noted in earlier studies addressing other construction types and systems [
30,
31,
32].
The intersection between the structural ceiling and the outdoor wall was not observed to constitute a leakage pathway in the buildings studied here. Rather, it was found to be essentially airtight (
Figure 9f) because the type of construction involved stops possible inter-element gaps (cracks and pores) that contrast with other construction typologies, such as timber or sandwich panels that entail multiple connections between constituent elements [
28,
33].
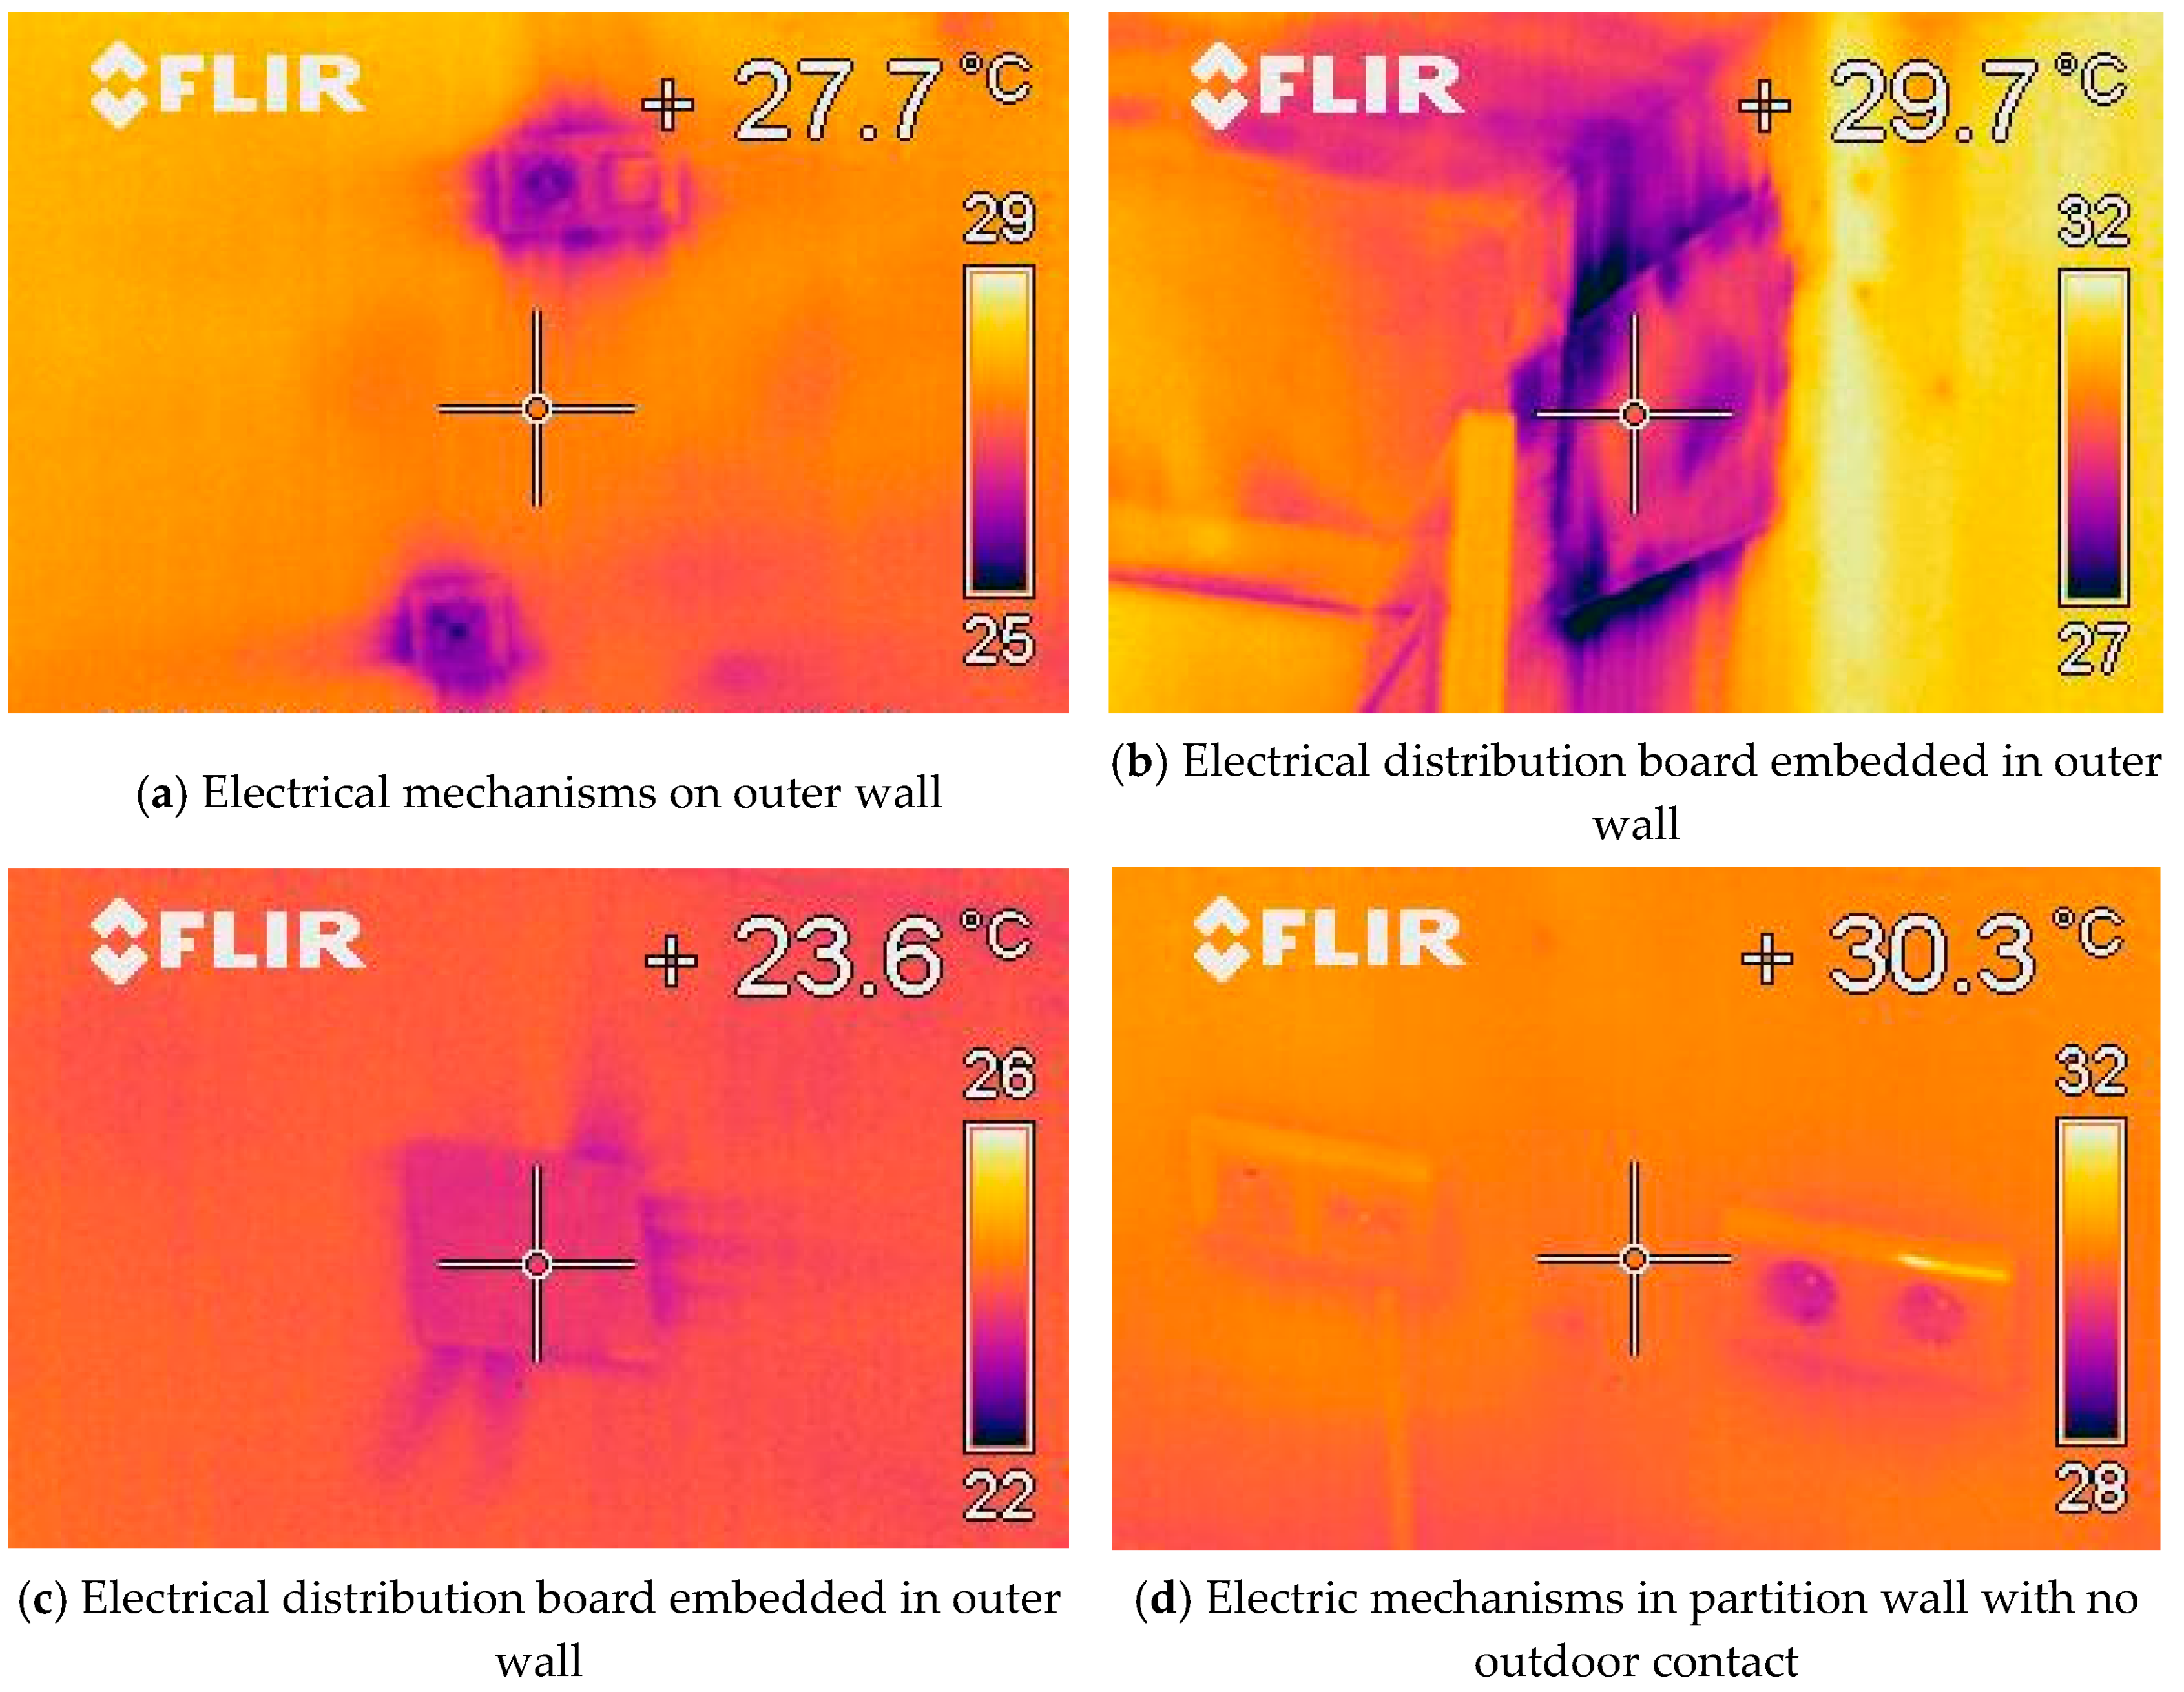
Another flow path for incoming air is associated with electric power mechanisms and conduits, as illustrated by the images reproduced
Figure 10.
These flow paths make a notable contribution to airflow, especially when located on drywall (gypsum plaster panels paper-faced on both sides) partitions and indoor façade panels, as in this case study. Intense airflow pathways formed around electrical elements (outlets and boards) located on the inner side of one of the outer walls (
Figure 10a) and a partition wall perpendicularly embedded in the outer wall (
Figure 10b,c). In contrast, the elements located on inner walls or walls barely in contact with the outer envelope made no significant contribution to the ingress of outdoor air (
Figure 10d).
3.2.2. Smoke Test
As specified in item 4.2.6 of the standard ASTM E 1186, this test can be adapted to the nature of the element studied (position of smoke source, movement, and so on) to afford a satisfactory visual image of the amount and effect of flowing air. Nonetheless, while this test locates air leakage, the visual information delivered provides only an approximate estimate of the scope of the infiltration.
The tests conducted corroborated the infrared thermographic findings. On the whole, in most of the flats, the most visible leaks were observed around window and door frames, either across the elements themselves or at the abutment with the opaque façade (
Figure 11).
The frames themselves, in particular, the sliding components, exhibited airflows more clearly than other envelope elements. Inter-panel closures (
Figure 11a) and panel–window/door frame interfaces (
Figure 11b) were the areas where airflows were most routinely identified. The indoor shutter box, whether built into the window frame or otherwise, was another area often observed to generate flow paths (
Figure 11c), particularly around the operating mechanism (although other pathways appeared in the box itself, depending on construction type and state of repair). The area around the frames (
Figure 11d) was yet another zone where air flows were identified, particularly in elements involving awkward on-site assembly.
One of the points not associated with window/door frames where airflows were observed were electric power outlets and similar mechanisms. Air leakage was often identified in mechanisms located on outer walls, especially where the element fully perforated the inner partition in masonry-air space-partition wall enclosures, connecting the indoor area with the air space (
Figure 11e). A similar situation was observed in some (especially drywall) non-outer walls perpendicularly embedded in the façade (
Figure 11f).
Despite their recurring presence in many flats, these flow paths should not be interpreted to account primarily for air leakage. Smoke tests do not identify actual flow across pathways and a given construction or framing system cannot be associated with a specific air flow rate. The actual flow volume is determined by the individual characteristics of each pathway, especially the pressure coefficient, path effectiveness, type of flow (laminar or turbulent), distance to outdoors, and areas beyond indoor space. A mere identification of their existence with no further evidence does not, therefore, mean that such flows are critical elements in flat airtightness.
Support for that consideration lies in the differences in airtightness findings in flats in one and the same development that share construction features as well as geometry and morphology. In such cases, the determinants are construction quality, degree of deterioration, and wear on specific elements.
3.2.3. Visual Inspection of Concealed Pathways
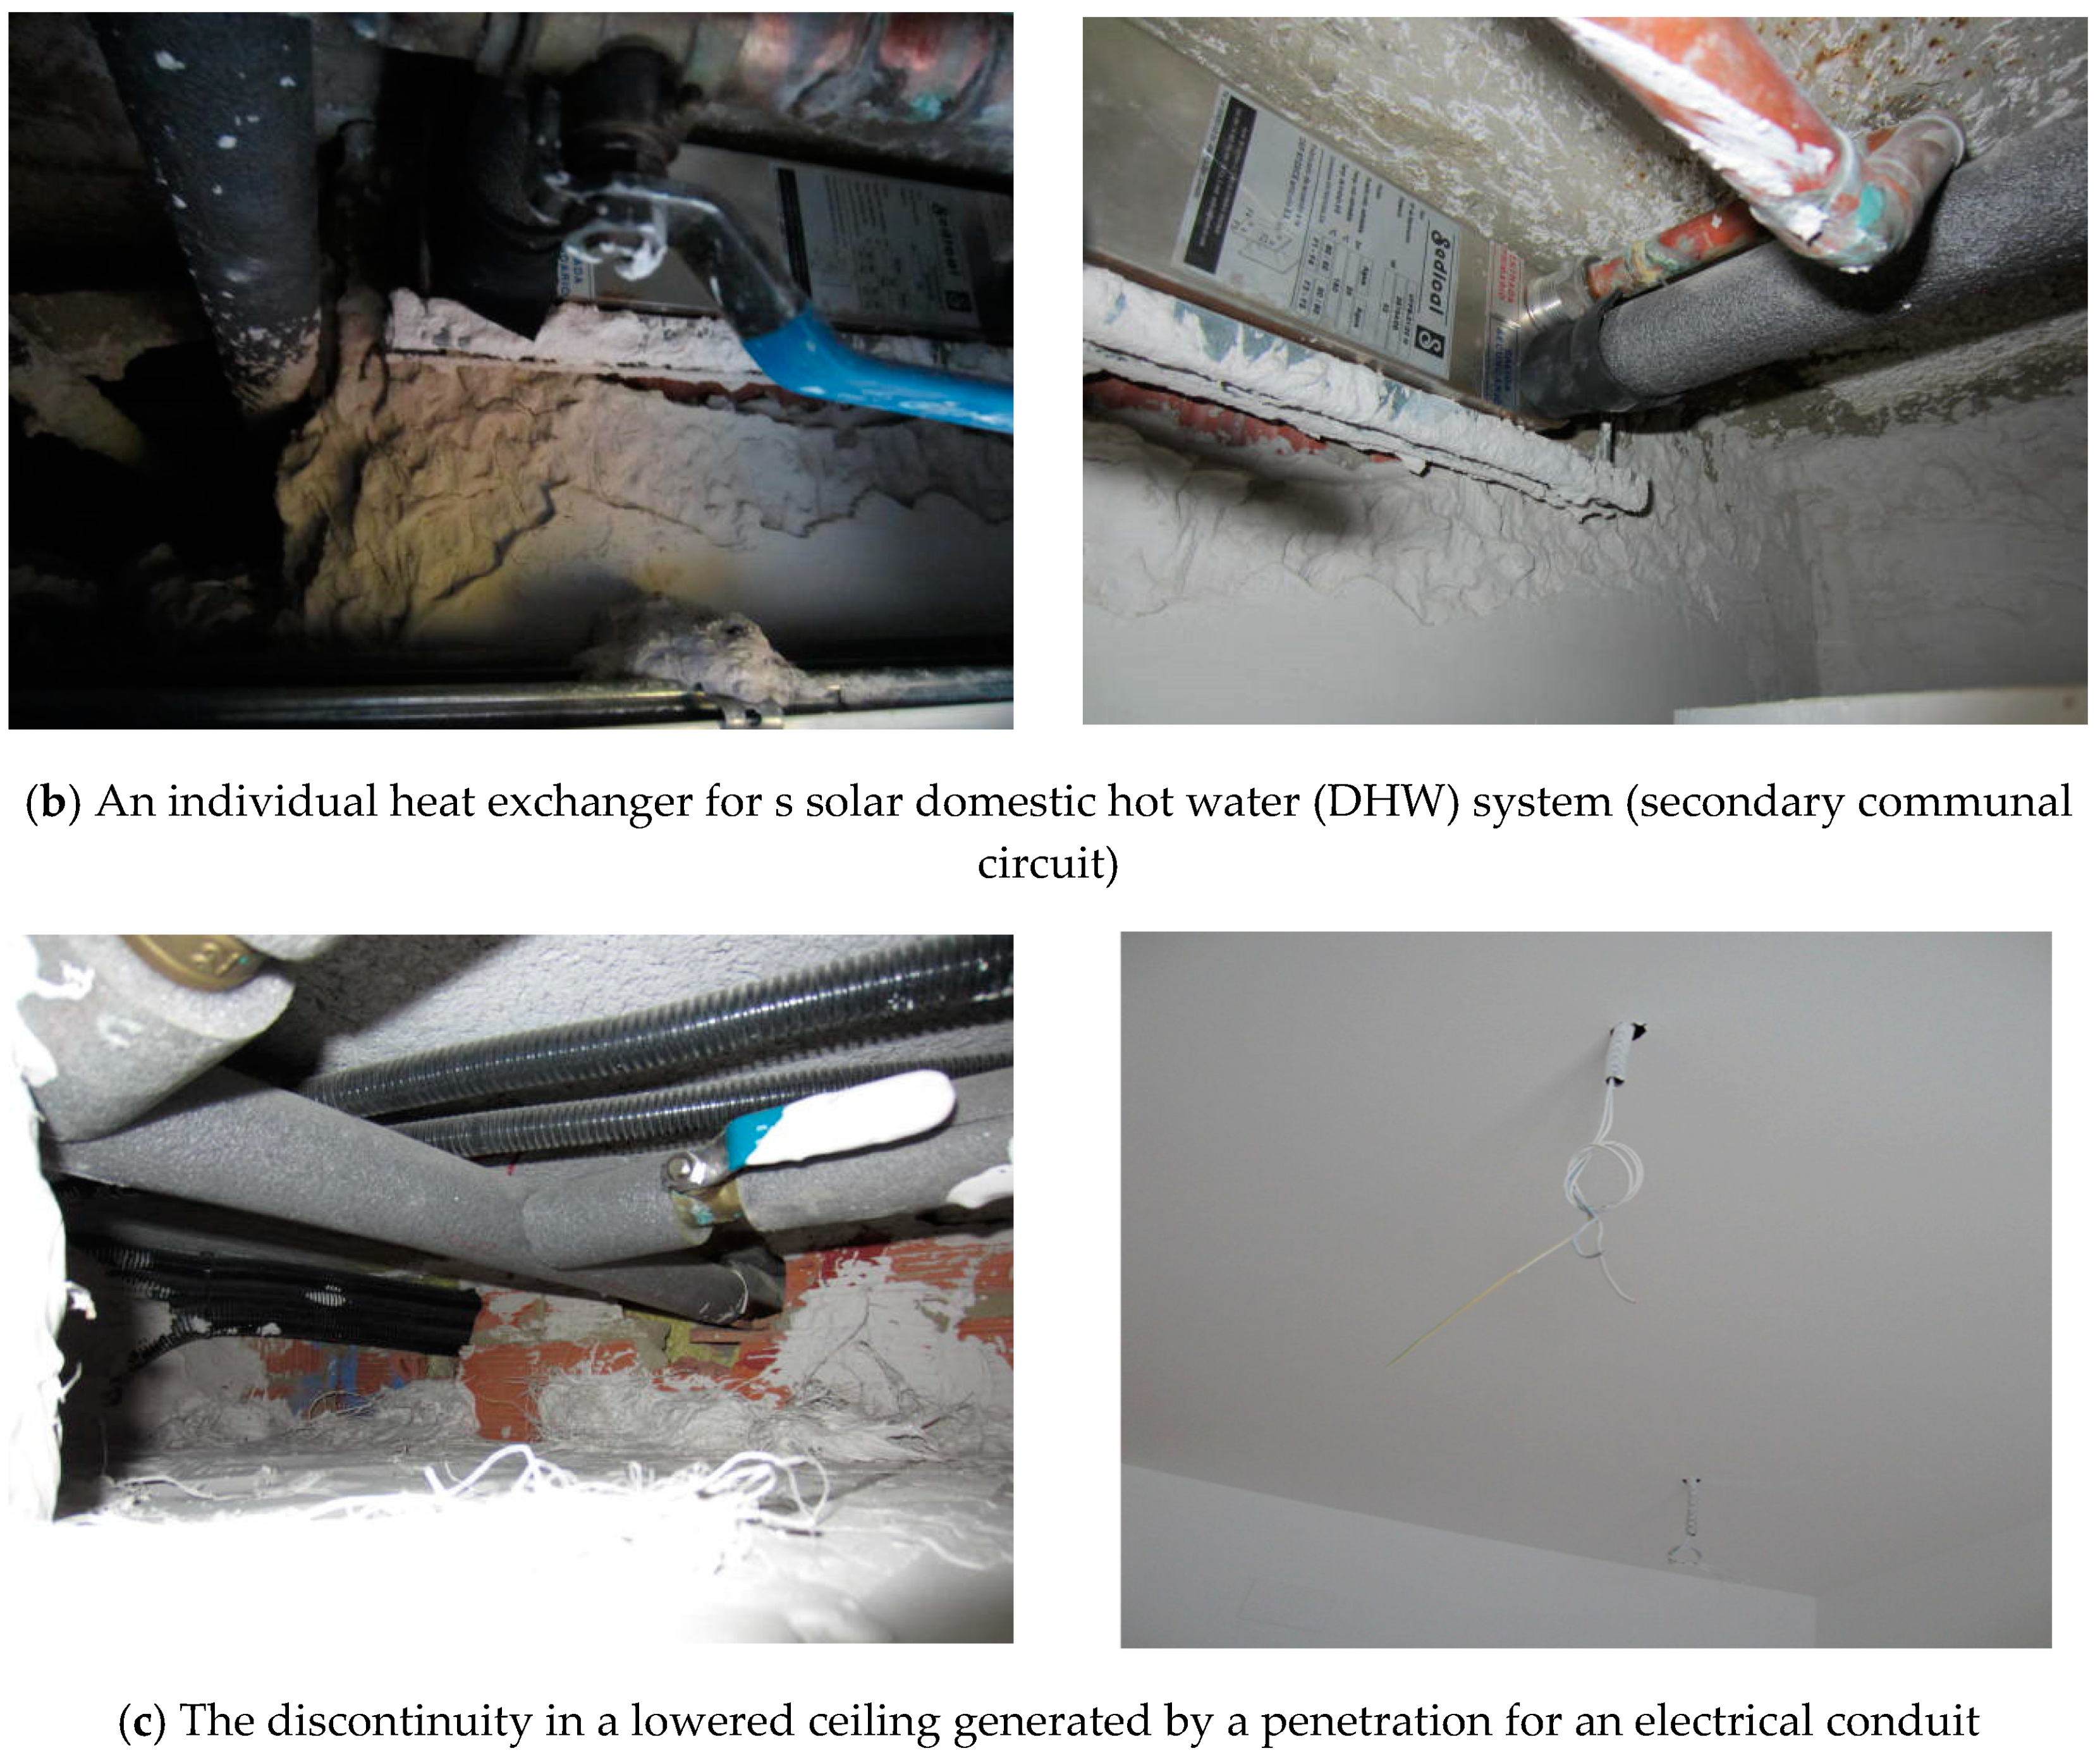
In addition to the elements studied in the preceding item, flow paths associated with service penetrations were observed to contribute significantly to overall air entry. As such penetrations are normally located over lowered ceilings not directly accessible from the flat itself (service penetrations and shafts), they are difficult to detect and identify. These penetrations connect the flat with communal areas, i.e., areas with no environmental control and normally subject to airflows as a result of either the chimney effect or of wind-induced differences in dynamic pressure (outdoor-connected openings). In some cases, these penetrations may connect directly with the outdoor air, such as in certain flats arranged around long corridors where communal building services run through non-enclosed ducts.
Most of these seldom sealed penetrations generate sizeable pathways, since they generally accommodate the drinking water service connection and in-flat distribution pipes (
Figure 12a).
One of the elements affecting more modern buildings, essentially those built to present building code specifications, is the connection to the solar water heating (domestic hot water: DHW) system. The connections to the building-wide network (secondary circuit), which runs along communal ducts, generate particularly large penetrations (
Figure 12b). The heat exchanger itself and the need to work with the element delivering heat from outside the flat often generate poorly sealed joints between spaces.
The electric power circuit also interrupts individual flat sectorisation substantially, both with regard to penetrations to accommodate conduits running into the flat from outside it and those required between rooms either across interconnected spaces above lowered ceilings or through the conduits (protective piping) themselves (
Figure 12c). Those conditions may induce an inside-outside exchange in concealed spaces that may be connected to living areas across these indoor conduits.
4. Conclusions
Two groups of properties have been distinguished, according to the applicable regulations:
Properties prior to Technical Building Standard CT79: The properties before 1979 show a greater dispersion in their basic parameters and typological approaches. However, this lack of homogeneity does not correlate with the permeability and falls within the group of properties that have a normal performance, with a mean MB value of 1139 m3/h at 50 Pa.
Properties since the Technical Building Standard CT79 came into force: In terms of the composition of the housing stock, properties built after the Basic Building Regulation CT79 came into force tend to be more homogeneous in their fundamental characteristics: morphological ratios, construction systems, etc., with less variability of the configuration parameters. Furthermore, they are somewhat more airtight than those of the previous group, presenting a mean MB value of 1197 m3/h at 50 Pa.
The tests conducted showed that air flows essentially across the vertical envelope, especially in dry areas of the flats where most of the windows are located. Nonetheless, water pipe and electric wire penetrations, vents, and similar were also found to contribute notably to envelope permeability. In contrast, no significant leakage was observed across horizontal sectorisation elements (inter-storey structural floors) or inter-flat partition walls. In the elements between flats and communal areas, the permeability was observed essentially in large (not mere crack-like) service penetrations. No differences were found between the uppermost and other stories.
For the type of façades expected in this type of housing, the main flow paths are associated with window-opaque enclosure joints. Whilst these were the most frequent entry pathways, the flow rates quantified by the tests run varied widely. Even within the same building or development, a significant scatter was observed in the flat performance. Those differences may be attributed to the manual construction procedures that characterise this type of buildings. Although windows were found to be the key elements in air leakage, no clear distinction could be drawn between window type and airtightness, with a wide variability within each of the two standard formats (sliding and hinged).
In addition to the stochastic dimension of construction and time-mediated change, envelope air permeability was observed to be governed by a combination of factors, including
façade enclosures, primarily the joints between opaque infills and openings, although they neither were a deterministic factor nor followed a linear pattern;
service penetrations through vertical partitions separating flats from communal areas for electrical wiring, water pipes, DHW, telecommunication lines, and similar.
Unsurprisingly, given the standard construction systems in place, flows were not generally observed across structural floors or inter-flat partitions.
The conclusion that can be drawn from the foregoing is that efforts to enhance airtightness should focus on designing joints between openings and masonry that are less sensitive to assembly procedures and on tightening workmanship control.
Author Contributions
Conceptualization, J.F.-A.; data curation, J.F.-A., S.D.-A., and M.Á.C.; formal analysis, J.F.-A. and M.Á.C.; investigation, S.D.-A.; methodology, J.F.-A.; writing—original draft, S.D.-A.; writing—review and editing, J.F.-A. and M.Á.C.
Funding
This study was funded by the Spanish Ministry of Economy and Competitiveness under project BIA2012-39020-C02-01 and BES-2013-063097 support.
Conflicts of Interest
The authors declare no conflict of interest.
References
- Meijer, F.; Itard, L.; Sunikka-Blank, M. Comparing European residential building stocks: Performance, renovation and policy opportunities. Build. Res. Inf. 2010, 37, 533–551. [Google Scholar] [CrossRef]
- Nicol, S.; Roys, M.; Ormandy, D.; Ezratty, V. The Cost of Poor Housing in the European Union; Instituto Nacional de Estadistica: Madrid, Spain, 2018. Available online: https://www.bre.co.uk/filelibrary/Briefing%20papers/92993_BRE_Poor-Housing_in_-Europe.pdf (accessed on 17 April 2019).
- Instituto Nacional de Estadistica. Censos de Población y Vivienda 1991; Instituto Nacional de Estadistica: Madrid, Spain, 1992.
- Instituto Nacional de Estadistica. Censos de Población y Vivienda 2011; Instituto Nacional de Estadistica: Madrid, Spain, 2011.
- Feijó-Muñoz, M.J.; Pardal, C.; Echarri, V.; Fernández-Agüera, J.; de Larriva, R.A.; Calderín, M.M.; Poza-Casado, I.; Padilla-Marcos, M.Á.; Meiss, A. Energy impact of the air infiltration in residential buildings in the Mediterranean area of Spain and the Canary islands. Energy Build. 2019, 188, 226–238. [Google Scholar] [CrossRef]
- Jokisalo, J.; Kurnitski, J.; Korpi, M.; Kalamees, T.; Vinha, J. Building leakage, infiltration, and energy performance analyses for Finnish detached houses. Build. Environ. 2009, 44, 377–387. [Google Scholar] [CrossRef]
- Ferdyn-Grygierek, J.; Bartosz, D.; Specjał, A.; Grygierek, K. Analysis of Accuracy Determination of the Seasonal Heat Demand in Buildings Based on Short Measurement Periods. Energies 2018, 11, 2734. [Google Scholar] [CrossRef]
- Alfano, F.R.d.; Dell’Isola, M.; Ficco, G.; Palella, B.I.; Riccio, G. Experimental air-tightness analysis in mediterranean buildings after windows retrofit. Sustainability 2016, 8, 991. [Google Scholar] [CrossRef]
- Meiss, A.; Padilla-Marcos, M.; Feijó-Muñoz, J.; Meiss, A.; Padilla-Marcos, M.A.; Feijó-Muñoz, J. Methodology Applied to the Evaluation of Natural Ventilation in Residential Building Retrofits: A Case Study. Energies 2017, 10, 456. [Google Scholar] [CrossRef]
- Sherman, M.H. Estimation of infiltration from leakage and climate indicators. Energy Build. 1987, 10, 81–86. [Google Scholar] [CrossRef]
- Allard, F.; Santamouris, M. Natural Ventilation in Buildings: A Design Handbook; James & James: London, UK, 1998; p. 378. [Google Scholar]
- Van den Bossche, N.; Huyghe, W.; Moens, J.; Janssens, A.; Depaepe, M. Airtightness of the window-wall interface in cavity brick walls. Energy Build. 2012, 45, 32–42. [Google Scholar] [CrossRef]
- Cuce, E. Role of airtightness in energy loss from windows: Experimental results from in-situ tests. Energy Build. 2017, 139, 449–455. [Google Scholar] [CrossRef]
- Relander, T.O.; Heiskel, B.; Tyssedal, J.S. The influence of the joint between the basement wall and the wood-frame wall on the airtightness of wood-frame houses. Energy Build. 2011, 43, 1304–1314. [Google Scholar] [CrossRef]
- Pereira, P.F.; Almeida, R.M.S.F.; Ramos, N.M.M.; Sousa, R. Testing for building components contribution to airtightness assessment. In Proceedings of the 35th AIVC Conference Ventilation and Airtightness in Transforming the Building Stock to High Performance, Poznan, Poland, 24–25 September 2014; pp. 322–330. [Google Scholar]
- Feijó-Muñoz, M.J.; Pardal, C.; Echarri, V.; Fernández-Agüera, J.; de Larriva, R.A.; Calderín, M.M.; Poza-Casado, I.; Padilla-Marcos, M.Á.; Meiss, A. Methodology for the Study of the Envelope Airtightness of Residential Buildings in Spain: A Case Study. Energies 2018, 11, 704. [Google Scholar]
- Fernández-Agüera, J.; Domínguez-Amarillo, S.; Sendra, J.J.; Suárez, R.; Oteiza, I. Social housing airtightness in Southern Europe. Energy Build. 2019, 183, 377–391. [Google Scholar] [CrossRef]
- Fernández-Agüera, J.; Domínguez-Amarillo, S.; Sendra, J.J.; Suárez, R. An approach to modelling envelope airtightness in multi-family social housing in Mediterranean Europe based on the situation in Spain. Energy Build. 2016, 128, 236–253. [Google Scholar] [CrossRef]
- Fernández-Agüera, J.; Sendra, J.J.; Domínguez, S. Protocols for measuring the airtightness of multi-dwelling units in Southern Europe. Procedia Eng. 2011, 21, 98–105. [Google Scholar] [CrossRef]
- Domínguez-Amarillo, S.; Fernández-Agüera, J.; Sendra, J.J.; Roaf, S. Rethinking User Behaviour Comfort Patterns in the South of Spain—What Users Really Do. Sustainability 2018, 10, 4448. [Google Scholar] [CrossRef]
- Díaz, J.; Carmona, R.; Mirón, I.J.; Ortiz, C.; Linares, C. Comparison of the effects of extreme temperatures on daily mortality in Madrid (Spain), by age group: The need for a cold wave prevention plan. Environ. Res. 2015, 143, 186–191. [Google Scholar] [CrossRef] [PubMed]
- Sendra, J.J.; Domínguez-Amarillo, S.; Rojas, P.B.; Leon, A.L. Energy Intervention in the residential sector in the south of Spain: Current challenges. Inf. Constr. 2013, 65, 457–464. [Google Scholar] [CrossRef]
- De la Flor, F.J.S.; Domínguez, S.Á.; Félix, J.L.M.; Falcón, R.G. Climatic zoning and its application to Spanish building energy performance regulations. Energy Build. 2008, 40, 1984–1990. [Google Scholar] [CrossRef]
- Domínguez-Amarillo, S.; Sendra, J.J.; José, I.O.S. La Envolvente Térmica de la Vivienda Social: El Caso de Sevilla, 1939 a 1979 Title, 1st ed.; Editorial Consejo Superior de Investigaciones Científicas: Madrid, Spain, 2016. [Google Scholar]
- Del Gobierno, P. Real Decreto 2429/1979, de 6 de Julio, Por el Que se Aprueba la Norma Básica de Edificación NBE-CT-79, Sobre Condiciones Térmicas en los Edificios; Boletín Oficial del Estado: Madrid, Spain, 1979. [Google Scholar]
- Sherman, M.H.; Dickerhoff, D.J. Airtightness of U.S. dwellings. Trans. Am. Soc. Heat. Refrig. Air Cond. Eng. 1998, 104, 1359–1367. [Google Scholar]
- Carrie, F.R. Comparison of Building Preparation Rules for Airtightness Testing in 11 European Countries. In Proceedings of the 35th AIVC Conference Ventilation and Airtightness in Transforming the Building Stock to High Performance, Poznan, Poland, 24–25 September 2014. [Google Scholar]
- ATTMA. Measuring Air Permeability of Dwellings. 2010. Available online: https://www.bsria.co.uk/download/asset/attma-tsl2.pdf (accessed on 17 April 2019).
- ISO. ISO 18434-1:2008 Condition Monitoring and Diagnostics of Machines—Thermography—Part 1: General Procedures; International Standarisation Office: Geneva, Switzerland, 2008. [Google Scholar]
- Alfano, D.F.R.; Dell’Isola, M.; Ficco, G.; Tassini, F. Experimental analysis of air tightness in Mediterranean buildings using the fan pressurization method. Build. Environ. 2012, 53, 16–25. [Google Scholar] [CrossRef]
- Pan, W. Relationships between air-tightness and its influencing factors of post-2006 new-build dwellings in the UK. Build. Environ. 2010, 45, 2387–2399. [Google Scholar] [CrossRef]
- Sherman, M.H.; Chan, R. Building Airtightness: Research and Practice. In Building Ventilation; Routledge: Berkeley, CA, USA, 2004; pp. 1–46. [Google Scholar]
- Sfakianaki, A.; Pavlou, K.; Santamouris, M.; Livada, I.; Assimakopoulos, M.N.; Mantas, P.; Christakopoulos, A. Air tightness measurements of residential houses in Athens, Greece. Build. Environ. 2008, 43, 398–405. [Google Scholar] [CrossRef]
Figure 1.
The air leakage paths in houses. Source: BRE Good Building Guide 67: Part 1.
Figure 1.
The air leakage paths in houses. Source: BRE Good Building Guide 67: Part 1.
Figure 2.
The location of one example case study flat.
Figure 2.
The location of one example case study flat.
Figure 3.
The blower door test protocols to locate airflow pathways.
Figure 3.
The blower door test protocols to locate airflow pathways.
Figure 4.
The contribution to the total air flow in cluster 1 flats at 50 Pa (V50): (a) wet vs dry areas and (b) the distribution in wet areas by component.
Figure 4.
The contribution to the total air flow in cluster 1 flats at 50 Pa (V50): (a) wet vs dry areas and (b) the distribution in wet areas by component.
Figure 5.
The contribution to the total air flow in cluster 2 flats at 50 Pa (V50): (a) wet vs dry areas and (b) the distribution in wet areas by component.
Figure 5.
The contribution to the total air flow in cluster 2 flats at 50 Pa (V50): (a) wet vs dry areas and (b) the distribution in wet areas by component.
Figure 6.
Case study: the thermographic analysis of the flat (red outlining = area tested).
Figure 6.
Case study: the thermographic analysis of the flat (red outlining = area tested).
Figure 7.
The window (visible spectrum) prior to the blower door test.
Figure 7.
The window (visible spectrum) prior to the blower door test.
Figure 8.
The tomographic image taken: left, prior to, and right, during the blower door test.
Figure 8.
The tomographic image taken: left, prior to, and right, during the blower door test.
Figure 9.
Thermographic images of several façade openings during a blower door test.
Figure 9.
Thermographic images of several façade openings during a blower door test.
Figure 10.
Thermographic images of the electrical mechanisms and distribution boards during a blower door test.
Figure 10.
Thermographic images of the electrical mechanisms and distribution boards during a blower door test.
Figure 11.
The smoke test during the blower door test: airflows across elements in a vertical outer enclosure.
Figure 11.
The smoke test during the blower door test: airflows across elements in a vertical outer enclosure.
Figure 12.
The identification of flow pathways in flats: concealed service penetrations connected to communal areas.
Figure 12.
The identification of flow pathways in flats: concealed service penetrations connected to communal areas.
Table 1.
Climatic data.
| | Month | 1 | 2 | 3 | 4 | 5 | 6 | 7 | 8 | 9 | 10 | 11 | 12 |
|---|
| A3 | T (°C) | 12.1 | 12.9 | 14.7 | 16.3 | 19.3 | 23.0 | 25.5 | 26.0 | 23.5 | 19.5 | 15.7 | 13.2 |
| TM (°C) | 16.8 | 17.7 | 19.6 | 21.4 | 24.3 | 28.1 | 30.5 | 30.8 | 28.2 | 24.1 | 20.1 | 17.5 |
| Tm (°C) | 7.4 | 8.2 | 9.8 | 11.1 | 14.2 | 18.0 | 20.5 | 21.1 | 18.8 | 15.0 | 11.3 | 8.9 |
| A4 | T (°C) | 12.6 | 13.3 | 15.1 | 17.0 | 19.7 | 23.5 | 26.1 | 26.7 | 24.2 | 20.4 | 16.4 | 13.8 |
| TM (°C) | 16.9 | 17.6 | 19.6 | 21.4 | 24.1 | 27.9 | 30.5 | 31.0 | 28.4 | 24.5 | 20.5 | 17.9 |
| Tm (°C) | 8.3 | 9.0 | 10.6 | 12.5 | 15.3 | 18.9 | 21.7 | 22.4 | 20.0 | 16.3 | 12.3 | 9.6 |
| B4 | T (°C) | 10.9 | 12.5 | 15.6 | 17.3 | 20.7 | 25.1 | 28.2 | 27.9 | 25.0 | 20.2 | 15.1 | 11.9 |
| TM (°C) | 16.0 | 18.1 | 21.9 | 23.4 | 27.2 | 32.2 | 36.0 | 35.5 | 31.7 | 26.0 | 20.2 | 16.6 |
| Tm (°C) | 5.7 | 7.0 | 9.2 | 11.1 | 14.2 | 18.0 | 20.3 | 20.4 | 18.2 | 14.4 | 10.0 | 7.3 |
| C3 | T (°C) | 6.5 | 8.5 | 11.4 | 13.3 | 17.2 | 22.3 | 25.3 | 24.8 | 21.1 | 16.0 | 10.6 | 7.6 |
| TM (°C) | 13.0 | 15.4 | 19.0 | 20.6 | 25.0 | 31.0 | 34.8 | 34.2 | 29.4 | 23.2 | 17.0 | 13.4 |
| Tm (°C) | 0.0 | 1.6 | 3.8 | 6.0 | 9.4 | 13.6 | 15.7 | 15.5 | 12.8 | 8.7 | 4.2 | 1.7 |
| C4 | T (°C) | 8.6 | 10.3 | 13.1 | 14.5 | 18.2 | 23.7 | 27.6 | 26.9 | 22.8 | 17.9 | 12.3 | 9.5 |
| TM (°C) | 12.1 | 14.0 | 17.4 | 19.0 | 23.2 | 29.4 | 33.7 | 32.9 | 27.7 | 21.9 | 15.7 | 12.8 |
| Tm (°C) | 5.1 | 6.6 | 8.9 | 10.0 | 13.3 | 18.1 | 21.4 | 21.0 | 17.8 | 13.8 | 8.9 | 6.3 |
Table 2.
The location and years of the sample.
Table 2.
The location and years of the sample.
| ID. | Year | Standard | Climatic Zone | City | No. of Dwellings |
|---|
| 1 | 1954 | preCT79 | A3 | Cádiz | 4 |
| 2 | 1968 | preCT79 | A3 | Málaga | 3 |
| 3 | 1971 | preCT79 | A3 | Cádiz | 3 |
| 4 | 1972 | preCT79 | A3 | Cádiz | 4 |
| 5 | 1974 | preCT79 | A3 | Cádiz | 4 |
| 6 | 1976 | preCT79 | A3 | Málaga | 1 |
| 7 | 1978 | preCT79 | A3 | Málaga | 1 |
| 8 | 1966 | preCT79 | A4 | Huelva | 3 |
| 9 | 1969 | preCT79 | A4 | Huelva | 2 |
| 10 | 1970 | preCT79 | A4 | Huelva | 2 |
| 11 | 1961 | preCT79 | A4 | Huelva | 1 |
| 12 | 1951 | preCT79 | B4 | Seville | 1 |
| 13 | 1963 | preCT79 | B4 | Seville | 3 |
| 14 | 1964 | preCT79 | B4 | Seville | 4 |
| 15 | 1965 | preCT79 | B4 | Seville | 3 |
| 16 | 1970 | preCT79 | B4 | Córdoba | 2 |
| 17 | 1973 | preCT79 | B4 | Córdoba | 1 |
| 18 | 1978 | preCT79 | B4 | Seville | 1 |
| 19 | 1959 | preCT79 | C3 | Granada | 2 |
| 20 | 1964 | preCT79 | C4 | Jaén | 4 |
| 21 | 1967 | preCT79 | C4 | Jaén | 4 |
| 22 | 2010 | CT79 | A3 | Málaga | 4 |
| 23 | 2011 | CT79 | A3 | Cádiz | 8 |
| 24 | 2012 | CT79 | A3 | Cádiz | 8 |
| 25 | 2007 | CT79 | A4 | Almería | 8 |
| 26 | 1993 | CT79 | B4 | Seville | 1 |
| 27 | 1998 | CT79 | B4 | Córdoba | 7 |
| 28 | 2004 | CT79 | B4 | Seville | 10 |
| 29 | 2010 | CT79 | B4 | Seville | 8 |
| 30 | 2011 | CT79 | B4 | Seville | 7 |
| 31 | 2011 | CT79 | B4 | Seville | 5 |
| 32 | 2010 | CT79 | B4 | Córdoba | 8 |
| 33 | 2011 | CT79 | C3 | Granada | 8 |
| 34 | 2011 | CT79 | C4 | Jaén | 5 |
| 35 | 2010 | CT06 | B4 | Seville | 8 |
| 36 | 2011 | CT06 | B4 | Córdoba | 7 |
| 37 | 2011 | CT06 | C3 | Granada | 4 |
| Total: | | | | | 159 |
Table 3.
The statistical descriptors for airflow (m3/h) at 50 Pa in cluster 1.
Table 3.
The statistical descriptors for airflow (m3/h) at 50 Pa in cluster 1.
| | Mean | Minimum | Maximum | Standard Deviation |
|---|
| MA | 1575 | 916 | 2779 | 416 |
| M1 | 1351 | 685 | 2763 | 457 |
| MB | 1197 | 547 | 2729 | 465 |
| M2 | 960 | 179 | 2499 | 458 |
| M3 | 931 | 356 | 2240 | 402 |
Table 4.
The statistical descriptors for the airflow at 50 Pa (m3/h), attributable to cluster 1 envelope components.
Table 4.
The statistical descriptors for the airflow at 50 Pa (m3/h), attributable to cluster 1 envelope components.
| | Mean | Minimum | Maximum | Standard Deviation |
|---|
| Functional openings (vents) | 378 | 0 | 756 | 151 |
| Kitchen envelope | 227 | 5 | 608 | 134 |
| Bathroom envelope | 100 | 3 | 613 | 111 |
Table 5.
The statistical descriptors for airflow (m3/h) at 50 Pa in cluster 2.
Table 5.
The statistical descriptors for airflow (m3/h) at 50 Pa in cluster 2.
| | Mean | Minimum | Maximum | Standard Deviation |
|---|
| MA | 1330 | 830 | 2808 | 509 |
| MB | 1139 | 679 | 2045 | 360 |
| M2 | 915 | 621 | 1526 | 279 |
| M3 | 763 | 401 | 1544 | 299 |
Table 6.
The statistical descriptors for the airflow at 50 Pa (m3/h), attributable to cluster 2 envelope components.
Table 6.
The statistical descriptors for the airflow at 50 Pa (m3/h), attributable to cluster 2 envelope components.
| Flow | Mean | Minimum | Maximum | Standard Deviation |
|---|
| Functional openings (vents) | 224 | 0 | 2023 | 382 |
| Kitchen envelope | 297 | 34 | 570 | 225 |
| Bathroom envelope | 107 | 4 | 402 | 129 |
Table 7.
The window temperature at the monitoring points during the blower door test.
Table 7.
The window temperature at the monitoring points during the blower door test.
| Time | T at Point 1 | T at Point 2 | T at Point 3 |
|---|
| (minutes) | (°C) | (°C) | (°C) |
|---|
| 0 | 20.8 | 21.1 | 21.7 |
| + 1 | 19.4 | 22.4 | 23.1 |
| + 2 | 18.3 | 22.1 | 22.9 |
| + 5 | 16.1 | 21.2 | 22.3 |
| + 10 | 14.0 | 20.8 | 21.3 |
| + 20 | 13.9 | 19.4 | 20.1 |
© 2019 by the authors. Licensee MDPI, Basel, Switzerland. This article is an open access article distributed under the terms and conditions of the Creative Commons Attribution (CC BY) license (http://creativecommons.org/licenses/by/4.0/).


