Carbon Emission Effects of the Coordinated Development of Two-Way Foreign Direct Investment in China


1
School of Economics and Management, Chongqing Normal University, Chongqing 401331, China
2
Institute of National Accounts, Beijing Normal University, Beijing 100875, China
3
ISA, School of Physics A28, The University of Sydney, Sydney, NSW 2006, Australia
4
Discipline of Accounting, Business School, The University of Sydney, Sydney, NSW 2006, Australia
*
Author to whom correspondence should be addressed.
Sustainability 2019, 11(8), 2428; https://doi.org/10.3390/su11082428
Submission received: 2 April 2019
/
Revised: 15 April 2019
/
Accepted: 18 April 2019
/
Published: 24 April 2019
(This article belongs to the Section Economic and Business Aspects of Sustainability)
Abstract
:This paper innovatively combines Inward Foreign Direct Investment (IFDI) and Outward Foreign Direct Investment (OFDI) as a measure of two-way FDI coordinated development to consider the coupling and coordination level of FDI. Under the analytical framework of Copeland and Taylor (1994), it introduces this new measure to investigate the effects of China’s carbon emissions during 2004–2016, using the spatial econometric model and the differential generalized method of moments. We find that China’s carbon emissions show significant spatial correlation characteristics and interregional diffusion, which indicates that regional coordinated cooperative governance is key to carbon emission mitigation in China, and that China’s two-way FDI coordinated development has presented a significant braking effect on carbon emissions during the research period. Furthermore, we decompose the effects of the two-way FDI on carbon emissions into three parts. This decomposition shows that the scale effect is positive, while both the composition and the technique effects are negative. The technique effect essentially dominates the emission reduction induced by the coordinated development of the two-way FDI.
1. Introduction
Both China’s Inward Foreign Direct Investment (IFDI) and Outward Foreign Direct Investment (OFDI) have presented the continuous rapid growing situation in recent years. The annual World Investment Report published by the United Nations Conference on Trade and Development shows that the flow on the actual utilization of Foreign Direct Investment (FDI) sharply rose to $131 billion in 2017 from $606.3 billion in 2004 in China, with a year-on-year growth of 7.9%, ranking the second in the world [1]. The data on Chinese foreign investment cooperation from Ministry of Commerce shows that the newly-increased non-financial OFDI for overseas enterprises by Chinese domestic investors in the same period rapidly rose to $15.829 billion in 2017 from $5.50 billion; in spite of a year-on-year reduction of $19.3 billion, China still ranks third in the world for OFDI [2]. It is observed from the scales of two-way FDI that China has become a true investment country with two-way FDI. It cannot be ignored that if the development of IFDI and OFDI deviates from their balanced strategy, a negative impact will be felt on China’s economy [3,4,5]. This highlights the importance of the role of the Chinese government in ensuring a balance between the “introduction of foreign investment” and the “investment in foreign countries” under the background of continuous expansion of the two-way FDI scale. In 2013, the “better combination between the introduction of foreign investment and the investment in foreign countries” was emphasized in the Third Plenary Session of the 18th Central Committee of the Communist Party of China; the development direction of “laying equal stress on the introduction of foreign investment and the investment in foreign countries” was also pointed out in the report of the 19th CPC National Congress in 2017. Driven by the strategy of laying equal stress on IFDI and OFDI, China has also begun to emphasize the coordinated development of the two-way FDI when the scales of IFDI and OFDI are continuously expanded.
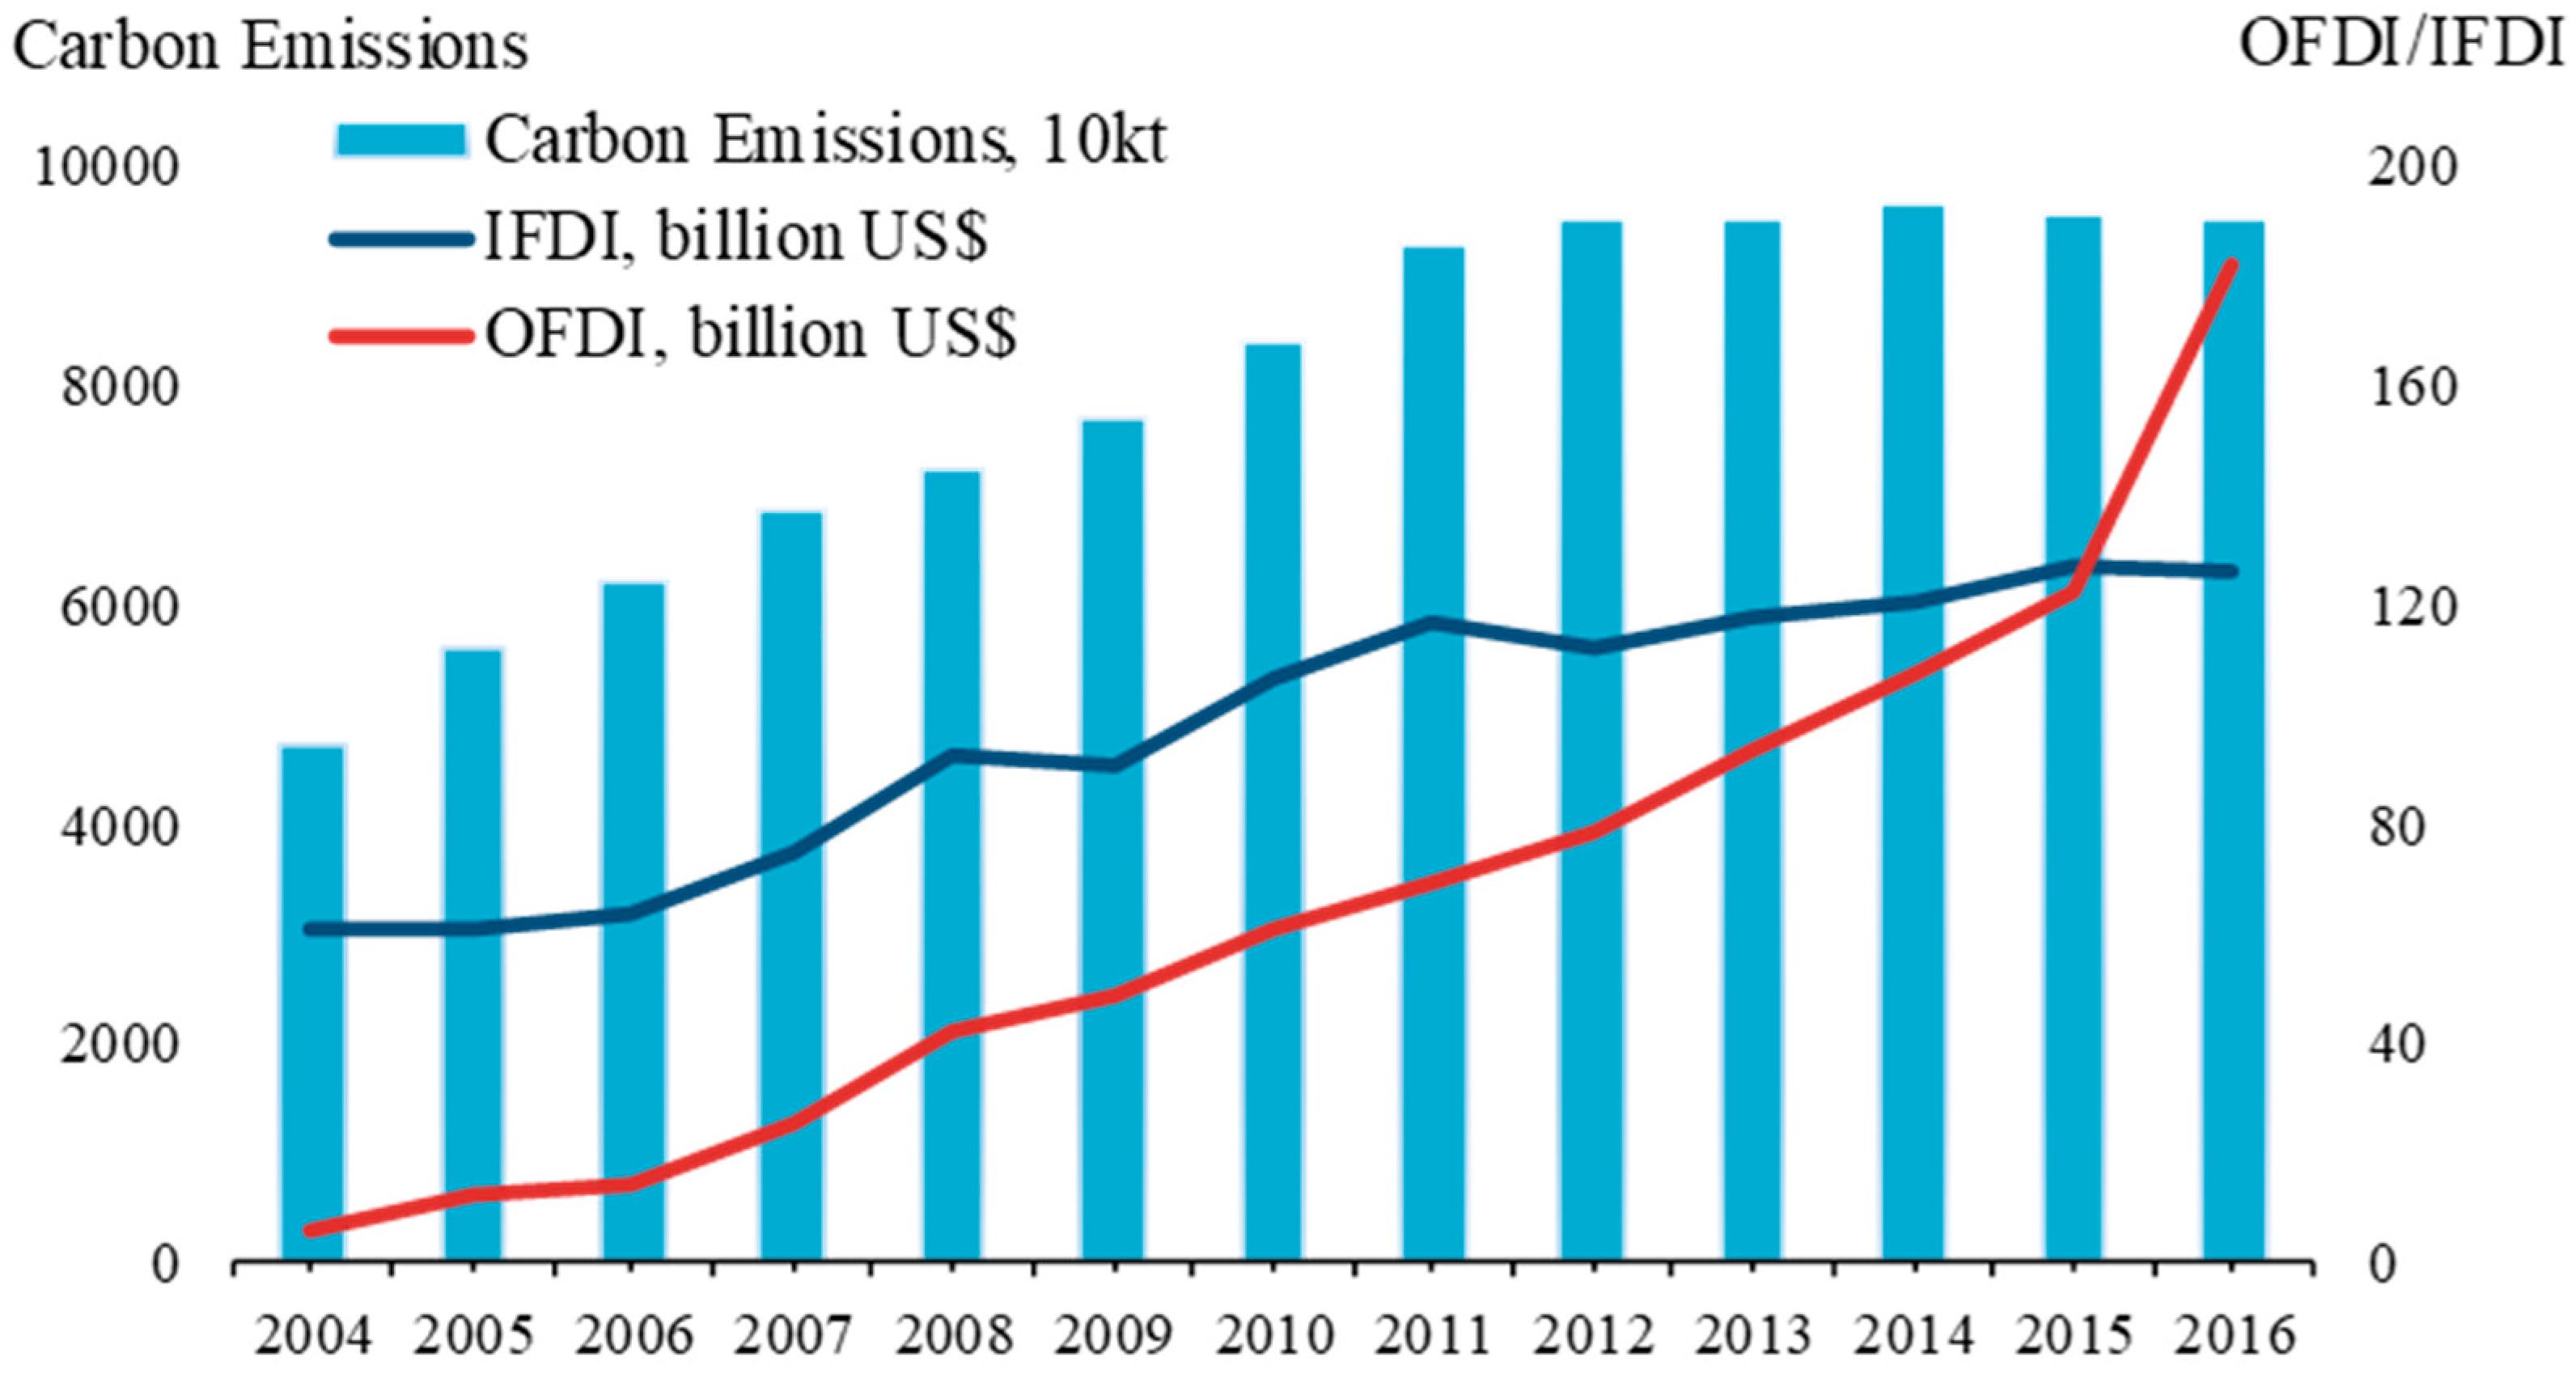
However, China’s expansion of its opening-up process has also highlighted obvious climate change issues. Both “race to the bottom line” [6] and “dirty industries transfer” theories [7,8] believe that, with the promotion of free trade, countries relax the standards of their environmental regulations in order to maintain or enhance their international competitiveness, which results in a deterioration of the global environmental quality [6]. Thus, the impacts of international economic activities on the environment have prompted governments and scholars in various countries to consider the interrelationship between cross-border economic activities and climate change. IFDI and OFDI, which is one of the main forms of cross-border capital flows, serve as an important pathway of international economic activities and the climate change issues that subsequently emerge. This has become a hot topic of constant concern and high controversy among researchers and policy makers. Figure 1 shows that China’s IFDI, OFDI, and carbon emissions maintain the continuous growth tendency at the same time. As the largest carbon emitter, China has made an arduous emission reduction commitment to respond to global climate issues. China has committed to reduce its carbon intensity (emissions per unit of gross domestic product, or GDP) by 40–45% in 2020 compared to the level of 2005 in the 2009 Copenhagen Summit, and has put forward its CO2 emission peak by 2030 within the framework of the Paris Agreement.
Therefore, China faces the growing challenge of maintaining its growing economic system, whilst at the same time ensuring economic, social, and environmental sustainability. IFDI and OFDI are primary avenues for opening to the world and embedding into the global value chain; hence, their coordinated development has become one of the important strategies for China’s current and future opening-up strategy. The achievement of win–win scenarios for the two-way FDI coordinated development and the reduction of carbon emissions has been a difficult problem, and it is a challenge for China’s economic transition and the continuous growth of its opening to the outside world. The questions that we need to answer are: what is the relationship between the two-way FDI and carbon emissions in China? Should the two-way FDI be responsible for China’s carbon emissions? To end this, in the context of the cross-border capital flow characterized by the coordinated development of the two-way FDI, the study of potential factors influencing the carbon emissions is of great theoretical and practical significance to the construction of China’s ecological civilization, and thus also to the mitigation of local pollution diffusion toward the global range, because the flows of international capital and industrial transfer are accompanied by economic globalization.
2. Literature Review
2.1. IFDI, OFDI, and Environmental Pollution
Copeland and Taylor studied the relationship among national income, pollution, and international trade by establishing a static model of north–south trade [9], and Grossman and Kruger first analyzed the impact mechanism of FDI on environmental pollution from three aspects: scale effect, composition effect, and technique effect [10]. Subsequent studies have implemented similar analysis based on the theoretical model and the impact mechanism [11,12,13].
So far, researchers have not analyzed the environmental effect of the two-way FDI coordinated development. Most published articles primarily focus on the issue of inward FDI and environmental pollution. Zhang and Guo showed that the increase of FDI inventory in China intensifies the pollution discharge through the scale effect and the composition effect, while the technique effect is beneficial for the improvement of environmental quality [14]. Sheng and Lyu introduced technical factors into the Copeland–Taylor model, further decomposing the impact of FDI on environmental pollution into scale effect, composition effect, and technique effect; they also inspected the relationship between FDI and industrial pollution by utilizing Chinese industrial data and the system generalized method of moments (GMM) estimation. The results of their study showed that FDI has inhibited the pollution discharge through the technique effect and aggravated it by the scale effect and the composition effect, and the former effect exceeds the latter two [15]. Zhou and Ying analyzed the conduction mechanism of FDI on China’s industrial pollution using simultaneous formulas, and concluded that FDI influences the pollution discharge through the channels of scale effect, composition effect, and technique effect, and the increase of FDI is beneficial to the reduction of pollution discharge [16]. Zhou and Pang empirically examined the environmental pollution effect of China by its OFDI using the simultaneous formulas model. They found that the optimization effect of the industrial structure of China’s OFDI and the spillover effect of the reverse technology promote the improvement of the environmental quality, but the non-expected conduction of both the technique effect and composition effect causes OFDI to speed up environment deterioration [17].
As the Chinese government begins to focus on the balanced development of the introduction of foreign investment and investment in foreign countries, scholars have also begun to investigate ways of addressing environmental pollution in the presence of both IFDI and OFDI. By introducing the technical level into the Copeland–Taylor framework, Gong and Liu built the dynamic panel model by decomposing the environmental pollution effect of both IFDI and OFDI into the scale effect, composition effect, and technique effect, and introduced the interaction term of two-way FDI into the model to control the two-way FDI’s interaction effect on environmental pollution. They further used the system GMM and the differential GMM methods, and found that IFDI aggravated the industrial pollution discharge in China, and the interaction between OFDI and two-way FDI has a significant restraint effect on China’s industrial pollution discharge [18]. Yang et al. used the panel data of the Yangtze Economic Belt in China to investigate the environment pollution effect of two-way FDI based on the threshold variables of environmental regulation by building the threshold regression model. The results showed that two-way FDI has a significant effect on environment pollution, and implementing appropriate environmental regulation level is key to the effect of two-way FDI on emission reduction [19].
In addition, some scholars have also introduced the spatial econometric model in order to analyze the possible spatial correlation in the context of environmental pollution. Liu et al. verified that China’s industrial pollution discharge has an obvious spatial positive correlation using the spatial econometric model, based on the Environmental Kuznets Curve (EKC) hypothesis. The results showed that there is a non-linear “N-Type” relationship between FDI and environmental pollution, and the environmental pollution improvement in China shows the trend of “the more serious, the more treatment” [20]. Xu and Deng, based on data of China’s industrial enterprises, introduced the technical distance and economic distance, respectively, into the spatial weight matrix to reflect the industrial similarity, and examined the environmental pollution effect of both FDI and industrial agglomeration by constructing a spatial Tobit model. The results showed that FDI has significantly reduced the emission intensity of industrial pollution in China, and the industrial agglomeration has further strengthened the emission reduction effect of FDI [21]. Shi et al. used the spatial panel vector autoregression (SPVAR) model and PM2.5 concentration of satellite remote sensing data to investigate the space–time effect of FDI on haze pollution. The result showed that FDI has both a time lag and a spatial spillover effect on haze pollution in China. As time goes on, the “haven of pollution” effect gets converted to the “pollution halo” effect, the impact on haze pollution by FDI is different among regions, and local governments are required to implement measures according to local conditions [22]. Yan and Qi, based on the EKC hypothesis, built the static and dynamic spatial econometric models, respectively, and found that FDI has both a “superposition effect” and a “spillover effect” on haze, which leads to an increase in the haze concentration in the environment [23].
2.2. Interactions between IFDI and OFDI
Cross-border capital flow is an important form of economic globalization. A number of studies have presented the relationships between IFDI and OFDI. The promotion function of IFDI to OFDI has been demonstrated by a number of scholars. Pan et al. used the empirical test of transnational panel data to find that the stronger the host country’s absorptive capacity to foreign investment, the larger the market scale, and the better the attraction of foreign investment to the promotion of foreign investment [24]. Chen and Li used China’s provincial panel data and the theory of an investment development path (IDP), and found that the growth of the scale of FDI in China has increased the investment of fixed assets by the local government so as to promote Chinese enterprises’ OFDI [25]. Li et al. utilized Chinese microenterprise data to study the impact on “Investment in Foreign Countries” for Chinese enterprises by the “Introduction of Foreign Investment”. The results showed that the spillover level of IFDI has a significant positive impact on OFDI for Chinese enterprises, and the “Introduction of Foreign Investment” has significantly promoted the “Investment in Foreign Countries” [26].
Only a few studies have analyzed the influence of OFDI on IFDI. Nie and Liu (2019) found that the dual transmission mechanism of China’s OFDI has a significant positive impact on the scale and quality of its IFDI. For host countries with abundant natural resources and high technical proficiency, the structural transmission mechanism of China’s OFDI affecting the quality of IFDI is particularly obvious. For low-income host countries, the exchange rate transmission mechanism of China’s OFDI affecting the scale of IFDI is more obvious [27].
Furthermore, the interaction between two-way FDI is also beginning to be widely recognized. Based on the new open economy macroeconomic framework, Tian and Wang used cross-border panel data to build simultaneous formula models to investigate the interaction relationship between IFDI and OFDI. The results found that there is a significant interaction between IFDI and OFDI, and the higher the national overall income level, the more sustainable the interactive development of the IFDI and OFDI [28]. Based on data on Chinese manufacturing industries and the panel vector autoregressive model, Huang verified the interaction effect of the two-way FDI and the global value chain drive model; the form for the division of labor and the governance model has promoted the interactive development of the two-way FDI [29].
In a nutshell, most of the previous studies have investigated the positive and negative impacts of IFDI on the host country’s environment. Some of them support the ‘pollution-haven’ hypothesis [30,31,32,33], whilst others focus on the ‘pollution-halo’ hypothesis [34,35,36]. In particular, these studies have only focused on the total effects of IFDI on the host country’s environment, and do not discuss the mechanism of IFDI on the environment [33]. Another stream of research has been undertaken on the mechanism investigation [13,15], but such literature has also ignored the possibilities of pollution diffusions across regions because of interregional economic activities.
It is important to note that there is a knowledge gap on the effect of OFDI on the host country’s environment. Although some studies have undertaken effect analysis between OFDI and the environment, further mechanism and spatial correlation characteristics still need to be investigated. Prior research has verified that an interactive mechanism exists between IFDI and OFDI [26,27,29]. Ignoring such interactions provides incomplete results, and these results obtained from a single aspect of IFDI or OFDI cannot provide an informed assessment for policy making.
Considering this evident gap in the literature, the novelty of this paper lies in three aspects. (1) Based on the objective fact of the interactive development of the two-way FDI, IFDI and OFDI are integrated as a measure for representing the level of coupling and coordination development to master the internal interaction mechanism of the two-way FDI. (2) The mechanism of two-way FDI on emissions, and the overall effect of the two-way FDI on carbon emissions, is divided into a scale effect, composition effect, and technique effect. (3) The spatial diffusion characteristics of emissions across regions are examined with the construction of the spatial econometric model, and China’s national and provincial carbon emissions caused by the two-way FDI are measured during 2004–2016 to investigate the impact mechanism of the two-way FDI’s coordinated development on carbon emissions.
3. Theoretical Model
Following the analytical framework of Copeland and Taylor [9], this paper attempts to introduce the coordinated development level of IFDI and OFDI to describe the functioning mechanism on carbon emission effect by the coordinated development of two-way FDI, which sets the theoretical foundation for the empirical analysis presented in this paper.
3.1. Basic Settings
It is assumed that only two products are produced in an economic system: one is a pollution-free clean product, , and the other is a contaminated product, . Carbon emissions are generated when the product is produced simultaneously, which leads to a negative externality effect and generates social costs. In the case of clear delimitation for property rights, enterprises pay certain fees for pollution discharge to make up for the negative impact on the environment. These expenses are usually considered environmental taxes, pollution charges, or pollution discharge permission fees. The optimal decision making for an enterprise with the goal of maximizing its profit is such that a part of the production factors is used to reduce the emissions.
This paper assumes that the production function of the product is , where capital K and labor L are factors for the production input, respectively. The potential output of the product is . The proportion of input used by the enterprise for emission reduction to the total factors is . If , the enterprise inputs all of the production factors into the production of product , which means that the enterprise totally disregards emission reduction. If , the proportion of all the production factors into emission discharge used by the enterprise is , the real output of is , and there is a certain amount of carbon emission , such that:
where is the carbon emission function for the enterprise, a decreasing function of is production technology, and the parameters are . The production function of is obtained by combining Equations (1) to (3):
3.2. Production Decision Making
Based on Equation (4), when implementing the production decision making, the enterprise should select an appropriate capital to labor ratio according to the interest rate of the external capital price and the salary of the labor price to minimize the cost for producing the unit of potential output . Given the cost for producing the unit of potential output and the carbon emission cost , an optimal combination between the potential output and carbon emission is selected by the enterprise to minimize the unit cost of the production of product , then:
The optimal first-order conditions of Equations (5) and (6), respectively are:
3.3. Pollution Discharge Decision Making
Assuming that in a fully competitive market, the profit of the enterprise is zero, and the price of the product is . Then:
Obtained from Equations (8) and (9):
Further, Equation (10) is transformed as:
Defining , , Equation (11) is sorted and log-linearized as:
Equation (12) shows that when the enterprise produces product , its carbon emissions are related to the production scale , production composition , and the production technique ; that is, the carbon emissions are influenced by the scale factor, the composition factor, and the technique factor.
3.4. Impact Mechanism of the Two-Way FDI on Emissions
The impacts of China’s IFDI on domestic environment shows that ① IFDI has expanded the production scale and output level of domestic enterprises in China, while the pollution discharge as derivatives in the production process increased along with the expansion of production scale. Thus, the scale effect of IFDI has a positive effect on China’s pollution discharge. ② The technology spillover effect caused by the IFDI has promoted the technological progress of Chinese enterprises. Technological progress usually is directional in practice, and can be divided into progress tending to production technology and progress tending to emission reduction technology. The former can increase the production scale and thus increase emissions by improving productivity; the latter can reduce emissions by improving emission reduction technology. The direction of technological progress determines the direction of impact on emissions. Thus, the technique effect of IFDI has uncertainty regarding increasing or decreasing the impact of emissions in China. ③ IFDI has led to the adjustment of the production composition of Chinese domestic enterprises. The IFDI has rapidly expanded the relative proportion of the capital elements of enterprise, and thus improved the ratio of capital to labor. The higher ratio of capital to labor in the production means higher technical efficiency, and thus the ratio of capital to labor can also reflect the level of the technical level to a certain extent. In general, capital-intensive production has a higher technology level, and the labor-intensive production technology level is lower [33]. It is worth noting that capital-intensive industries may have cleaner production technology [37] and also carry higher energy consumption and emission demand [18] at the same time. Therefore, the composition effect of the IFDI has uncertainty on the impact of domestic emissions in China.
The impacts of China’s outward FDI on domestic environment represent the following. ① The OFDI of Chinese enterprises can influence emissions by adjusting its production composition. On the one hand, the OFDI of Chinese enterprises can change the proportion of its capital to labor in domestic production, which is similar to the IFDI to change the domestic ratio of capital to labor, inducing uncertainty on the direction of pollution discharge. However, on the other hand, in the process of OFDI, Chinese enterprises can transfer some high-pollution and high-energy-consumption production lines to foreign countries to reduce the domestic emissions. Therefore, the comprehensive effect of two aspects also makes the direction of China’s FDI on domestic emissions uncertain. ② The OFDI of Chinese enterprises can also promote the domestic technological progress through the reverse technology spillover effect, which is consistent with the technology spillover effect of IFDI, and the deviation of the technological progress determines the direction of its impact on emissions. Therefore, the technique effect of Chinese enterprises’ OFDI has the same uncertainty on the impact direction of emissions. ③ Chinese enterprise’ OFDI also contributes to the promotion of the motherland’s economic growth and the expansion of the domestic output scale. Due to the greater proportion of China’s second industry in the national economy in the past decades, the higher economic scale means a higher level of industrialization and more emission generation. Therefore, China’s OFDI has a positive impact on domestic emissions.
Considering the above effects of IFDI and OFDI on emissions and the interaction between the two-way FDI, we incorporate the IFDI and OFDI into a system to investigate the effect of integrated FDI on the economic and social development. Coupling was originally a concept in physics, which means that the phenomenon of synergy is caused by interactions among two or more systems. In other words, coupling refers to a phenomenon in which two or more systems or forms of motion interact with each other through various interactions. The degree of coupling reflects the measurement for such a kind of synergy. To describe the interaction feedback mechanism between IFDI and OFDI, referring to the model of coupling degree in physics [38], the coupling relationship between IFDI and OFDI can be expressed as:
Due to the difference between IFDI and OFDI and the unbalanced characteristics of the two-way FDI development in each region, lower values of IFDI and OFDI may have a higher degree of coupling. In addition, the coupling degree model can only indicate the existence of interaction between systems, and cannot reflect the level of coupling and coordination between systems. Thus, the degree of coordination is introduced to avoid confusion:
where . , a large value refers to a high degree of coordination for IFDI and OFDI; conversely, a small value refers to a low level of coordination for both cases. Similar to the impacts of both IFDI and OFDI on enterprises’ emissions through production scale, production technique, and production composition, the coupling coordination system of IFDI and OFDI also influences enterprises’ emissions through the above three aspects.
An increase of domestic research and development (R&D) expenditure enhances the independent innovation ability of enterprises and promotes the progress of enterprise production technology to a certain extent [18]. Thus, the technique effect function can be expressed as:
In addition, factor endowment can influence the production structure of enterprises. Emissions are significantly related to the ratio of capital to labor KL [18]. Therefore, the composition effect function can be expressed as:
This paper also assumes that the scale of production is a function of COOR [18], and the scale effect function can be expressed as:
In combination with Equations (14) to (17), Equation (12) can be rewritten as:
Equation (18) shows that the impacts of the coordinated development of two-way FDI on the carbon emission is realized by the scale effect, the composition effect, and the technique effect. The total effect depends on the relatively strong and weak relationship among the three effects.
Since domestic R&D expenditure (RD) is an exogenous variable, the coordinated development level of two-way FDI (COOR) derivation is made on both sides of Equation (18) and multiplied by COOR to obtain:
Also, this paper assumes that there exists an effect relation of the two-way FDI development on the capital–labor ratio (KL): . It is assumed that the labor supply is exogenous, and this paper does not consider the effect of the two-way FDI on the intrusion or crowding of the domestic capital. Referring to Sheng and Lyu’s methodology, according to Equation (19), the effect of the two-way FDI development on emissions can be written as [15]:
In Equation (20), , and is the capital output elasticity.
4. Econometric Model, Variable Definitions, and Data Descriptions
4.1. Basic Model and Estimation Method
Carbon emissions, as an externality factor in economic development, can transfer not only through atmosphere diffusions due to a change of natural climate conditions, but also through industrial shifts and element flows in human activities, and generate the phenomenon of spatial transmission. Thus, carbon emissions may have a significant correlation effect in space [39]. The omission of such spatial correlation will necessarily result in an error in the estimation of models and false parameter tests [40]. This paper introduces a special weight matrix, and uses the spatial econometric model to control the possible spatial association.
Then, we expand Equation (18) to construct the econometric model as follows:
where is a spatial weight matrix reflecting the spatial relationship among the units; is a set of control variables; represents the individual effect; is a random disturbance term; both and are the spatial lag coefficients reflecting the space-dependent relation between variables; and is the spatial error coefficient reflecting the spatial relation existing in the random disturbance item. If both and are equal to zero, Equation (21) is a Spatial Error Model (SEM), which means that the spatial relations are influenced by unobservable factors in different regions; that is to say, the spatial correlation features are reflected in random perturbation terms. If both and are equal to zero, Equation (21) is a Spatial Lagged Model (SLM), which means that spatial relations come from explained variables between different regions. If is equal to zero, Equation (21) is a Spatial Dubin Model (SDM), which means that spatial relationships are not only derived from explained variables between different regions, but also from explanatory variables between different regions. The specific model settings are required to be further inspected.
Due to the spatial lag term being included in the model, a mutual causality between the dependent and independent variables exists, which leads to endogeneity problems. So, the OLS, fixed effects, and random effects estimators have a large probability to be biased. However, Arellano and Bond presented a differential generalized method of moments (DIFF-GMM) estimation [41] that can solve those problems effectively. The authors suggest using the lagging term of endogenous explanatory variable as the instrumental variable of difference term to control the endogeneity. Therefore, this paper chooses the difference GMM to estimate Equation (20). As a consistent estimate, GMM requires instrumental variables to be strictly exogenous and highly correlated with endogenous variables, and there is no autocorrelation in the disturbance term. These require the Hansen or Sargan instrumental variable tests and the Arellano–Bond autocorrelation test [42].
4.2. Construction of Spatial Weight Matrix
The common spatial weight matrices include the 0–1 adjacent weight matrix, the geographic distance weight matrix, and the economic distance weight matrix. We consider that the 0–1 neighboring weight matrix does not reflect the spatial connections between individuals that are geographically adjacent, but not bordering. Although the geographic distance weight matrix or the economic distance weight matrix respectively reflect the relationship between individuals regarding geospatial and economic behavior, the spatial correlation between actual regions may not only come from one aspect of geography or economy. Therefore, this paper adopts a nested form of geographic distance and economic distance, which not only takes the spatial influence of the geographical distance into account, but also reflects the objective fact of economic factor overflow in the interregions [43].
This paper sets the spatial weight matrix as:
where represents the proportion of the economic distance space weight to the geographical distance space weight. This paper chooses . is the economic distance weight matrix with the definition as:
In Equation (23), is the economic distance between two regions, the difference of two regions’ per capita GDP is used as a proxy in this paper, and is the geographic distance weight defined as:
where is the geographical distance between two provinces’ capital cities.
In addition, the global spatial autocorrelation tests are carried out for China’s carbon emissions using Moran’s I, and its scatter diagram describes the overall spatial relationship among all the units within the study’s scope. Moran’s I is a measure of the spatial autocorrelation developed by Pratrick Alfred Pierce Moran [44], reflecting the correlation between the observed value and the spatial lagging term; that is, the certain property value in one region is related to the same attribute value in a nearby region [45]. Moran’s I is defined as:
where is the element of the spatial weight matrix. Moran’s ; if the value of Moran’s I is greater than zero, it means that there is a positive spatial correlation, and vice versa.
4.3. Definitions of Variables
The factors affecting carbon emissions are complicated. In this study, we study the effects at the provincial level, because regional differences between provinces is an important issue that can’t be ignored. To this end, in this paper, the variables with regional difference characteristics are selected as far as possible to describe the regional heterogeneity and to avoid the bias error caused by the model estimation due to missing variables. The specific variables are defined as follows:
1. Explained variables: carbon emissions ()
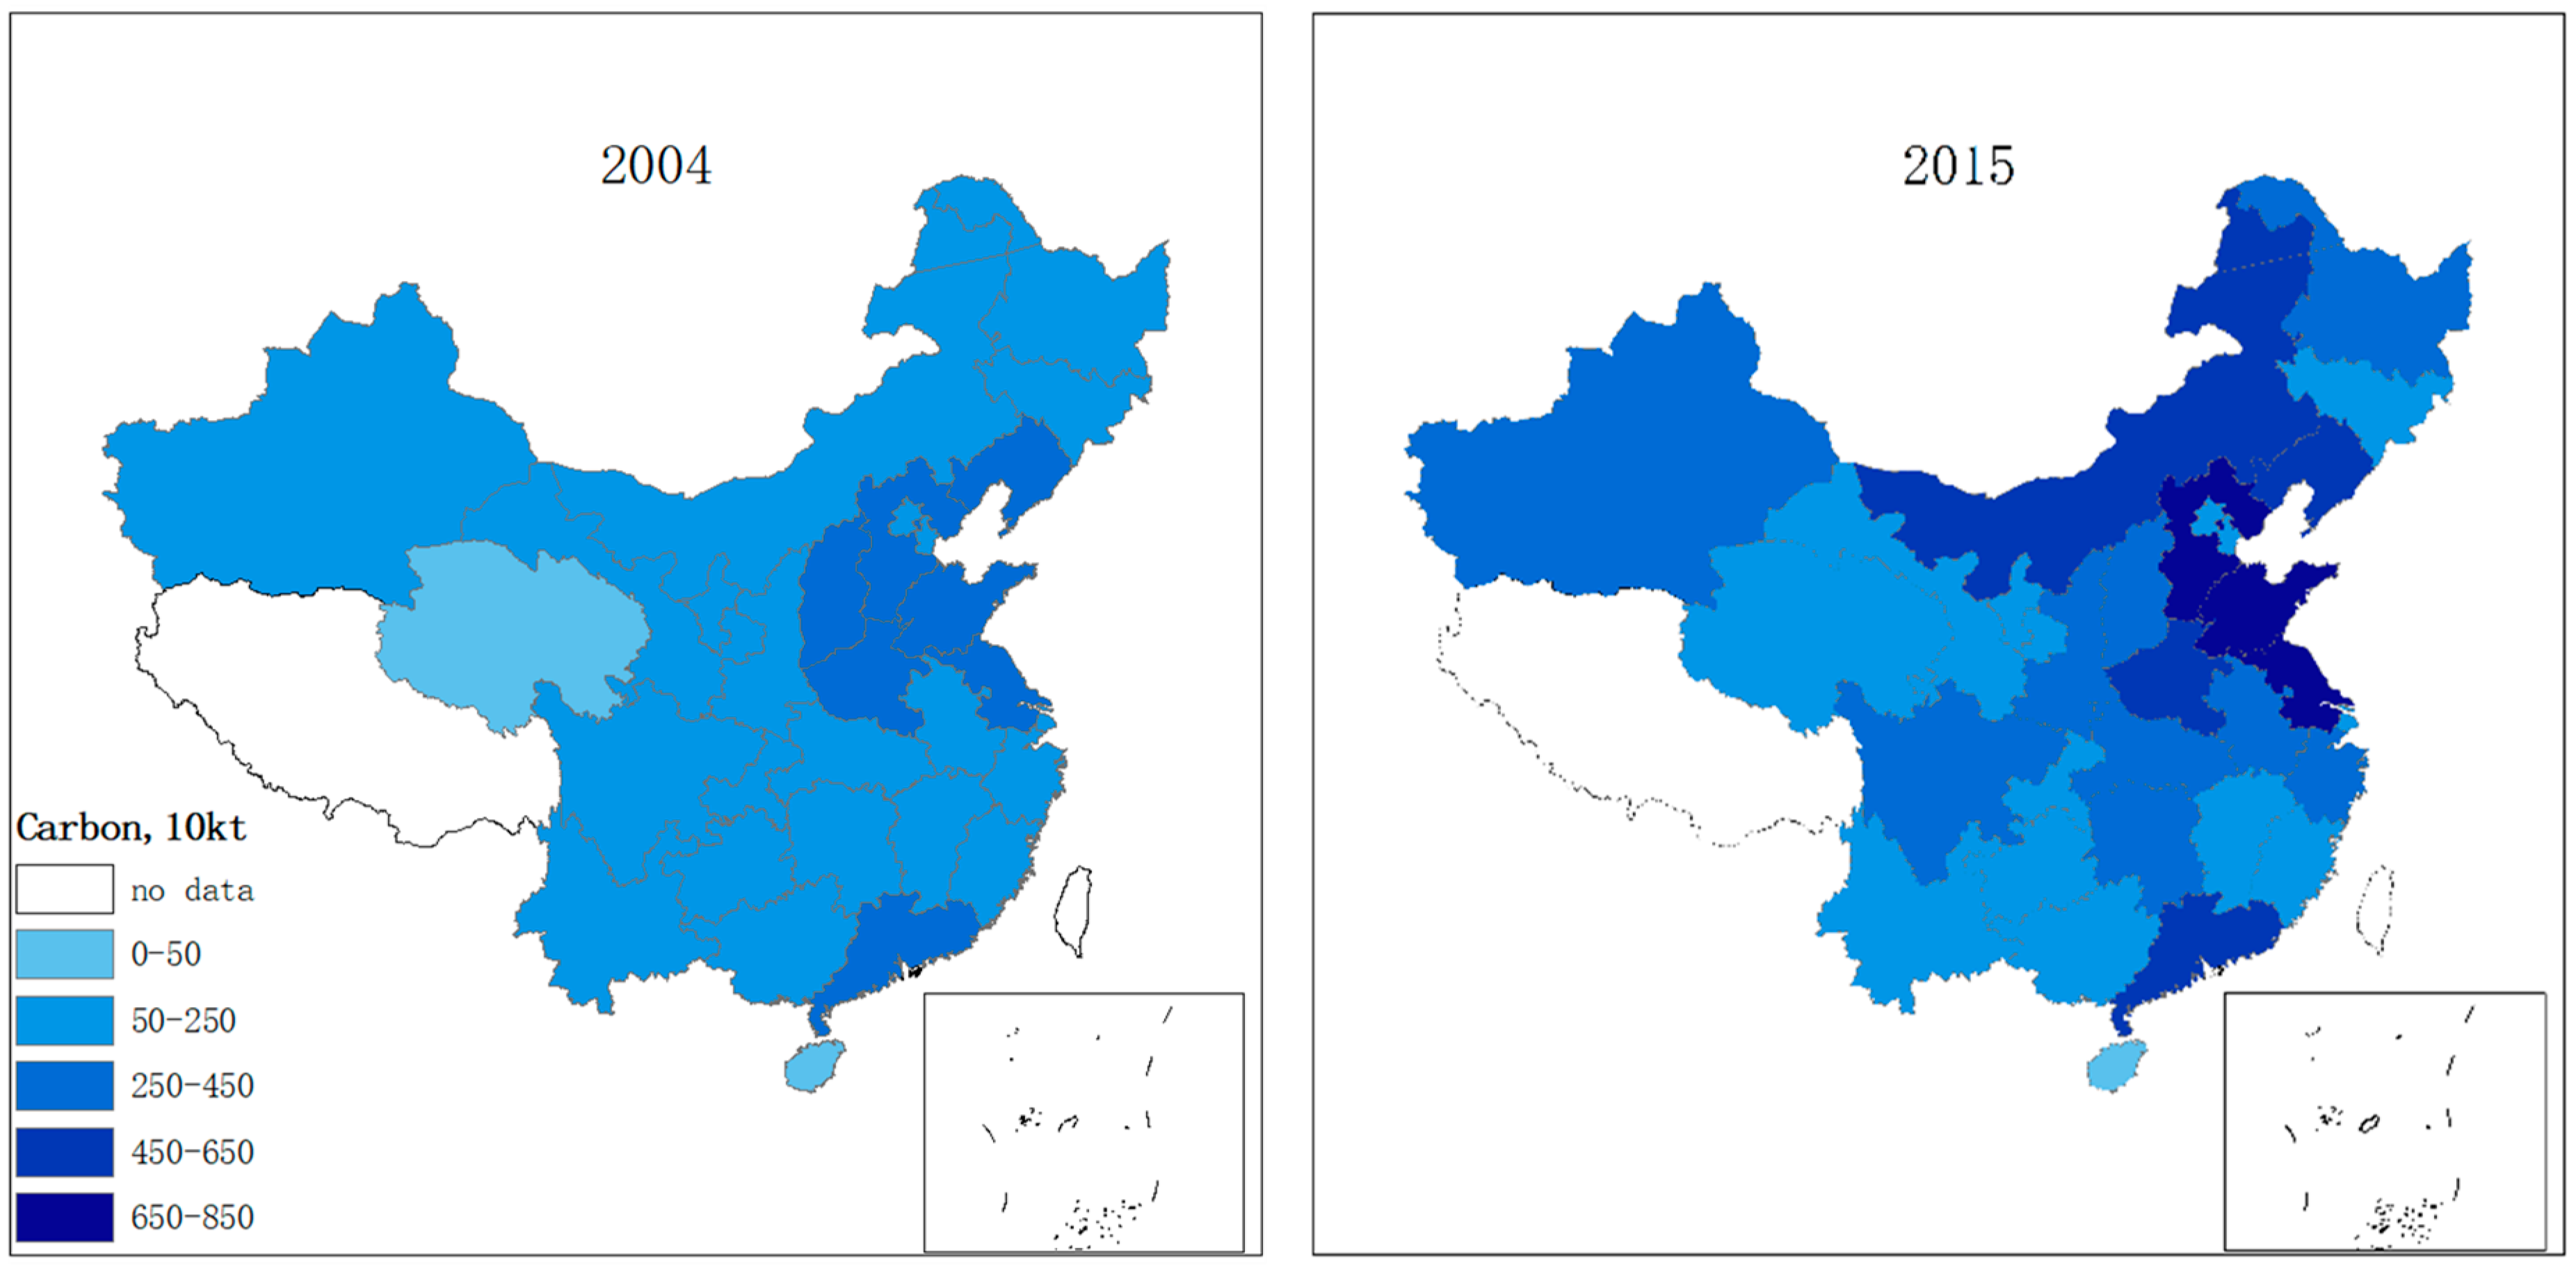
The carbon emission data from 30 provinces, municipalities directly under the central government, and the autonomous regions are from the China Emission Accounts and Datasets (CEADs) [46,47]. It refers to the emissions generated in the process of combustion for 17 kinds of fossil fuels and cement production. CH4, N20, and other greenhouse gases are not included. The latest carbon emission data currently published by the database is only to 2015. This paper uses the quadratic exponential smoothing algorithm and China’s provincial carbon emission data from 2004 to 2015 to estimate the missing data for 2016. The carbon emissions in Chinese provinces show an obvious agglomeration phenomenon (Figure 2). Inner Mongolia, Shanxi, Henan, Hebei, Shandong, Liaoning, and Jiangsu were the highest carbon-emitting provinces in 2004, while Xinjiang, Gansu, Yunnan, and Guangxi were the lowest. Similarly, in 2015, Inner Mongolia, Shanxi, Henan, Hebei, Shandong, Liaoning, and Jiangsu were still the highest carbon-emitting provinces, while Yunnan, Guangxi, Guizhou, Chongqing, Jiangxi, and Fujian were the lowest ones, indicating that the carbon emissions in Chinese provinces show relatively stable gathering characteristics.
2. Core explanatory variable: coordinated development level of two-way FDI (COOR)
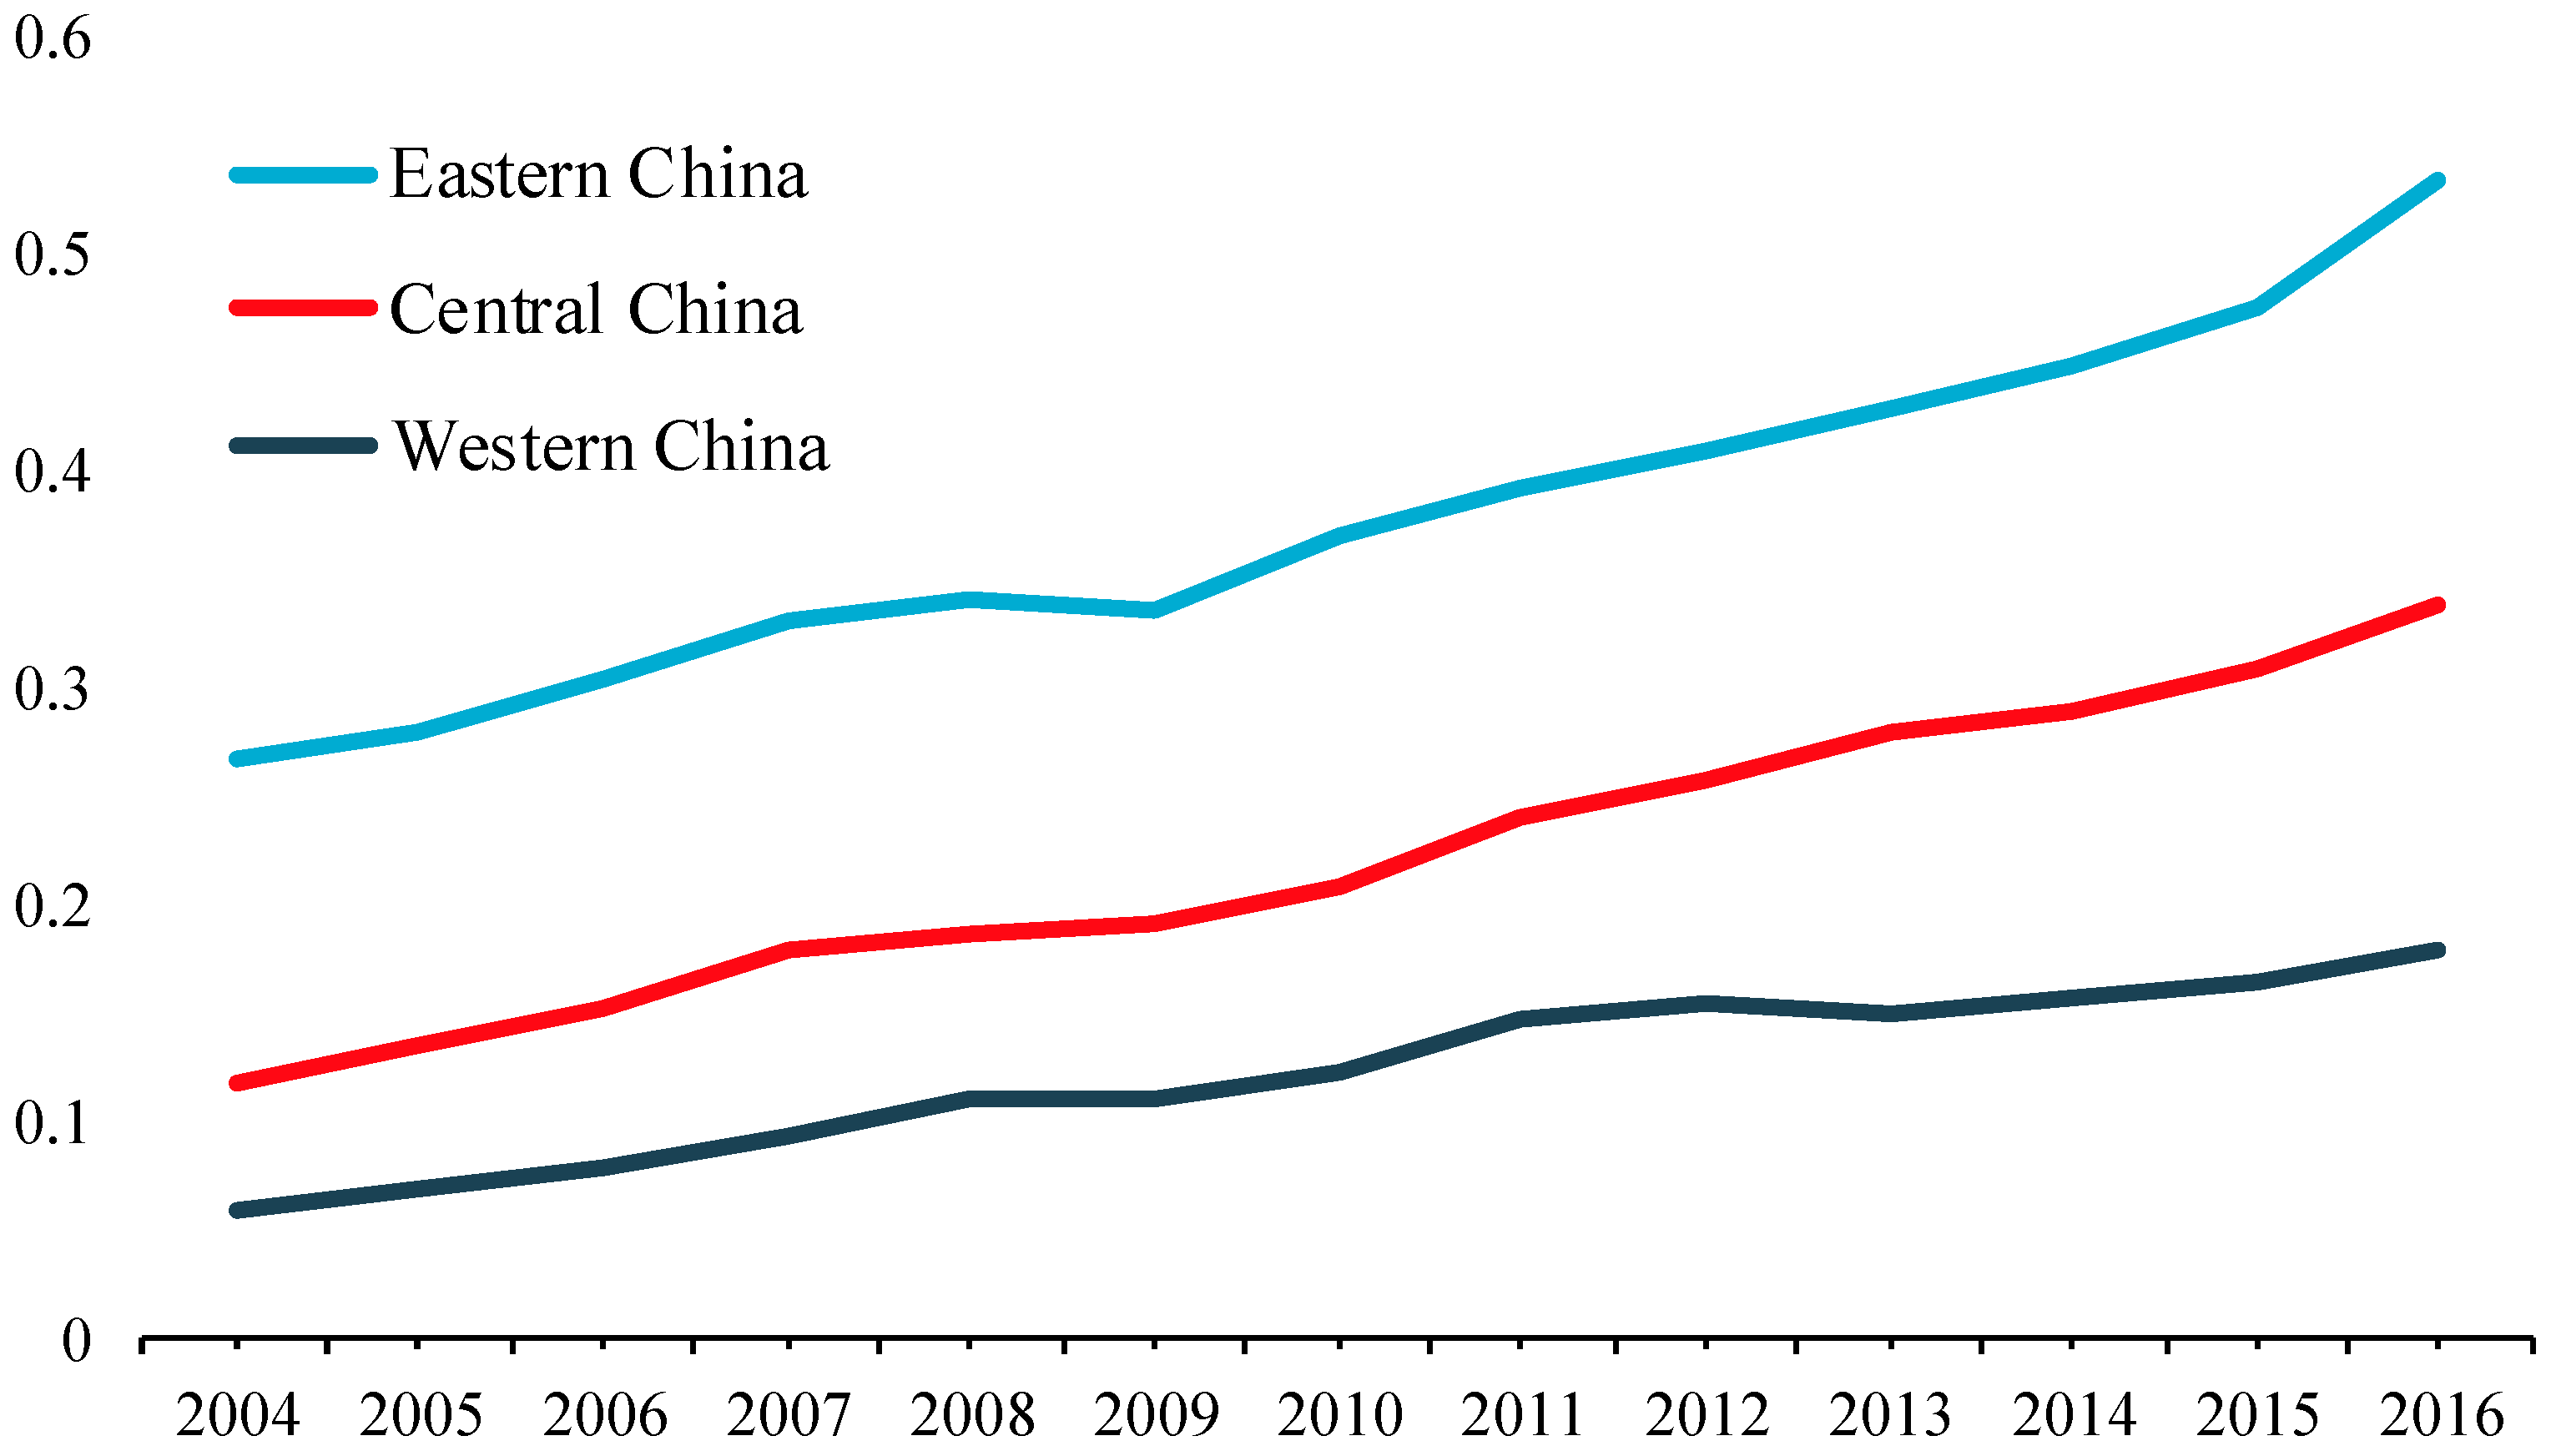
This paper selects the actually utilized value of foreign direct investment by each province and the overseas direct investment of each province to measure the flow of inward FDI and OFDI, respectively. The coordinated development levels of IFDI and OFDI are calculated by Equations (13) and (14), with ① usually being considered as low-degree coupling coordination; ② being considered moderate coupling coordination; ③ being considered high-degree coupling coordination; ④ being considered extreme coupling coordination. In Figure 3, the vertical coordinate representing the coupling coordination level shows an imbalance phenomenon among regions for the coordinated development of China’s two-way FDI: the eastern regions of the two-way FDI’s coupling coordination level rank the highest, the central regions are in the middle, and the western regions are the lowest.
3. Other control variables
Output scale (S): Carbon emissions, as derivatives from the production process, are directly linked to the scale of an economy’s output. Carbon emissions in the production process will also increase with the expansion of the output scale. The gross domestic product (GDP) of each province in this paper is selected as the proxy variable of the output scale. The real GDP is obtained using the GDP index for converting GDP at the current price into the constant price at the base year of 2004.
Environmental regulation intensity (REGU): In general, the greater the government’s investment in environmental pollution control, the stricter the punishment for pollution discharge against rules; the pollution discharge can be controlled to a certain extent to improve the environmental quality. This paper uses the proportion of investment value for environmental pollution control to provincial GDP as a proxy variable for environmental regulation intensity.
Capital–labor ratio (KL): This paper uses the ratio of fixed capital stock to the annual average employees in each province to measure the input composition of production factors for enterprises, where fixed capital stock is obtained using the perpetual inventory method for the base year 2004 with the depreciation rate of 9.6% taken from Zhang et al. (2004) [48].
Industrial structure (ISS): The industrialization promotion will generate more emissions. At the early stage of economic development, extensive economic growth has a negative impact on the environment, the mode of economic growth will transfer into the intensive type with the economic development to a certain extent. In this paper, the proportion that the value of the second industry added to the GDP of each province is selected as the proxy variable for the industrial structure.
R&D expenditure (RD): The impact of R&D expenditure on technological progress is directional, and thus, the impact on the environment is also uncertain. R&D expenditure includes investment in the research and development of more advanced environmental technologies and cleaning equipment, and also to increase productivity and production output. The proportion of the R&D expenditure to the GDP of each province in this paper is selected as the proxy variable for R&D investment.
4.4. Data Sources
This paper covers 30 provinces, autonomous regions, and municipalities directly under the central government (excluding Tibet) in the Chinese mainland and the period between 2004–2016. Table 1 shows the main data sources and related explanations. Table 2 presents the descriptive statistics of variables. Variables in absolute terms are transferred into logarithmic values to eliminate the differences in order of magnitudes.
5. Empirical Results and Discussion
5.1. Spatial Correlation Test of Carbon Emissions
This paper implements the spatial autocorrelation Moran’s I test for provincial carbon emission levels. Table 3 shows that the Moran’s I is 0.688, representing that the test is significant at the 1% significance level. This indicates that provincial carbon emissions have a significant spatial correlation characteristic.
Figure 4 further shows that most of the provinces are in quadrants I and III, which indicates that carbon emissions have a high positive correlation among 30 Chinese provinces. This also demonstrates that China’s carbon emissions present the “high–high” and the “low–low” agglomeration phenomenon.
The horizontal axis represents the carbon emissions level after logarithmetics and the vertical axis is the spatial lagging value of carbon emissions. Each quadrant represents a different spatial autocorrelation type. Quadrant I and quadrant III represent the “high–high” and “low–low” positive correlations, respectively; quadrant II and quadrant IV represent the “low–high” and “high–low” negative correlations, respectively.
5.2. Results of Model Estimations
A series of tests in this paper are carried out to select an appropriate econometric model. Both the Lagrange multiplier (LM) test and the robust LM test of the spatial lag model significantly reject the null hypothesis that there does not exist spatial autocorrelation, while the robust LM test of the spatial error model cannot reject the null hypothesis (Table 4). This indicates that the spatial lag model is applicable to the data employed in this paper, and the spatial lag model is used in this paper. The estimation results of Equation (20) are shown in Table 5. The key estimation results of two-step differential GMM are given in models 3 to 5. In comparison, models 1 and model 2 represent the estimation results of the fixed effect and the random effect, respectively.
5.2.1. Results of One-Way FDI Models
Models 4 and 5 focus on the effects of IFDI and OFDI on provincial emissions in China, respectively. The various tests of models 4 and 5 are good. Second-order autocorrelations of random disturbance term of the difference equations do not exist. Both the Hansen test and the Sargan test show that the tool variable is effective.
The impact of IFDI on China’s carbon emissions is negative (Model 4), showing that the introduction of foreign investment has a significant inhibiting effect on China’s carbon emissions and can effectively improve the environmental quality of China. This is mainly because foreign capital brings the advanced emission reduction technology, and cleaner production factors directly or indirectly (mainly refer to the overflow between the enterprises) have a stronger inhibiting effect on carbon emissions than the transfer on high-pollution and high-energy consumption.
Model 5 shows that China’s overseas direct investment has a significantly positive impact on domestic carbon emissions, i.e., China’s OFDI leads to an increase in domestic carbon emissions. China’s overseas direct investment is mainly concentrated in the leasing and business service sector. This cannot transfer the domestic high pollution and high energy-consumption industries, and the reverse technology overflow has a limited promotion effect on the domestic emission reduction technology. Additionally, the economic growth effect brought by overseas direct investment has also expanded the scale of domestic industrial output, leading to more carbon emissions. In summary, China’s OFDI has intensified domestic carbon emissions.
5.2.2. Results of the Two-Way FDI Model
Model 3 is a two-step differential GMM estimation of Equation (20), namely the reference model, to examine the effect of China’s two-way FDI coordinated development on domestic carbon emissions. The Arellano–Bond test cannot reject the null hypothesis that the second-order serial correlation does not exist for Model 3, and both the Hansen test and the Saran test also cannot reject the null hypothesis that the tool variable is effective. These interpretations indicate that the estimation result of the differential GMM is reliable. Compared with the estimation results of Model 1 and Model 2, the significance of the spatial lag term of the explained variable in Model 3 is improved, and the signs and significance of the core explanatory variable COOR and the vast majority of the control variables are not changed. This shows that the results of Model 3 estimated by differential GMM are better and robust.
The spatial lag term WlnE of the explained variable in Model 3 is significantly positive at the level of 1%, which also demonstrates that there is an obvious spatial correlation among the provincial carbon emissions in China. Under the influence of socioeconomic activities, carbon emissions in one region will be affected by the carbon emissions in adjacent regions. Carbon emission increases in adjacent regions will result in an increase in local carbon emissions. Therefore, the interregional joint prevention and joint control strategy should be adopted for the reduction of regional emissions. Insufficient coordinated environment control behaviors among the local governments will inevitably result in a nearby transfer effect of carbon emissions [49].
The coefficient of the core explanatory variable COOR in Model 3 is significantly negative, indicating that the coordinated development of China’s two-way FDI acts as a catalyst for reducing domestic carbon emissions and has an obvious emission reduction effect. This also demonstrates the theoretical analysis in this paper that IFDI and OFDI have a certain substitution effect in the process of influencing carbon emissions, and the interaction of both of them has an inhibitory effect on carbon emissions. When both the inward FDI and outward FDI exist simultaneously, the increase of the two-way FDI coupling coordination level will lead to a significant reduction of carbon emissions. This means that China should adhere to both strategies of “introduction of foreign investment” and “investment in foreign countries” to promote the benign interaction of the two-way FDI and play the emission reduction effect of the two-way FDI.
5.2.3. Results of Control Variables
Environmental regulation has a positive but obscure effect on carbon emissions. This indicates that government investment on environmental pollution control at all levels is not effective in achieving the reduction of emissions; instead, it has the potential to increase carbon emissions. This also shows that the implementation of environmental regulation is ineffective to some extent, which is consistent with results of Liu et al.’s work [20].
The effect of the capital–labor ratio on carbon emissions is significantly negative, which is consistent with the conclusion of Zhou et al. [33]. The capital–labor ratio reflects the basic resource allocation in the production, and the composition of its change mainly depends on the technical conditions of production. The capital–labor ratio rise usually represents that the production composition transfers from a labor-intensive type to a capital-intensive one. The results of this paper show that the suppression effect of advanced energy-saving and emission-reduction technology on the transformation of enterprises’ production from labor-intensive to capital-intensive is larger than that of the carbon emissions generated from energy combustion. Thus, the integrated effects of the capital-to-labor ratio on emissions show suppression.
The output scale has a significantly positive impact on carbon emissions. The expansion of the output scale increases carbon emissions. From the production perspective: carbon emission, as a subsidiary of the production process, will inevitably increase with the expansion of the output scale.
R&D expenditure has a significantly negative effect on carbon emissions, showing an inhibiting role. R&D expenditure can be invested in technology for production or emissions reduction. Similar to the direction of technological progress, the investment direction of R&D expenditure determines the direction of the environment impacts. The result in this paper indicates that more R&D expenditure is used for the development of energy-saving and emission-reduction technology. The positive effect of industrial structure on carbon emissions shows that the proportional rise of value added from the second industry accounting for GDP will induce carbon emission increases. It is easy to understand that the second industry includes most industries with high energy consumption and high pollution such as mining, manufacturing, and construction. The higher the proportion of the second industry in the national economy, the greater the energy consumption and carbon emissions. This shows that the new industrialization road featuring the coordinated development between the economy and the ecological environment has not yet been completed in China.
Comparing models 3 to 5, a useful conclusion could be that under the coexisting strategies of China’s IFDI and OFDI, only the realization of coordinated development of the two-way FDI can inhibit the excessively high domestic carbon emissions. This also proves that the development of the two-way FDI is the key contributor to achieve emission reduction for the globalization and the cross-border capital flow.
5.3. Effect Decomposition of the Two-Way FDI on Carbon Emissions
The effect decomposition of the coordinated development of the two-way FDI on carbon emissions is implemented based on Model 3, and the decomposed results are shown in Table 6. ,, and of Equation (19) are estimated by the difference GMM method for Equation (20) in Table 5, i.e.,, and . The elasticity of the capital output used in this paper is [15].
5.3.1. Results of Effect Decomposition at the Total Level
Table 6 shows that the scale effect of the two-way FDI in the sample period is positive, while both the composition effect and the technique effect are negative, and the total effect is dominated by the technique effect. Taking 2016 as an example, each 1% rise of the two-way FDI development level will lead to a reduction in the carbon emissions by about 0.32%, of which the scale effect will result in an increase of 0.0145% of the carbon emissions, while the composition and technique effects will reduce the carbon emissions by 0.0163% and 0.3182%, respectively. Obviously, the two-way FDI development plays a leading role in the superposition of the composition effect and the technique effect. This is the main cause that the coordinated development of China’s two-way FDI produces the inhibition function on carbon emissions, while it is the dominant source of the technique effect. Further information can be obtained from Table 6.
1. Scale effect
The coordinated development of the two-way FDI has a positive scale effect on carbon emissions, which proves the theoretical analysis of this paper: both OFDI and OFDI intensify the emissions through the scale effect. Both of China’s policies—the introduction of foreign investment and overseas direct investment—have contributed to economic growth, leading to more carbon emissions. The Environmental Kuznets Curve hypothesis states that economic growth and environmental pollution shows the “inverted U-shape” relation; that is, environment deterioration rises as economic growth increases, but then an inflection point is reached, leading to the alleviation of environmental deterioration [50,51].
A number of studies have demonstrated that the Environmental Kuznets Curve hypothesis is not true in China [52,53,54,55,56,57,58], or China at the current economic development stage is only on the left side of the “inverted U-shaped” curve, and the inflection point of “unhooking” between environmental deterioration and economic growth has not yet come [59]. In addition, the Chinese energy structure and industrial structure have determined that its development heavily relies on energy consumption and inevitably leads to an increase in carbon emissions. Therefore, under the superposition of two positive scale effects, the scale effect of the two-way FDI increases carbon emissions in China.
2. Composition effect
The two-way FDI development shows a negative composition effect on carbon emissions. The entry of FDI has increased the natural endowment of China’s domestic capital factors to change the domestic production composition, which will result in an increase in the output scale of capital-intensive products in China, and the output scale of other products will thus be reduced according to the Rybczynski Theorem [60]. The carbon emissions from higher-level capital-intensive industries are much less, and contribute to the overall reduction of carbon emissions in China. The first three destination industries of China’s OFDI composition are services —leasing and business service, financial services, and wholesale and retail—that cannot directly transfer domestic emissions. However, the outflow of funds makes it possible for enterprises to carry out domestic labor-intensive production, which becomes a potential factor in the expansion of domestic carbon emissions. The composition effect of the IFDI exceeds that of OFDI on carbon emissions. The integrated structure effect of the two-way FDI development shows an inhibitory effect on carbon emissions.
3. Technique effect
The coordinated development of the two-way FDI produces a negative technique effect on China’s carbon emissions. IFDI directly reduces the carbon emissions by introducing more advanced energy-efficient technologies and cleaner production resources. Both the IFDI “spillover effect” and the OFDI “reverse spillover effect” promote the imitative learning and independent innovations of domestic enterprises through the channels of “competitive effect” and “demonstration effect”, and in doing so realize technical progress. This has led to the improvement of energy-saving technology and the input of cleaner resources in the production process, which have obvious effects on reducing carbon emissions.
Based on the results of this paper, the technological progress brought by the coordinated development of the two-way FDI is inclined to the energy-saving and emission-reduction technology rather than production technology. This shows that the technique effect of the two-way FDI is able to significantly inhibit carbon emissions. Furthermore, the technique effect brought by two-way FDI far exceeds the scale and the composition effect, indicating that the emission direction of the two-way FDI development is consistent with that of the technique effect. In a nutshell, the overall effect of the two-way FDI development on carbon emissions is significantly inhibited.
5.3.2. Results of Effect Decomposition at the Regional Level
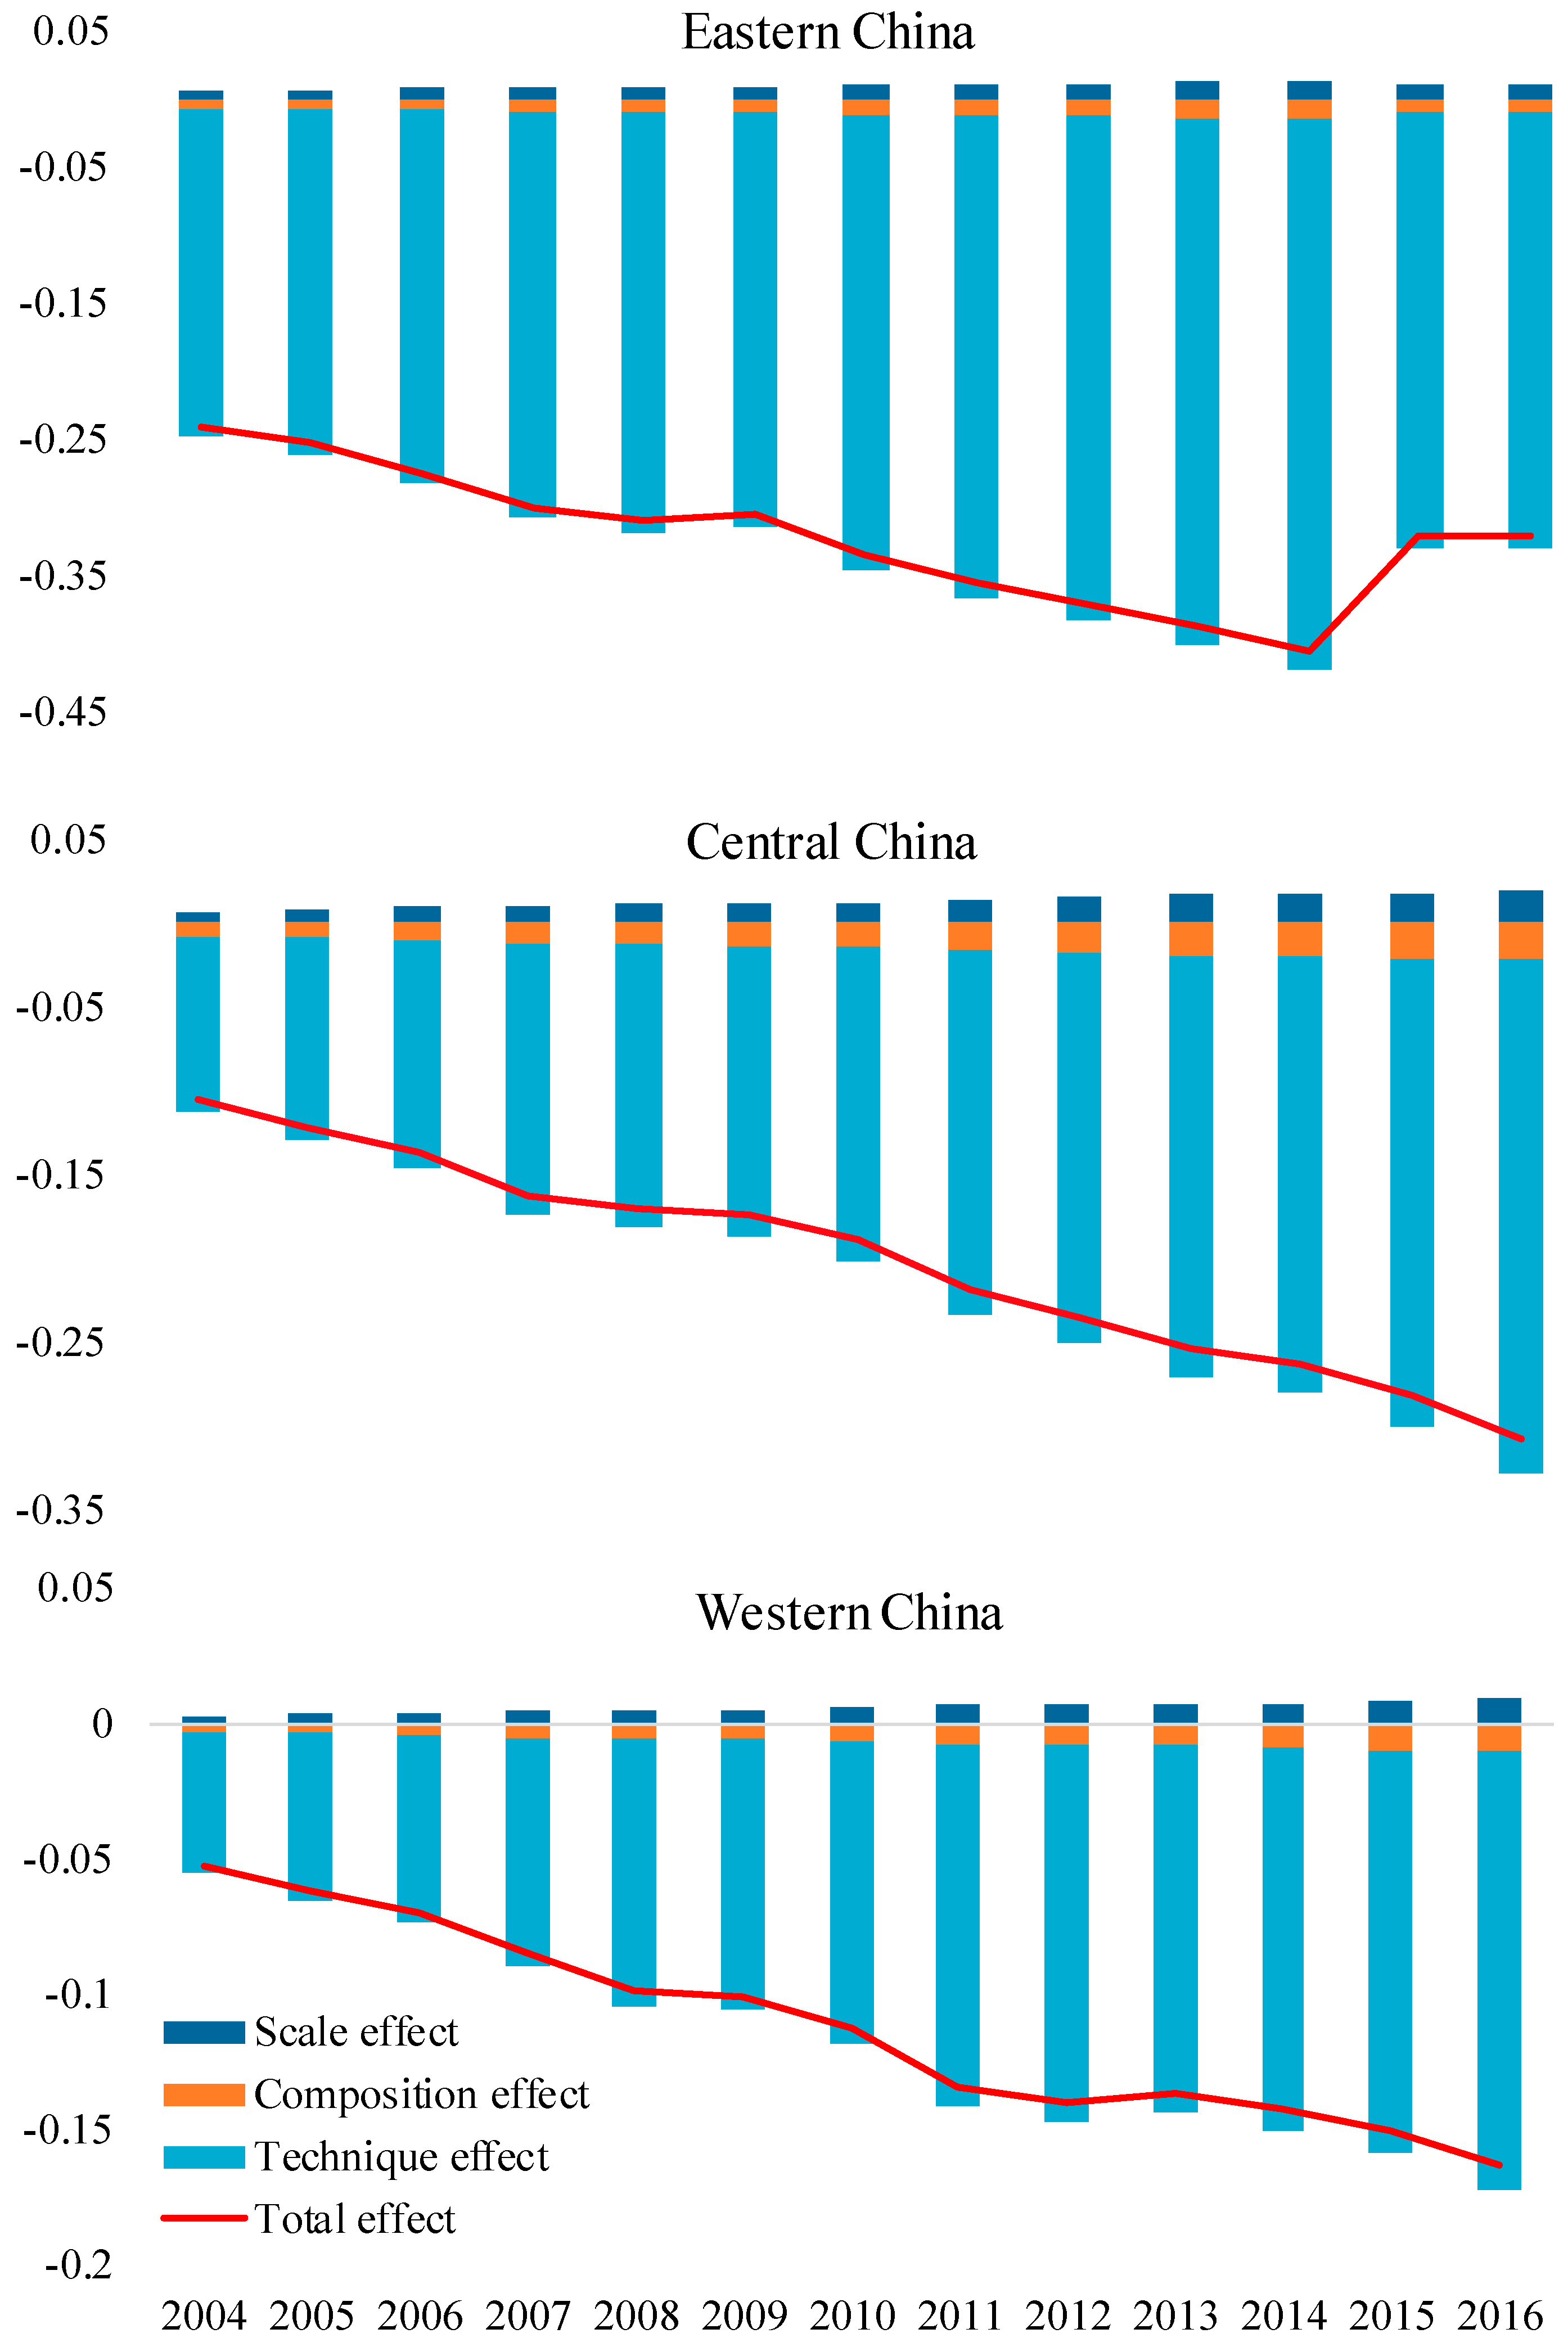
The carbon emission effect of the two-way FDI coordinated development of the eastern, central, and western regions is further decomposed (Figure 5). Among the three grand regions, the technique effect dominates the total of the two-way FDI on carbon emissions, while both the scale effect and the composition effect play limited roles. This is the main reason for the two-way FDI producing the inhibition function as a whole on carbon emissions in China.
An interesting phenomenon is shown in this paper. Three grand regions show different technique effect intensities of the two-way FDI coordinated development on emissions. The eastern region ranks first, the central region follows, and the western region is the weakest, which is consistent with the regions’ coupling coordination level of the two-way FDI. This to some extent indicates that the coupling coordination level is a key factor in influencing the technique effect of the two-way FDI. The higher the two-way FDI coupling coordination level, the better the IFDI and OFDI interact. The technique effect of the two-way FDI has been better played, i.e., the two-way FDI coupling coordination level is positively correlated to its technique effect.
The reason that the technique effect of the two-way FDI coordinated development in the three regions is different is mainly related to the regional economic development level. The western region attracts a large number of foreign investments into its labor-intensive industries, relying on the comparative advantage of its own low-cost labor force to improve economic competitiveness. It is undeniable that the entry of FDI has promoted industrialization and driven the rapid development of the western economy. However, the production technology of labor-intensive products is relatively lower than that of capital-intensive ones, limiting the technical effect of FDI. Additionally, the overall backward economic and technical level of the western region cannot effectively absorb the advanced technology and management experience brought by IFDI and OFDI. Therefore, the technique effect of two-way FDI in the western region cannot be fully shown.
The technique effect intensity of the two-way FDI in the eastern region is the largest, and the emission reduction effect in this region is also the most obvious. This is mainly because the economic development level in the eastern region is much higher than that in the other regions, and has a strong absorption capacity for the advanced technology. The central region has a relatively better economic development level and element endowment compared to the western region, and is also closer to the developed eastern regions in terms of the geographical location. Also, it has a higher coupling coordinated level of two-way FDI than the western region. These makes the emission reduction effect of two-way FDI in the central region stronger than that in the western region.
5.4. Robustness Test
The spatial lagging term of the explained variable is introduced into the econometric model of this paper, enabling the model to be a typically spatial lagging model. However, the estimation of the spatial econometric model is deeply affected by the selection of spatial weight matrices. Thus, it is necessary to carry out the robustness test for different spatial weight matrices.
This paper uses the geographic distance, the economic distancem and the 0–1 adjacency matrix as the spatial weight matrices, respectively, to estimate the spatial lagging model based on the difference GMM method. The test results in Table 7 show that the sign direction and significance of the estimation coefficients of the core explanatory variable (COOR) do not change under three kinds of weight matrices. The sign directions and the significance of the most explanatory variables are also consistent with the results of Table 5. These indicate that the estimation results in this paper are reliable.
6. Discussion and Policy Implications
6.1. Discussion
Under the background of paying equal attention to the “introduction of foreign investment and investment in foreign countries”, based on the analysis framework of Copeland and Taylor, this paper examines effects of China’s spatial spillover and two-way FDI coordinated development on domestic carbon emissions, which is realized through three channels: the scale, composition, and technique effects.
Carbon emissions in China have a significant spatial spillover effect and remarkable spatial agglomeration phenomenon among provinces. This result coincides with the existing studies using spatial econometric models [39,61,62,63], which indicates that the spatial correlation characteristics of environmental pollution are in existence. If researchers and policy makers ignore these linkages, it will likely lead to unreliable results, and subsequently incorrect policy guidance.
The two-way FDI coordinated development has a significant effect on emission reduction. Previous studies only focused on the effects of IFDI or OFDI on the environment [21,33]; however, this study is the first to conclude that the findings agree with China’s strategy of IFDI and OFDI coordinated development and guidance for China’s emission reduction, and thus the sustainable development goal of opening up and environmental protection can be integrated effectively.
We found that the two-way FDI coordinated development has a positive scale effect on the carbon effect, which is consistent with existing studies that the scale effect can increase emissions [13,14,15]. The composition effect, which has a negative effect on emissions, is different from previous studies, which considered that capital-intensive production will increase emissions, [18,64]; however, it supports that a higher capital-to-labor ratio implies a more advanced technology level [33], which will help reduce emissions. The key driver of the emission reduction effect is due to the leading role of the technique effect, which has far exceeded the scale and the composition effect. Therefore, the total effect of the two-way FDI on carbon emissions is consistent with the direction of the technique effect.
6.2. Policy Implications
This research not only provides useful guidance for policy makers to effectively control emissions by implementing economic means, but also provides a practical example for countries that are undergoing a similar development stage to China.
The regional emissions have a significant positive correlation at a spatial level. This indicates that the carbon emissions produced in one area not only affect the local ecological environment, but also probably diffuse toward the surrounding areas due to industrial transfers, factor mobility, and interregional trade. Thus, environmental governance should focus on strengthening the coordination and cooperation between local governments. Any unilateral governance behaviors can only generate limited effects on the local environment. The interregional joint-prevention and joint-control strategies should be adopted to effectively resist the diffusion of emissions and emission leakages. For example, the carbon emission trading system can be applied to interregional industries to reduce the diffusion and leakages among regions.
The two-way FDI coordinated development has a significant effect on emission reduction, which implies that the effective coordination of the process of introducing foreign investment and overseas investment can help mitigate carbon emissions. We have elaborated the interactive mechanism of IFDI and OFDI in the theoretical part of this paper, and empirical studies have already verified that IFDI can drive OFDI [26], and OFDI can promote IFDI in turn [27]. Previous studies primarily use only IFDI or OFDI to show how governments’ decisions can maximize the performance of their resources and the environment [33], whereas this paper provides a new perspective to merge IFDI and OFDI to form an interactive mechanism to achieve emission reduction. We present results that can used for informing policy making, in particular for promoting the coordination of IFDI and OFDI for achieving the aim of emissions reduction and pollution regulation. In the current governmental system, IFDI and OFDI-related institutes include the National Development and Reform Commission, the Ministry of Commerce, China Customs, etc. The institutes have a different role to play in foreign investment, because of their specific responsibilities. When making policies, cooperative mechanisms among the decision institutes could be a way of enhancing their connections to promote the coordination of IFDI and OFDI and to play a more active role in the reduction of carbon emissions.
The two-way FDI coordinated development results have shown that the leading emission reduction pathway should be focused on the technique effect. This reminds us that during the development of two-way FDI, attention should be directed toward improving the quality of FDI. During expansion of the size of the two-way FDI, it is of utmost importance to identify two-way FDI with cleaner technologies and bring IFDI’s technology diffusion and OFDI’s inverse diffusion. On the one hand, IFDI can introduce advanced and cleaner production technologies and produce green technological diffusing effects in upstream and downstream industries in local and interregions to help improve China’s environmental quality. Thus, local governments should pay attention to environmentally-friendly FDI, for enhancing the requirements of China’s market access, and bringing IFDI into the full play of technical advantages on emission reduction and spillover effect. On the other hand, the technology-seeking OFDI scale should be further enlarged to achieve reverse technical diffusion and drive China’s manufacturing industries’ promotion with cleaner technologies. In addition, OFDI should merge with China’s industrial structure upgrade and strengthen international industries’ coordination by the Belt and Road Initiative to promote domestic industry transfers to developing countries. During this process, environmental pollution in destination countries caused by intermediate input from domestic industries should also be resolved using the same cleaner technology of production.
Author Contributions
Conceptualization, Y.W.1 and M.L.; methodology, M.L. and Y.W.1; software, M.L.; validation, L.X.; formal analysis, Y.W.1; investigation, Y.W.2; resources, Y.W.2; data curation, M.L. and Y.W.2; writing—original draft preparation, M.L. and Y.W.2; writing—review and editing, A.M.; visualization, M.L. and L.X.; supervision, Y.W.2; project administration, Y.W.1; funding acquisition, Y.W.1 and Y.W.2.
Funding
This work is funded by the Major Program of National Philosophy and Social Science Foundation of China (Grant No. 16ZDA051), the Fourth Batch of Youth Top Talents Support Project of Chongqing Normal University, and the Key Program of National Social Science Foundation (Grant No. 14AJL015).
Conflicts of Interest
The authors declare no conflict of interest.
References
- UNCTAD. World Investment Report 2018: Investment and New Industrlal Policies; UN: New York, NY, USA, 2018. [Google Scholar]
- Ministry of Commerce of the People’s Republic of China; National Bureau of Statistics of the People’s Republic of China; State Administration of Foreign Exchange. Statistical Bulletin of China’s Outward Foreign Direct Investmeng; China Statistics Press: Beijing, China, 2017.
- Dunning, J.H. Explaining International Production; Unwin Hyman: London, UK, 1988; pp. 140–168. [Google Scholar]
- Ozawa, T. Internationa Investment and Industrial Structure: New Theoretical Implications from the Japanese Experience. Oxf. Econ. Pap. 1979, 31, 72–92. [Google Scholar] [CrossRef]
- Chen, X. Equilibrium Analysis of Inward Foreign Direct Investment and Outward Foreign Direct Investment. Econ. Rev. 2004, 6, 10–14. (In Chinese) [Google Scholar]
- Daniel, C.E.; Andre, D. Sustaining the Asia Pacific Miracle: Environmental Protection and Economic Integration; Peterson Institute for International Economics: Washington, DC, USA, 1997. [Google Scholar]
- List, J.A.; Co, C.Y. The Effects of Environmental Regulations on Foreign Direct Investment. J. Environ. Econ. Manag. 2000, 40, 1–20. [Google Scholar] [CrossRef]
- Markusen, J.R.; Venables, A.J. Foreign direct investment as a catalyst for industrial development. Nber Work. Pap. 1997, 43, 335–356. [Google Scholar]
- Copeland, B.R.; Taylor, M.S. North-South Trade and the Environment. Q. J. Econ. 1994, 109, 755–787. [Google Scholar] [CrossRef]
- Grossman, G.M.; Krueger, A.B. Economic Growth and the Environment. Nber Work. Pap. 1995, 110, 353–377. [Google Scholar] [CrossRef]
- Auffhammer, M.; Sun, W.Z.; Wu, J.F.; Zheng, S.Q. The Decomposition and Dynamics of Industrial Carbon Dioxide Emissions for 287 Chinese Cities in 1998–2009. J. Econ. Surv. 2016, 30, 460–481. [Google Scholar] [CrossRef]
- Chang, S.C.; Li, M.H. Impacts of Foreign Direct Investment and Economic Development on Carbon Dioxide Emissions Across Different Population Regimes. Environ. Resour. Econ. 2019, 72, 583–607. [Google Scholar] [CrossRef]
- Liobikiene, G.; Butkus, M. Scale, composition, and technique effects through which the economic growth, foreign direct investment, urbanization, and trade affect greenhouse gas emissions. Renew. Energy 2019, 132, 1310–1322. [Google Scholar] [CrossRef]
- Zhang, Y.-B.; Guo, Y.-J. Effect of FDI on Environment and Environmental Protection Policy in Using FDI in China. China Popul. Resour. Environ. 2009, 19, 7–12. (In Chinese) [Google Scholar]
- Sheng, B.; Lv, Y.; Hong, L. Impact of Foreign Direct Investment on China’s Environment: An Empirical Study Based on Industrial Panel Data. Soc. Sci. China 2012, 33, 89–107. (In Chinese) [Google Scholar]
- Zhou, L.; Ying, R.-Y. Foreign Direct Investment and Industrial Pollution. China Popul. Resour. Environ. 2009, 19, 42–50. (In Chinese) [Google Scholar]
- Zhou, L.; Pang, C.-C. Home Country Environmental Effects of China’s Foreign Direct Investment: Based on the perspective of regional differences. China Popul. Resour. Environ. 2013, 23, 131–139. (In Chinese) [Google Scholar]
- Gong, M.; Liu, H. Study on the environmental effects of two-way FDI on China’s industrial sectors. China Popul. Resour. Environ. 2018, 28, 128–138. (In Chinese) [Google Scholar]
- Yang, K.; Wang, C.; Wen, Y.; Mao, X. The Threshold Effect of Two-way FDI on Environmental Pollution Under Environmental Regulation. J. Environ. Account. Manag. 2018, 6, 115–124. [Google Scholar] [CrossRef]
- Liu, Y.-L.; Zheng, X.-C. The Spatial Panel Model Analysis of FDI and Industrial Pollution Emissions. J. Ind. Eng. 2015, 29, 142–148. (In Chinese) [Google Scholar]
- Xu, H.; Deng, Y. Foreign Direct Investment, Industrial Agglomertion and Strategic Emission Reduction. J. Quant. Tech. Econ. 2016, 33, 112–128. (In Chinese) [Google Scholar]
- Shi, Z.; Shao, J.; Wang, M. The Impacts of FDI on the Haze Pollution in Temporal-Spatial Dimension: Based on the SpVAR Model. J. Int. Trade 2017, 9, 107–117. (In Chinese) [Google Scholar]
- Yan, Y.; Qi, S. FDI and Haze Pollution in China. Stat. Res. 2017, 34, 69–81. (In Chinese) [Google Scholar]
- Pan, W.; Chen, X.; Chen, T.; Gu, L. Does Inward FDI Impact on Outward FDI? Evidence from Global Panel Data. China J. Econ. 2015, 2, 18–40. (In Chinese) [Google Scholar]
- Chen, H.; Li, K. Does Attracting Foreign Investment Really Boost Outward Investment? A Reexamination Based on Chinese Provincial Panel Data. Financ. Trade Res. 2018, 29, 31–38. (In Chinese) [Google Scholar]
- Li, L.; Xian, G.; Bao, Q. Does Inward Foreign Direct Investment Promote Chinese Domestic Firms’ Investing Abroad. Econ. Res. J. 2018, 53, 142–156. (In Chinese) [Google Scholar]
- Fei, N.; Haiyun, L. Influence of China’s OFDI on Quantity and Quality of IFDI: Theoretical Mechanisms and Evidences. J. Int. Trade 2019, 1, 93–105. (In Chinese) [Google Scholar]
- Tian, S.; Wang, X. The Determinants of Two-way FDI and Net FDI Flow: Evidence from Global Panel Data. World Econ. Stud. 2017, 40–53, 135–136. (In Chinese) [Google Scholar]
- Huang, L.-Y.; Liu, D.-D.; Xie, H.-Q. Research on the Harmonious Development of Outward Foreign Direct Investment and Inward Foreign Direct Investment. China Ind. Econ. 2018, 3, 80–97. (In Chinese) [Google Scholar]
- Baek, J. A new look at the FDI–income–energy–environment nexus: Dynamic panel data analysis of ASEAN. Energy Policy 2016, 91, 22–27. [Google Scholar] [CrossRef]
- Jun, W.; Zakaria, M.; Shahzad, S.J.H.; Mahmood, H. Effect of FDI on Pollution in China: New Insights Based on Wavelet Approach. Sustainability 2018, 10, 3859. [Google Scholar] [CrossRef]
- Rafindadi, A.A.; Muye, I.M.; Kaita, R.A. The effects of FDI and energy consumption on environmental pollution in predominantly resource-based economies of the GCC. Sustain. Energy Technol. Assess. 2018, 25, 126–137. [Google Scholar] [CrossRef]
- Zhou, Y.; Fu, J.; Kong, Y.; Wu, R. How Foreign Direct Investment Influences Carbon Emissions, Based on the Empirical Analysis of Chinese Urban Data. Sustainability 2018, 10, 2163. [Google Scholar] [CrossRef]
- Huang, Y.; Chen, X.; Zhu, H.; Huang, C.; Tian, Z. The Heterogeneous Effects of FDI and Foreign Trade on CO2 Emissions: Evidence from China. Math. Probl. Eng. 2019. [Google Scholar] [CrossRef]
- Shao, Y. Does FDI affect carbon intensity? New evidence from dynamic panel analysis. Int. J. Clim. Chang. Strateg. Manag. 2018, 10, 27–42. [Google Scholar] [CrossRef]
- Sung, B.; Song, W.-Y.; Park, S.-D. How foreign direct investment affects CO2 emission levels in the Chinese manufacturing industry: Evidence from panel data. Econ. Syst. 2018, 42, 320–331. [Google Scholar] [CrossRef]
- Dinda, S.; Coondoo, D.; Pal, M. Air quality and economic growth: An empirical study. Ecol. Econ. 2000, 34, 409–423. [Google Scholar] [CrossRef]
- Reber, A.S.; Allen, R.; Reber, E.S. The Penguin Dictionary of Psychology; Penguin Books: London, UK, 2001. [Google Scholar]
- Han, F.; Xie, R. Does the Agglomeration of Producer Services Reduce Carbon Emission? J. Quant. Tech. Econ. 2017, 34, 40–58. (In Chinese) [Google Scholar]
- Anselin, L. Spatial Econometrics: Methods and Models; Springer: Dordrecht, The Netherlands, 1988; p. 284. [Google Scholar]
- Arellano, M.; Bond, S. Some Tests of Specification for Panel Data: Monte Carlo Evidence and an Application to Employment Equations. Rev. Econ. Stud. 1991, 58, 277–297. [Google Scholar] [CrossRef]
- Roodman, D. How to do xtabond2: An introduction to difference and system GMM in Stata. Stata J. 2009, 9, 1–51. [Google Scholar] [CrossRef]
- Shao, S.; Li, X.; Cao, J.; Yang, L. China’s Economic Policy Choices for Governing Smog Pollution Based on Spatial Spillover Effects. Econ. Res. J. 2016, 51, 73–88. (In Chinese) [Google Scholar]
- Moran, P.A.P. Notes on Continuous Stochastic Phenomena. Biometrika 1950, 37, 17–23. [Google Scholar] [CrossRef]
- Wang, H.; Bian, Y.; Wang, S. Dynamic Evolution, Spatial Spillover of Exports and Industral Carbon Emission Efficiency. J. Quant. Tech. Econ. 2016, 33, 3–19. (In Chinese) [Google Scholar]
- Shan, Y.; Guan, D.; Zheng, H.; Ou, J.; Li, Y.; Meng, J.; Mi, Z.; Liu, Z.; Zhang, Q. China CO2 emission accounts 1997–2015. Sci. Data 2018, 5, 170201. [Google Scholar] [CrossRef]
- Shan, Y.; Liu, J.; Liu, Z.; Xu, X.; Shao, S.; Wang, P.; Guan, D. New provincial CO2 emission inventories in China based on apparent energy consumption data and updated emission factors. Appl. Energy 2016, 184, 742–750. [Google Scholar] [CrossRef]
- Zhang, J.; Wu, G.; Zhang, J. The Estimation of China’s Provincial Capital Stock: 1952–2000. Econ. Res. J. 2004, 10, 35–44. (In Chinese) [Google Scholar]
- Shen, K.; Jin, G.; Fang, X. Does Environmental Regulation Cause Pollution to Transfer Nearby? Econ. Res. J. 2017, 52, 44–59. (In Chinese) [Google Scholar]
- Grossman, G.M.; Krueger, A.B. Environmental Impacts of a North American Free Trade Agreement; National Bureau of Economic Research Working Paper Series; MIT Press: Cambridge, MA, USA, 1991; No. 3914. [Google Scholar]
- Panayotou, T. Empirical Tests and Policy Analysis of Environmental Degradation at Different Stages of Economic Development; International Labour Organization: Geneva, Switzerland, 1993. [Google Scholar]
- Du, G.; Liu, S.; Lei, N.; Huang, Y. A test of environmental Kuznets curve for haze pollution in China: Evidence from the penal data of 27 capital cities. J. Clean. Prod. 2018, 205, 821–827. [Google Scholar] [CrossRef]
- Hao, Y.; Wu, Y.; Wang, L.; Huang, J. Re-examine environmental Kuznets curve in China: Spatial estimations using environmental quality index. Sustain. Cities Soc. 2018, 42, 498–511. [Google Scholar] [CrossRef]
- Yang, H.; He, J.; Chen, S. The fragility of the Environmental Kuznets Curve: Revisiting the hypothesis with Chinese data via an “Extreme Bound Analysis”. Ecol. Econ. 2015, 109, 41–58. [Google Scholar] [CrossRef]
- Chen, S.-Q.; Cai, L.-J. The Hypothesis of Environmental Kuznets Curve and its Test in China. Ecol. Econ. 2007, 9, 68–71, 86. (In Chinese) [Google Scholar]
- Wang, Q.; Gao, J. The Verification of Hypothesis about Environmental Kuznets Curve Based on Different Regions in China. Sci. Res. Manag. 2011, 32, 157–164. (In Chinese) [Google Scholar]
- Ying, R.I.-Y.; Zhou, L. The Existence Test on EnvironmentalKuznets Curve of China. J. Nanjing Normal Univ. 2006, 3, 74–78, 96. (In Chinese) [Google Scholar]
- Zhang, X.; Zhu, C. Economic Development and Environment Pollution—EKC Hypothesis Testing in China. J. Quant. Econ. 2011, 2, 38–49. (In Chinese) [Google Scholar]
- Ma, L.-M.; Zhang, X. The Spatial Effect of China’s Haze Pollution and the Impact from Economic Change and Energy Strcture. China Ind. Econ. 2014, 4, 19–31. (In Chinese) [Google Scholar]
- Rybczynski, T.M. Factor Endowment and Relative Commodity Prices. Economica 1955, 22, 336–341. [Google Scholar] [CrossRef]
- Chang, C.-P.; Dong, M.; Sui, B.; Chu, Y. Driving forces of global carbon emissions: From time- and spatial-dynamic perspectives. Econ. Model. 2019, 77, 70–80. [Google Scholar] [CrossRef]
- Wenchao, L.; Yihui, Y.; Lixin, T. Spatial Spillover Effects of Industrial Carbon Emissions in China. Energy Procedia 2018, 152, 679–684. [Google Scholar] [CrossRef]
- Yang, Y.; Zhou, Y.; Poon, J.; He, Z. China’s carbon dioxide emission and driving factors: A spatial analysis. J. Clean. Prod. 2019, 211, 640–651. [Google Scholar] [CrossRef]
- Helian, X.; Yuping, D. Does foreign direct investment lead to environmental pollution in China? Spatial Metrology Research Based on Chinese Provincial Panel Data. Manag. World 2012, 2, 30–43. (In Chinese) [Google Scholar]
Figure 1.
Total carbon emissions and size of the two-way Foreign Direct Investment (FDI) in China. Data sources: China Statistical Yearbooks and China Emission Accounts and Datasets (CEADs).
Figure 1.
Total carbon emissions and size of the two-way Foreign Direct Investment (FDI) in China. Data sources: China Statistical Yearbooks and China Emission Accounts and Datasets (CEADs).

Figure 2.
Comparison of spatial distribution of carbon emissions in China between 2004–2015.

Figure 3.
Coordinated development level of the two-way FDI in China during 2004–2016.

Figure 4.
Moran’s I scatter diagram of provincial carbon emissions in China for the selective years of 2004, 2008, 2012, and 2015.
Figure 4.
Moran’s I scatter diagram of provincial carbon emissions in China for the selective years of 2004, 2008, 2012, and 2015.

Figure 5.
Effect decomposition of the two-way FDI coordinated development on carbon emissions in the eastern, central, and western regions of China during 2004–2016.
Figure 5.
Effect decomposition of the two-way FDI coordinated development on carbon emissions in the eastern, central, and western regions of China during 2004–2016.


Table 1.
Data description. R&D: research and development.
| Symbol | Variable | Unit | Source |
|---|---|---|---|
| E | Provincial carbon emissions | 10 kt | China Emission Accounts and Datasets (CEADs) |
| COOR | Provincial coordinated development level of two-way FDI | - | China Statistical Yearbooks 2005–2017 |
| S | Provincial output scale | CNY 100 million | China Statistical Yearbooks 2005–2017 |
| REGU | Provincial environmental regulation intensity | % | China Environmental Statistics Yearbooks 2004–2016 |
| KL | Provincial capital–labor ratio | CNY 10,000/employee | China Statistical Yearbooks 2005–2017 |
| ISS | Provincial industrial structure | % | China Statistical Yearbooks 2005–2017 |
| RD | Provincial R&D expenditure | % | China Statistical Yearbooks 2005–2017 |
Table 2.
Descriptive statistics of variables.
| Variable | Number of Samples | Mean | Standard Deviation | Minimum | Maximum |
|---|---|---|---|---|---|
| lnE | 390 | 5.3251 | 0.7781 | 2.8034 | 6.7519 |
| COOR | 390 | 0.2414 | 0.1588 | 0.0195 | 0.7810 |
| lnS | 390 | 0.0131 | 0.0071 | 0.0005 | 0.0466 |
| REGU | 390 | 8.8694 | 1.1227 | 5.3544 | 10.9467 |
| lnKL | 390 | 2.2867 | 0.5206 | 0.6629 | 3.5673 |
| ISS | 390 | 0.4671 | 0.0786 | 0.1926 | 0.5905 |
| RD | 390 | 0.0137 | 0.0104 | 0.0017 | 0.0601 |
Table 3.
Spatial autocorrelation tests of carbon emissions.
| Item | Value |
|---|---|
| Moran’s I | 0.688 |
| Moran’s I Statistics | 24.665 |
| Marginal Probability | 0.000 |
Table 4.
Related tests of model identification.
| Test | Spatial Lag Model | Spatial Error Model |
|---|---|---|
| Lagrange multiplier (LM) test | 9.8663 *** | 2.7216 * |
| Robust LM test | 7.8736 *** | 0.7290 |
Note: * p < 0.1, *** p < 0.01.
Table 5.
Estimation results of the spatial lag model. COOR: coordinated development level of two-way FDI; DIFF-GMM: differential generalized moment estimation method; FDI: Foreign Direct Investment; IFDI: Inward Foreign Direct Investment, OFDI: Outward Foreign Direct Investment.
Table 5.
Estimation results of the spatial lag model. COOR: coordinated development level of two-way FDI; DIFF-GMM: differential generalized moment estimation method; FDI: Foreign Direct Investment; IFDI: Inward Foreign Direct Investment, OFDI: Outward Foreign Direct Investment.
| Explanatory Variables | Fixed Effects | Random Effects | DIFF-GMM | ||
|---|---|---|---|---|---|
| Model 1 | Model 2 | Model 3 | Model 4 | Model 5 | |
| (Reference Model) | (IFDI Only) | (OFDI Only) | |||
| WlnE | 0.00818 | 0.00819 | 0.0118 ** | 0.0139 *** | 0.0104 *** |
| −1.54 | −1.56 | −2.68 | −3.01 | −3.42 | |
| COOR | −0.514 *** | −0.488 *** | −0.907 *** | ||
| (−4.31) | (−4.16) | (−5.00) | |||
| lnIFDI | −0.0408 *** | ||||
| (−3.41) | |||||
| lnOFDI | 0.0133 *** | ||||
| −4.5 | |||||
| lnKL | −0.0436 | −0.0543 | −0.502 *** | −0.585 *** | −0.582 *** |
| (−0.90) | (−1.19) | (−3.46) | (−3.97) | (−5.76) | |
| RD | −4.511 | −5.242 * | −5.694 ** | −30.36 *** | 1.296 |
| (−1.42) | (−1.76) | (−2.50) | (−10.28) | −0.44 | |
| ISS | 1.064 *** | 1.076 *** | 2.528 *** | 2.198 *** | 2.359 *** |
| −7.06 | −7.25 | −13.3 | −7.29 | −8.71 | |
| lnS | 0.654 *** | 0.650 *** | 0.744 *** | 0.759 *** | 0.496 *** |
| −28.6 | −29.47 | −28.39 | −16.73 | −15.17 | |
| REGU | 5.534 *** | 5.706 *** | 0.399 | 7.566 *** | 2.534 ** |
| −4.97 | −5.21 | −0.43 | −8.04 | −2.68 | |
| Constant | −0.774 *** | −0.724 *** | |||
| (−3.61) | (−3.25) | ||||
| AR Test p-value | 0.176 | 0.178 | 0.426 | ||
| Sargan Test p-value | 0.979 | 0.214 | 0.655 | ||
| Hansen Test p-value | 0.632 | 0.839 | 0.945 | ||
| Obs | 390 | 390 | 390 | 390 | 390 |
Note: t statistics in parentheses, * p < 0.1, ** p < 0.05, *** p < 0.01, similarly hereinafter.
Table 6.
Effect decomposition of the two-way FDI coordinated development on carbon emissions.
| Year | Scale Effect | Composition Effect | Technique Effect | Total Effect |
|---|---|---|---|---|
| 2004 | 0.0055 | −0.0062 | −0.1352 | −0.1359 |
| 2005 | 0.0061 | −0.0069 | −0.1473 | −0.1480 |
| 2006 | 0.0068 | −0.0077 | −0.1621 | −0.1630 |
| 2007 | 0.0079 | −0.0088 | −0.1832 | −0.1842 |
| 2008 | 0.0083 | −0.0094 | −0.1936 | −0.1946 |
| 2009 | 0.0084 | −0.0095 | −0.1941 | −0.1951 |
| 2010 | 0.0093 | −0.0104 | −0.22130 | −0.22142 |
| 2011 | 0.0103 | −0.0116 | −0.2364 | −0.2377 |
| 2012 | 0.0109 | −0.0123 | −0.2487 | −0.2500 |
| 2013 | 0.0114 | −0.0128 | −0.2588 | −0.2602 |
| 2014 | 0.0120 | −0.0135 | −0.2698 | −0.2713 |
| 2015 | 0.0131 | −0.0147 | −0.2863 | −0.2880 |
| 2016 | 0.0145 | −0.0163 | −0.3182 | −0.3200 |
Table 7.
Robustness tests.
| Variable | 0–1 Adjacency Weight | Geographic Distance Weight | Economic Distance Weight |
|---|---|---|---|
| Model 6 | Model 7 | Model 8 | |
| WlnE | 0.00181 *** | 0.00700 ** | −0.242 * |
| −3.74 | −1.56 | (−1.74) | |
| COOR | −0.718 *** | −0.906 *** | −0.849 *** |
| (−7.97) | (−14.43) | (−8.28) | |
| lnIFDI | −0.382 ** | −0.498 *** | −0.625 *** |
| (−2.05) | (−3.40) | (−3.95) | |
| lnOFDI | 0.302 | −5.628 ** | −0.427 |
| −0.13 | 2.525 *** | (−0.24) | |
| lnKL | 2.114 *** | 2.525 *** | 2.318 *** |
| −9.08 | −13.22 | −10.3 | |
| RD | 0.673 *** | 0.744 *** | 0.721 *** |
| −23.67 | −28.6 | −30.26 | |
| ISS | 2.286 ** | 0.392 | 0.406 |
| −2.21 | −0.42 | −0.52 | |
| AR (2) | 0.112 | 0.175 | 0.203 |
| Sargan test | 0.706 | 0.98 | 0.98 |
| Hansen test | 0.448 | 0.589 | 0.636 |
| Obs | 390 | 390 | 390 |
Note: * p < 0.1, ** p < 0.05, *** p < 0.01.
© 2019 by the authors. Licensee MDPI, Basel, Switzerland. This article is an open access article distributed under the terms and conditions of the Creative Commons Attribution (CC BY) license (http://creativecommons.org/licenses/by/4.0/).
Share and Cite
MDPI and ACS Style
Wang, Y.; Liao, M.; Wang, Y.; Malik, A.; Xu, L. Carbon Emission Effects of the Coordinated Development of Two-Way Foreign Direct Investment in China. Sustainability 2019, 11, 2428. https://doi.org/10.3390/su11082428
AMA Style
Wang Y, Liao M, Wang Y, Malik A, Xu L. Carbon Emission Effects of the Coordinated Development of Two-Way Foreign Direct Investment in China. Sustainability. 2019; 11(8):2428. https://doi.org/10.3390/su11082428
Chicago/Turabian StyleWang, Yafei, Meng Liao, Yafei Wang, Arunima Malik, and Lixiao Xu. 2019. "Carbon Emission Effects of the Coordinated Development of Two-Way Foreign Direct Investment in China" Sustainability 11, no. 8: 2428. https://doi.org/10.3390/su11082428
Note that from the first issue of 2016, this journal uses article numbers instead of page numbers. See further details here.