Article

Evolution and Transformation of the Central Place Theory in E-Business: China’s C2C Online Game Marketing

1
Key Laboratory of Geospatial Technology for Middle and Lower Yellow River Regions of Ministry of Education & Collaborative Innovation Center of Urban-Rural Coordinated Development of Henan Province/Key Research Institute of Yellow River Civilization and Sustainable Development & Collaborative Innovation Center on Yellow River Civilization of Henan Province, Henan University, Kaifeng 475004, China
2
College of Environment and Planning, Henan University, Kaifeng 475004, China
3
School of Geographic Sciences, East China Normal University, Shanghai 200241, China
*
Author to whom correspondence should be addressed.
Sustainability 2019, 11(8), 2274; https://doi.org/10.3390/su11082274
Submission received: 23 March 2019 / Revised: 9 April 2019 / Accepted: 12 April 2019 / Published: 16 April 2019

Abstract

:
In contemporary studies in areas such as the field of classical theory, there has been an increasing emphasis on E-Business. In this study, we examine central place theory principles using China’s consumer-to-consumer online game marketing as a case of E-business. The results indicate that virtual goods in China’s C2C online game marketing are distributed in areas with high economic development and where residents have high purchasing power. Further, we found that the transmission capacity of virtual goods is affected by the level of telecommunication services because they are transmitted through information flow. Such effects illustrate that virtual goods are no longer affected by spatial distance and traffic conditions because virtual goods do not need to be touched; however, they are still affected by market forces. We conclude that there are key differences between the marketing and transport principles of CPT based on the hierarchical model describing new internal and external relations and the level of complexity in E-Business processes.

1. Introduction

In recent years, the research value of virtual goods has become more apparent [1]. For example, Park and Lee [2] found that virtual goods can enhance the virtual character’s abilities or simply individualize the character with decorative items. Hamari [3] found that the enjoyment of a game reduces willingness to buy virtual goods while at the same time it increases willingness to play more of that game. Wang and Chang [4] validated the influence of perceived customization and perceived sociability on customer satisfaction and repurchase intention with regard to virtual products. Virtual goods refer to digital products and services in the e-commerce market, which are characterized by having no physical nature and no need for logistics. As can be seen from the characteristics of virtual goods, there are many differences between virtual and physical goods. Therefore, the study of virtual goods has a high theoretical significance. Online games, as a representative of virtual goods, are gradually increasing their consumption potential. According to the “China Game Industry Report in 2015”, the actual sales revenue of China’s game market reached 140.7 billion yuan in 2015, which is a year-on-year increase of 22.9%. The number of Chinese game users reached 534 million, which is a year-on-year increase of 3.3%, reflecting the prosperity of the online game industry. It can also be seen that the online game industry can promote growth of Chinese consumption. In 2015, the Chinese State Council issued a report regarding “Guiding Opinions on Actively Playing the Leading Role of New Consumption to Accelerate the Cultivation of New Supply and New Motive Forces” which clearly pointed out that animation games, as a type of service consumption, should become a key area for upgrading consumption. It can be seen that research on virtual goods has practical significance.
In the online game consumer market, online game players obtain a better game service experience by using virtual game coins in the game, which makes the online game player’s virtual game currency a valuable commodity in China. This promotes C2C online game transactions. The C2C platform facilitated a large number of transactions, which led to the C2C mode online game virtual commodity trading market. We take the 5173 online game virtual commodity trading platform as an example. Online game sellers publish their sales information of virtual game currency on the 5173 online game virtual commodity trading platform, and online game buyers purchase virtual game currency by consulting sales information of the 5173 online game virtual commodity trading platform. This allows online game buyers to obtain a better game service experience, while sellers get the corresponding cash income through the above process to achieve transactions of online virtual goods.
At present, many researchers are studying virtual goods using an economics perspective. In particular, online games are one of the virtual goods that many researchers increasingly focus on. Lehdonvirta [5] showed that consumers are influenced by the features and attributes of virtual items in the same way that they are influenced by the features and attributes of real-world items. Drachen et al. [6] documented the changes in the in-game economy and showed how players migrate into and out of the economy across the lifetime of a browser-based online game. Guo and Barnes [7] argued that the form of consumer empowerment generated from online communities provides a heightened ability for seeking and sharing information, and thereby creates value for consumers.
Overall, the existing research on virtual goods represented by online games in the perspective of geography is still insufficient. But the study of virtual goods such as online games has strong theoretical and practical significance. In particular, the study of the commercial activities of virtual goods from a geographical perspective enriches the theory of business geography. This requires a deeper study of virtual goods. In this paper, we analyze the time and space characteristics of the online game consumption levels of the province-level regions under the C2C and the influencing factors by collecting and sorting out the trading orders of the “Dungeon and Fighter” (DNF) online games on the 5173 online game virtual trading platform. On a practical level, we reveal the time and space consumption habits of online game players and provide scientific guidance for formulating the development strategy of online game industry and opening up the online game virtual commodity trading market. In addition, on the theoretical level, comparing the similarities and differences between virtual goods and physical goods from online games will help further improve the CPT and enrich the theory of commercial geography.
Specifically, in this paper, we address the following research questions:
(1)
What is the temporal and spatial characteristics of online game consumption?
(2)
What is the difference between virtual goods and physical goods from the perspective of central place theory?
Based on research questions, we propose the following research objectives:
(1)
To understand the temporal and space characteristics of online game consumption through quantitative analysis and provide reference for marketing operators.
(2)
To understand the applicability of central place theory in virtual goods.
The paper is organized as follows. In Section 2, we introduce the literature review. In Section 3, we introduce research methods and data sources. In Section 4, we analyze temporal and spatial characteristics of online game consumption. Some numerical analyses are given in Section 5. Finally, conclusions are provided in Section 6.

2. Literature Review

2.1. Virtual Goods: Online Game Consume

2.1.1. Research Theory

The current research is mostly based on economics, but has rarely focused on geography. Castronova [8] found that virtual worlds could establish direct contact with real social activities, such as marketing. Castronova [9] used coordination game theory to study large games. Seo [10] found that professional gamers view computer game consumption as neither leisure nor work. Hamari and Keronen [11] used the random effects model to study a platform and found that enjoyment and prolonged use of the platform were more important predictors for purchases in virtual worlds than in games. Castronova et al. [12] found that fantasy gamers may well be economically normal. They studied the consumption behavior of game players from the field of economics.
In addition, Marchand and Hennig-Thurau [13] argued that the high level of creativity and innovativeness that is inherent to this field will continue to breed an ever-expanding range of game types, formats and business models. Seo [14] found that the collaborative efforts of gaming companies, players, online communities, governing bodies, and many other stakeholders play important roles in enriching and sustaining the experiential value of eSports consumption. Thomes and Paul [15] found that the game industry exhibits strong cross-group externalities between software publishers and gamers. Davidovicinora [16] proposed a framework to understand recent hybrid paid and free business models in the video game industry. They study the development of the game industry from the perspective of economics, from the interests of game developer game developers, pay attention to the game experience of gamers, and then develop relevant strategies to improve the game industry.
In summary, their research is mostly based on the theory and method of economics, such as the theory of consumption values and theory of coordination games. In addition, they focus on consumer behavior and its influencing factors. But the existing research rarely pays attention to the characteristics of time and space of virtual goods. The existing research rarely uses geography theory and method to study virtual goods, such as Central Place Theory. The study of characteristics of time and space will promote the development of e-business. Therefore, we need to do further research.

2.1.2. Research Means

The existing research mainly conducts qualitative analysis through interview and survey, and rarely conducts quantitative analysis by collecting consumer orders. Buchanan-Oliver and Seo [17] employed qualitative approaches to study online gaming. They concluded that computer games immerse consumers in a form of playful consumption that engages them in memorialized, co-authored storytelling. Wang et al. [18] conducted qualitative research on the influencing factors of online game consumption based on five characteristics: individual, online game, social, perceptual, and experience. They mainly used qualitative methods to study virtual goods.
Yao and Chang [19] collected 100 valid samples to analyze trust between different members in virtual communities. They found that the trust and friendship they have developed can be essential for community building and business opportunities. Mäntymäki and Islam [20] collected data from 2134 Finnish Habbo Hotel users. They found that perceived aggregate network exposure (PANE) moderates the influence of motivational factors on continued use intention and satisfaction. Mäntymäki and Salo [21] investigated 1045 users of Habbo Hotel. They found that virtual purchasing can be understood as a means to enhance the user experience. Hamari and Keronen [22] employed data gathered by an online survey through websites and social media. They found that games are multipurpose information systems which nevertheless rely on hedonic factors, even in the pursuit of instrumental outcomes.
They study virtual goods by qualitative means. But qualitative research has its limitations. In addition, it is difficult to perform quantitative analysis by the way of surveys and interviews. We need to collect data by using online game trading order to perform quantitative analysis.

2.1.3. Research Perspective

When studying consumer behavior and influencing factors, researchers mostly study from the micro perspective and rarely study from the macro perspective. Alha et al. [23] found that the player’s personal situation outside the game and playability problems were the most significant reasons to quit the game. Huang [24] found that affective involvement showed the greatest influence on purchase intention compared to flow and cognitive involvement. Seo et al. [25] found that electronic games are constantly evolving and they provide much diversity regarding their content, their pricing strategies, and platform availability, all of which are critical factors in influencing users’ future behavior. Rothmund et al. [26] found that excessive gaming is a transient and not a stable condition, at least for the large majority of adolescent players. Choi et al. [27] found that the emergence of the character–product interaction effect was dependent on national culture. They mainly focus on the influencing factors of online game consumption.
Kuss and Griffiths [28] found that a minority of Internet game players experience symptoms traditionally associated with substance-related addictions. Wei et al. [29] suggested that internet gaming disorder formation and maintenance can be associated with a hyperactive “impulsive” system. Morschheuser et al. [30] found that practitioners who are looking to increase cooperation should find that gamification inspired by cooperative game design is beneficial and preferable over individual-based gamification efforts. Sjoblom and Hamari [31] found that social integrative motivations are the primary predictor of subscription behavior. They mainly focus on the behavior of online game players.
The existing research mainly focuses on consumer demand, consumption behavior and its influencing factors of game players from the micro perspective of the individual. However, few scholars study these issues from a macro perspective. But macroscopic research can help the development of the online game industry.

2.1.4. Research Object

Existing research compares many aspects of the virtual world with the real world, but there is still a lack of comparative research on virtual goods and physical goods. Castronova et al. [32] conclude that the label “virtual”, while useful in a descriptive way, does not identify anything economically unique. Virtual economies tend to behave like any other economy and also increasingly interact in predictable ways with the so-called real economy. Castronova et al. [33] found that virtual economic behavior follows real-world patterns. They compare the virtual economy with the real economy. In addition, Castronova [34] found that virtual environments should be considered as mundane ‘extensions of the earth’, and therefore, their participants should be treated by the law the same way as in the real world. They compare the laws of virtual worlds and the real world.
It can be seen that the existing research compares the virtual world with the real world mainly through the domains of economics and law. We lack comparisons of the characteristics of the virtual goods and physical goods. In particular, whether the geographical characteristics of virtual goods and physical goods are different remains to be studied. In addition, whether the purchase intention of the virtual goods is affected by the regional difference remains to be studied.
In summary, the previous research mainly analyzes virtual goods from the perspective of economics, and the research methods are mainly qualitative methods through surveys and interviews. When studying online game consumers, scholars also analyze consumer behavior and its influencing factors from the micro perspective. In addition, previous research has focused on the relationship between online game consumers and online game developers, but lacks research on transactions between players and players. The C2C model is now gaining popularity, and research on its C2C trading model has yet to be explored. There are few macro-scale studies, and there are few studies on the impact of cultural differences between regions on online game consumption. There are few studies on online game consumption in China. However, the online game consumer market in China is very large and it is necessary to continue research. Therefore, it is necessary to study the characteristics of time and space of online game consumption from the perspective of geography.

2.2. Central Place Theory

Since the 1920s, based on the various theoretical development periods, research methods, etc. foreign commercial geography research has been divided into three major schools of thought: the first is the neoclassical school oriented to the central place theory (CPT) before the 1950s, represented by Chris Taylor [35]; the second is the spatial analysis school led by the quantitative revolution in the 1950s and 1960s, represented by Berry [36]; and the third is the school of consumer behavior, cognitive research, and socio-economic class research in the 1960s and 1970s; the school is represented by Reston [37]. In 1964, Yan introduce Christaller’s “central place theory” to China, which was quickly introduced into the macro-regional empirical research by Chinese scholars; for example, Wuyang and Qi [38] research on the commercial centers of small towns in Beijing and the North China Plain. In the study of macro-commercial geography, the research on commercial market geography has gradually gained attention. For example, Yishao [39] explained the differences in the characteristics and geographical distribution of China’s market in different historical periods and pointed out that market layout and management are two areas of focus for the scientific operation of a commercial market. In addition, CPT has become the basic theory for studying the decision-making of retail locations. Shangyi and Limei [40] found that the reason for the change in the spatial pattern of commercial centers is the development of transportation. Ling et al. [41] combined the Agent-based Modeling and Genetic Algorithm methods to reproduce and validate the spatial pattern of the hexagonal center of the Chris Taylor’s single function. Wei and De [42] found that consumers generate different levels of shopping demand at a certain frequency, and we use the difference in frequencies as an indicator to select a commercial center as a travel destination. Liu et al. [43] found that the behavioral activity model and spatial distribution structure maintained a high consistency with a description of the CPT. The increase in research led to perfecting the CPT. South and Boots [44] found that sales potentials are consistent with the results obtained when the nearest center assumption is in effect. Barton [45] suggested alternative crucial elements such as the importance of exchange to the creation of centrality, the pivotal role of the entrepreneur, and the addition of a source of economic value related to this agent’s role to perfect CPT. However, the concept of virtual goods was not yet formed in Christaller’s era, and therefore, the proposed CPT has certain time limitations. Does the commercial spatial pattern of virtual goods conform to CPT? This question requires further exploration.
In Figure 1, we introduce the theoretical framework. Using central place theory, we analyze differences between physical goods and virtual goods. The traffic principle highlights the biggest differences between physical goods and virtual goods. The transmission mode of physical goods mainly involves logistics. However, the transmission mode of virtual goods is mainly information flow. Using the market principles, we also compared physical goods and virtual goods.

3. Research Methods and Data Sources

3.1. Research Object

The 5173 online game virtual commodity trading platform (http://www.5173.com/) was established in 2003. It is one of the largest websites with the largest number of game transactions in China. It provides online game currency transactions for Chinese domestic netizens, and it once led the development of the industry; its trading platform involves the vast majority of online games in China, and therefore, in this study, we selected the 5173 online game virtual commodity trading platform as the research platform.
There are a lot of online games in China. In order to make the selected online games more representative, the following principles are followed in selecting online games: (1) The transactions conducted in the online game and the number of participating players are at a high level for the online game industry. (2) The online game has certain regional characteristics and can provide corresponding service areas for different province-level regions in China. Among them, the online game player is free to choose the game service area of any province-level region name. However, for the principle of making friends [46], common entertainment and convenient online game trading, online game players often choose the game service area of their own province-level region. After screening, the “Dungeon and Fighter” (http://dnf.qq.com/) online game trading volume has been ranked first in the 5173 online game virtual commodity trading platform for a long time. This online game was established in 2008, and in June 2012, the number of online active users exceeded 3 million. The service area of the corresponding name has been opened to 26 province-level regions in China. The game has not yet set up corresponding service areas in Gansu, Hainan, Ningxia, Qinghai, and Tibet. Therefore, this study did not consider these areas. In addition, we only study the mainland of China. Therefore, this study did not consider Hong Kong, Macau and Taiwan. In summary, this study selected the DNF online game from the 5173 online game virtual commodity trading platform as the research object.

3.2. Data Processing

This study collects the transaction amount of the game by collecting orders for DNF game transactions on the 5173 online game virtual commodity trading platform (Data acquisition URL: http://trading.5173.com/list/viewlastestdeallist.aspx?ts=-1&gm=44343b06076d4a7a95a0ef22aac481ae&ga=f24ae3dcc776413cafa79bc54337d74b&gs=-1&bt=682b60e289f045339cae13d208023fc6&raceid=-1&k=&sort=-1&section=-1_-1&pg=1). From a spatial perspective, the game service areas of the province-level regions can only conduct the transactions of online game players in the province-level region’s game service area, and the players in different province-level regions’ game service areas cannot achieve these transactions, meaning the transaction amount of each provincial game service area only represents the level of online game consumption in that province-level region.
From a temporal perspective, we consider that young people and student groups have more free time during the summer vacation. The online game players in this period are relatively active, and their online game consumption may be at its peak. After the start of school in September, online game users are less active, and the transaction volumes are relatively low. In order to verify this hypothesis, this study took each week of the summer and semester as the source of the sample data, and then compared the consumption differences between the two time periods. Online games carry out promotions at certain times, such as during the Mid-Autumn Festival, which causes the online game player’s consumption level to rise abnormally. In order to avoid these time periods, this study selects the trading orders for each week of 11–17 July 2016 and 6–12 September 2016 to examine the differences in online game consumption between summer break and the school or university semester, and then, we reveal that the level of activity of online game users on time scale. Other relevant statistical information comes from the China Statistical Yearbook.

3.3. Research Method

3.3.1. Centralization Index

The centralization index is used to study the industrial specialization of different regions. We use this index in this study to study the quantity of online game users in different time periods. The calculation method of the centralization index is [47]
I = (A − R)/(M − R)
where I is the concentration index, A is the cumulative percentage (from large to small) of online game transactions at different time periods within 24 h of the day, R is the cumulative percentage of the online game transaction amount evenly distributed, and M is the cumulative percentage of the online game transaction volume when it is concentrated. It can be seen that the value of I is also between 0 and 1. The higher the index, the larger the aggregate value. When the online game transaction amount is evenly distributed over 24 h, the I value is 0. In addition, the I value is 1 when the online game transaction amount is fully integrated. The centralized index can reflect the degree of centralization of online game consumption, but it is difficult to reflect the difference in online game consumption at different time periods.

3.3.2. Zipf Rank-Size Rule

The rank-size rule is to examine the scale distribution law of the urban system in a region from the relationship between the size of the city and the order of the city scale. The rank-size rule is mainly applied to closed areas. It helps to reveal the scale structure and differences of research objects, and it is widely used in cities, as well as in tourism, and many other fields [48,49]. This study uses Zipf rank-size rule to study the fractal characteristics of online game consumption levels. The Zipf rank-size rule expression Pr = P1rq obeys the power law and has a fractal meaning. Taking logs on both sides of the formula, we get
lnPr = lnP1qlnr,
where r is the provincial and municipal serial number, Pr is the provincial and municipal online game transaction amount with serial number r, P1 is the first province-level region’s online game transaction volume, and q is the Zipf dimension. When q < 1, it indicates that the consumption level of online games in various province-level regions is relatively concentrated, the scale difference is small, the number of province-level regions and cities in the middle order is large, and the monopoly of the first province-level region is weak. When q > 1, it indicates that the distribution of online game consumption levels in various province-level regions is relatively scattered, and the scale difference is large.

4. Analysis of the Differences of Time and Space in Online Game Consumption

The study collected Dungeons and Fighter (DNF) online game-trading orders on the 5173 online game virtual commodity trading platform and received more than 40,000 trading orders. It was found that the transaction volume for the week from 11–17 July 2016 was 4.14 million yuan, while that from 6–12 September 2016 was 3.29 million yuan. The transaction volume in July was 25.8% more than that in September. This difference is as expected; owing to the summer vacation, the online game transaction volume shows obvious differences in the peak season. Therefore, this study will use the weekly trading volume in July as the peak season trading volume, and the weekly trading volume in September as the off-season trading volume for a time–space comparison study.

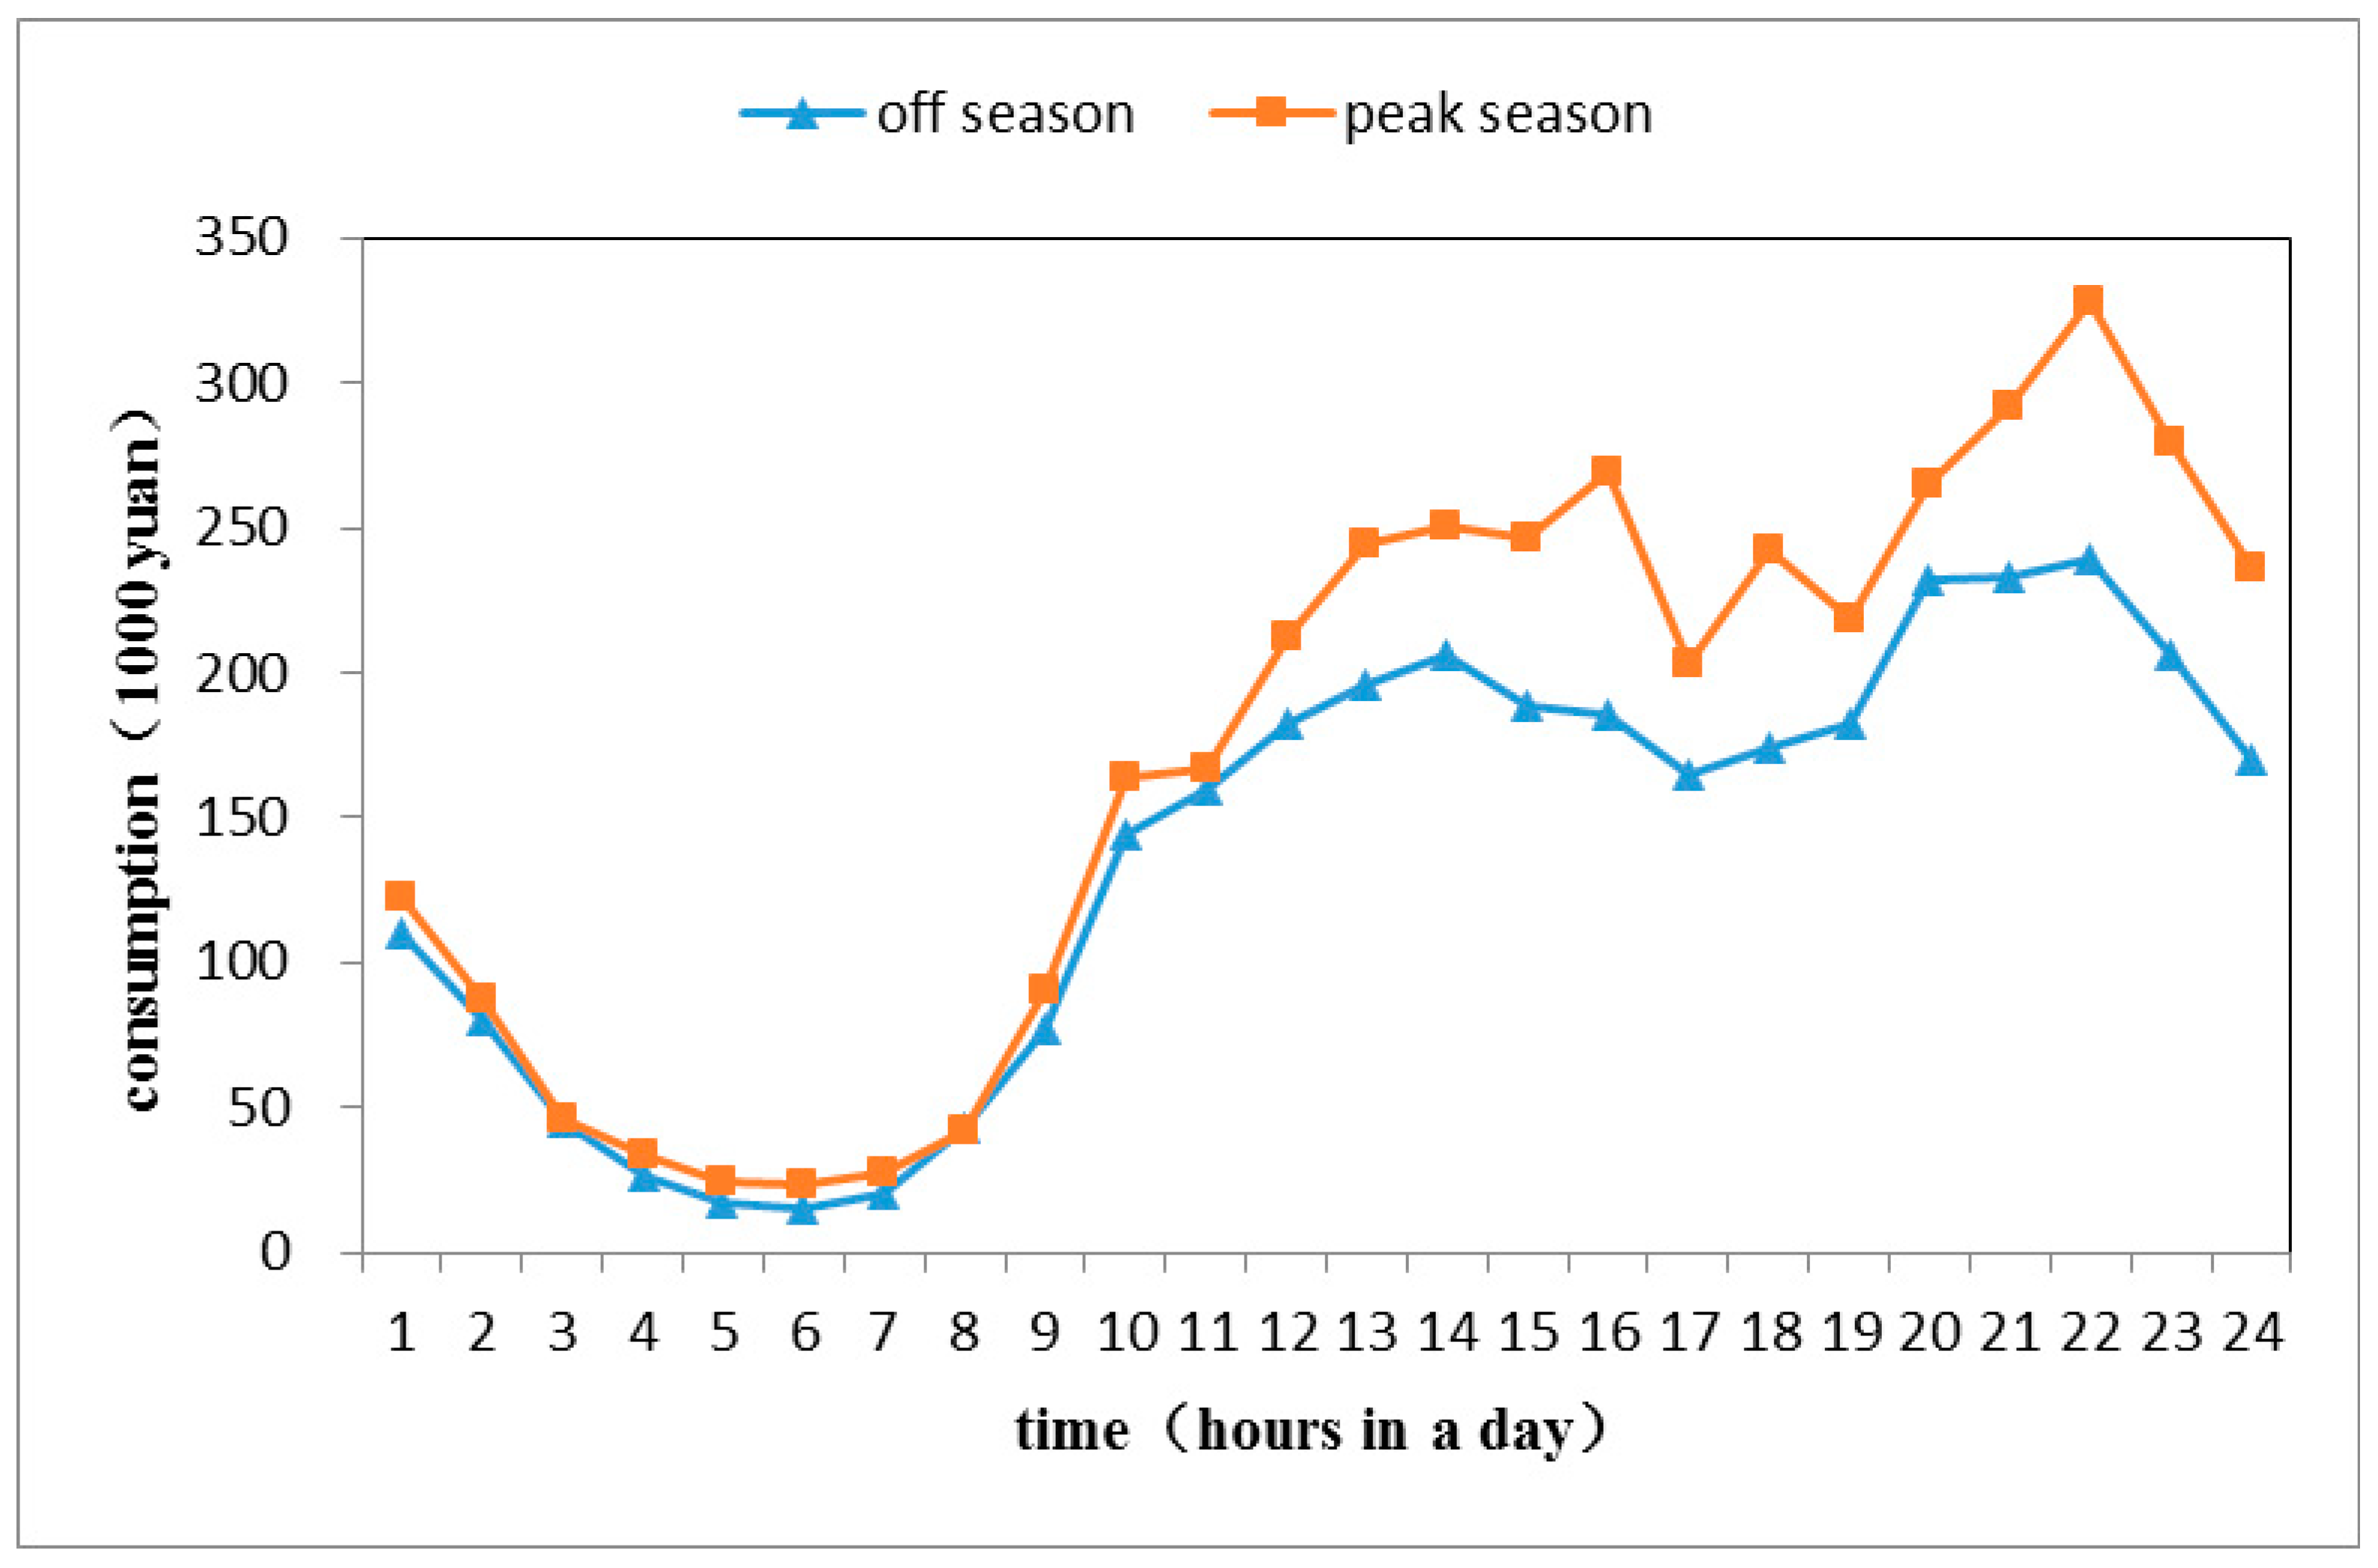
4.1. Online Game Consumption Time Characteristics

4.1.1. National Online Game Consumption Time Characteristics

The weekly trading volume in the off-peak season is compared in a 24-h period (Figure 2). There are two peaks in the off-season trading volume: between 13:00 to 14:00 and 21:00 to 22:00. After 14:00, students are in class, so the online game transaction volume shows a decline. In the peak season, there are two peaks in the transaction volume, which are 15:00 to 16:00 and 21:00 to 22:00. The troughs of the off season and the peak season are around 6:00. On the whole, the peak period of online game consumption is around 15:00 to 16:00 and 21:00 to 22:00 every day. This shows that the online game users are the most active in these two time periods.
The 24 h in a day are divided into four periods: 00:00–06:00, 06:00–12:00, 12:00–18:00, and 18:00–00:00. The calculation of the percentage of consumption in the four time periods shows that the proportion of consumption in the off season in the four time periods is 8.93%, 18.97%, 33.81%, and 38.28% respectively. The proportion of consumption in the peak season in the four time periods is 8.15%, 16.98%, 35.16%, and 39.08%, respectively. It can be seen that the activity level of online game users gradually increases from as the hours progress, and most users are active from 12:00 to 24:00 per day, especially during the peak season. Higher consumption reflects the fact that online game users are more active during the peak season from 12:00 to 24:00, which is caused by the difference in life patterns between regular students enrolled in normal and short-cycle courses during the summer and the semester. The percentage of consumption from 00:00 to 06:00 is not too low. This is because many online game users have the habit of playing games throughout the day, so they still maintain a certain amount of trading scale from 00:00 to 06:00.

4.1.2. Changes in Consumption Time of Online Game in Various Province-Level Regions

Table 1 summarizes the proportion of the four periods of transaction volume in different province-level regions. It can be seen from the data of the peak season that most province-level regions have a higher consumption proportion between 18:00 to 00:00, indicating that their game users are active during this period. Chongqing, Inner Mongolia (IM), Anhui, and Yunnan surpassed other province-level regions in the proportion of 00:00–06:00, 06:00–12:00, 12:00–18:00, and 18:00–00:00, respectively. From the off-season data, Xinjiang, Inner Mongolia, and Guizhou have more than 50% of transactions during the time from 18:00–00:00. Owing to the different living habits of players in these areas, they are more active at night. Guangdong, Shanxi, Inner Mongolia, and Guizhou have the highest proportion during 00:00–06:00, 06:00–12:00, 12:00–18:00, and 18:00–00:00. On comparing the centralization index I of the peak season, the centralization index I for Inner Mongolia is the largest (63.97%), and its consumer groups are relatively concentrated in consumption time. Guangxi’s centralization index I is the smallest (31.28%) and its consumer groups are relatively uniform in consumption time. In the off season, the Inner Mongolia centralization index I remains the largest (70.65%), and its consumer groups are relatively concentrated in the consumption time. Shandong’s centralization index I is the smallest (28.78%) and its consumer groups are relatively uniform in terms of consumption time.

4.1.3. Difference of Time Zone

The different province-level regions in China are located in different time zones. However, all province-level regions are based on Beijing time, which is Greenwich Mean Time (GMT) plus eight. China’s province-level regions are mainly located in GMT+7 and GMT+8. In this study, there are 9 province-level regions in GMT+7, including Sichuan, Guangxi, Chongqing, Shaanxi, Shanxi, Hunan, Inner Mongolia, Guizhou, Yunnan. There are 16 province-level regions in GMT+8, including Guangdong, Beijing, Jiangsu, Hubei, Zhejiang, Shandong, Shanghai, Anhui, Hebei, Liaoning, Fujian, Heilongjiang, Jiangxi, Jiling, Tianjin and Henan. Only Xinjiang is located in GMT+6. Therefore, we mainly analyze the difference in the consumption time of online games between GMT+7 and GMT+8. We calculate the percentage of distribution of the total consumption amount of GMT+7 and GMT+8 in one day, as shown in Figure 3.
We find a small difference for GMT+7 and GMT+8 during 10:00–14:00. The distribution of the GMT+7 and GMT+8 is not consistent. The difference between the both is only one hour. This is affected by lifestyle habits in different time zones. Also, 12:00–14:00 is off work time. There is a peak consumption period during 12:00–14:00. The percentage of distribution of consumption of GMT+7 and GMT+8 is basically the same at other times. Since the two time zones differ only by one hour, the difference between the two time zones is not too big. The difference of GMT+7 and GMT+8 is mainly reflected during 10:00–14:00.

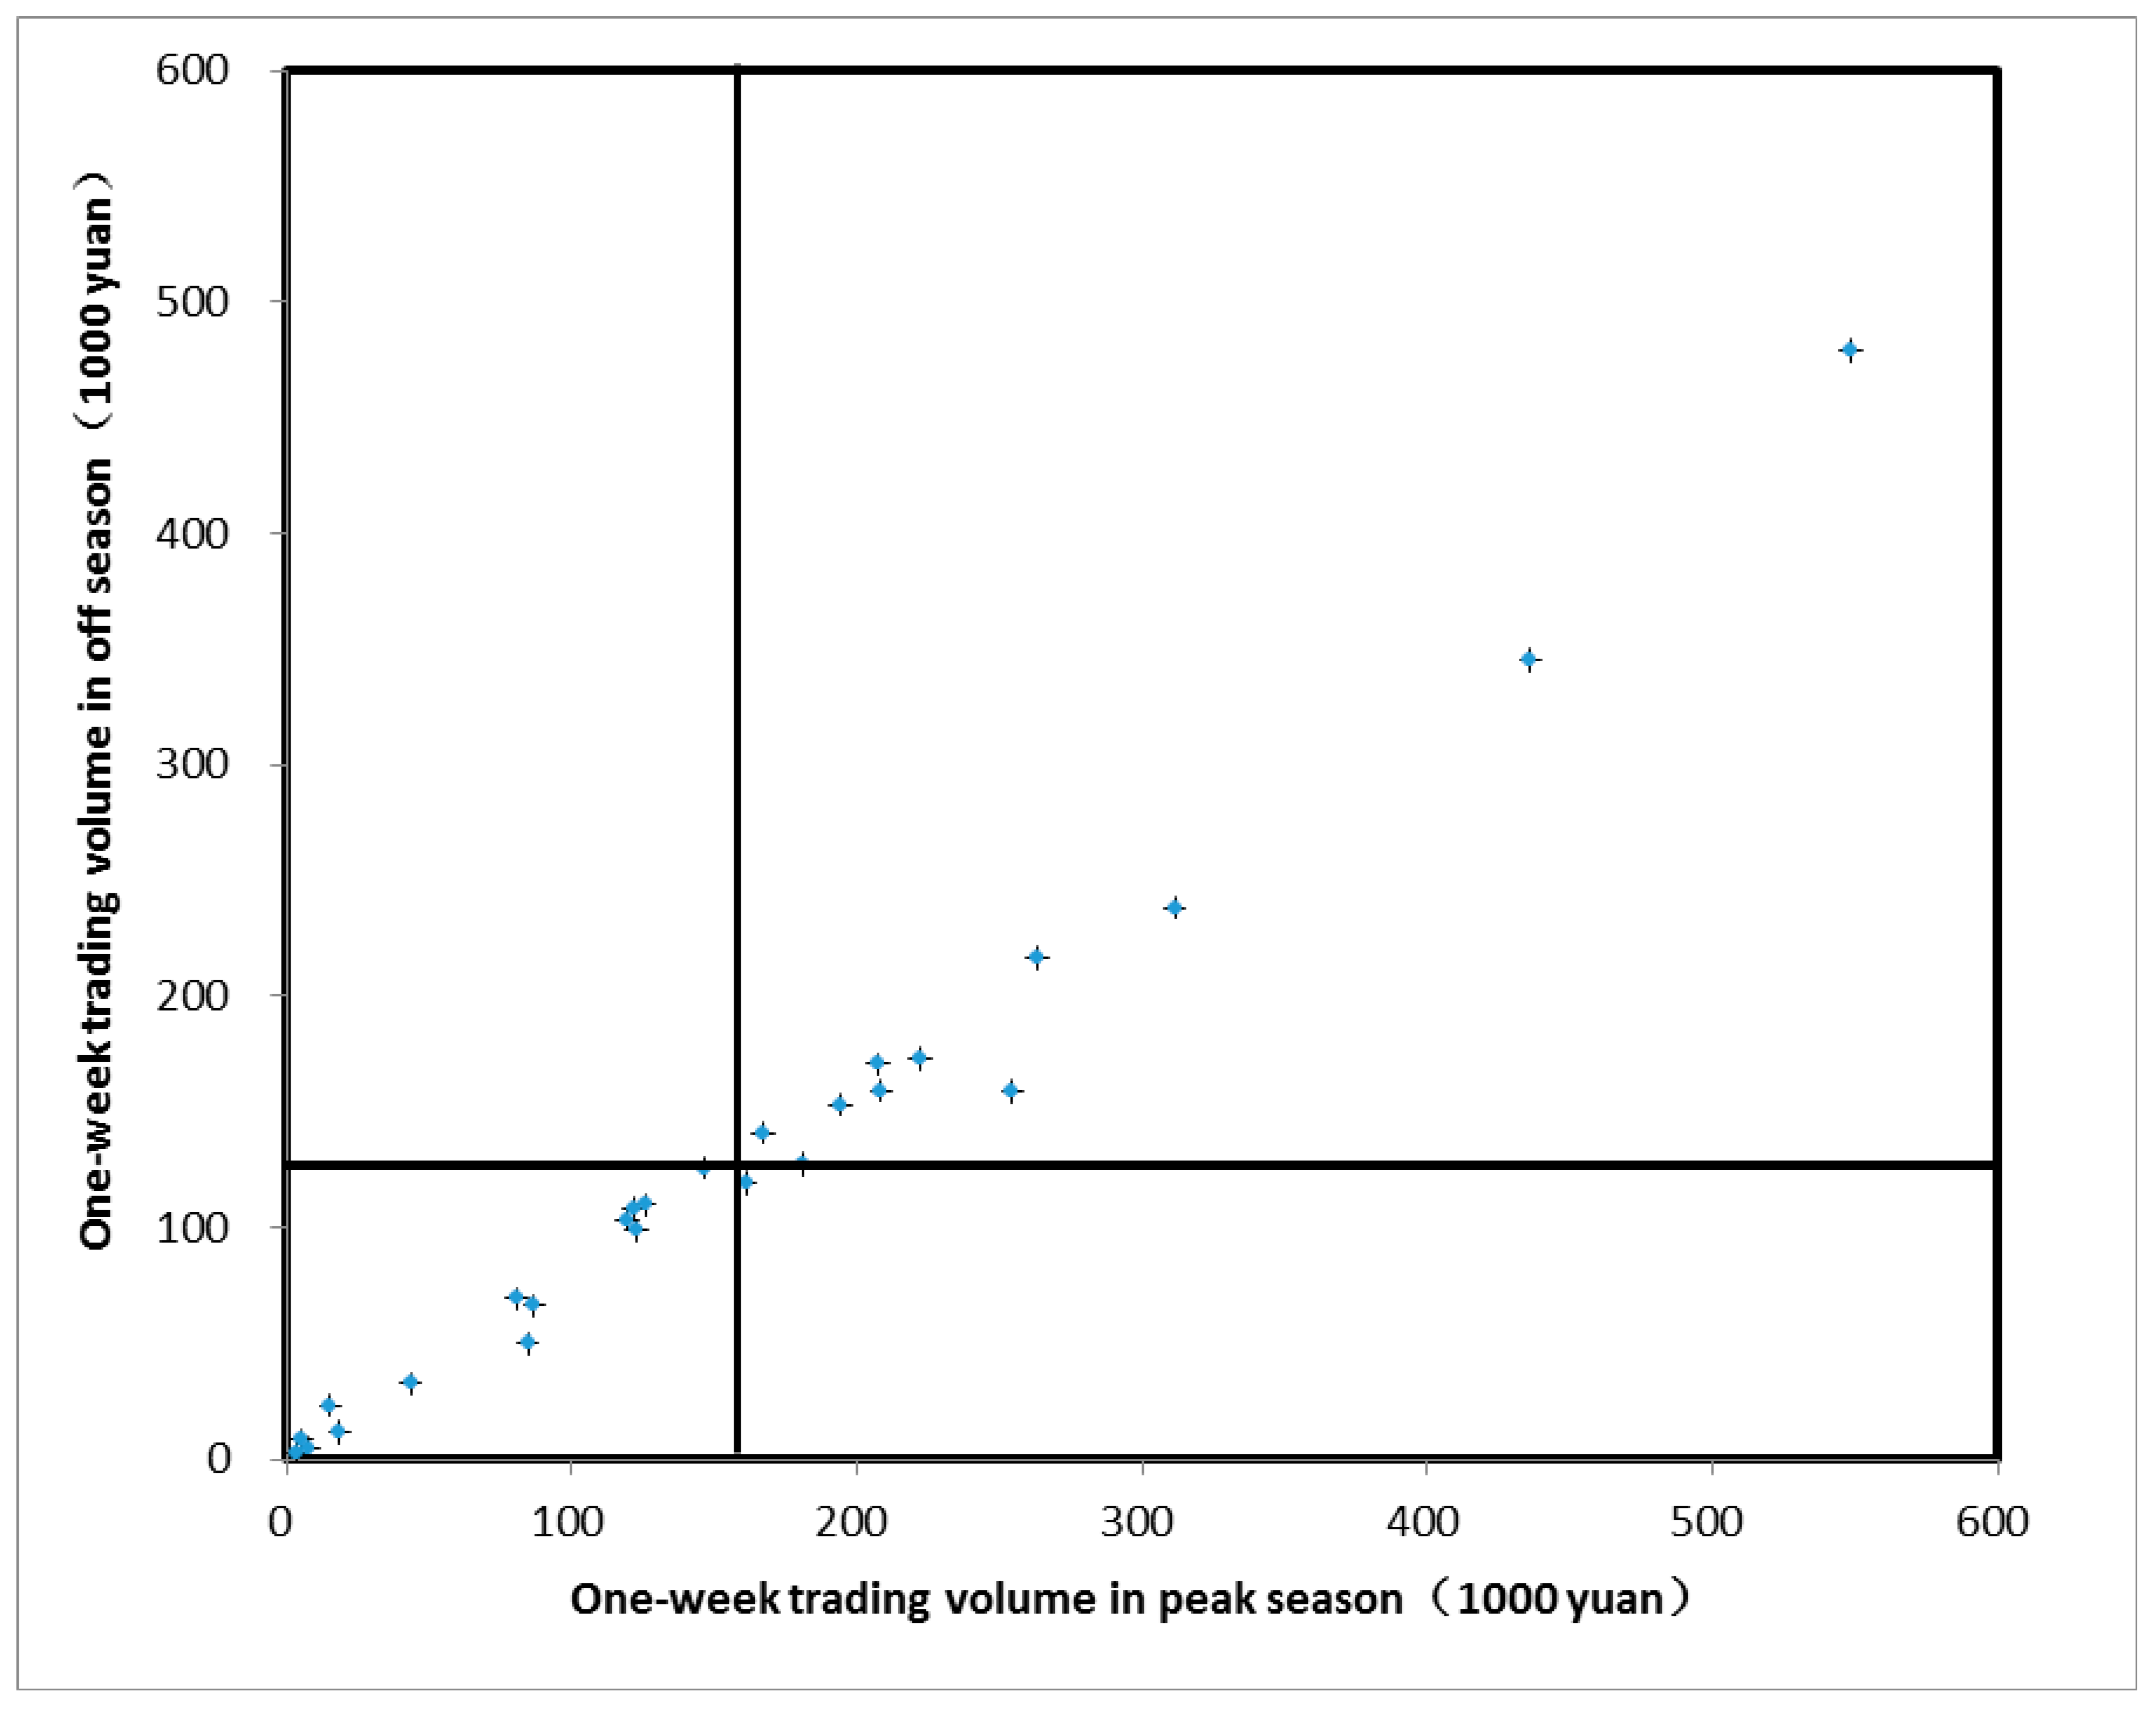
4.2. Chinese Online Game Consumption Space Characteristics

4.2.1. Grade Size Characteristic

The discussion on the size characteristics of the online game transaction level is analyzed from a provincial level. By sorting the online game transactions of 26 province-level regions and regions from large to small, the rank-size table of the two is obtained. Then, using lnPr as the ordinate and lnr as the abscissa, a scatter diagram is plotted and linear regression fitting is performed to obtain a double logarithmic graph of the distribution of provincial network game transactions (Figure 4). In general, the q value is greater than 1, indicating that the distribution of online game consumption levels in various province-level regions is relatively scattered, the scale difference is large, and the monopoly of the first province-level region is strong. The consumption level of online games in China is in a monopoly development mode.

4.2.2. Characteristic of Consumption Status

The quadrifid graph model is based on a scatter diagram and is mainly used to evaluate a thing from two dimensions, that is, the scatter diagram is divided into four regions by using the average of the two dimensions evaluated as the boundary line. The classification analysis of things is more commonly used in actual research [50]. A scatter diagram is drawn on the vertical and horizontal axes of the indicator system, respectively, in the off-season trading volume of the online game transaction. Then, according to the principle of division of the quadrant, regarding the average of the off-season transaction (126,825 yuan) and the average transaction of the peak season (159,267 yuan) as the dividing line, it will be divided into four parts of the 26 province-level regions, namely the A region (high peak season—high off season), B region (low peak season—high off season), C region (low peak season—low off season), and D region (high peak season—low off season) (Figure 5).
According to the quarter chart, the status of online game transactions in China’s province-level regions is divided into four types (Table 2). The status of 11 province-level regions are in the high peak season-high off season including Guangdong, Jiangsu, Sichuan, Hubei, Hunan, Guangxi, Henan, Shanghai, Zhejiang, Shandong, and Liaoning, accounting for 42.4% of China. Meanwhile the status of 14 province-level regions are in the low peak season-low off season including Beijing, Heilongjiang, Anhui and so on, accounting for 53.8% of China. The status of Hebei is only high peak season—low off season province, accounting for 3.8% of China. There are no low peak season—high off seasons in the province-level region. Overall, China’s provincial online game trading mainly occurs in the high peak season—high off season and low peak season—low off season, indicating that China’s provincial online game trading polarization is serious.

4.2.3. Basic Pattern of Online Game Consumption

Using the Jenks natural breakpoint method, the trading volume of the off-season, peak season, and the average of off-peak season in 26 province-level regions of China were divided into four grades, as shown in Figure 6. The results show that from the average transaction volume in the off-peak season, the online game transactions between China’s province-level regions are quite different. The province-level regions in the first level are distributed in the eastern coastal areas, mainly in Guangdong and Jiangsu; extending from the coast to the inland, the second level mainly includes 9 province-level regions: Liaoning, Shandong, Henan, Hubei, Hunan, Zhejiang, Shanghai, Guangxi and Sichuan; The third and fourth grades are mainly distributed in the central and western regions. Due to the extremely low number and demand of online game players in Gansu, Hainan, Ningxia, Qinghai, and Tibet, these regions have not met the requirements for opening a game service area. Their online game consumption level is not as high as the fourth level. Compared with the trading volume in the off-peak season, the online game transactions in Shandong and Shaanxi have dropped by one grade from the peak season to the off season. This is because the number of regular students enrolled in normal and short-cycle courses in these two province-level regions is large. There is a considerable difference in the level of online game consumption between the student group during the summer vacation and school. In summary, the spatial distribution of provincial online game trading volume from east to west shows an obvious ladder distribution.

4.2.4. Online Game Consumption in Per Capita

We analyze the consumption of online games per capita in different regions. Since the people who play games are mainly Internet users, this study uses Internet users as a reference standard for analysis. We calculate the consumption of per capita Internet users in different province-level regions, as shown in Figure 7.
As can be seen from the figure, the province-level regions with low online game consumption are mainly concentrated in the western regions of China, including Xinjiang, Inner Mongolia, Yunnan and Guizhou. These province-level regions are mainly living areas of the ethnic minority in China.
China is a multi-ethnic country. In order to protect the diversity of the national culture, many ethnic minorities in China continue to retain their own language. Therefore, these ethnic minorities are not familiar with Mandarin. However, the game of DNF uses Mandarin as a language, so language has become the biggest obstacle for many ethnic minorities to play this and similar games, and as such the per capita online game consumption in minority areas is relatively small.
It can also be seen that virtual goods are also a kind of cultural good, and regional cultural differences may cause people in different regions to have a greater degree of acceptance of these goods. This also reminds us that these areas will be the consumer market that needs to be developed in the future.

5. Driving Mechanism for Online Game Virtual Goods Based on Central Place Theory

The above analysis shows that there are significant geospatial differentiation characteristics in China’s online game transaction volumes. To further understand this differentiation pattern and its influencing factors, this paper introduces a series of variables to explain the online game virtual goods transaction volume through Pearson correlation analysis. The influencing factors, in turn, examine the applicability of the CPT for virtual goods. By summarizing the existing scholars’ research on e-commerce characteristics [51] and their virtual consumption characteristics, the study selects business volume of telecommunication services (X1), total retail sales of consumer goods (X2), GDP (X3), number of Internet users (X4), Number of regular students enrolled in normal and short-cycle courses (X5), sales of e-commerce (X6) and purchases of e-commerce (X7). These influencing factors are analyzed by Pearson correlation with the trading volume in the peak season, the trading volume in the off season, and the average transaction amount. The results are listed in Table 3.

5.1. Transmission and Production Capacity

The correlation coefficients between the volume of the peak season, the off season, and the average transaction and the total volume of telecommunication services are 0.843, 0.861, and 0.853, which have passed the respective significance test of 0.01. Hamari et al. [52] indicated that increasing the quality of a premium service has surprisingly little direct effect on the demand for additional premium services. The total amount of telecommunication services can reflect the telecommunication enterprises providing various types of telecommunication services to the society. The total quantity is also the basis for providing virtual goods in each region. First, the Internet data transmission service can provide a good online game consumption environment for online game players. In addition, the network access, network value-added, data communication, and other ancillary services provided by telecom enterprises play an important role in promoting the production of virtual goods for online games. Finally, virtual goods are a kind of data that need to be transmitted through information flow, and the total amount of telecommunication services directly reflects the status of information flow. This shows that the flow of information becomes the transmission mode for virtual goods instead of logistics. It can be seen that because the virtual goods do not need to be touched, the goods do not require the proximity of the shopping space, i.e., the virtual commodity transactions are not affected by the spatial distance and traffic conditions. In summary, in areas with high levels of telecommunications services, their ability to produce and transmit virtual goods is relatively high, and their consumption of virtual goods is relatively high.

5.2. Consumption Ability

The correlation coefficients between the peak season, the off season, and the average transaction volume and the total sales of social retail products were 0.83, 0.822, and 0.828, which passed the respective significance test of 0.01. The correlation coefficients between the peak season, the off season and the average transaction volume and GDP were 0.829, 0.82, and 0.827, which passed the respective significance test of 0.01. This can reflect the consumption ability and economic development level of the region to promote online game players. According to Rostovian’s theory of economic growth stage, in a region where economic growth is at a higher stage, people will begin to pursue cultural and entertainment enjoyment after meeting the needs of material life. Online game entertainment consumption is an example of this. For example, the eastern regions with higher economic development levels such as Guangdong and Jiangsu have higher total consumption of online games and entertainment.

5.3. Consumer Group

The correlation coefficients between the peak season, off season, and the average transaction volume and the number of Internet users were 0.828, 0.833, and 0.832, which passed the respective significance test of 0.01. The correlation coefficients between the peak season, off season, and the average transaction amount and the number of regular students enrolled in normal and short-cycle courses were 0.74, 0.717, and 0.732, which passed the respective significance test of 0.01. Hamari et al. [53] found game players are mostly 20–29 years old. The regular students enrolled in normal and short-cycle courses are mostly 20–29 years old in China. These people have money and time to play game. So the game players are mainly from Internet users and regular students enrolled in normal and short-cycle courses. If the number of regular students enrolled in normal and short-cycle courses and the number of Internet users in this area is relatively large, there will be a large number of potential online game consumers in this area. The number of people participating in online games will be relatively high. Therefore, these two factors have a high correlation with the online game transaction amount. Compared with the transaction volume in the peak season, the number of regular students enrolled in normal and short-cycle courses is more relevant to the peak season transaction volume. The reason for this is that after the regular students enrolled in normal and short-cycle courses have a holiday in July, their entertainment time is abundant, and their consumption on online games is high; thus, the amount of online game transactions is relatively large. After the start of school in September, regular students enrolled in normal and short-cycle courses have less entertainment time and lower consumption of online games. This further proves that due to the summer vacation of regular students enrolled in normal and short-cycle courses, online game consumption has obvious differences in the season. It can be seen that, similar to other physical goods, virtual goods are consumer-oriented, that is, the sales of virtual goods are related to the spatial distribution of virtual goods consumers.

5.4. Means of Consumption

The correlation coefficient between the volume of peak season, off season, and average transaction and e-commerce sales was 0.57, 0.592, and 0.581, which passes the significance level test of 0.01. The correlation coefficient between peak season, off season, and average transaction volume and e-commerce purchase amount was 0.601, 0.632, and 0.616, which passes the significance level test of 0.01; the online game transaction amount is moderately related to the e-commerce level. It can reflect that e-commerce has a certain role in promoting online game consumption. This is because the e-commerce environment is better, which enhances the e-commerce awareness and can encourage online game players to be more skilled in using the Internet platform for online game transactions. It can also be seen that since virtual goods do not need to be touched, consumers can easily purchase goods through the e-commerce platform. The purchase process of physical goods requires connecting the buyers and sellers by means of transportation.

6. Discussion and Conclusions

6.1. Discussion

Based on summarizing the research results of scholars in the past, this paper examines the application of CPT to virtual goods, and further analyzes the similarities and differences between physical goods and virtual goods.
In contrast to market principles, first, in terms of consumption power, virtual goods are the same as physical goods, and they are both mainly distributed in areas with high levels of economic development and strong consumer spending power. In addition, in terms of the consumer group, virtual goods are as consumer-oriented as the consumption of physical goods. It can be seen from this study that the consumers of online game virtual goods are Internet users and regular students enrolled in normal and short-cycle courses. Consumer spending power is affected by the level of local economic development. For example, areas with high consumption of online games are concentrated in areas with high levels of economic development. Finally, in terms of consumption, consumers can purchase and use virtual goods through the Internet, enabling out-of-the-box engagement; thus, breaking the limits of space distance. Compared with the consumption of physical goods, consumers are more inclined to choose the nearest purchase owing to the impact of freight and distance.
When comparing using the traffic principle, the spatial distance has different effects on physical goods and virtual goods, and this leads to many differences in the principle of transportation between these goods. First, in the transmission mode, the transmission mode of physical goods is mainly logistics, which is greatly affected by the spatial distance. The virtual goods themselves are a kind of data, and the transmission mode for these goods is information flow. Second, in terms of transmission capacity, the level of traffic in a region plays an important role in the distribution of physical goods. In other words, transportation capacity affects the input and output of physical goods. In contrast, the level of telecommunications services has a greater impact on virtual goods. This is because the level of telecommunication services reflects the data transmission capacity of an area, and the ability of data transmission directly affects the transaction and transmission of virtual goods. Further, the level of telecommunications services is also related to the production and circulation of virtual goods. Finally, in terms of transmission costs, freight has a certain impact on the consumers’ purchase of physical goods. However, virtual goods are transmitted over the Internet, and their transmission costs are negligible.
In short, for physical goods, regardless of whether buyers go to the seller’s shop to buy goods or sellers send goods to buyers, their goods need to be touched by the buyers. This process will be further affected by spatial distance and traffic conditions. Physical goods are dominated by market forces; however, they are also affected by the spatial distance. Since virtual goods do not need to be touched, they are no longer affected by spatial distance and traffic conditions; however, they are still affected by market effects.
Owing to the limitations of the data, the interpretation of the administrative principles is slightly insufficient, and further research is needed in the future. On the micro scale, the spatial distribution of virtual goods will be reconstructed. Issues such as identifying the form in which the spatial structure features appear will be resolved in the future.

6.2. Conclusions

This study uses ArcGIS and SPSS software and selects a representative online game DNF trading order on the largest online game virtual commodity trading platform in China as a data source, which analyzes the spatial and temporal distribution differences and influencing factors of online game consumption in China during the peak season. The activity levels and consumption habits of online game players in different province-level regions are as follows: (1) From the time scale, due to students’ summer vacation, online game consumption has the characteristics of the transaction volume in the peak season being 25.8% higher than that in the off season, and the daily online game trading volume shows a time-lapse characteristic of 00:00–06:00, and a fluctuation of the time during 06:00–00:00. The online game trading peaks between 15:00–16:00 and 21:00–22:00, reflecting the highest level of activity among online game users in these two time periods. (2) The grade size characteristics show that China’s online game consumption level is a monopoly development model, and Guangdong has a strong monopoly. China’s provincial online game trading volume is in two states of “low peak season—low off season” and “high peak season—high off season”, indicating that the “polarization” phenomenon of online game consumption level is serious. (3) From the provincial level, the basic pattern of online game trading levels declines from east to west. (4) In terms of influencing factors, the total amount of telecommunication services is the main reason for the difference in online game consumption. Second, the total retail sales of goods, GDP, Internet access, and the number of regular students enrolled in normal and short-cycle courses, and Internet user have a certain impact on online game consumption. (5) Since virtual goods do not need to be touched, they are no longer affected by the spatial distance and traffic conditions; however, they are still affected by the market.
Our findings are different from previous findings. We analyze virtual goods from a macro perspective. We find that differences involving ethnic minorities and the level of telecommunications services have also affected the purchase intention of virtual goods in China. We also sum up the distribution of consumption of online game consumers over one day. In order to achieve sustainable management, we think that areas with ethnic minorities will be the consumer market that needs to be developed in the future in China. We should develop a form of game suitable for ethnic minorities to attract the interest of these groups in China. Game developers should also focus on the marketing of virtual goods in peak hours (15:00 and 22:00) every day. In addition, online game consumption is a low-carbon consumption, which is worth promoting. Beyond online game consumption, other virtual goods are growing rapidly in China. Virtual goods conform to the development concept of emission-reduction in China and provide a way to engage in sustainable economic development.
Although this study explores the spatial and temporal distribution characteristics and influencing factors of online game consumption from the perspective of geography, it attempts to reveal the active intensity and consumption of online games in various province-level regions, which provides a scientific reference for the development strategy of the online game industry. However, there are still many shortcomings in this study. For example, the analysis of the influencing factors lacks consideration of the impact of government decision-making. Research scale is not yet accurate to the municipal level. As an important part of service consumption, games have played a positive role in consumption growth. However, this study has certain limitations, and only sampling data is used for investigation; the research on game preference in different regions is still insufficient. These issues have to be further resolved by geographers. With the further development of mobile Internet, the game culture industry will enter a period of faster development, and its role in improving people’s life and leisure level, stimulating employment and entrepreneurship, and increasing consumption will become increasingly important. In this context, it is extremely important to promote academic research on cultural industries such as animated games.

Author Contributions

Conceptualization, Q.L. (Qiang Li) and H.L.; Data curation, S.X.; Formal analysis, Q.L. (Qing Liu); Investigation, Q.L. (Qiang Li), Q.L. (Qing Liu) and S.X.; Methodology, X.G. and J.L.; Project administration, H.L.; Resources, J.L.; Writing—original draft, Q.L. (Qiang Li), Q.L. (Qing Liu) and S.X.; Writing—review & editing, X.G.

Funding

This research was funded by NSFC41371525, JOF201702, HNNSFC417179, Scientific Research Start-up Funding of the Program Supporting Special Talent Zone (Henan University; to Zhaodong FENG) and Scientific Promotion Funding of the Prioritized Academic Discipline (Geography, Henan University; to Zhaodong FENG).

Acknowledgments

The authors thank Guifang Liu, Zhiwei Ding, Fan Zheng and Feixiang Zhai whose comments and suggestions were very helpful in improving the quality of this paper.

Conflicts of Interest

The authors declare no conflict of interest.

References

  1. Levitt, S.D.; List, J.A.; Neckermann, S.; Nelson, D. Quantity discounts on a virtual good: The results of a massive pricing experiment at King Digital Entertainment. Proc. Natl. Acad. Sci. USA 2016, 113, 7323–7328. [Google Scholar] [CrossRef] [Green Version]
  2. Park, B.W.; Lee, K.C. Exploring the value of purchasing online game items. Comput. Hum. Behav. 2011, 27, 2178–2185. [Google Scholar] [CrossRef]
  3. Hamari, J. Why do people buy virtual goods? Attitude toward virtual good purchases versus game enjoyment. Int. J. Inf. Manag. 2015, 35, 299–308. [Google Scholar] [CrossRef]
  4. Wang, W.T.; Chang, W.H. A study of virtual product consumption from the expectancy disconfirmation and symbolic consumption perspectives. Inf. Syst. Front. 2014, 16, 887–908. [Google Scholar] [CrossRef]
  5. Lehdonvirta, V. Virtual item sales as a revenue model: Identifying attributes that drive purchase decisions. Electron. Commer. Res. 2009, 9, 97–113. [Google Scholar] [CrossRef]
  6. Drachen, A.; Riley, J.; Baskin, S.; Klabjan, D. Going out of business: Auction house behavior in the massivelymulti-player online game glitch. Entertain. Comput. 2014, 5, 219–232. [Google Scholar] [CrossRef]
  7. Bloomfield, R.J.; Cho, Y.J. Unregulated stock markets in Second Life. South. Econ. J. 2011, 78, 6–29. [Google Scholar] [CrossRef]
  8. Castronova, E. Real Products in Imaginary Worlds. Harv. Bus. Rev. 2005, 83, 20–21. [Google Scholar]
  9. Castronova, E. On the Research Value of Large Games: Natural Experiments in Norrath and Camelo. Games Cult. 2006, 1, 163–186. [Google Scholar] [CrossRef]
  10. Seo, Y. Professionalized consumption and identity transformations in the field of eSports. J. Bus. Res. 2016, 69, 264–272. [Google Scholar] [CrossRef]
  11. Hamari, J.; Keronen, L. Why do people buy virtual goods: A meta-analysis. Comput. Hum. Behav. 2017, 71, 59–69. [Google Scholar] [CrossRef]
  12. Castronova, E.; Bell, M.W.; Cornell, R.; Cummings, J.; Emigh, W.; Falk, M.; Fatten, M.; LaFourest, P.; Mishler, N. A Test of the Law of Demand in a Virtual World: Exploring the Petri Dish Approach to Social Science. Int. J. Gaming Comput. Mediat. Simul. 2009, 1, 1–16. [Google Scholar] [CrossRef]
  13. Marchand, A.; Hennig-Thurau, T. Value Creation in the Video Game Industry: Industry Economics, Consumer Benefits, and Research Opportunities. J. Interact. Mark. 2013, 27, 141–157. [Google Scholar] [CrossRef]
  14. Seo, Y. Electronic sports: A new marketing landscape of the experience economy. J. Mark. Manag. 2013, 29, 1542–1560. [Google Scholar] [CrossRef]
  15. Thomes; Paul, T. In-house publishing and competition in the video game industry. Inf. Econ. Policy 2015, 32, 46–57. [Google Scholar] [CrossRef]
  16. Davidovicinora, M. Paid and Free Digital Business Models Innovations in the Video Game Industry. Digiworld Econ. J. 2014, 2, 83–102. [Google Scholar]
  17. Buchanan-Oliver, M.; Seo, Y. Play as co-created narrative in computer game consumption: The hero’s journey in Warcraft III. J. Consum. Behav. 2012, 11, 423–431. [Google Scholar] [CrossRef]
  18. Tao, W.; Hua, W.; Zongkui, Z.; Nan, C.; Lan, X.; Can, H. The Influence Factors of Online Game Consumption. J. Psychol. Sci. 2015, 38, 1482–1488. [Google Scholar]
  19. Yao, Y.; Chang, V. Towards Trust and Trust Building in a Selected Cloud Gaming Virtual Community. Int. J. Organ. Collect. Intell. 2014, 4, 64–86. [Google Scholar] [CrossRef] [Green Version]
  20. Mäntymäki, M.; Islam, A.K.M.N. Social virtual world continuance among teens: Uncovering the moderating role of perceived aggregate network exposure. Behav. Inf. Technol. 2014, 33, 536–547. [Google Scholar] [CrossRef]
  21. Mäntymäki, M.; Salo, J. Purchasing behavior in social virtual worlds: An examination of Habbo Hotel. Int. J. Inf. Manag. 2013, 33, 282–290. [Google Scholar] [CrossRef]
  22. Hamari, J.; Keronen, L. Why do people play games? A meta-analysis. Int. J. Inf. Manag. 2017, 37, 125–141. [Google Scholar] [CrossRef]
  23. Alha, K.; Koskinen, E.; Paavilainen, J.; Hamari, J. Why do people play location-based augmented reality games: A study on Pokemon GO. Comput. Hum. Behav. 2019, 93, 114–122. [Google Scholar] [CrossRef]
  24. Huang, E. Online experiences and virtual goods purchase intention. Internet Res. 2012, 22, 252–274. [Google Scholar] [CrossRef]
  25. Seo, Y.; Buchanan-Oliver, M.; Fam, K.S. Advancing research on computer game consumption: A future research agenda. J. Consum. Behav. 2015, 14, 353–356. [Google Scholar] [CrossRef]
  26. Rothmund, T.; Klimmt, C.; Gollwitzer, M. Low Temporal Stability of Excessive Video Game Use in German Adolescents. J. Media Psychol. 2015, 30, 53–65. [Google Scholar] [CrossRef]
  27. Choi, Y.K.; Yoon, S.; Taylor, C.R. How character presence in advergames affects brand attitude and game performance: A cross-cultural comparison. J. Consum. Behav. 2015, 14, 357–365. [Google Scholar] [CrossRef]
  28. Kuss, D.J.; Griffiths, M.D. Internet Gaming Addiction: A Systematic Review of Empirical Research. Int. J. Ment. Health Addict. 2012, 10, 278–296. [Google Scholar] [CrossRef]
  29. Wei, L.; Zhang, S.; Turel, O.; Bechara, A.; He, Q. A Tripartite Neurocognitive Model of internet Gaming Disorder. Front. Psychiatry 2017, 8, 1–11. [Google Scholar] [CrossRef]
  30. Morschheuser, B.; Riar, M.; Hamari, J.; Maedchea, A. How games induce cooperation? A study on the relationship between game features and we-intentions in an augmented reality game. Comput. Hum. Behav. 2017, 77, 169–183. [Google Scholar] [CrossRef]
  31. Sjoblom, M.; Hamari, J. Why do people watch others play video games? An empirical study on the motivations of Twitch users. Comput. Hum. Behav. 2017, 75, 985–996. [Google Scholar] [CrossRef]
  32. Castronova, E.; Knowles, I.; Ross, T.L. Policy questions raised by virtual economies. Telecommun. Policy 2015, 39, 787–795. [Google Scholar] [CrossRef]
  33. Castronova, E.; Williams, D.; Shen, C.; Ratan, R.; Xiong, L.; Huang, Y.; Keegan, B. As Real as Real? Macroeconomic Behavior in a Large-Scale Virtual World. New Media Soc. 2009, 11, 685–707. [Google Scholar] [CrossRef]
  34. Castronova, E. The Right to Play. N. Y. Law Sch. Law Rev. 2005, 49, 185–210. [Google Scholar]
  35. Ying, Y. Progress in commercial spatial studies in western countries since the 1920s. Trop. Geogr. 2000, 20, 62–66. [Google Scholar]
  36. Chunshan, Z.; Yan, L.; Yanran, S. Research progress of commercial geography in china. Acta Geogr. Sin. 2004, 59, 1028–1036. [Google Scholar]
  37. Huayou, Z. Research on urban retailing’s microlocation selection and competitiveness—Take wal-mart retail business in jinhua as an example. China Bus. Mark. 2009, 23, 55–58. [Google Scholar]
  38. Wuyang, Y.; Qi, Y. On the areal structure of urban settlements. Geogr. Res. 1986, 5, 1–11. [Google Scholar]
  39. Yishao, S. The historical development and geographical distribution of fairs in China. Geogr. Res. 1999, 18, 318–326. [Google Scholar]
  40. Shangyi, Z.; Limei, J. Commercial Space Succession in Old City of Beijing Case of Survey Line of Inner City in Beijing from 1996 to 2006. Sci. Geogr. Sin. 2009, 29, 493–499. [Google Scholar]
  41. Ling, X.; Baiyu, L.; Jin, W. Dynamic simulation of central place by using agent-based modeling. Geogr. Res. 2010, 7, 46–49. [Google Scholar]
  42. Wei, Z.; De, W. Multi-agent Based Simulation of Retail Spatial Structure. Acta Geogr. Sin. 2011, 66, 796–804. [Google Scholar]
  43. Runjiao, L.; Lei, S.; Difei, J. Using Multi-agent Simulation Method to Verify the Space Structure of Central Place Theory. Geogr. Geo-Inf. Sci. 2016, 32, 18–24. [Google Scholar]
  44. South, R.; Boots, B. Relaxing the nearest centre assumption in central place theory. Pap. Reg. Sci. 2005, 78, 157–177. [Google Scholar] [CrossRef]
  45. Barton, B. The creation of centrality. Ann. Assoc. Am. Geogr. 1978, 68, 34–44. [Google Scholar] [CrossRef]
  46. Mäntymäki, M.; Salo, J. Why do teens spend real money in virtual worlds? A consumption values and developmental psychology perspective on virtual consumption. Int. J. Inf. Manag. 2015, 35, 124–134. [Google Scholar] [CrossRef]
  47. Rui, L.; Dianting, W.; Jie, B.; Yan, Q.; Wei, W. Evolution of temporal and spatial pattern and driving mechanisms of agglomerative growth of senior science talents: A case study of academicians of CAS. Prog. Geogr. 2013, 32, 1123–1138. [Google Scholar]
  48. Dingquan, Y.; Qunyuan, C. Study on the size—Distribution of urban system inhunan province based on the fractal theory. Econ. Geogr. 2006, 26, 245–248. [Google Scholar]
  49. Guoliang, Y.; Jie, Z.; Nanshan, A.; Bo, L. Zip Structure and Difference Degree of Tourist Flow Size System: A Caes Study of Sichuan Province. Acta Geogr. Sin. 2006, 61, 1281–1289. [Google Scholar]
  50. Kunbo, S.; Yongchun, Y.; Qiang, R.; Run, L.; Qingnan, Y.; Rui, Z. Study on spatial pattern and spatial mismatch of experiential online group-buying market in China. Prog. Geogr. 2015, 34, 696–706. [Google Scholar]
  51. Yinghan, T. A Spatial Difference Study on China’s E-Commerce Development Level. Econ. Geogr. 2015, 35, 9–14. [Google Scholar]
  52. Hamari, J.; Hanner, N.; Koivisto, J. Service quality explains why people use freemium services but not if they go premium: An empirical study in free-to-play games. Int. J. Inf. Manag. 2017, 37, 1449–1459. [Google Scholar] [CrossRef]
  53. Hamari, J.; Alha, K.; Järvelä, S.; Kivikangas, J.M. Why do players buy in-game content? An empirical study on concrete purchase motivations. Comput. Hum. Behav. 2017, 68, 538–546. [Google Scholar] [CrossRef]
Figure 1. Theoretical framework.
Sustainability 11 02274 g001
Figure 2. Online games consumption sub period changes.
Sustainability 11 02274 g002
Figure 3. Difference of online games consumption in different time zones.
Sustainability 11 02274 g003
Figure 4. China’s provincial network game trading volume distribution double logarithmic graph.
Sustainability 11 02274 g004
Figure 5. Quadrifid graph of online game trading volume in province-level regions of China.
Sustainability 11 02274 g005
Figure 6. Geographical distribution of China’s provincial online game consumption levels.
Sustainability 11 02274 g006
Figure 7. China’s provincial online game consumption levels of per online Internet users.
Sustainability 11 02274 g007
Table 1. Proportion of online game consumption in each province-level region (%).
Peak Season Off Season
Province-Level Region00:00
–06:00
06:00
–12:00
12:00
–18:00
18:00
–00:00
I00:00
–06:00
06:00
–12:00
12:00
–18:00
18:00
–00:00
I
Guangdong11.6515.1034.2938.9632.6912.4418.0131.0338.5231.38
Beijing7.5916.7233.2842.4137.036.8017.6533.4242.1438.66
Sichuan10.1216.2635.8037.8132.979.3416.3635.8838.4234.59
Jiangsu3.8716.3835.1839.9433.017.2417.2334.0041.5236.57
Hubei8.2915.6735.9540.0836.719.9519.3431.0339.6833.10
Guangxi6.7419.2933.7737.6731.2810.3120.9431.8636.8929.15
Zhejiang4.5118.5534.7242.2138.787.8318.8136.3537.0135.37
Shandong5.8018.0734.2841.8638.349.2722.5032.3535.8828.78
Shanghai9.6815.4333.0541.8535.276.5217.4136.6839.3938.68
Anhui9.0014.7440.0736.1936.516.6422.8633.6336.8737.88
Hebei6.6519.9033.9039.5535.847.6419.2231.3041.8439.54
Liaoning7.2619.2836.3337.1333.375.1120.4537.8036.6436.33
Fujian12.1315.5235.8336.5232.708.0623.4933.4834.9732.74
Chongqing13.6515.9837.1933.1833.2711.4216.6933.1638.7335.73
Heilongjiang7.1419.1437.1436.5734.618.2820.4338.6732.6233.36
Jiangxi8.0317.0135.3139.6536.8010.1421.4736.7731.6237.63
Shaanxi10.3716.9232.2240.4935.6112.0819.6434.0834.2029.07
Jiling4.2821.8937.4336.4040.3511.4019.9633.1335.5135.21
Shanxi9.8717.1633.4539.5342.418.2823.8932.9934.8344.08
Tianjin4.9020.8433.2541.0151.082.5014.0936.9846.4258.48
Henan8.0319.5935.8036.5734.597.2620.2836.4036.0631.82
Hunan8.1914.9736.1640.6837.248.9218.6034.0538.4236.62
Xinjiang12.7111.5939.9335.7759.2510.190.0037.8451.9769.16
Inner Mongolia3.9825.5428.4842.0063.970.003.9142.7253.3870.65
Guizhou5.7325.2833.6235.3746.937.9914.6022.6554.7648.51
Yunnan4.1415.0629.1651.6554.026.6020.2525.3547.8055.86
Table 2. China provincial online game trading status classification.
StatusProvince-Level Region
High peak season and high off seasonGuangdong, Jiangsu, Sichuan, Hubei, Hunan, Guangxi, Henan, Shanghai, Zhejiang, Shandong, and Liaoning,
High peak season and low off seasonHebei
Low peak season and low off seasonBeijing, Heilongjiang, and Anhui, Chongqing, Fujian, Jilin, Jiangxi, Shaan xi, Shan xi, Guizhou, Tianjin, Xinjiang, Yunnan, and Inner Mongolia
Low peak season and high off seasonsNone
Table 3. Pearson correlation analysis of online game transaction volume and its influencing factors.
Influencing FactorsPeak SeasonOff SeasonAverage
business volume of telecommunication services (X1)0.843 **0.861 **0.853 **
total retail sales of consumer goods (X2)0.830 **0.822 **0.828 **
GDP (X3)0.829 **0.820 **0.827 **
number of Internet users (X4)0.828 **0.833 **0.832 **
number of regular students enrolled in normal and short-cycle courses (X5)0.740 **0.717 **0.732 **
sales of e-commerce (X6)0.570 **0.592 **0.581 **
purchases of e-commerce (X7)0.601 **0.632 **0.616 **
Note: ** p < 0.01.

