VisualUVAM: A Decision Support System Addressing the Curse of Dimensionality for the Multi-Scale Assessment of Urban Vulnerability in Spain


Abstract
1. Introduction
2. Methods
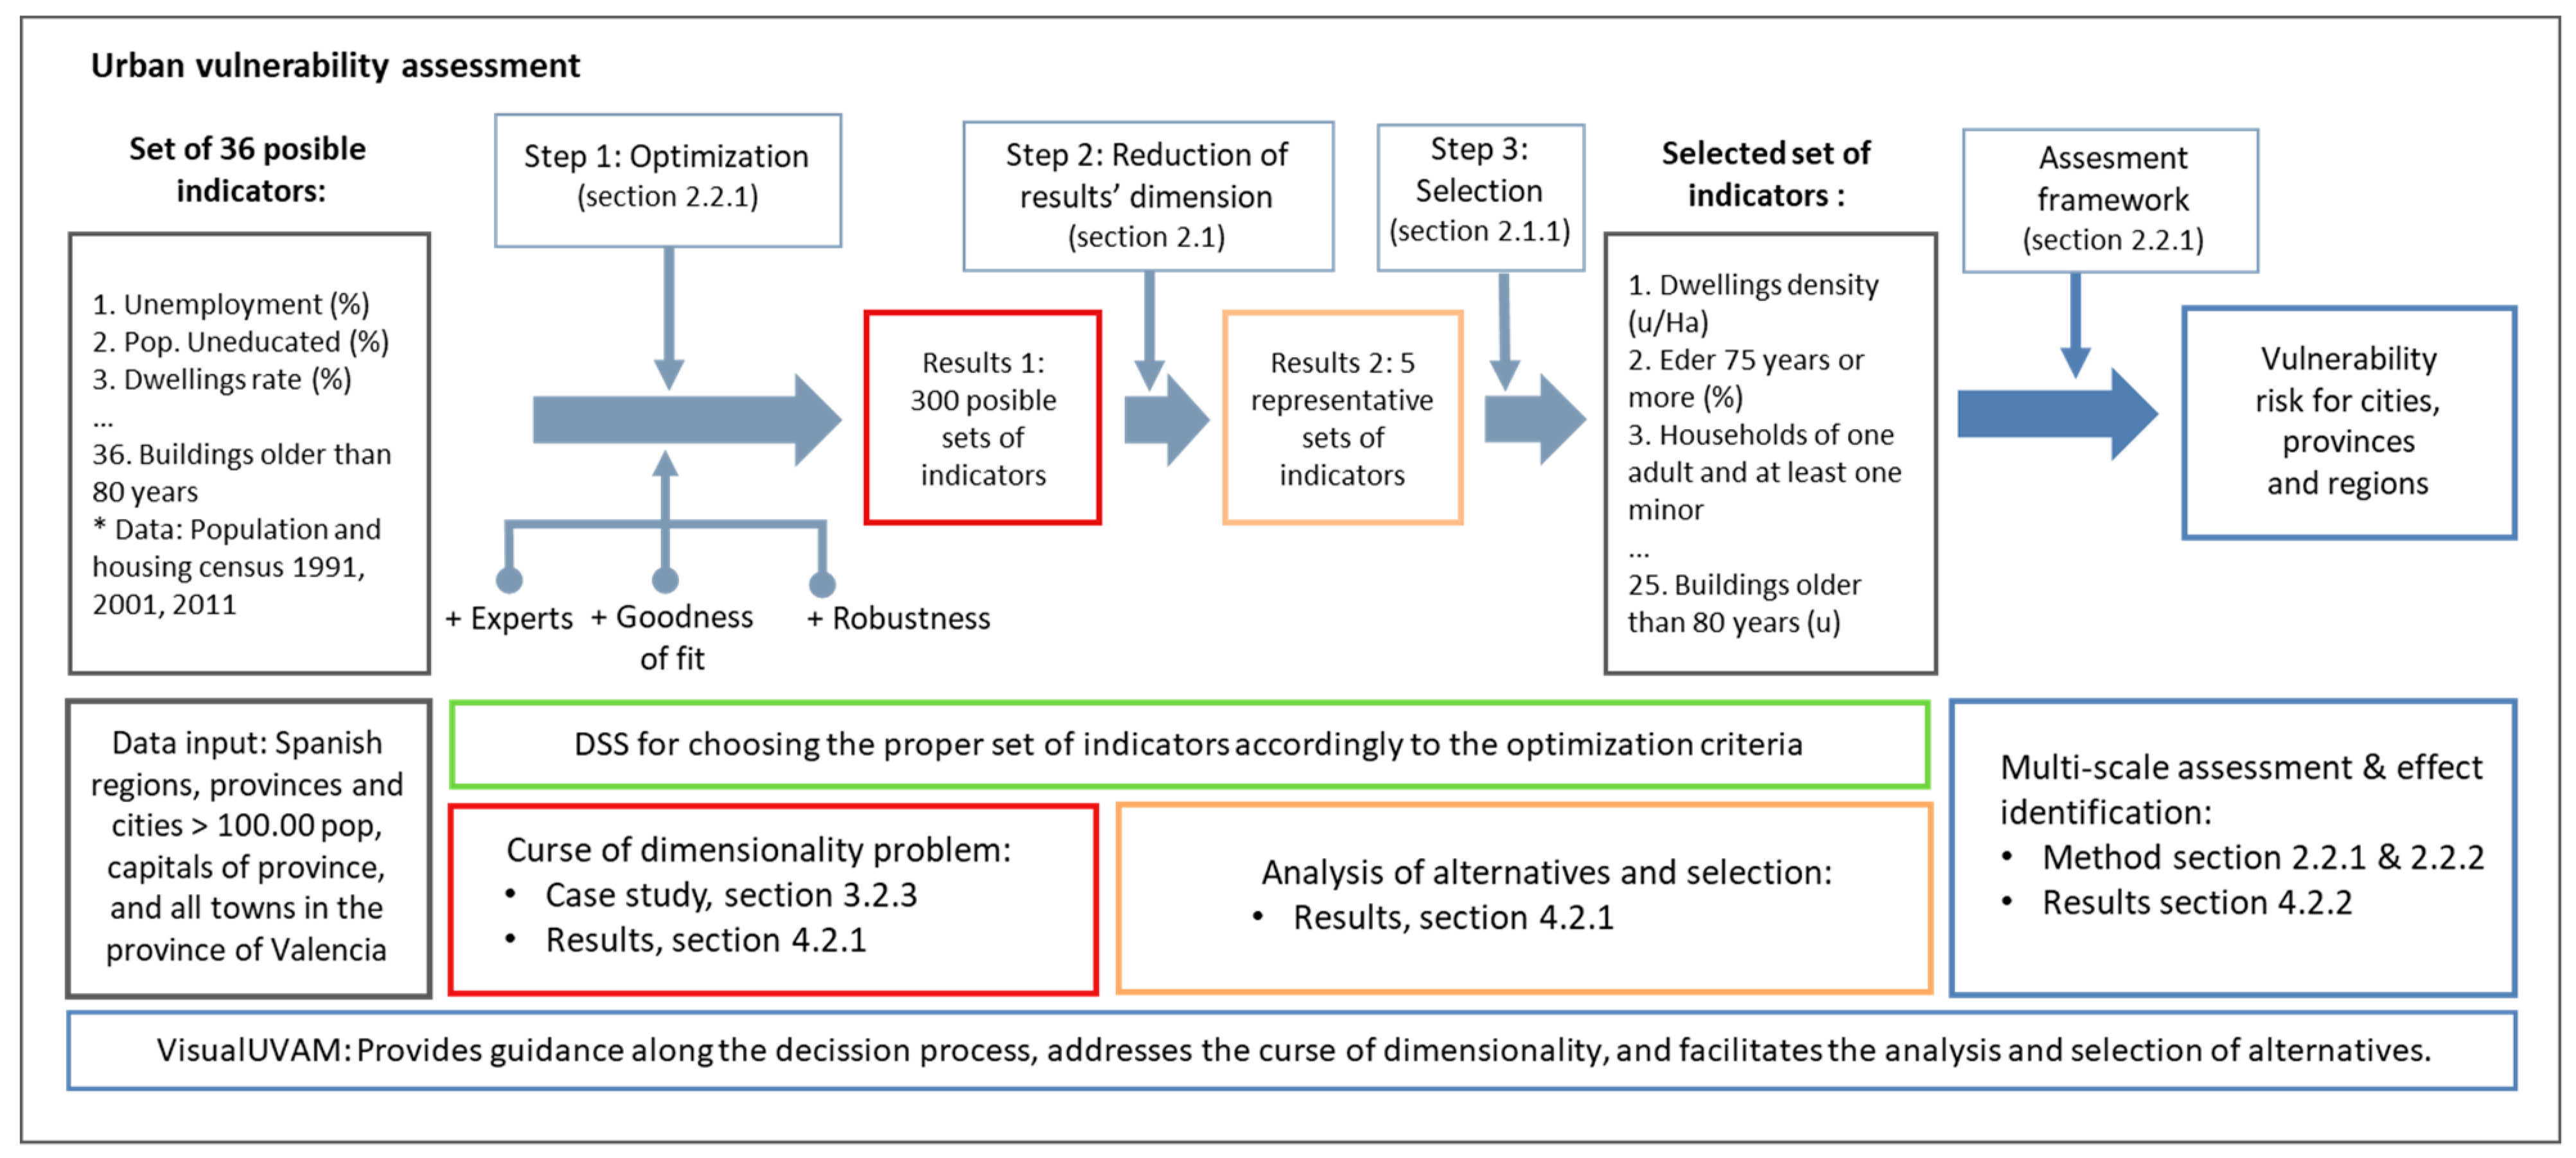
2.1. Decision-Making Framework: Addressing the Curse of Dimensionality
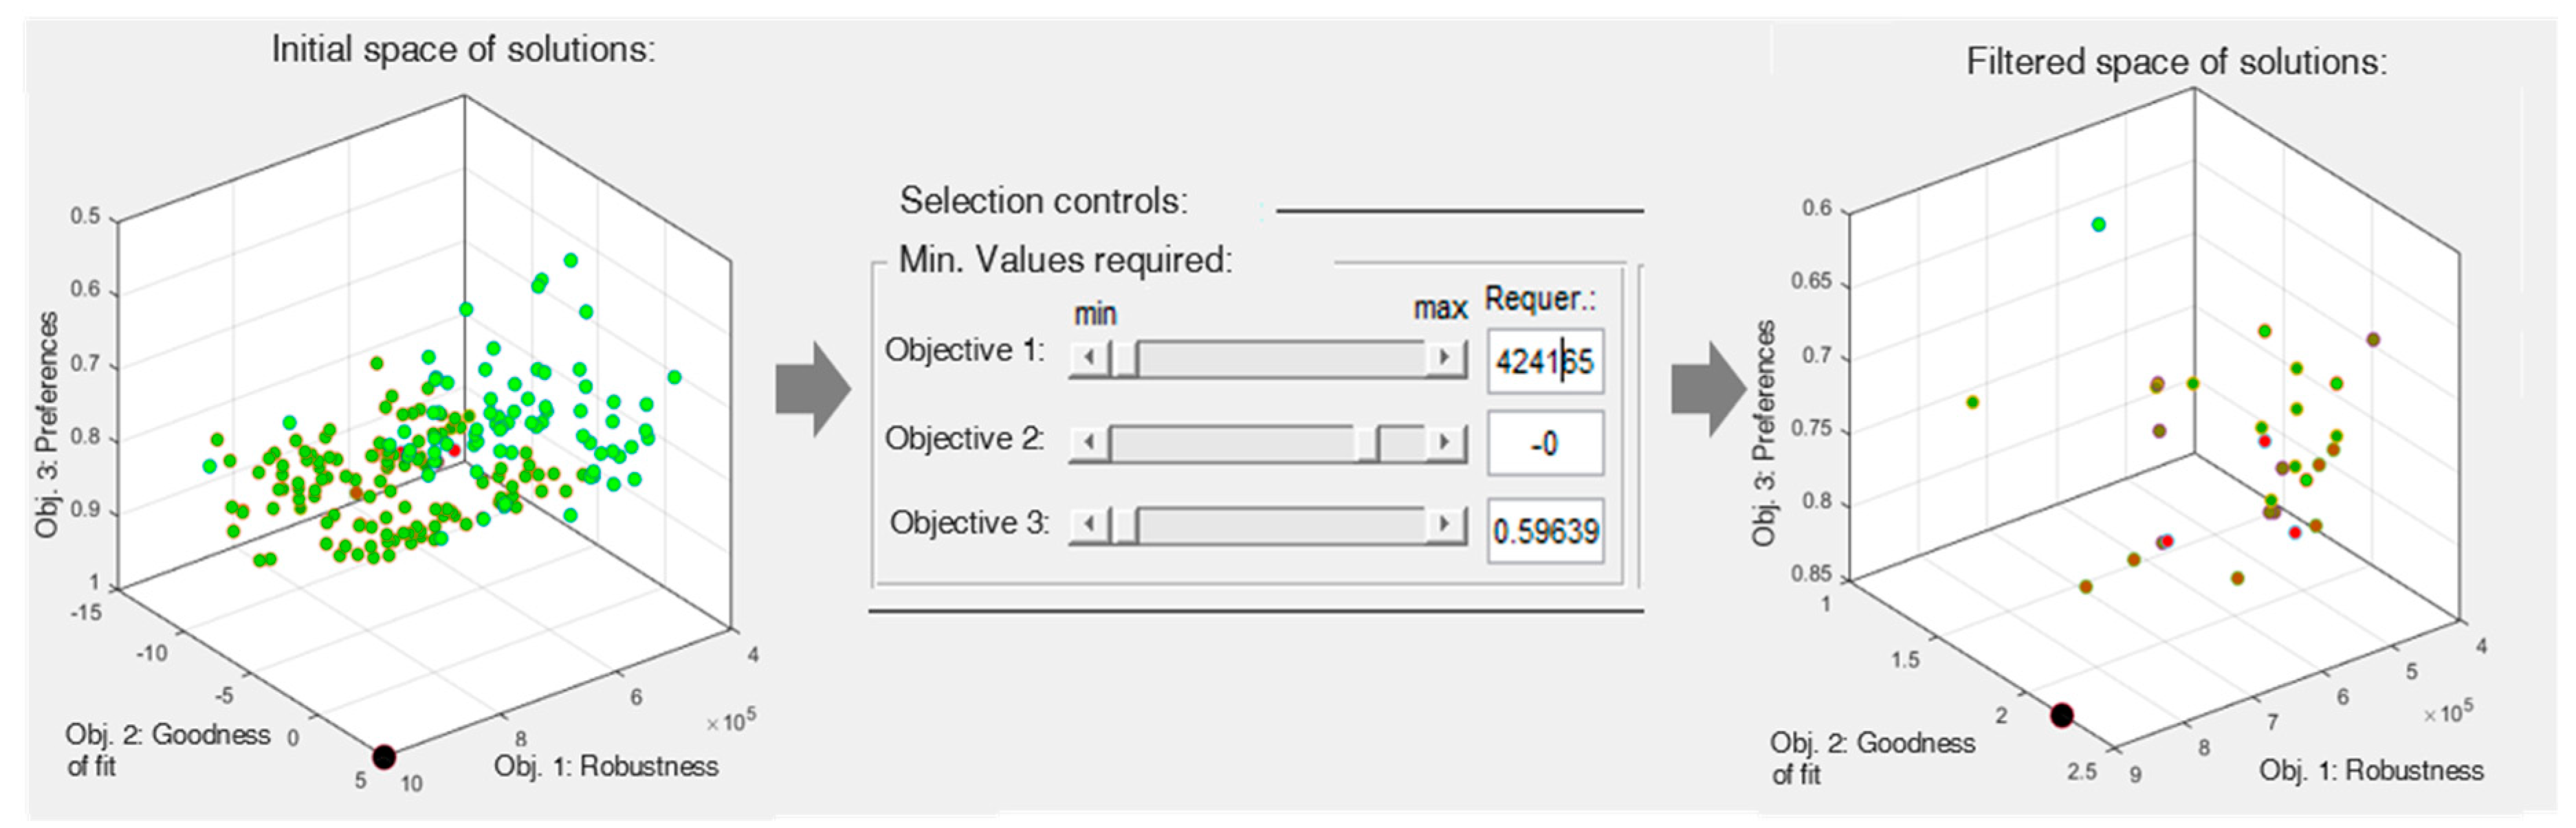
2.1.1. Visual Analytics
2.1.2. Cluster Analysis
2.2. Multi-Scale Urban Vulnerability Assessment
2.2.1. Urban Vulnerability Assessment Framework
- Unemployment rate. Percentage of unemployed individuals by all individuals currently in the labour force.
- Education index: Percentage of illiterate population and without education.
- Housing index: Percentage of population living in dwellings without bathroom or water closet within the dwelling.
2.2.2. Identification of the Multi-Scale Effect of Urban Vulnerability
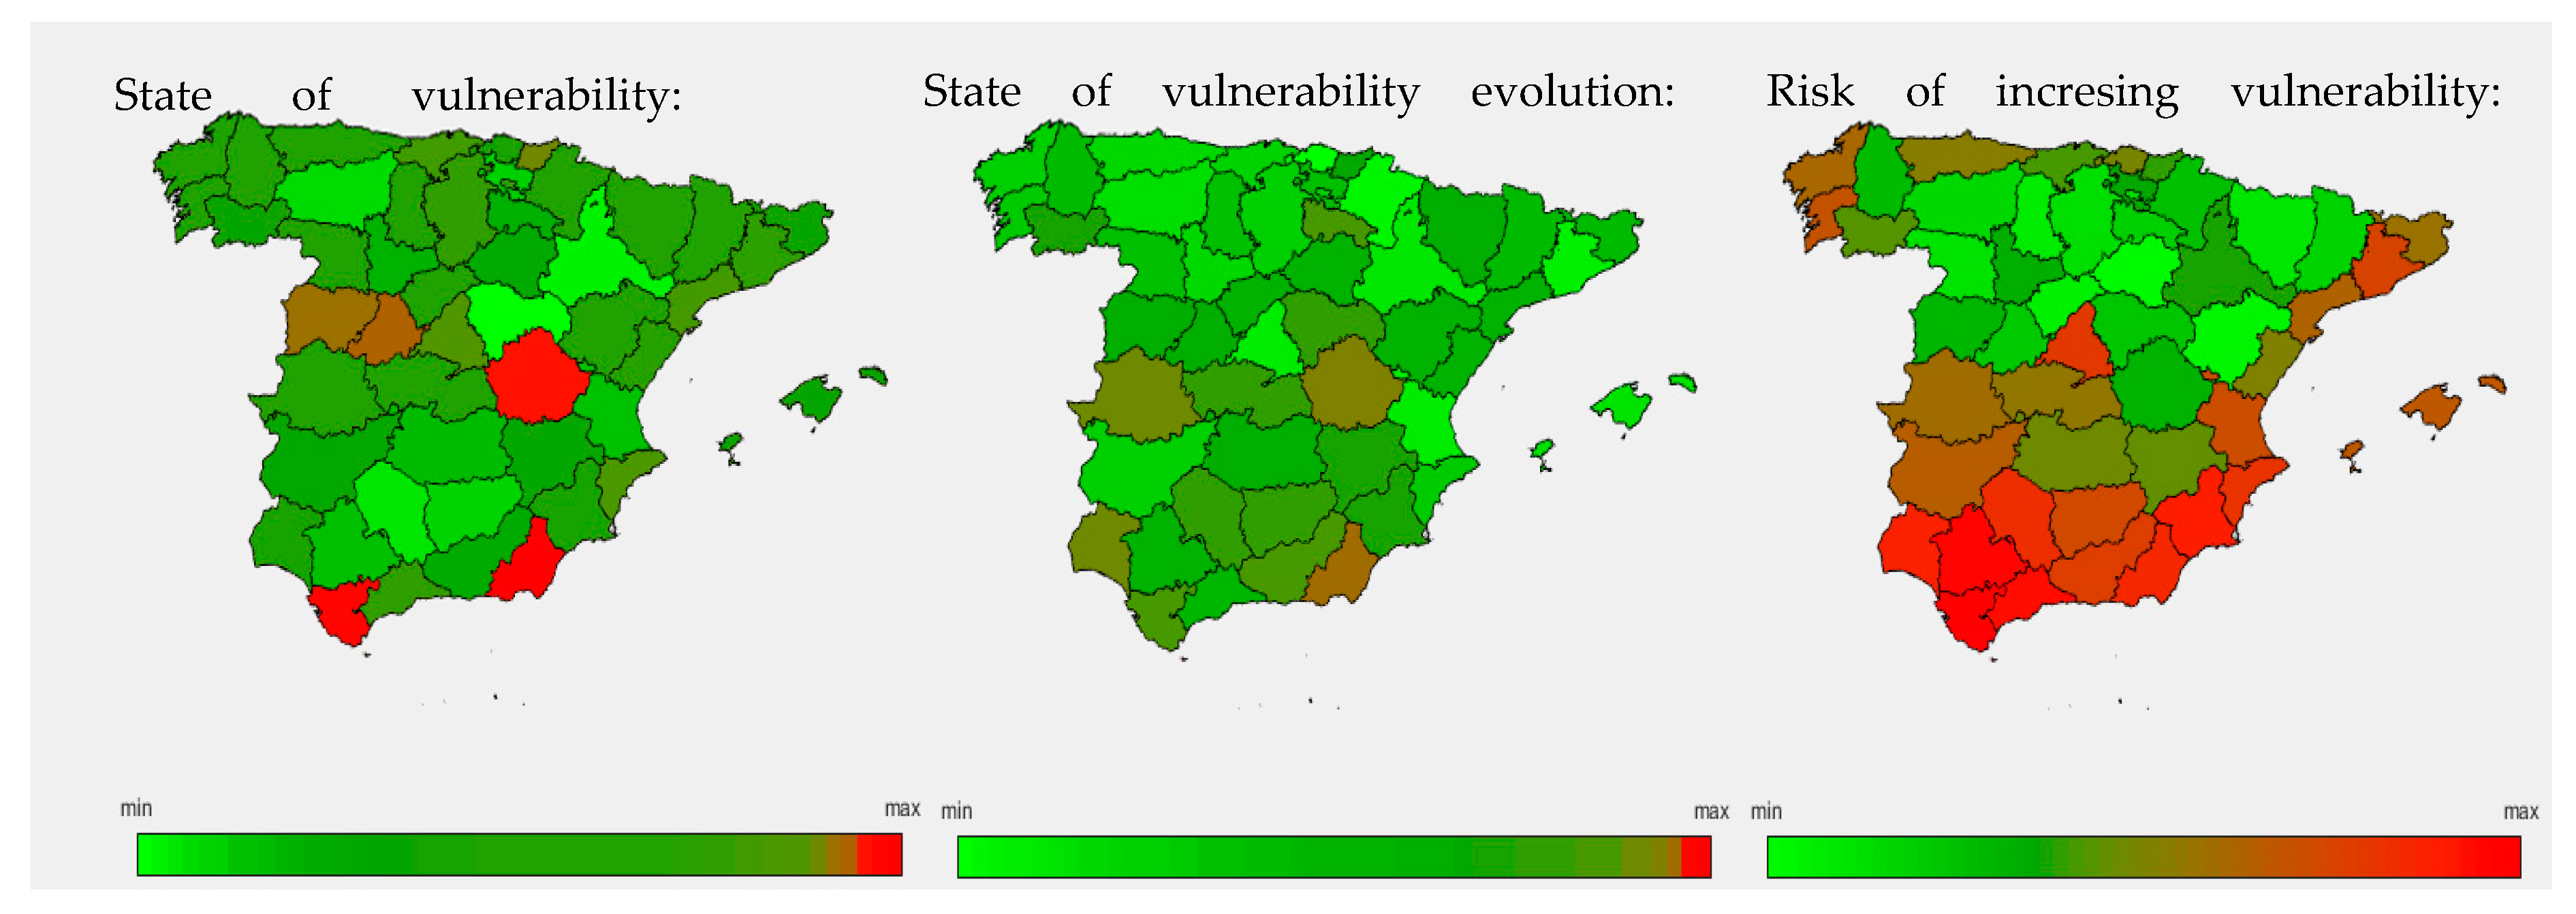
- SVij is the state of vulnerability of the j entity at i scale with j ∈ (1, …, n), and i ∈ (1, …, m), where n is the number of entities at i scale, and m is the number of scales in the territory assessed.
- SVEij is the state of vulnerability’s evolution of the j entity at i scale
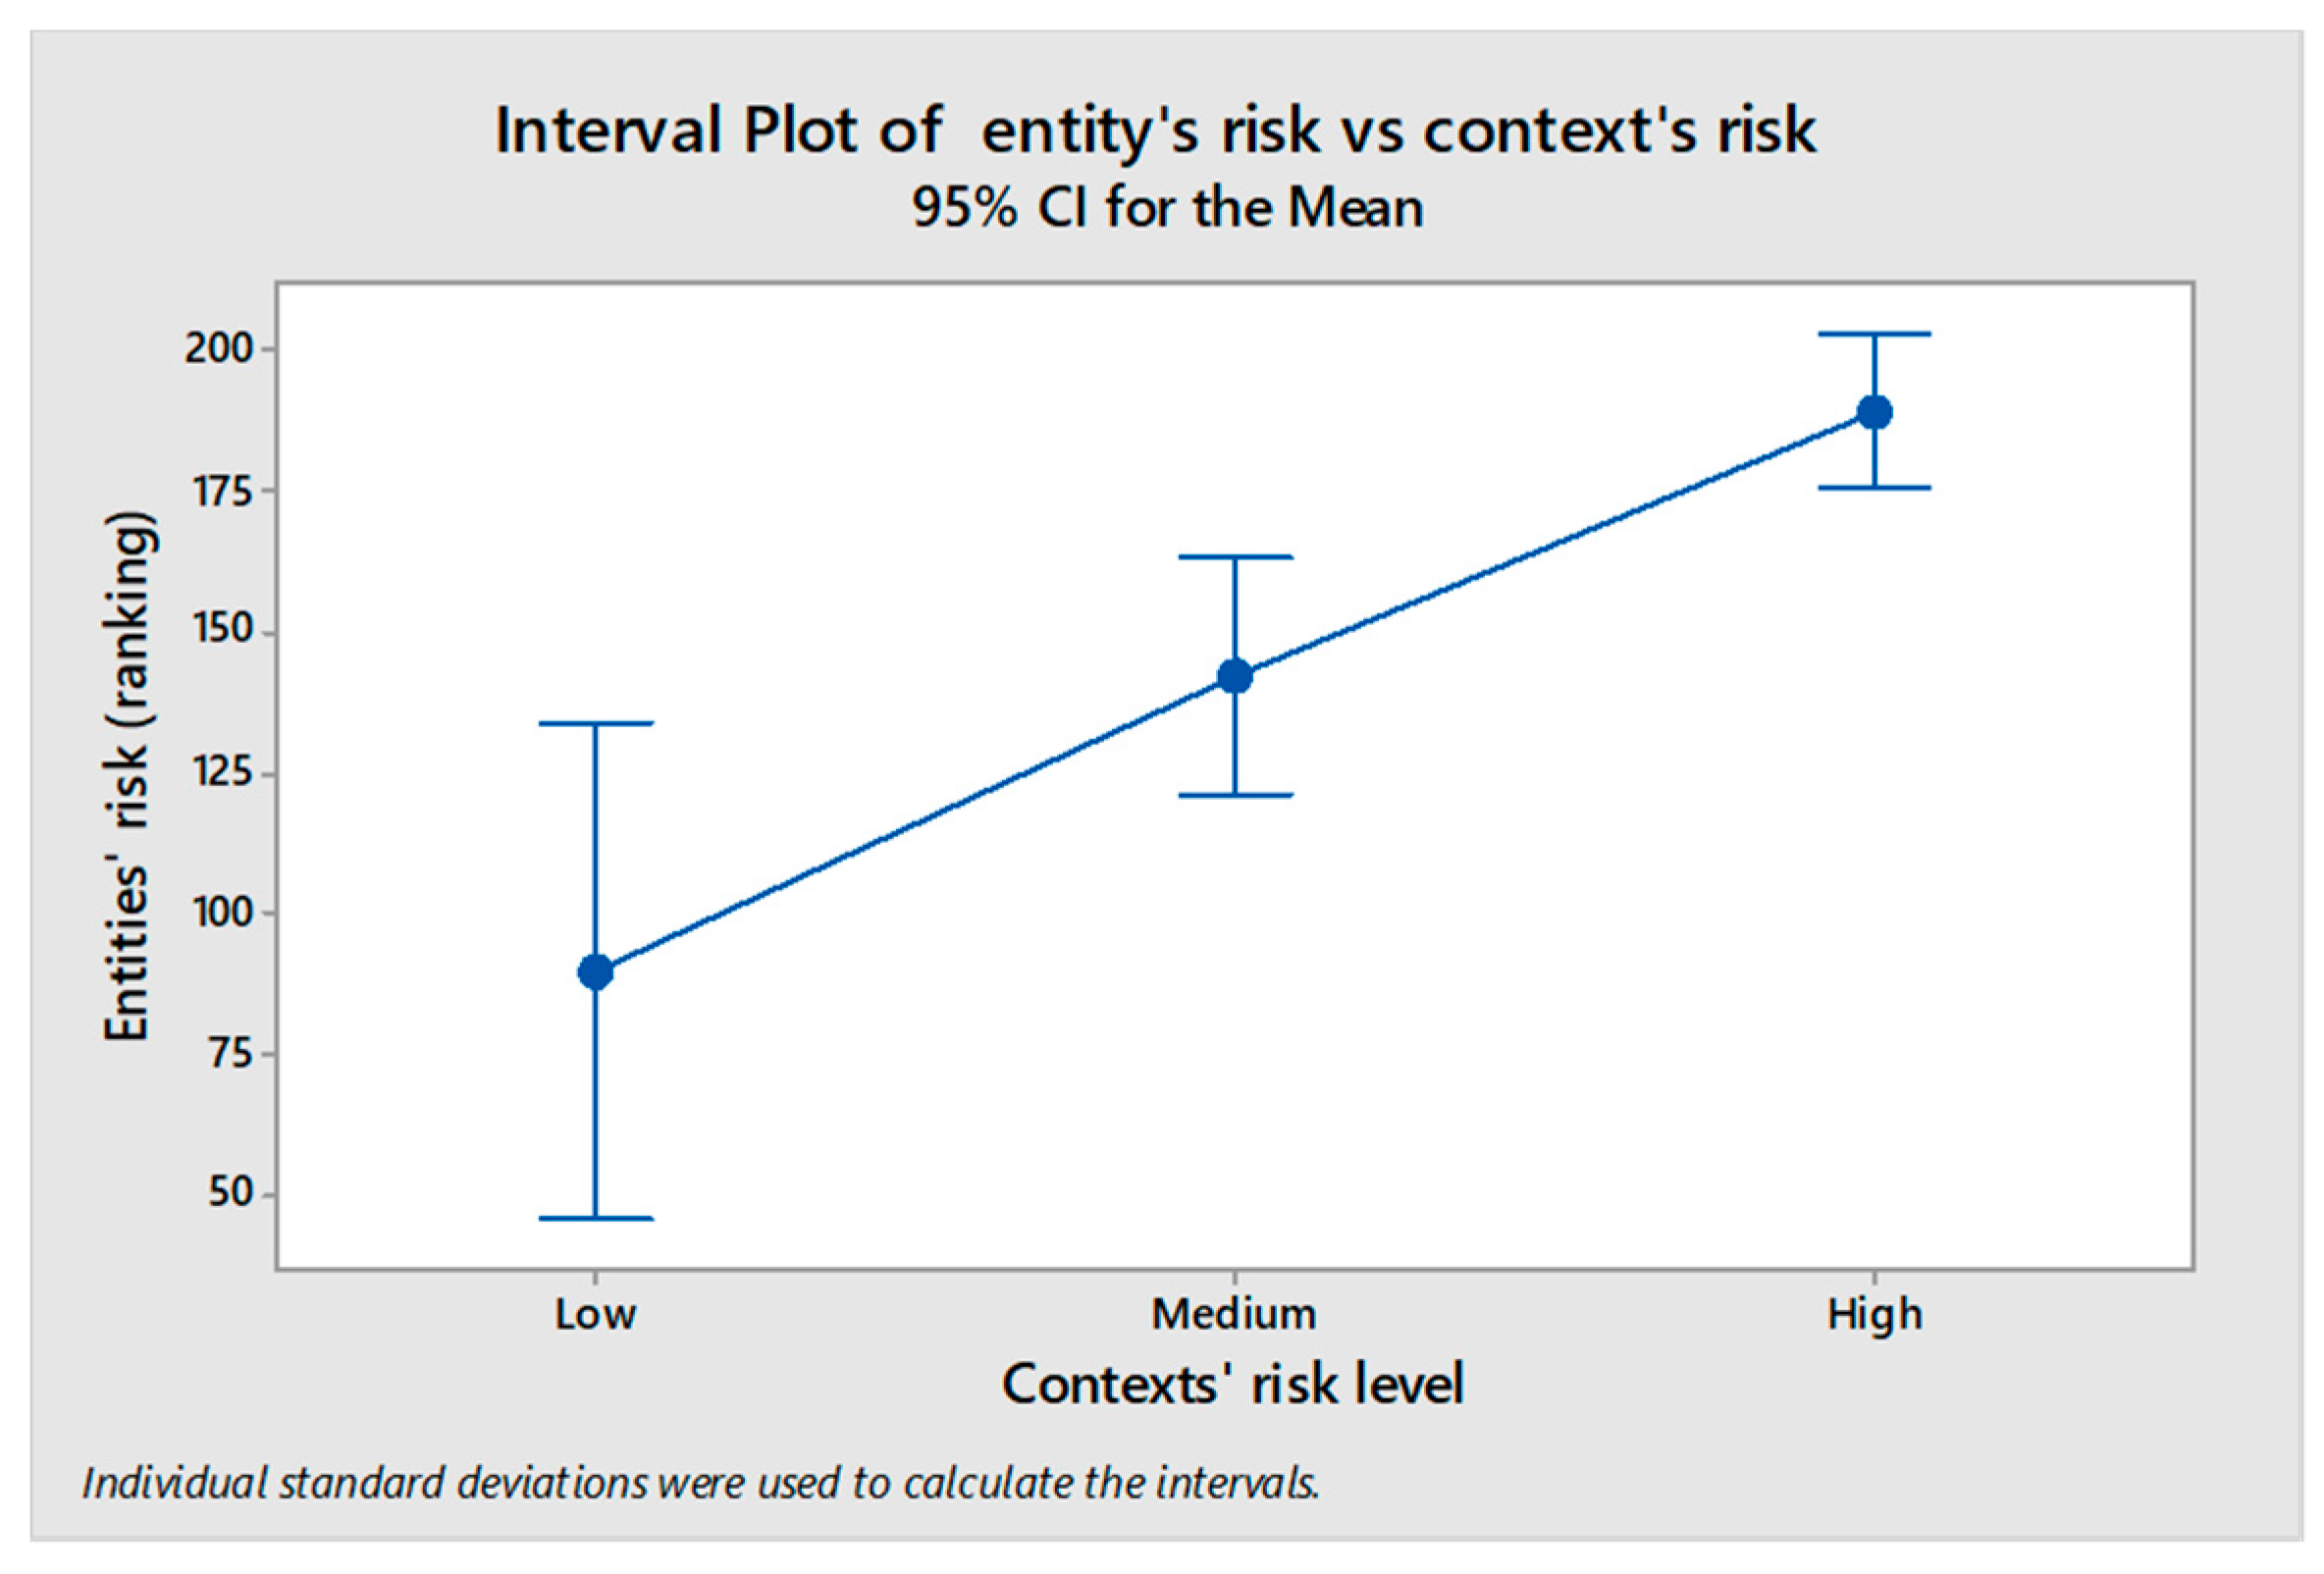
- CRLij represents the context’s risk level of the j entity at i scale, which would be low (CRL-Low), medium (CRL-Medium), or high (CRL-High) depending on whether the corresponding entity at the upper scale’s position was in the first, second, or last third of the risk rank at the upper scale.
3. Case Study: Assessing Urban Vulnerability in Spain
3.1. Information Collection Process
3.1.1. Quantitative Information
3.1.2. Qualitative Information
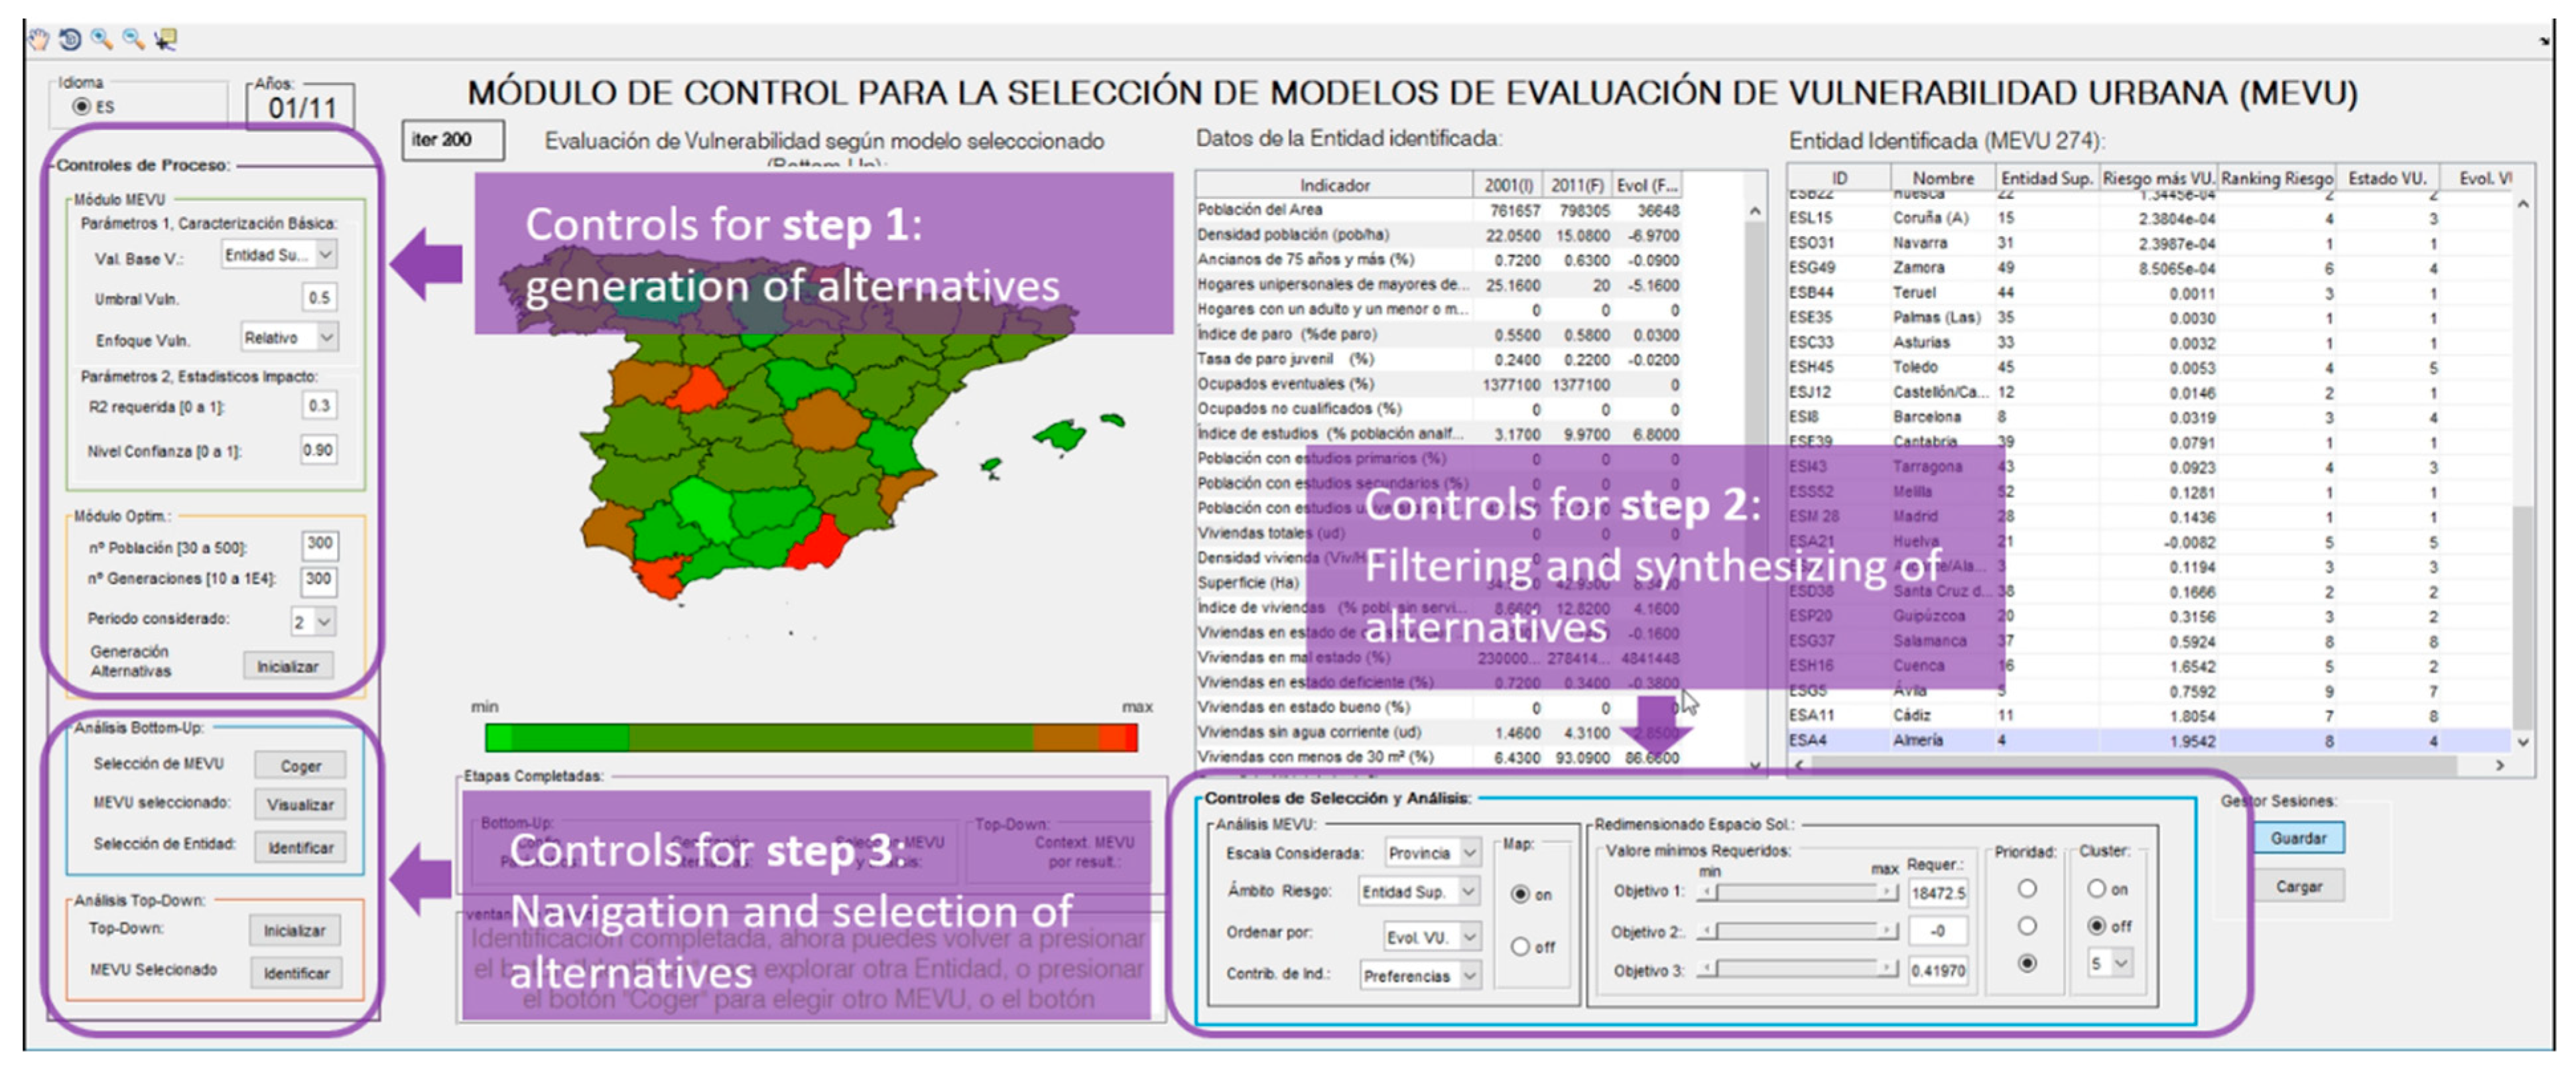
3.2. Running of the Process
- ■
- Value taken as a base of vulnerability
- ■
- Vulnerability threshold
- ■
- Vulnerability Approach
4. Results and Discussion
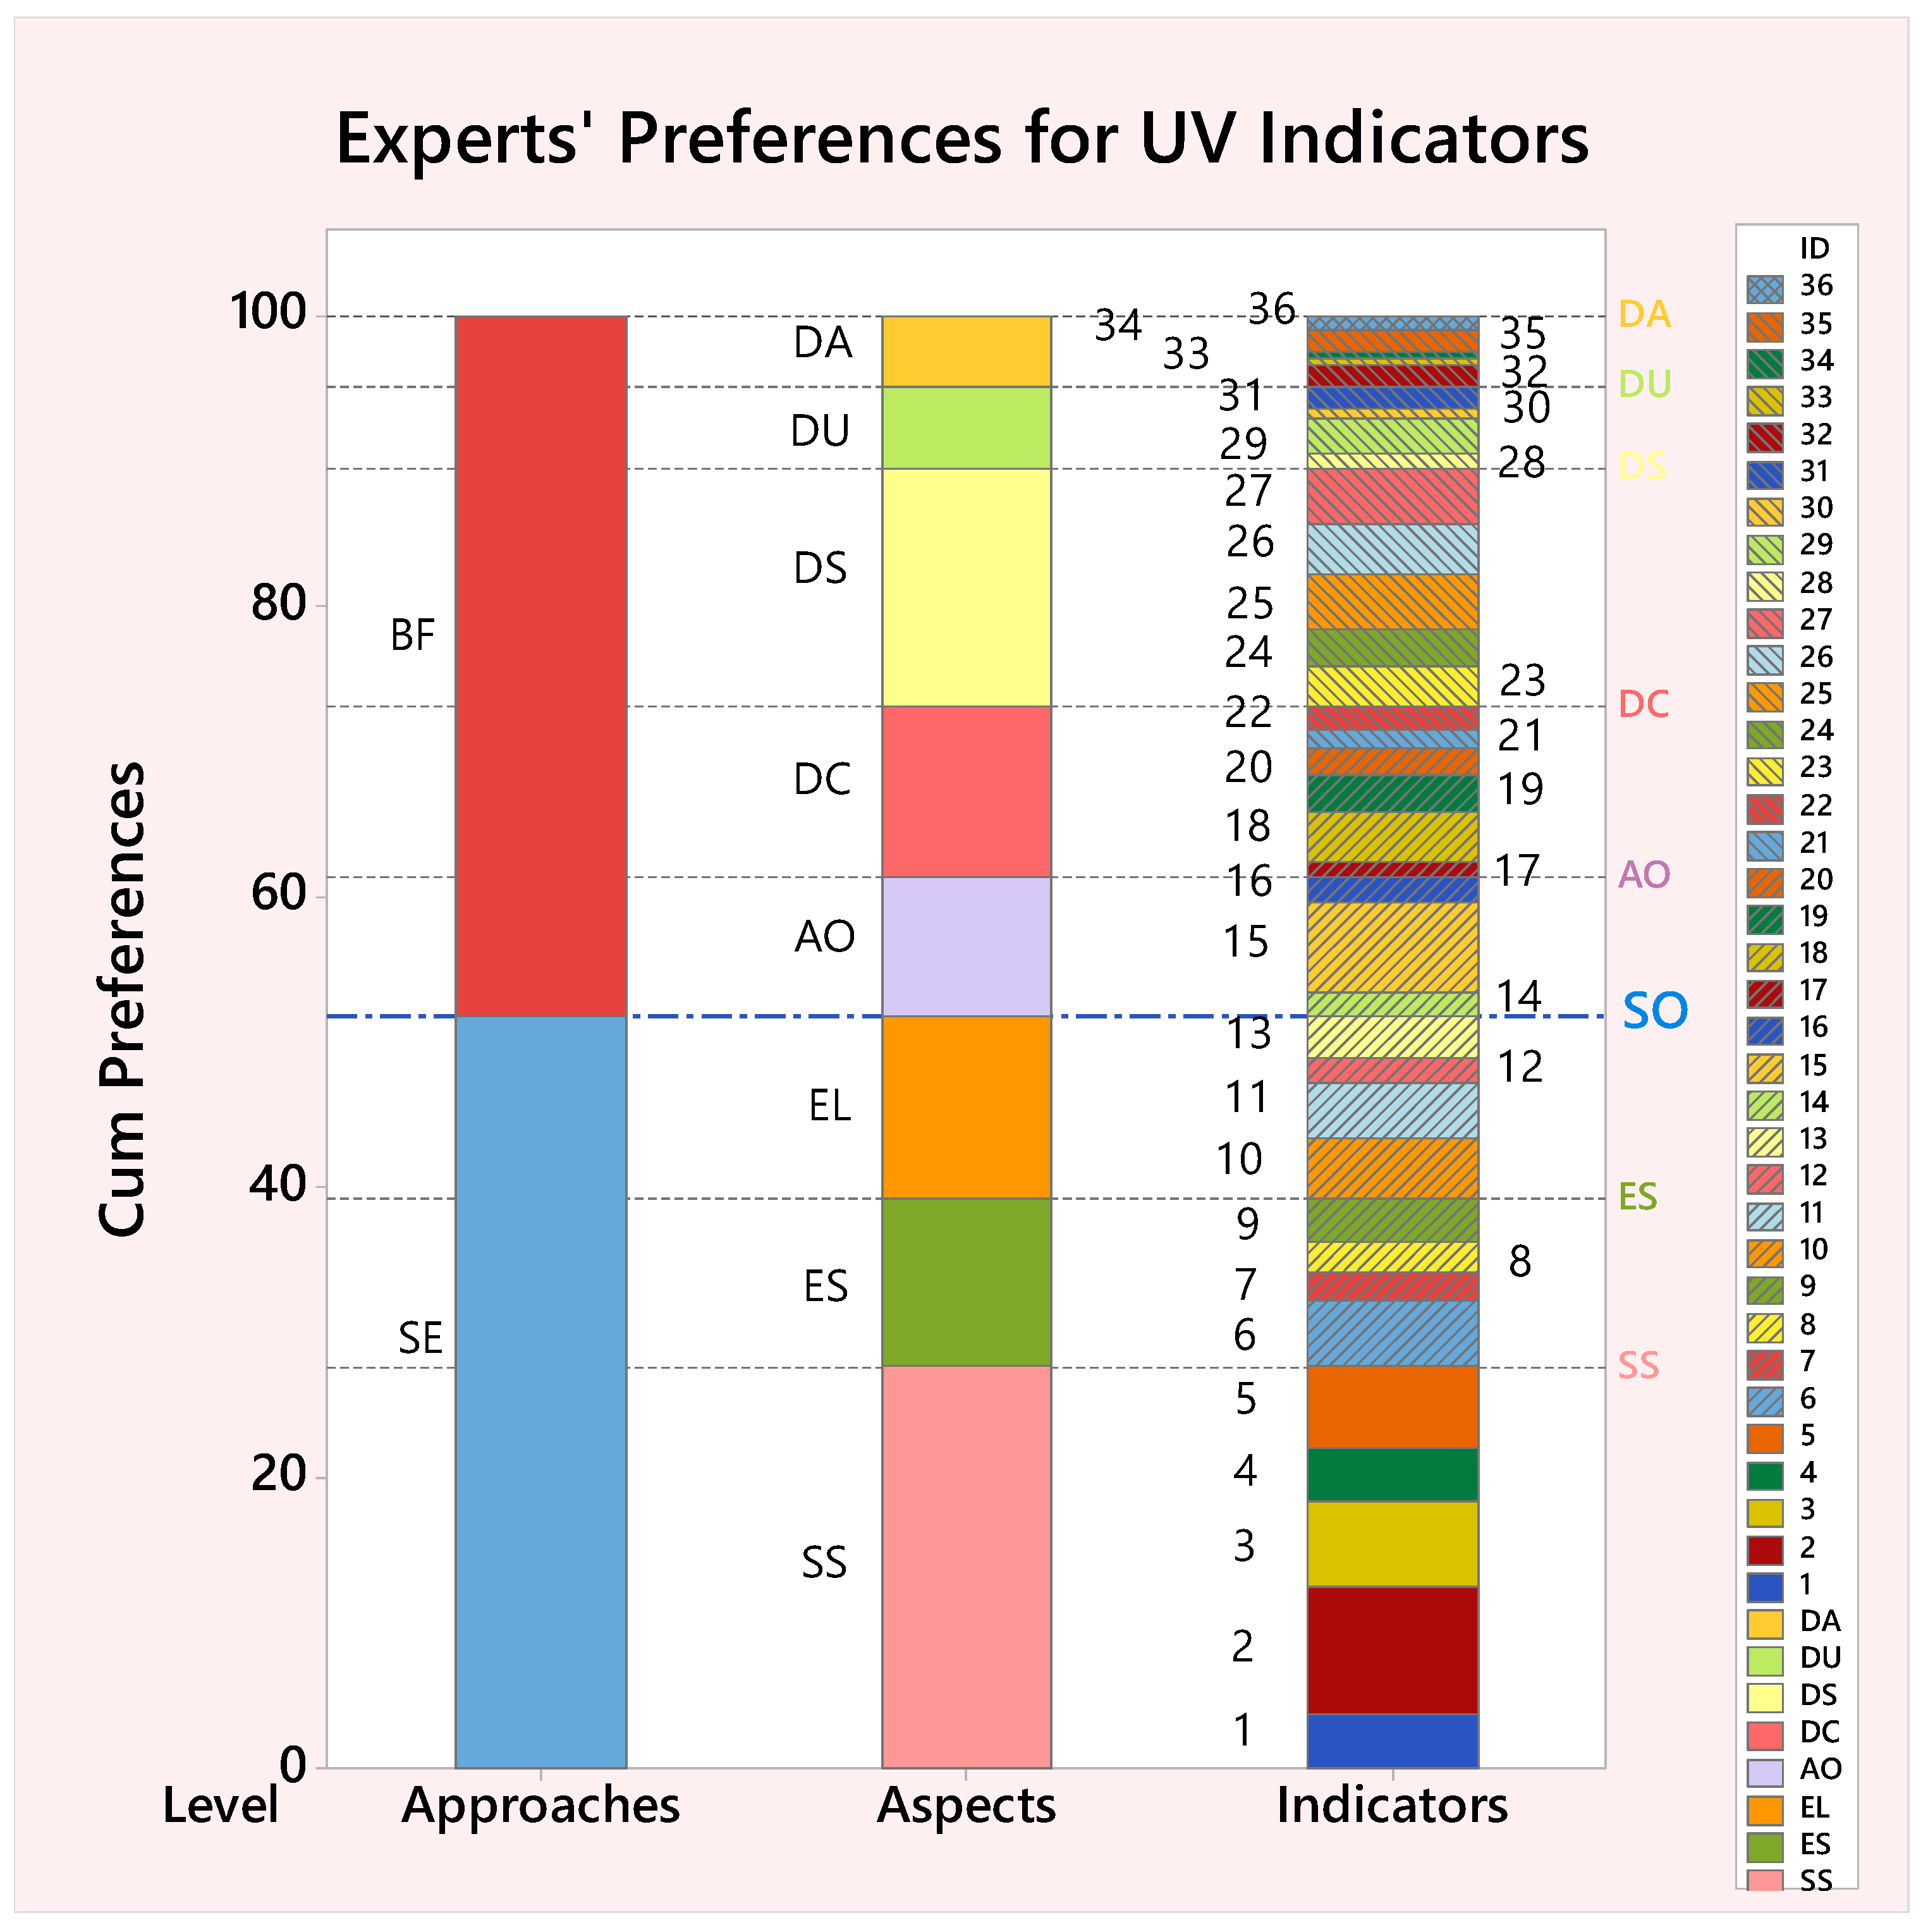
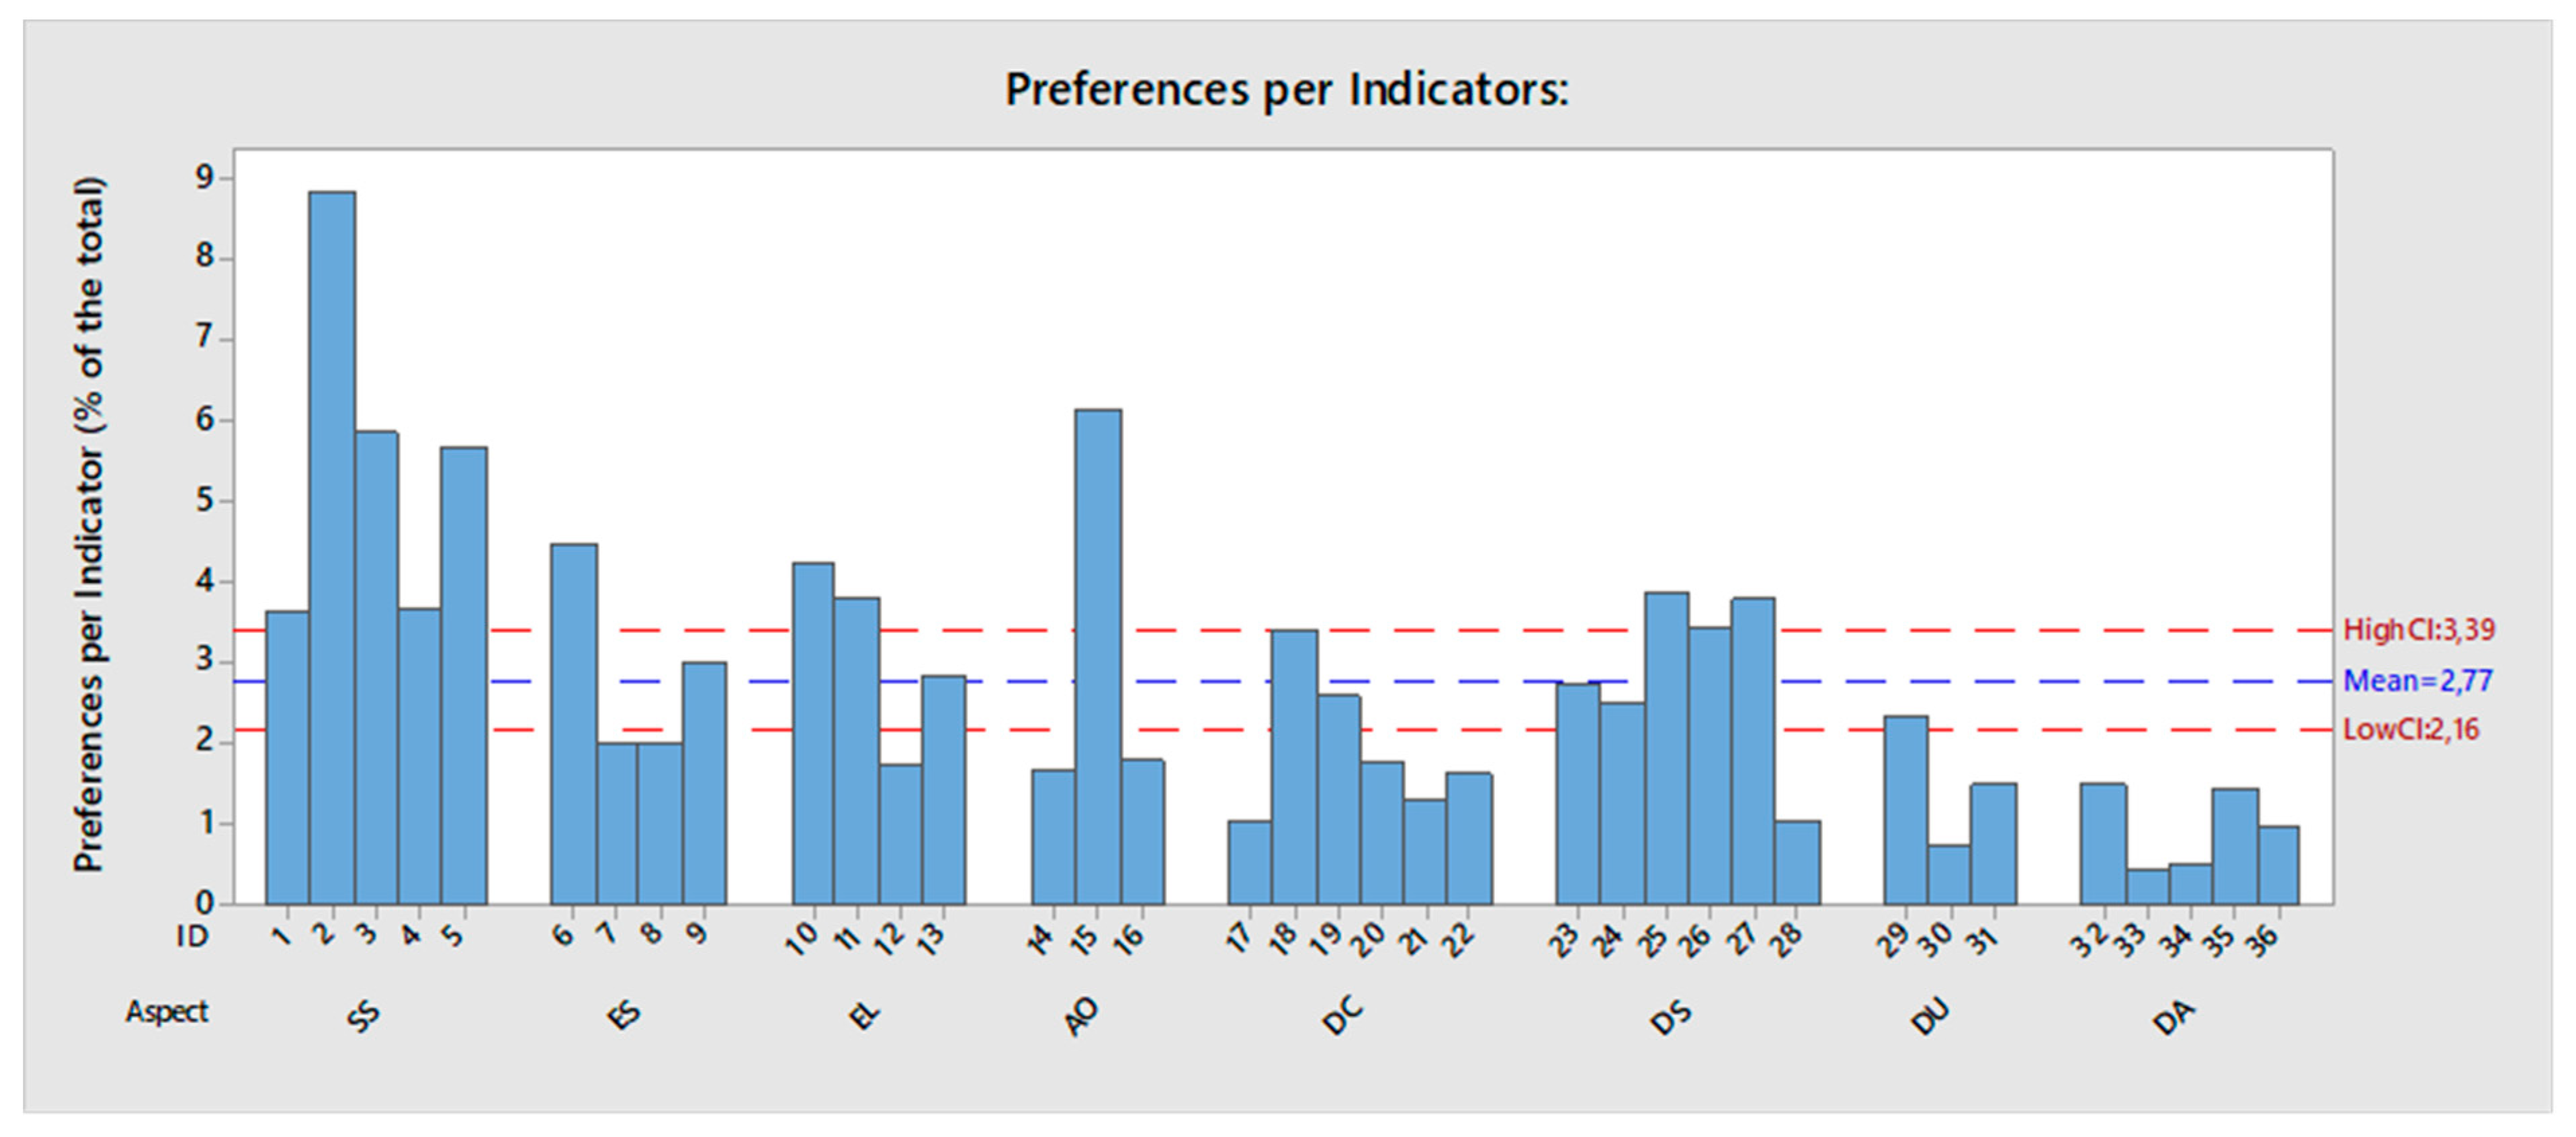
4.1. Evaluation of Expert’s Relative Preferences
4.2. Urban Vulnerability Assessment
4.2.1. Curse of Dimensionality
4.2.2. Results of the Assessment and Identification of Multi-Scale Context’s Effect
5. Discussion
5.1. Results of Expert Judgment
5.2. Results Yielded by the VisualUVAM Tool
6. Conclusions and Further Research
Supplementary Materials
Author Contributions
Funding
Acknowledgments
Conflicts of Interest
References
- Rigillo, M.; Cervelli, E. Mapping Urban Vulnerability: The Case Study of Gran Santo Domingo, Dominican Republic. Adv. Eng. Forum 2014, 11, 142–148. [Google Scholar] [CrossRef]
- Malekpour, S.; Brown, R.R.; de Haan, F.J. Strategic planning of urban infrastructure for environmental sustainability: Understanding the past to intervene for the future. Cities 2015, 46, 67–75. [Google Scholar] [CrossRef]
- Sierra, L.A.; Yepes, V.; García-Segura, T.; Pellicer, E. Bayesian network method for decision-making about the social sustainability of infrastructure projects. J. Clean. Prod. 2018, 176, 521–534. [Google Scholar] [CrossRef]
- Zhao, P.; Chapman, R.; Randal, E.; Howden-Chapman, P. Understanding resilient urban futures: A systemic modelling approach. Sustainability 2013, 5, 3202–3223. [Google Scholar] [CrossRef]
- Salas, J.; Yepes, V. Urban vulnerability assessment: Advances from the strategic planning outlook. J. Clean. Prod. 2018, 179, 544–558. [Google Scholar] [CrossRef]
- Moraci, F.; Errigo, M.F.; Fazia, C.; Burgio, G.; Foresta, S. Making less vulnerable cities: Resilience as a new paradigm of smart planning. Sustainability 2018, 10, 755. [Google Scholar] [CrossRef]
- Hurtado, S.D.G. Is EU urban policy transforming urban regeneration in Spain? Answers from an analysis of the Iniciativa Urbana (2007–2013). Cities 2017, 60, 402–414. [Google Scholar] [CrossRef]
- Salas, J.; Yepes, V. MS-ReRO and D-ROSE methods: Assessing relational uncertainty and evaluating scenarios’ risks and opportunities on multi-scale infrastructure systems. J. Clean. Prod. 2019, 216, 607–623. [Google Scholar] [CrossRef]
- Dor, A.; Kissinger, M. A multi-year, multi-scale analysis of urban sustainability. Environ. Impact Assess. Rev. 2017, 62, 115–121. [Google Scholar] [CrossRef]
- Rega, C.; Singer, J.P.; Geneletti, D. Investigating the substantive effectiveness of Strategic Environmental Assessment of urban planning: Evidence from Italy and Spain. Environ. Impact Assess. Rev. 2018, 73, 60–69. [Google Scholar] [CrossRef]
- Salas, J.; Yepes, V. A discursive, many-objective approach for selecting more-evolved urban vulnerability assessment models. J. Clean. Prod. 2018, 176, 1231–1244. [Google Scholar] [CrossRef]
- Penades-Pla, V.; Garcia-Segura, T.; Marti, J.V.; Yepes, V. A Review of Multi-Criteria Decision-Making Methods Applied to the Sustainable Bridge Design. Sustainability 2016, 8, 1295. [Google Scholar] [CrossRef]
- Zio, E.; Bazzo, R. A clustering procedure for reducing the number of representative solutions in the Pareto Front of multiobjective optimization problems. Eur. J. Oper. Res. 2011, 210, 624–634. [Google Scholar] [CrossRef]
- Ishibuchi, H.; Masuda, H.; Nojima, Y. Selecting a Small Number of Non-Dominated Solutions to be Presented to the Decision Maker. In Proceedings of the 2014 IEEE International Conference on Systems, Man and Cybernetics (SMC), San Diego, CA, USA, 5–8 October 2014. [Google Scholar]
- Ishibuchi, H.; Akedo, N.; Nojima, Y. Behavior of Multiobjective Evolutionary Algorithms on Many-Objective Knapsack Problems. IEEE Trans. Evolut. Comput. 2015, 19, 264–283. [Google Scholar] [CrossRef]
- Kukkonen, S.; Lampinen, J. Ranking-dominance and many-objective optimization. In Proceedings of the 2007 IEEE Congress on Evolutionary Computation, Singapore, 25–28 September 2007. [Google Scholar]
- Kukkonen, S.; Deb, K. A fast and effective method for pruning of non-dominated solutions in many-objective problems. Lecture Notes in Computer Science (Including Subseries Lecture Notes in Artificial Intelligence and Lecture Notes in Bioinformatics). 2006. Available online: https://www.scopus.com/inward/record.uri?eid=2-s2.0-33750253049&partnerID=40&md5=f46109796025a884fd054d73e71c308e (accessed on 9 November 2018).
- Taboada, H.A.; Baheranwala, F.; Coit, D.W.; Wattanapongsakorn, N. Practical solutions for multi-objective optimization: An application to system reliability design problems. Reliab. Eng. Syst. Saf. 2007, 92, 314–322. [Google Scholar] [CrossRef]
- Kasprzyk, J.R.; Nataraj, S.; Reed, P.M.; Lempert, R.J. Many objective robust decision making for complex environmental systems undergoing change. Environ. Model. Softw. 2013, 42, 55–71. [Google Scholar] [CrossRef]
- Inselberg, A. Multidimensional detective. In Proceedings of the IEEE Symposium on Information Visualization, Phoenix, AZ, USA, 20–21 October 1997; pp. 100–107. Available online: https://www.scopus.com/inward/record.uri?eid=2-s2.0-0031332043&partnerID=40&md5=fab4a0dd73a75f7f1ac61fd6492cee9b (accessed on 9 November 2018).
- Adger, W.N. Resilience, Vulnerability, and Adaptation: A Cross-Cutting Theme of the International Human Dimensions Programme on Global Environmental Change. Glob. Environ. Change 2006, 16, 268–281. [Google Scholar] [CrossRef]
- Lempert, R.J. A new decision sciences for complex systems. 2002. Available online: http://people.physics.anu.edu.au/~tas110/Teaching/Lectures/L1/Material/Lempert02.pdf (accessed on 11 April 2019).
- Thomas, J.; Kielman, J. Challenges for visual analytics. Inf. Vis. 2009, 8, 309–314. [Google Scholar] [CrossRef]
- Andrienko, G.; Andrienko, N.; Demsar, U.; Dransch, D.; Dykes, J.; Fabrikant, S.I.; Tominski, C. Space, time and visual analytics. Int. J. Geogr. Inf. Sci. 2010, 24, 1577–1600. [Google Scholar] [CrossRef]
- Santos, J.; Ferreira, A.; Flintsch, G. A multi-objective optimization-based pavement management decision-support system for enhancing pavement sustainability. J. Clean. Prod. 2017, 164, 1380–1393. [Google Scholar] [CrossRef]
- Observatorio de Vulnerabilidad Urbana. Análisis urbanístico de barrios vulnerables. 2010. Available online: https://www.fomento.gob.es/MFOM/LANG_CASTELLANO/DIRECCIONES_GENERALES/ARQ_VIVIENDA/SUELO_Y_POLITICAS/OBSERVATORIO/Analisis_urba_Barrios_Vulnerables/Informes_CCAA.htm (accessed on 26 August 2015).
- Birkmann, J.; Garschagen, M.; Setiadi, N. New challenges for adaptive urban governance in highly dynamic environments: Revisiting planning systems and tools for adaptive and strategic planning. Urban Clim. 2014, 7, 115–133. [Google Scholar] [CrossRef]
- Besagni, G.; Borgarello, M. The socio-demographic and geographical dimensions of fuel poverty in Italy. Energy Res. Soc. Sci. 2019, 49, 192–203. [Google Scholar] [CrossRef]
- Khalil, N.; Kamaruzzaman, S.N.; Baharum, M.R. Ranking the indicators of building performance and the users’ risk via Analytical Hierarchy Process (AHP): Case of Malaysia. Ecol. Indic. 2016, 71, 567–576. [Google Scholar] [CrossRef]
- Pellicer, E.; Sierra, L.A.; Yepes, V. Appraisal of infrastructure sustainability by graduate students using an active-learning method. J. Clean. Prod. 2016, 113, 884–896. [Google Scholar] [CrossRef]
- Sierra, L.A.; Yepes, V.; Pellicer, E. A review of multi-criteria assessment of the social sustainability of infrastructures. J. Clean. Prod. 2018, 187, 496–513. [Google Scholar] [CrossRef]
- Saaty, T.L. How to make a decision—The analytic hierarchy process. Eur. J. Oper. Res. 1990, 48, 9–26. [Google Scholar] [CrossRef]
- Singh, R.P.; Nachtnebel, H.P. Analytical hierarchy process (AHP) application for reinforcement of hydropower strategy in Nepal. Renew. Sustain. Energy Rev. 2016, 55, 43–58. [Google Scholar] [CrossRef]


| Approach | Imp | Aspects | Imp | Indicators | ||||
|---|---|---|---|---|---|---|---|---|
| ID | Description | Importance | Rank | OUV’s Importance | ||||
| Socio-Economic (SE) Aspects | 51.81 | Social Structure (SS) | 27.68 | 1 | Area Population | 3.64 | 11 | 0 |
| 2 | Population density (pop/ha) | 8.84 | 1 | 0 | ||||
| 3 | Eder 75 years or more (%) | 5.85 | 3 | 0 | ||||
| 4 | Households of one person older than 64 years (%) | 3.68 | 10 | 0 | ||||
| 5 | Households of one adult and at least one minor (%) | 5.67 | 4 | 0 | ||||
| Economic Strucure (ES) | 11.49 | 6 | Unemployment rate (%) | 4.47 | 5 | 33 | ||
| 7 | Youth unemployment rate (%) | 1.99 | 21 | 0 | ||||
| 8 | Temporary employee (%) | 2.02 | 20 | 0 | ||||
| 9 | Unqualified workers (%) | 3 | 14 | 0 | ||||
| Educational level (EL) | 12.64 | 10 | Population uneducated (%) | 4.24 | 6 | 33 | ||
| 11 | Population with primary education (%) | 3.8 | 8 | 0 | ||||
| 12 | Population with secondary education (%) | 1.75 | 24 | 0 | ||||
| 13 | Population with higher education (%) | 2.85 | 15 | 0 | ||||
| Bio-Physical (BF) Aspects | 48.19 | Area Occupation (AO) | 9.6 | 14 | Number of dwellings(u) | 1.65 | 25 | 0 |
| 15 | Dwellings density (u/Ha) | 6.15 | 2 | 0 | ||||
| 16 | Area (Ha) | 1.8 | 22 | 0 | ||||
| Dwellings Condition (DC) | 11.75 | 17 | Dwellings rate (% Population with no WC in the dwelling) | 1.05 | 31 | 33 | ||
| 18 | Dwellings in ruin condition (%) | 3.4 | 13 | 0 | ||||
| 19 | Dwellings in bad condition (%) | 2.6 | 17 | 0 | ||||
| 20 | Dwellings in deficient condition (%) | 1.77 | 23 | 0 | ||||
| 21 | Dwellings in good condition (%) | 1.29 | 30 | 0 | ||||
| 22 | Dwellings without running water (%) | 1.64 | 26 | 0 | ||||
| Dwellings Size (DS) | 16.37 | 23 | Dwellings with less than 30 m2 (%) | 2.75 | 16 | 0 | ||
| 24 | Dwellings total usable surface (m2) | 2.5 | 18 | 0 | ||||
| 25 | Mean usable surface by dwelling (m2) | 3.88 | 7 | 0 | ||||
| 26 | Mean usable surface by habitant (m2) | 3.44 | 12 | 0 | ||||
| 27 | Number of rooms by dwelling (u/dwell) | 3.8 | 9 | 0 | ||||
| Dwellings Usage (DU) | 5.63 | 28 | Main Dwellings (u) | 1.05 | 32 | 0 | ||
| 29 | Empty Dwellings (u) | 2.34 | 19 | 0 | ||||
| 30 | Owned Dwellings (u) | 0.76 | 34 | 0 | ||||
| 31 | Rented Dwellings (u) | 1.48 | 28 | 0 | ||||
| Dwellings age (DA) | 4.84 | 32 | Dwellings in builds built before 1951 (%) | 1.49 | 27 | 0 | ||
| 33 | Total buildings (u) | 0.44 | 36 | 0 | ||||
| 34 | Buildings older than 30 years (u) | 0.51 | 35 | 0 | ||||
| 35 | Buildings older than 50 years (u) | 1.45 | 29 | 0 | ||||
| 36 | Buildings older than 80 years (u) | 0.96 | 33 | 0 | ||||
| ID | Province Name | Ranking | |||
|---|---|---|---|---|---|
| Risk | State | State Evolution | Context’s (*) Risk Level | ||
| 11 | Cádiz | 51 | 52 | 5 | 2 |
| 14 | Córdoba | 3 | 42 | 4 | 0 |
| 18 | Granada | 12 | 39 | 5 | 0 |
| 21 | Huelva | 21 | 44 | 8 | 1 |
| 23 | Jaén | 5 | 37 | 4 | 0 |
| 29 | Málaga | 39 | 48 | −1 | 2 |
| 4 | Almería | 52 | 43 | 14 | 2 |
| 41 | Sevilla | 8 | 50 | 0 | 0 |
| 22 | Huesca | 29 | 5 | 1 | 1 |
| 44 | Teruel | 33 | 2 | 0 | 1 |
| 50 | Zaragoza | 2 | 19 | −11 | 0 |
| 33 | Asturias | 35 | 27 | −8 | 2 |
| 38 | Santa Cruz de Tenerife | 46 | 47 | 4 | 2 |
| 7 | Balears | 16 | 34 | −10 | 0 |
| 35 | Palmas (Las) | 34 | 49 | 4 | 1 |
| 39 | Cantabria | 41 | 21 | −7 | 2 |
| 24 | León | 4 | 8 | −9 | 0 |
| 34 | Palencia | 25 | 4 | −3 | 1 |
| 37 | Salamanca | 48 | 15 | 1 | 2 |
| 40 | Segovia | 24 | 3 | 0 | 1 |
| 42 | Soria | 13 | 1 | 0 | 0 |
| 47 | Valladolid | 10 | 17 | −8 | 0 |
| 49 | Zamora | 32 | 6 | −3 | 1 |
| 5 | Ávila | 49 | 11 | 1 | 2 |
| 9 | Burgos | 40 | 7 | −6 | 2 |
| 13 | Ciudad Real | 9 | 24 | 1 | 0 |
| 16 | Cuenca | 50 | 16 | 10 | 2 |
| 19 | Guadalajara | 1 | 12 | 4 | 0 |
| 2 | Albacete | 15 | 23 | 3 | 0 |
| 45 | Toledo | 36 | 28 | 4 | 2 |
| 17 | Girona | 18 | 29 | −2 | 1 |
| 25 | Lleida | 26 | 9 | −2 | 1 |
| 43 | Tarragona | 42 | 32 | 0 | 2 |
| 8 | Barcelona | 38 | 38 | −13 | 2 |
| 12 | Castellón/Castelló | 37 | 26 | 0 | 2 |
| 3 | Alicante/Alacant | 43 | 41 | −5 | 2 |
| 46 | Valencia/València | 7 | 36 | −12 | 0 |
| 10 | Cáceres | 27 | 30 | 8 | 1 |
| 6 | Badajoz | 14 | 33 | −6 | 0 |
| 15 | Coruña (A) | 30 | 31 | −6 | 1 |
| 27 | Lugo | 23 | 14 | −2 | 1 |
| 32 | Ourense | 17 | 22 | 3 | 0 |
| 36 | Pontevedra | 28 | 35 | −5 | 1 |
| 28 | Madrid | 45 | 40 | −12 | 2 |
| 30 | Murcia | 22 | 45 | 3 | 1 |
| 31 | Navarra | 31 | 13 | −14 | 1 |
| 1 | Álava | 6 | 18 | −3 | 0 |
| 20 | Guipúzcoa | 47 | 20 | 2 | 2 |
| 48 | Vizcaya | 20 | 25 | −16 | 1 |
| 26 | Rioja (La) | 11 | 10 | 5 | 0 |
| 51 | Ceuta | 19 | 51 | 36 | 1 |
| 52 | Melilla | 44 | 46 | 34 | 2 |
| Regression Model R-sq(adj): | 45.92% | |
|---|---|---|
| Predictors: | Coefficient | p-Value |
| SV | −18.85 | 0.033 |
| SVE | 102.07 | 0 |
| CRL: | ||
| Low–Medium | 13.1 | 0.552 |
| High | 133.8 | 0 |
© 2019 by the authors. Licensee MDPI, Basel, Switzerland. This article is an open access article distributed under the terms and conditions of the Creative Commons Attribution (CC BY) license (http://creativecommons.org/licenses/by/4.0/).
Share and Cite
Salas, J.; Yepes, V. VisualUVAM: A Decision Support System Addressing the Curse of Dimensionality for the Multi-Scale Assessment of Urban Vulnerability in Spain. Sustainability 2019, 11, 2191. https://doi.org/10.3390/su11082191
Salas J, Yepes V. VisualUVAM: A Decision Support System Addressing the Curse of Dimensionality for the Multi-Scale Assessment of Urban Vulnerability in Spain. Sustainability. 2019; 11(8):2191. https://doi.org/10.3390/su11082191
Chicago/Turabian StyleSalas, Jorge, and Víctor Yepes. 2019. "VisualUVAM: A Decision Support System Addressing the Curse of Dimensionality for the Multi-Scale Assessment of Urban Vulnerability in Spain" Sustainability 11, no. 8: 2191. https://doi.org/10.3390/su11082191
APA StyleSalas, J., & Yepes, V. (2019). VisualUVAM: A Decision Support System Addressing the Curse of Dimensionality for the Multi-Scale Assessment of Urban Vulnerability in Spain. Sustainability, 11(8), 2191. https://doi.org/10.3390/su11082191