1. Introduction
Information communication technology (ICT) plays a vital role in enhancing educational resources for higher educational institutions (HEI) in moving towards the smart classroom where interaction between faculty and students takes place via digital devices rather than face-to-face or traditional ways of learning. Learning is always a challenge in a monotonous environment for students as well as for teachers, particularly where the conventional/traditional teaching methods are involved. The preservation of students by the HEI is significant for the growth of an educational institution. In addition, HEI aims for students to achieve better grades, better graduation rates, and minimize dropout ratio or transfers to other institutions. More importantly, student success contributes to the institute’s progress and ranking.
Students may be engaged in research and inquiry being either a participant or audience member. The approach is classified as emphasizing either research content or research process and problems. The ways of engaging students with research and inquiry are not independent [
1]. The analysis of the learning behaviours of students on the platform is related to the teaching design that the teacher plans [
2]. This can be achieved by using blended learning where online tools or technologies are linked with the traditional way of teaching [
3,
4,
5,
6,
7].
By using a learning environment (blended learning), which can be suitable to increase both the experience and confidence level of the students. Learning management systems (LMS) have been very effectively used in teaching-learning processes, especially in HEI [
8]. Due to the increased number of modules and moving towards blended learning especially flip teaching where the material is provided to students before the commencement of the class. This allows students to have interactive, collaborative and flexible learning both inside and outside the classroom using LMS, where learning can take place at anytime and anywhere. In HEIs students leave a huge amount of data footprints from the systems such as the student information system (SIS) and LMS. Dynamic technology tools can support active learning process for learning. Visual learners, aural/auditory learners, read/write learners, and kinesthetic/tactile learners (VARK) technique has comprehensively been used in teaching [
9,
10,
11]. Furthermore, a student’s performance can be improved with the use of blended learning accompanied by video/multimedia streaming which can notably boost the student understanding level [
12].
Video/multimedia streaming is an emerging field in education due to ubiquitous devices and smartphone culture among the students. Also, streaming content can cater the VARK learners with the help of dynamic tools. The ICT initiative not only covers information resources for educators, providing a framework but also provide means of self-motivation to study independently. It has a major contribution in enhancing additional access to educational materials and by facilitating learning in new ways that emphasize not only knowledge, values and actions but creates an opportunity for inquiry, innovation service and lifelong learning. Flipped teaching pedagogy together with Moodle and streaming servers enables multimedia course delivery and also archiving of the materials [
12].
Understanding the impact of student’s behaviour on educational outcomes infers from a single aspect of the data to a combination of other related data. For this purpose, time series forecasting is best suitable, based on the result collected over successive time periods (historical data) which exhibits a persistent module trend. For forecasting, we collected the results of three modules from Fall 2014–Spring 2018 and establish which model gives the most accurate result in order to help the faculty. In time series forecasting accuracy criteria has been utilized to measure the results performance.
Middle East College (MEC) is one of the leading and private higher education institutions (HEIs) in the Sultanate of Oman having nearly 6000 students. It is dedicated to educating students and equipping them with the values for quality, diversity, transparency, respect, commitment towards knowledge and life skills required to enrich their lives and enable them to meaningfully contribute to the progress of society. MEC offers undergraduate and postgraduate programs in the various disciplines of engineering, business and technology [
3,
4,
13].
The challenge the college faces is when the Moodle, ICT system becomes bottlenecked due to the faculty posting videos on the LMS. The College does not have the repository on its own for later usage. Having a video streaming server not only eases the use of Moodle but also has its own repository for later usage. With the use of blended learning initiatives taken by the college, it is hard to predict student success, which can be helpful for faculty to improve their method of teaching. Predicting future semester’s results based on historical data using time series analysis and forecasting can give faculty and administration the early signs of improvement within the module in order to satisfy the needs of the students.
The contribution of this paper is twofold: (1) To suggest a framework conducive to a blended learning environment using a video streaming server; (2) A novel quantitative model is proposed to predict module performance before the class commencement of classes within the semester. The medium of the analysis is applied to the blended learning pedagogy using an in-house video streaming server. The proposed model provides an opportunity for the faculty and administration to adopt or change their teaching style in minimizing the student’s failure rate. The objective of this research is to propose a framework conducive for a blended learning environment using a video streaming server. Also, to predict future module results based on historical data using time series analysis and forecasting.
This paper is organized as follows:
Section 2 presents an overview of the literature and related works in this particular field.
Section 3 presents the research methodology used for the framework and future result forecasting.
Section 4 presents the proposed approach used in the study.
Section 5 shows the performance evaluation.
Section 6 draws a conclusion and proposes future research.
2. Literature Review and Related Works
Universities around the globe are using learning analytics (LA) to enhance student experience and interactions between faculty and students. They are trying to learn the behaviours and interactions of students are on virtual learning environments (VLE) and predict their results. As well, they are trying to increase the retention rate and focus on high-risk students to excel in the course. An early alert system for faculty to engage with the students is in place in order to improvise and intervene in any problems faced by the students. There is a gap as most of the systems rely on only LMS, Internet gives an edge to its users for practising learning, by doing, this gives an advent for video-based learning technologies which are practised and applied in a variety of ways like a flipped classroom or blended learning. Students often face doubts in their learning; to clear their doubts they refer to multiple sources like khanacademy (Mountain View, California), coursera (Mountain View, California), edX, Lynda (Carpinteria, California, United States), youtube (Google, San Bruno, California, United States) etc. These videos provide complete skill sets, the student uses these resources to solve their specific problems in a short time. The faculty are not aware of the predicted outcome of the course before the commencement of the classes this can help them to know the course expected result, which can be combined with the cohort interactions leading to improved activities and engagement.
It also encourages the concept of the Education 4.0 concept, for the engineering fields offered within the college. Laboratory tasks and tutorials made as a video tutorial which enables students to better understand the concept not only in the session but beyond the session. This empowers the students to make their entry to the automated controlled world. This will create individuals not only be part of the industry but as an industry as a whole connecting global economic and social development [
14,
15].
Existing systems operational in different educational institutions mainly depend on the student’s performance as well as on the interactions within the module. The role of faculty is to monitor the student’s behaviour and involvement within the module. With the use of technology, faculty can predict the student’s performance. There is a gap, as faculty is unaware of the module behaviour or trend from previous semesters. Additionally, the faculty has to adjust an effective teaching style and methods in the module according to the students learning level. This will be helpful in order to maintain the overall results in the module based on the learning within the module, thus it cannot be made as a final outcome because it will only show the recent trends of the result, not the actual result. Below are the systems that are applied in different institutions to capture the student’s performance.
Purdue University Indiana USA uses ‘traffic light’ indicators showing students at high risk. Combining business intelligence to enhance student success the data is used from SIS, virtual learning environment (VLE) and the grade book. Traffic lights aimed at the course level to increase retention and graduation rates helping students to see their progress early enabling them to seek help to get better grades or choose a different path. Here the problem can be identified as early as the second week of the semester. The system is evaluated using a student’s performance in terms of grades and behaviour captured through the VLE [
16].
Data reporting tool ‘Check My Activity’ showing student’s usage of their online activity among students showing weekly activity on the blackboard. The feedback mechanism is used to increase student motivation, awareness and performance [
17].
Educational data mining (EDM) is applied at New York Institute of Technology (NYIT) for the first year at-risk students. The system is to help counselling staff providing risk ratings for each new freshman using data from admission application, registration, placement test, survey and finance. The dashboard is used for visualization predicting to return to studies for the next year [
18].
California State University, Chico (Chico State University) correlates students’ achievement and LMS usage along with student’s characteristics. It points out that multiple variables can be used to accurately predict instead of using single variables for predicting student’s success [
19].
The Open Academic Analytics Initiative (OAAI) at Marist College USA uses an early alert system for high-risk students following Purdue’s model. They discovered that student’s success metrics are based on marks on the course obtained, grade point average (GPA) and current academic standing [
20].
The University of New England, New South Wales, Australia fused early alert system to identify students who are struggling and provide them with timely support. Mixing social media attributes to achieve a dynamic, systematic and automated process that would capture the learning wellbeing status of all status [
21].
The Open University in the UK uses strategic LA to enhance student success by embedding decision-making at all levels by using evidence from the historical data. Machine-learning-based predictive models on student’s behaviour and performance are updated on a weekly basis. Retention rate and funding are a major concern there along with part-time students being geographically scattered. Fusion of social media as the students are online learners, they describe the application as SocialLearn. Interactions and visualization are used to provide analytics to the learners for their likelihood of being able to pass the course or fail to submit the assignment etc. [
22,
23].
Nottingham Trent University uses the dashboard to enhance the student’s academic experience. The dashboard shows the engagement scores which is calculated from the VLE access, assignment submission, attendance, access to library and card swipes. The dashboard helps to build a better relationship between students and the faculty where the faculty is alerted when the student scores are dropped and faculty need to contact the student. This helped the university to extend the culture of data-driven decision-making [
24,
25].
The University of Wollongong, New South Wales, Australia uses Social Networks Adapting Pedagogical Practice (SNAPP). SNAPP visualizes and displays discussion board interactions through web browser plugin which is compatible with LMS. It uses discussion boards and focuses mainly on facilitator centric, social network analysis shows a common pattern and can be displayed on the dashboard. It facilitates real-time intervention and professional development and is used as a reflective teaching tool [
26,
27,
28].
Romero et al. [
29,
30] used classification and association techniques combined with an E-Learning system at Cordoba University. The study suggested different attributes such as course marks, assignment and quiz marks etc. for predicting final marks and association of Moodle online participation in discussion forums that uses clustering techniques. Nevertheless, the focus of the aforementioned study remains on the data collected from Moodle and the result of students within the duration of the module rather than the forecasted module result before the commencement of the classes.
Similarly, Amelia et al. [
31] used prediction on a web-based course and predicts the likelihood of passing a course based on the student’s work carried out in the system. The study suggested a genetic algorithm. However, the system predicts the student outcome on the basis of the e-activities performed by the students with the course of the module and it uses the logged data footprint recorded in the DRAL system, which limits the forecasting result as the logged data sometimes can have missing values or corrupted data. DRAL is a tool for discovering relevant e-activities for learners.
Giannakos et al. [
32,
33] used a visualization technique and video-assisted course to learn about the attitudes and learning outcome for the students. The study suggested a single group time series to identify the relationship. Here, the proposed study takes clickstream as inputs within the module and prediction was made based on the attitudes. This can be expensive as the forecasted value cannot be determined until the very last stage where the intervention can be made.
From the above discussion, it is evident that the prediction technique is widely used in predicting student’s performance. Classification is mostly used to relate the different parameters in student’s activity either online or offline mode of study. The related studies presented above suggest that student is the main stakeholder to analyze and predict their performance/behaviour within the duration of the course. Different from the above studies, this research reflects faculty as the main stakeholder and prediction of the course outcome before the commencement of the module using time series forecasting. Thus, giving faculty an ample amount of time to make remedial changes in teaching style, course content or activities to overcome any discrepancies identified by the forecasting, a video streaming server can be useful in order to plan activities. The reason for using time series forecasting for this study is to predict the future outcome of the module based on the underlying patterns of student’s behaviour from the historical data. Different internal and external settings required for the effectiveness of smart classroom and towards the efficacy of the learning experiences of the students. A single specific setting cannot be arbitrated as the effective mechanism in knowledge transfer, it can transform over a period of time depending upon the requirement. Faculty play a vital role in identifying and delivering knowledge at a satisfactory level.
3. Research Methods
This section outlines how data collection has been done, followed by analysis and the research paradigm. Furthermore, the ethical implications of the carried work, research timeline and theories that underpin the research plan.
Table 1 shows the research considerations used in the proposed study.
3.1. Research Strategy
The importance of qualitative research derives from its role in the investigation of the reasons and processes that lead to certain results. The quantitative research design is either descriptive or experimental. This research uses a hybrid/mix method of research methodology.
This research work is carried out in two phases. Phase one caters the first objective and phase two caters the second objective of the proposed study.
For phase one, the research is a case study in nature which attempts to answer the research question in favour of the framework conducive to a blended learning environment using a video streaming server. Hence, it is in qualitative in nature. To achieve the targeted objective, this research involves several sub optimal steps itemized below:
- (a)
Acquisition of problem statement from the stakeholders.
- (b)
Suggesting remedies to solve the problem.
- (c)
Implementation of the framework.
For phase two, this research is experimental in nature which will attempt to answer the research question in favour of predicting module performance before the class commencement within the semester. Hence, it is in quantitative in nature. To achieve the targeted objective, this research involves several sub optimal steps itemized below:
- (a)
Acquisition of data from SIS of college students, which has been carried out through communication and is particularly time consuming.
- (b)
Investigating the techniques and establishing a model based on predictive analysis.
- (c)
Evaluating the performance of the modules with the use of predictive analysis.
3.2. Research Philosophy and Approach
Research philosophy deals with the way the researcher gathers data, develops knowledge and the nature of that knowledge. Due to the nature of this research, it relies on objectivism, where the researcher can discover the reality within a certain realm of probability. This research adopts interpretivist which is a form of a qualitative method involving both observation and interviews. Epistemology allows to discuss the direction in which hypotheses are developed and truths are shown, this approach can either be deductive or inductive. Inductive reasoning makes broad generalizations from the observations as compared to deductive approach it logically entails the conclusion, at least assuming that no mistake has been made in the reasoning. This research follows both inductive and deductive reasoning. This inquiry comes after the inductive research approach: A framework conducive to a blended learning environment using a video streaming server. Subsequently, the research conforms to the deductive research approach: A quantitative model is proposed to predict module performance before the class commencement of classes within the semester. These would be direct results of the deductive method, a defining characteristic of quantitative inquiry.
3.3. Sampling
The modules chosen for the study were considered based on theoretical and practical aspects giving a wider range in the forecasting. E-Commerce Technologies aim is to equip the student with a basis for advising an organization on the technical feasibility of its e-commerce strategy. The module will familiarize the student with the e-commerce oriented aspects of internet technology. This will be done by studying a combination of theoretical and practical elements that are associated with the implementation of e-commerce technology. Software Engineering aims to give students an overview of the software development process and of the software engineering processes it involves. It will introduce both traditional methodologies that emerged over the years as software became increasingly complex, and new agile methods aimed at handling the speed of development now demanded by business and industry. The module will also give students a basic understanding of a range of tools and techniques used at different stages of the development process. Network Administration introduces the concepts of network administration. Students will also gain implementation and management skills through practical work carried out in the module.
The sampling method chosen for this study is a non-probabilistic method of sampling. This method was selected mainly due to the convenience or research limitations as non-probabilistic methods do not rely on random choice. The study follows a judgmental sample from the expert (Network Administrator and IT Support personnel) to identify the problem within the network when videos are used in a module using Moodle. The three mini case study approach is used to model the prediction based on a quantitative forecasting model. The study includes only three modules, as it has a more complete set of data and many students take part in the courses. Data from 903 students were selected for developing the forecasting prediction model, taking the course E-Commerce Technologies, Software Engineering and Network Administration from Fall 2014 to Spring 2018 semesters. Their historic data were fetched through SIS and analyzed through prediction quantitative forecasting methods.
3.4. Research Purpose
Firstly, this research is an exploratory investigation where a situation or problem is not clearly defined. Though several attempts have been made for statistical performance data of students within the module. This research aims to help achieve the challenges and problems in this area and suggest further research for improvement. This study is aimed at a case study to analyse the behaviour of the module in a native environment. Due to the nature of this research and situation requires the use of real setting for improving research accuracy, providing a better framework which will be conducive for blended learning.
Secondly, research also has a descriptive nature, which examines the current situation in the field of educational data mining. Data analysis and interpretation of results are critical to a quantitative study such as this, making it a descriptive study.
3.5. Data Collection and Analysis
The interview has been carried out with the Network Administrator and the IT Support personnel to identify the problems faced by the college in their network. The interview has been conducted in a less structured or informal manner giving more immersion, reflection and a forming hypothesis to fit the data. The observation that drawn from these interviews are as follows:
The first observation is that when the videos are uploaded by faculty on Moodle, access creates more bandwidth utilization. The second observation is that the videos lag making more buffering and waiting time for the students. The third observation is the accessibility issue on Moodle which takes more loading time making more load on the server.
Historical data has been extracted through SIS on the selected modules from the dataset. These research contacts indirectly throughout the research process. This study uses mono-method design as it is more suitable for the study having both qualitative and quantitative methods. In the development of the prediction model, historical data on the modules at the end of the semesters are obtained via SIS.
3.6. Time Horizon
This research employs a longitudinal time horizon in contrast to cross-sectional. This is essential for this research as it allows analyzing the problems faced by the college within their network and student’s performance at the end of the semester in a real setting throughout time. Cross-sectional will limit the continuous observation of the improvement of the blended learning environment and also the resulting outcome of the modules.
3.7. Secondary Data
For conducting the experiment and building the predictive forecasting analysis, primary data are critical in every aspect. The need for secondary data cannot be overlooked for this research which involves various sources such as interviews, observations, journals, records, articles or case studies, which comprised the initial theoretical underpinning of this research. This consists of research into theoretical models, prediction, quantitative forecasting methods. These have been the starting point of how technology plays an important role in the learning process. Using prediction, and quantitative forecasting methods to predict the outcome of a module, helps the study to have more concrete inference. Secondary data have advantages such as easy access, which is especially important for low cost studies. The study used existing mixed learning environments, e-learning tools, prediction techniques and other models to predict the academic performance of a module.
3.8. Data Analysis
In the parliamentary procedure, data analysis will be directed to confirm or inform research hypotheses on the basis of a predictive analysis model in line with the objectives. The hypothesis is to suggest a framework conducive to a blended learning environment using a video streaming server and predict module performance before the class commencement within the semester. In the first set of simulation results obtained from the server bandwidth utilization and server load management metrics will be compared giving insights for the efficacy of a streaming server against Moodle. In the second set of simulation results, we will evaluate the accuracy of the predicted results with actual results obtained in the module.
3.9. Research Limitations
Firstly, significant limitation lies in the experiment sampling approach, lack of data diversity, cultural variety and geographical locations. A broader spectrum could have been used to test the underpinning theories across the whole college and among the universities within and outside of the Sultanate of Oman. This was not possible, however, because of the restrictions on access to data and the budget for this research. These can also be investigated further in future research.
Secondly, one aspect that further needed to be explored is how the predictability varies across different modules and the student behaviour in their academic achievement, as the main focus of this research revolves around the module outcome only.
Lastly, an assumption is made that maintaining learner engagement with the system will be the sole responsibility of the instructor. It is also understood that students are not prevented from accessing the technologies, content, experience offered by the system and their connectivity is not a problem either at the college level or at home.
4. Proposed Approach
This section discusses the approach undertaken to achieve the objectives. It is comprised of two phases. First, to identify the problems faced by the college and providing a solution feasible according to the college requirements. Second, using predictive forecasting modelling enabling as early detection for the faculty in order to enhance the teaching and learning process.
4.1. Video Streaming Server Framework
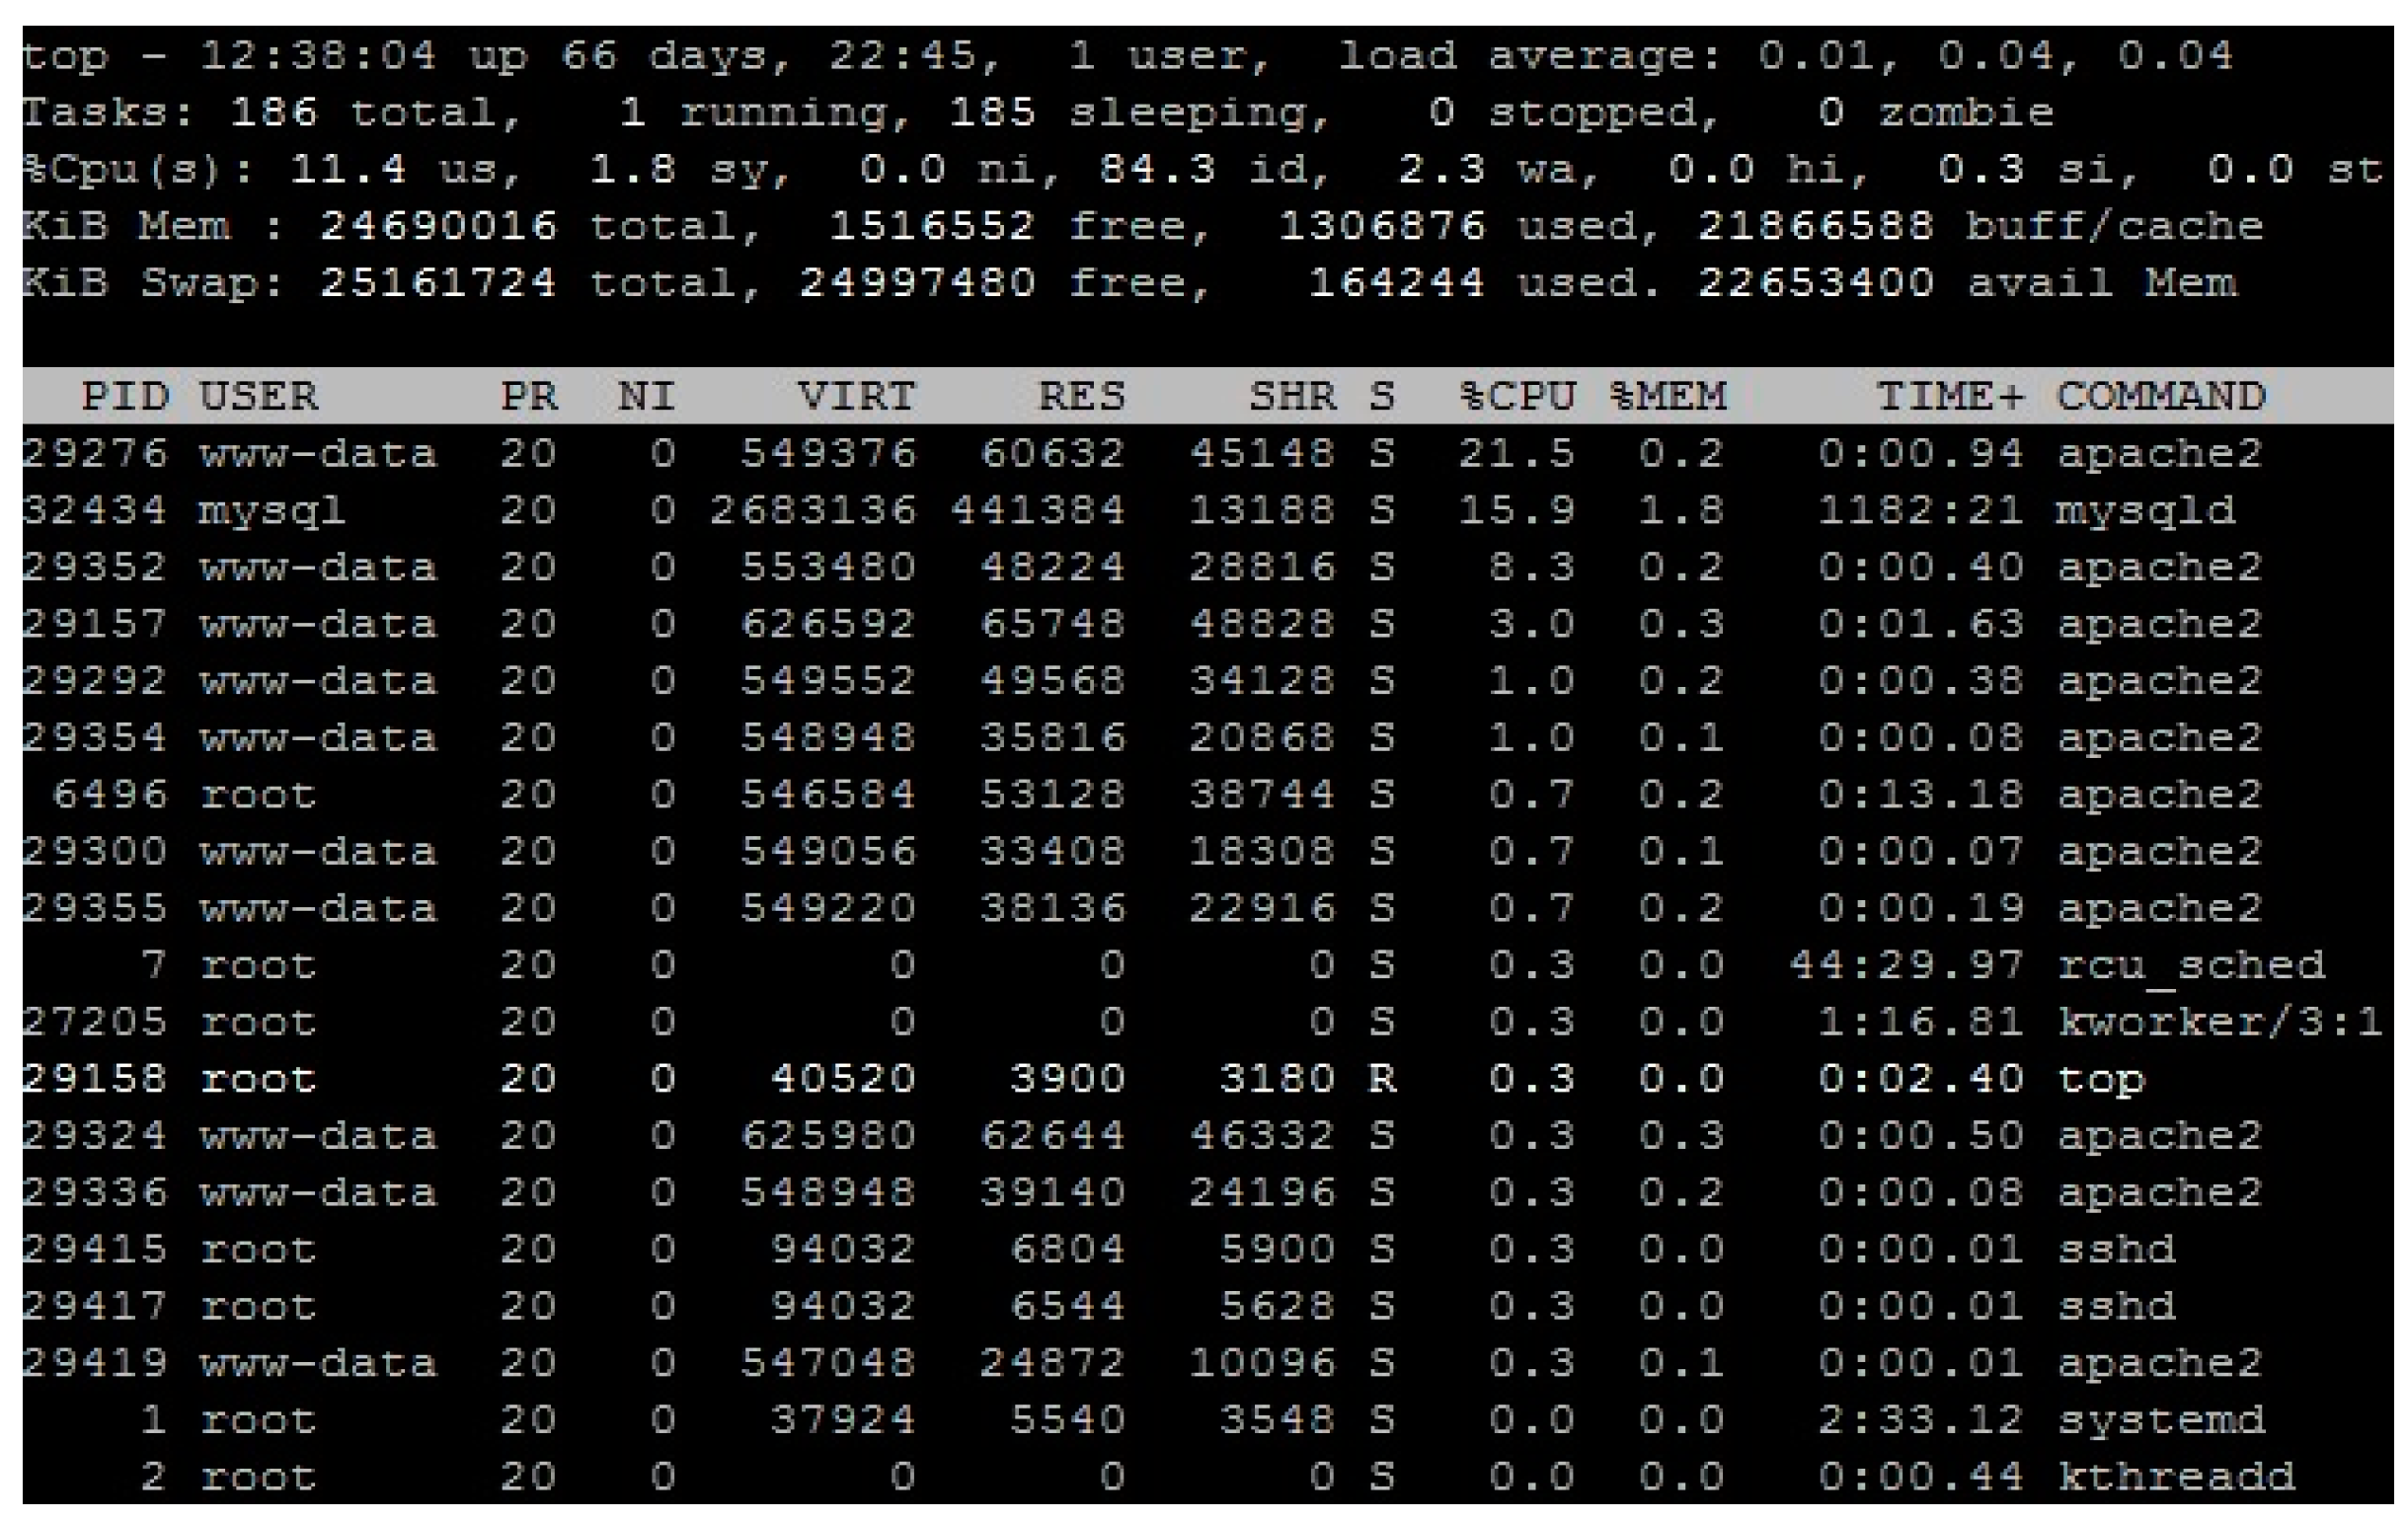
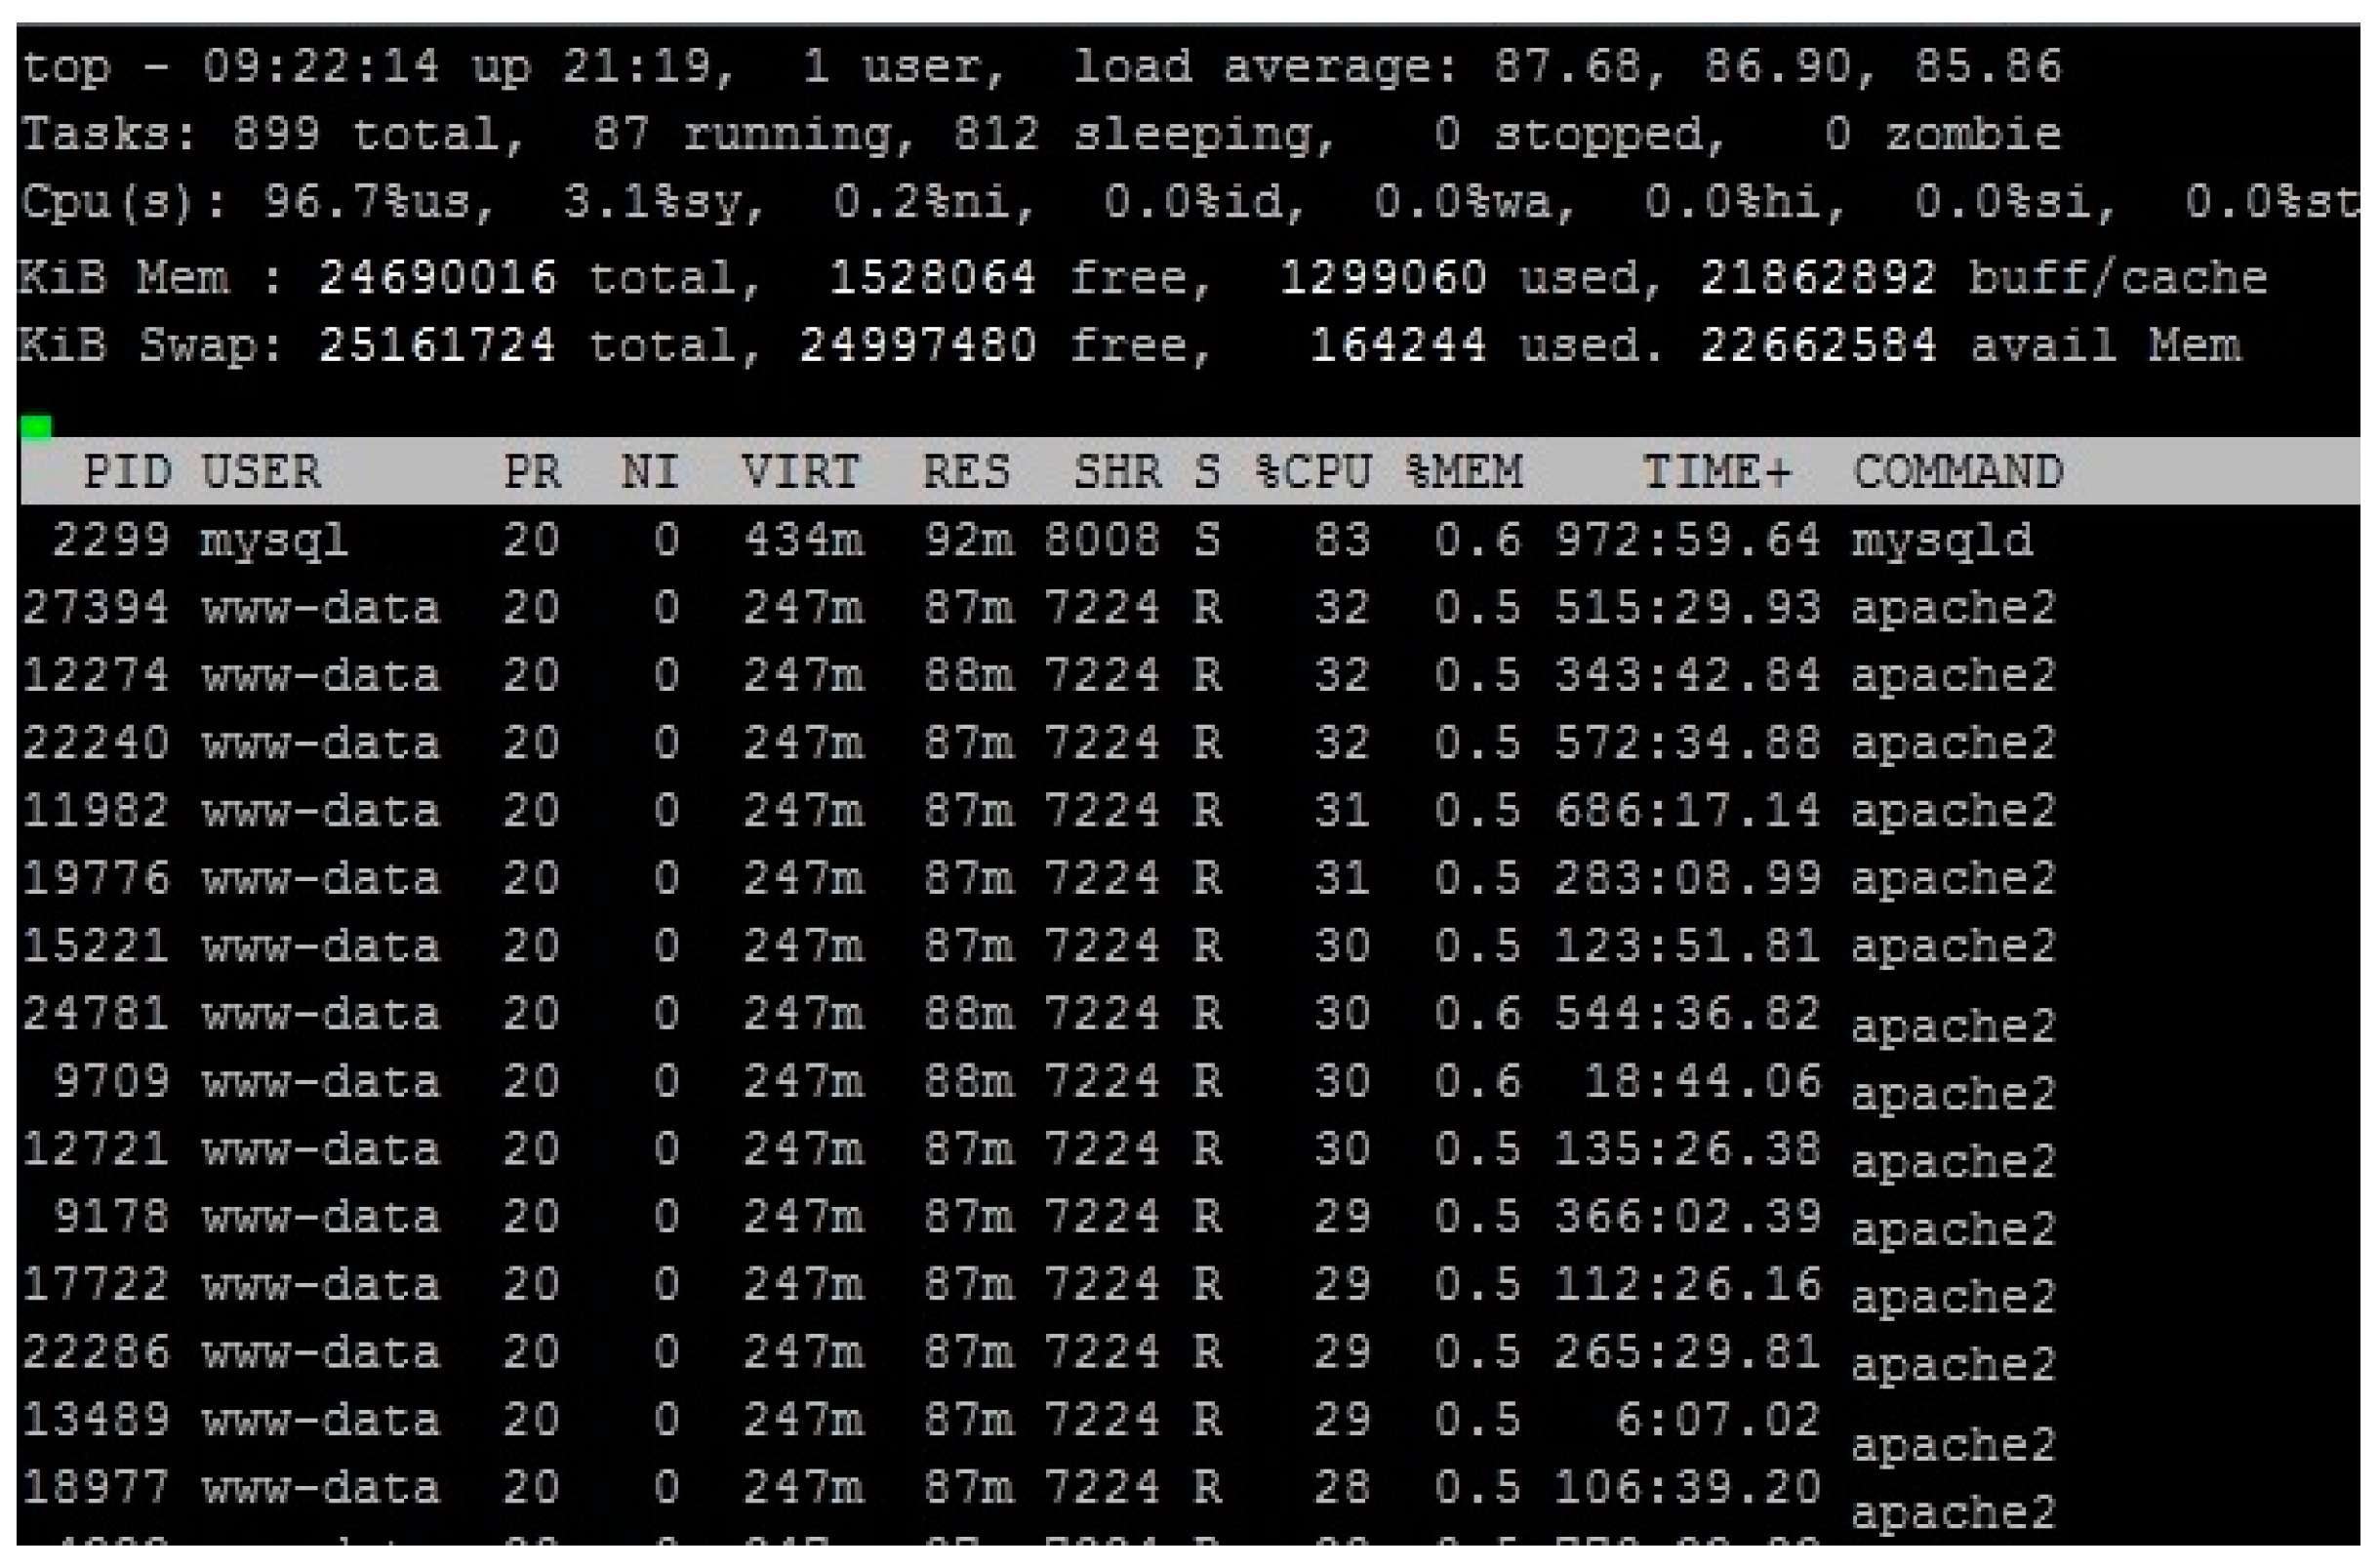
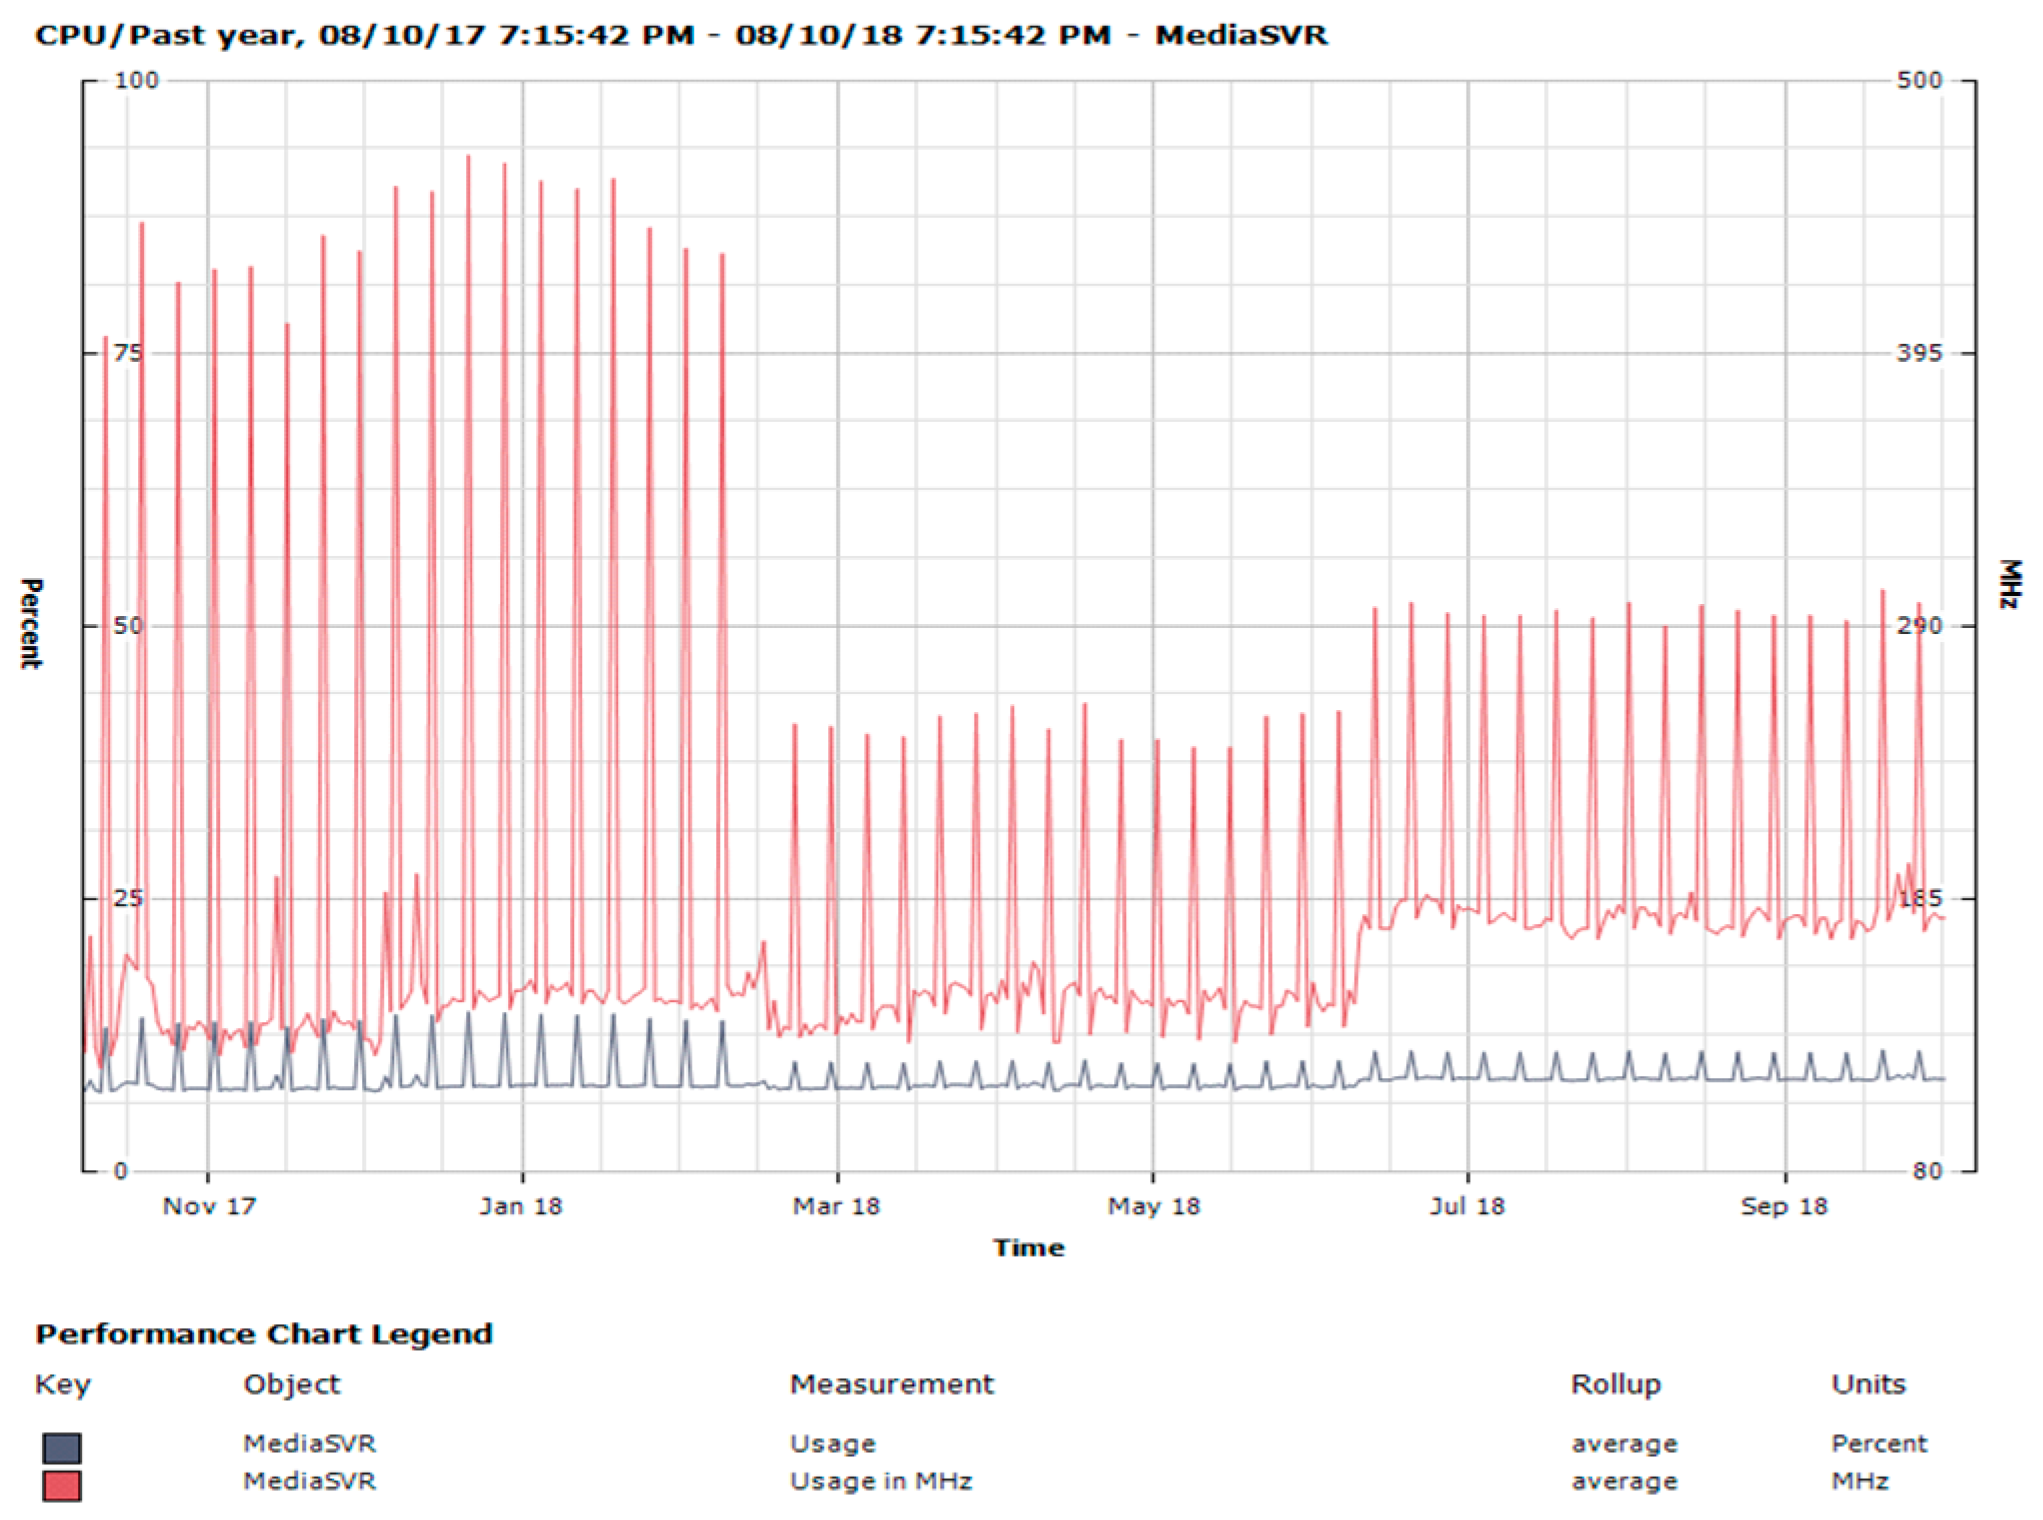
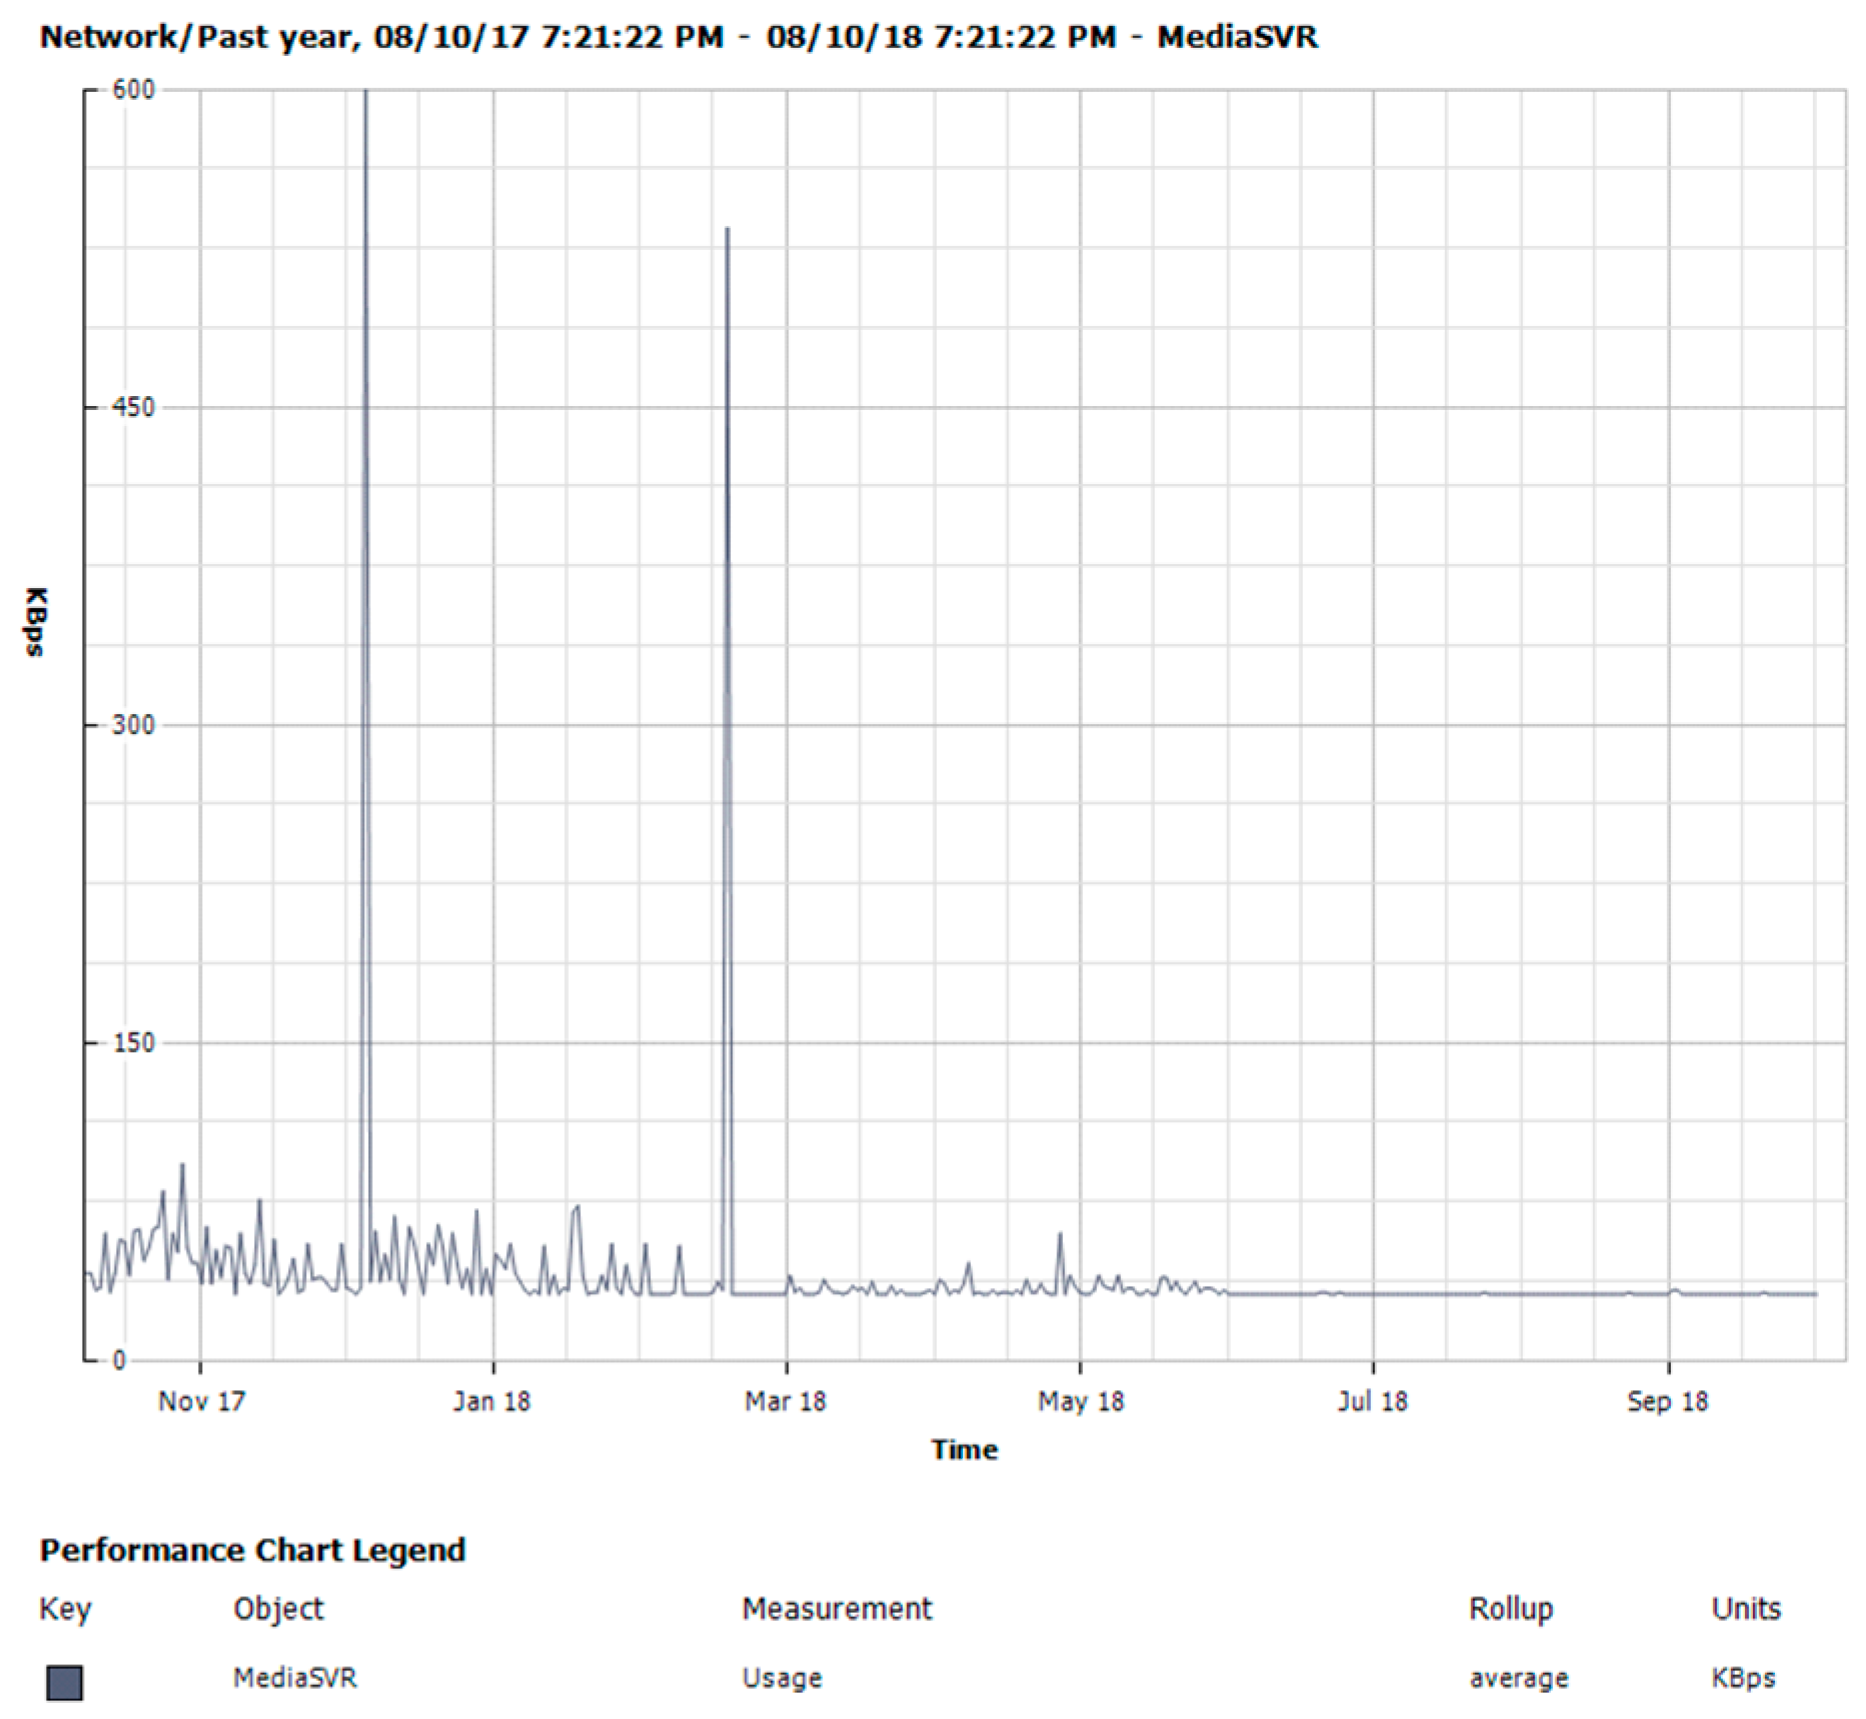
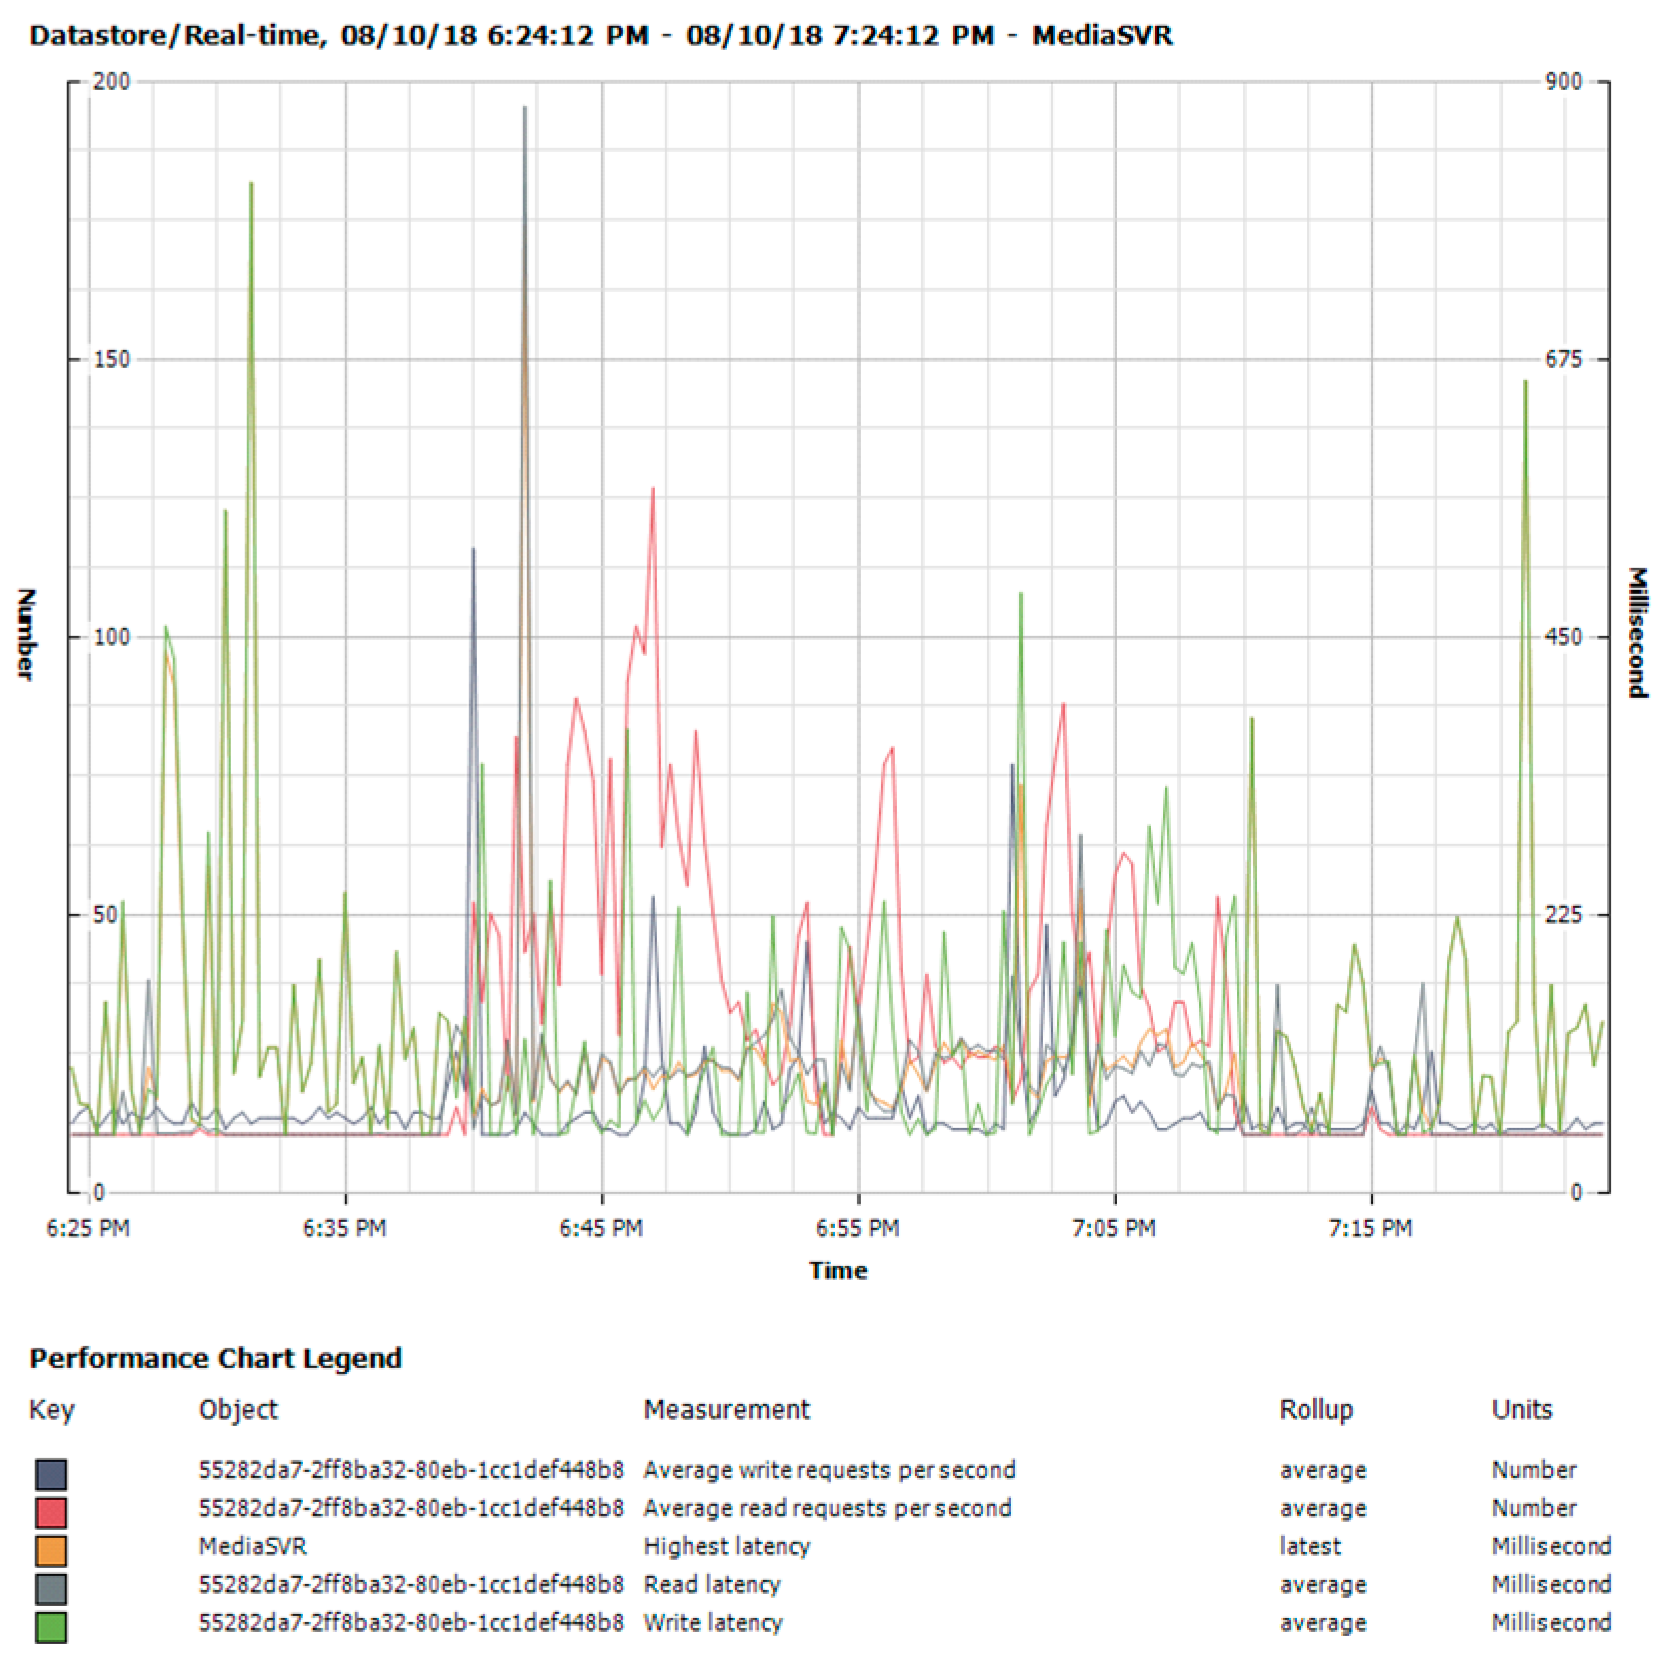
Uploading video material on Moodle can have an impact on its availability and accessibility due to large file sizes. To cater to this problem in-house solution is proposed using a streaming server so teaching will go on smoothly and will not have any impact on the LMS. To evaluate the performance of the proposed application evaluation metrics considers are central processing unit (CPU) utilization (i.e., total amount of work handled by CPU with respect to time along with memory) and bandwidth (i.e., server network load and data store load with respect of time). Checking the Moodle server CPU utilization and bandwidth, was done under a controlled environment where the video was uploaded in E-Commerce Technologies (COMP 0382), having 30 students accessing the video content.
Figure 1 depicts the CPU utilization without uploading video over the Moodle. It is clear from the figure that CPU utilization and bandwidth are slightly used, this is due to the limited interaction of students via Moodle. Another reason for the lower CPU utilization is lower access frequency/hits done by students within the controlled environment.
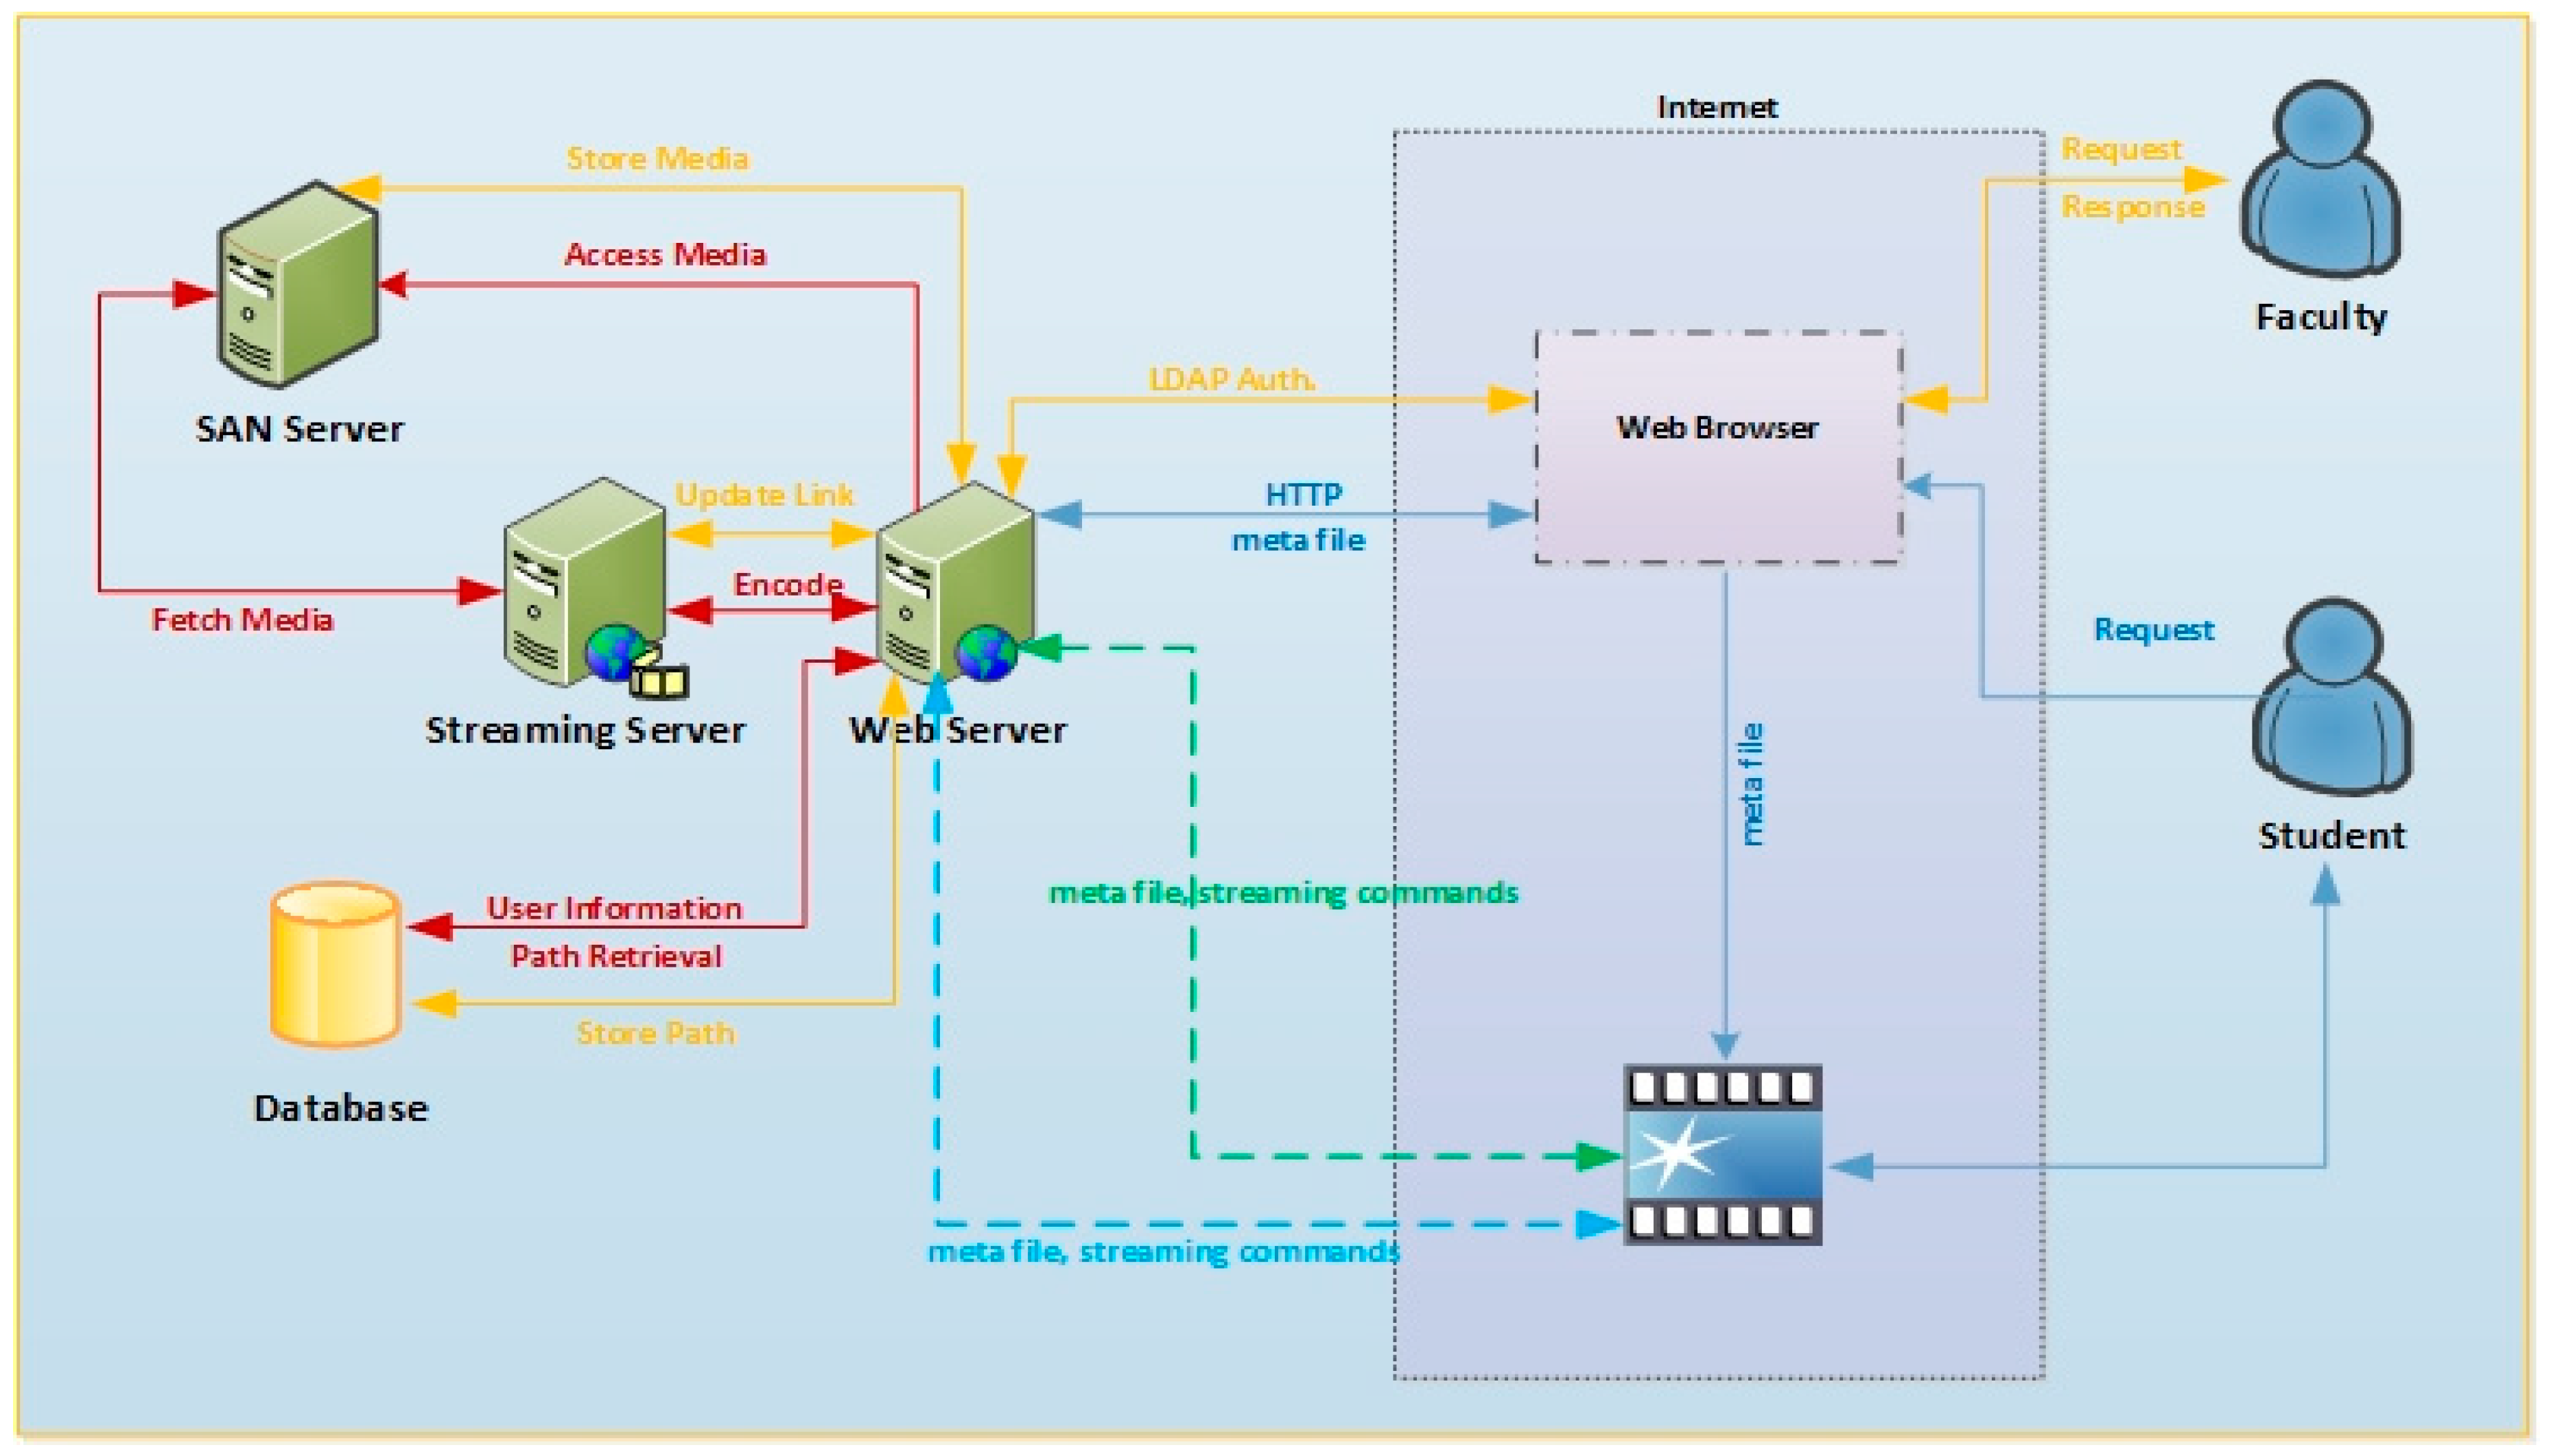
Figure 2 illustrates the CPU utilization containing video over the Moodle. It can be observed from the figure that CPU utilization and bandwidth increases significantly, multiple reasons account for this. First, server load increases due to the number of logged in users, logged in active users, enrolled users taking different activities within the Moodle and the backup and restore actions being performed. Secondly, CPU utilization is recorded to a high value due to continuous memory access of the server by the Moodle access. Lastly, CPU utilization and bandwidth increase create the lag in the network for smooth access of the content. In particular, it has been observed that CPU utilization recorded a high of 96.7 μs with an average load of 86.79%, the average load increased to 87.68% and gradually reduced to 85.86% after 15 min of activities having a CPU utilization of 96.7 μs. The average load is greater than 70% which is not good for the server so alternative remedies are required or action needed to be taken. It was also observed that when the video was used by the students the memory and buffer/cache size was reduced but it has a slight impact on the memory. As this has been only for one module but having several modules it will create load on the server. To avoid this, a separate Video Streaming Server (VSS) can be a solution to cater to this problem and making the content availability and accessibility as shown in
Figure 3.
An online portal has been developed using. Net technology (
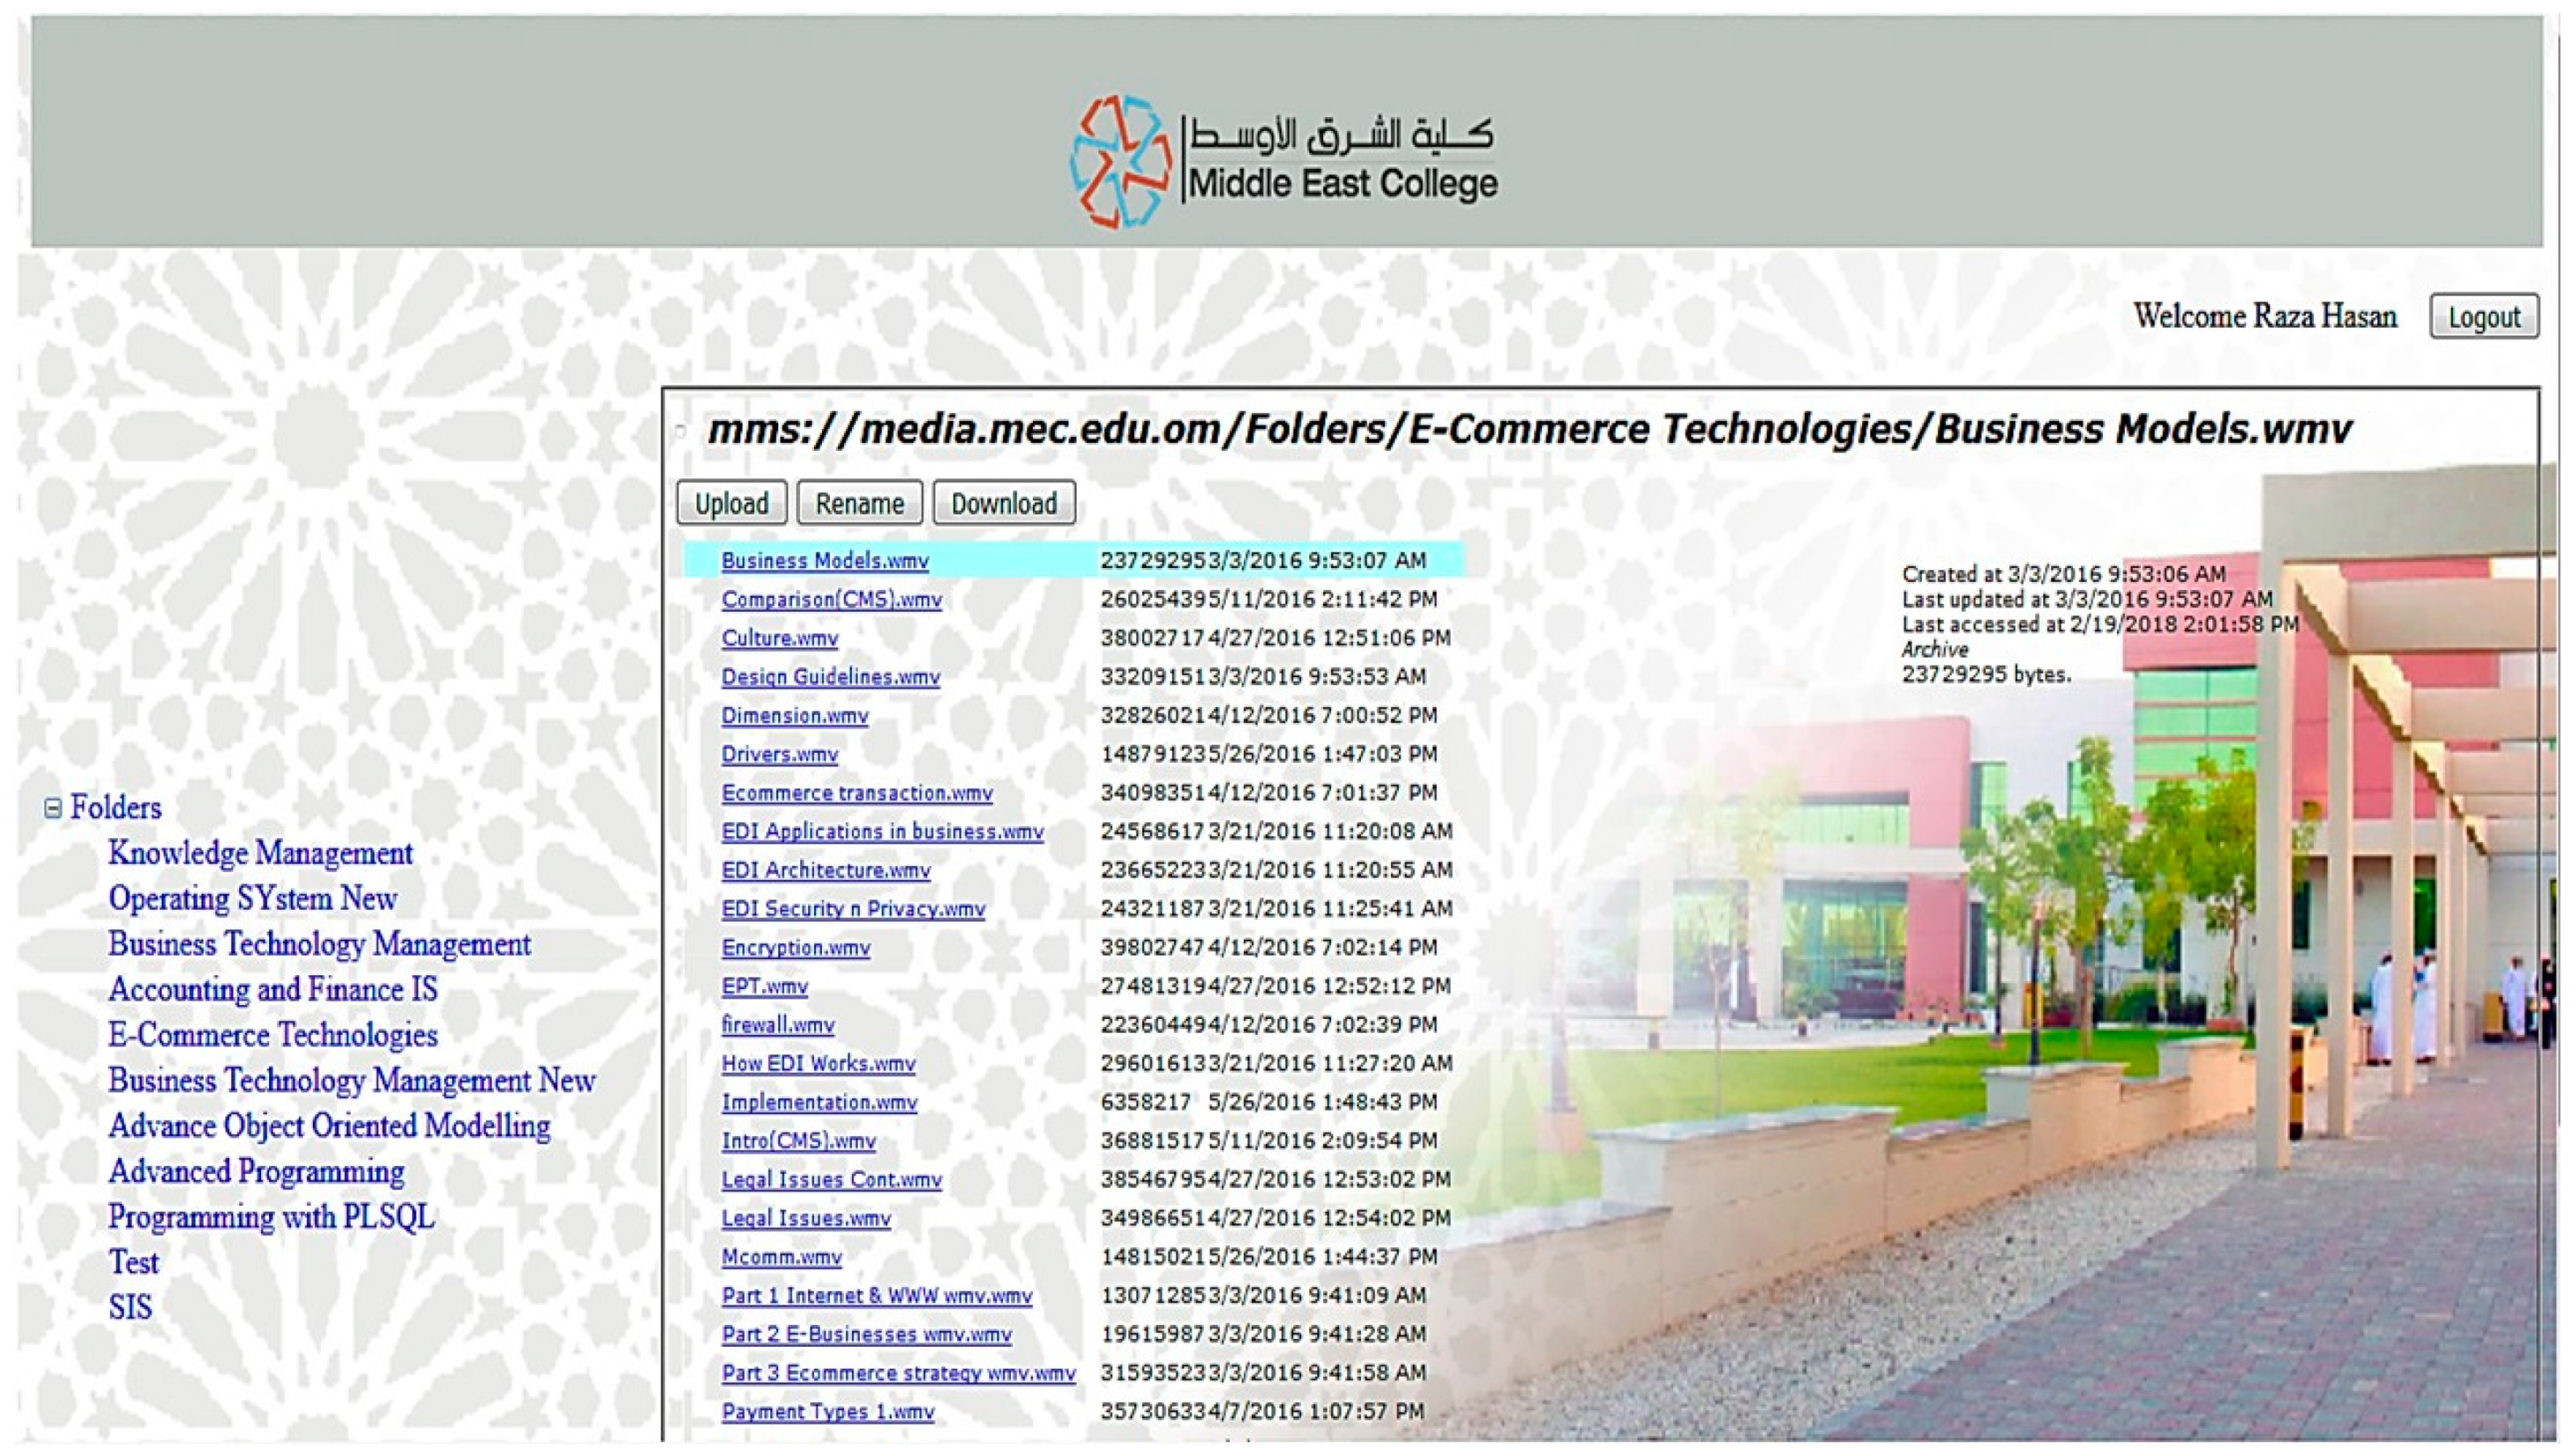
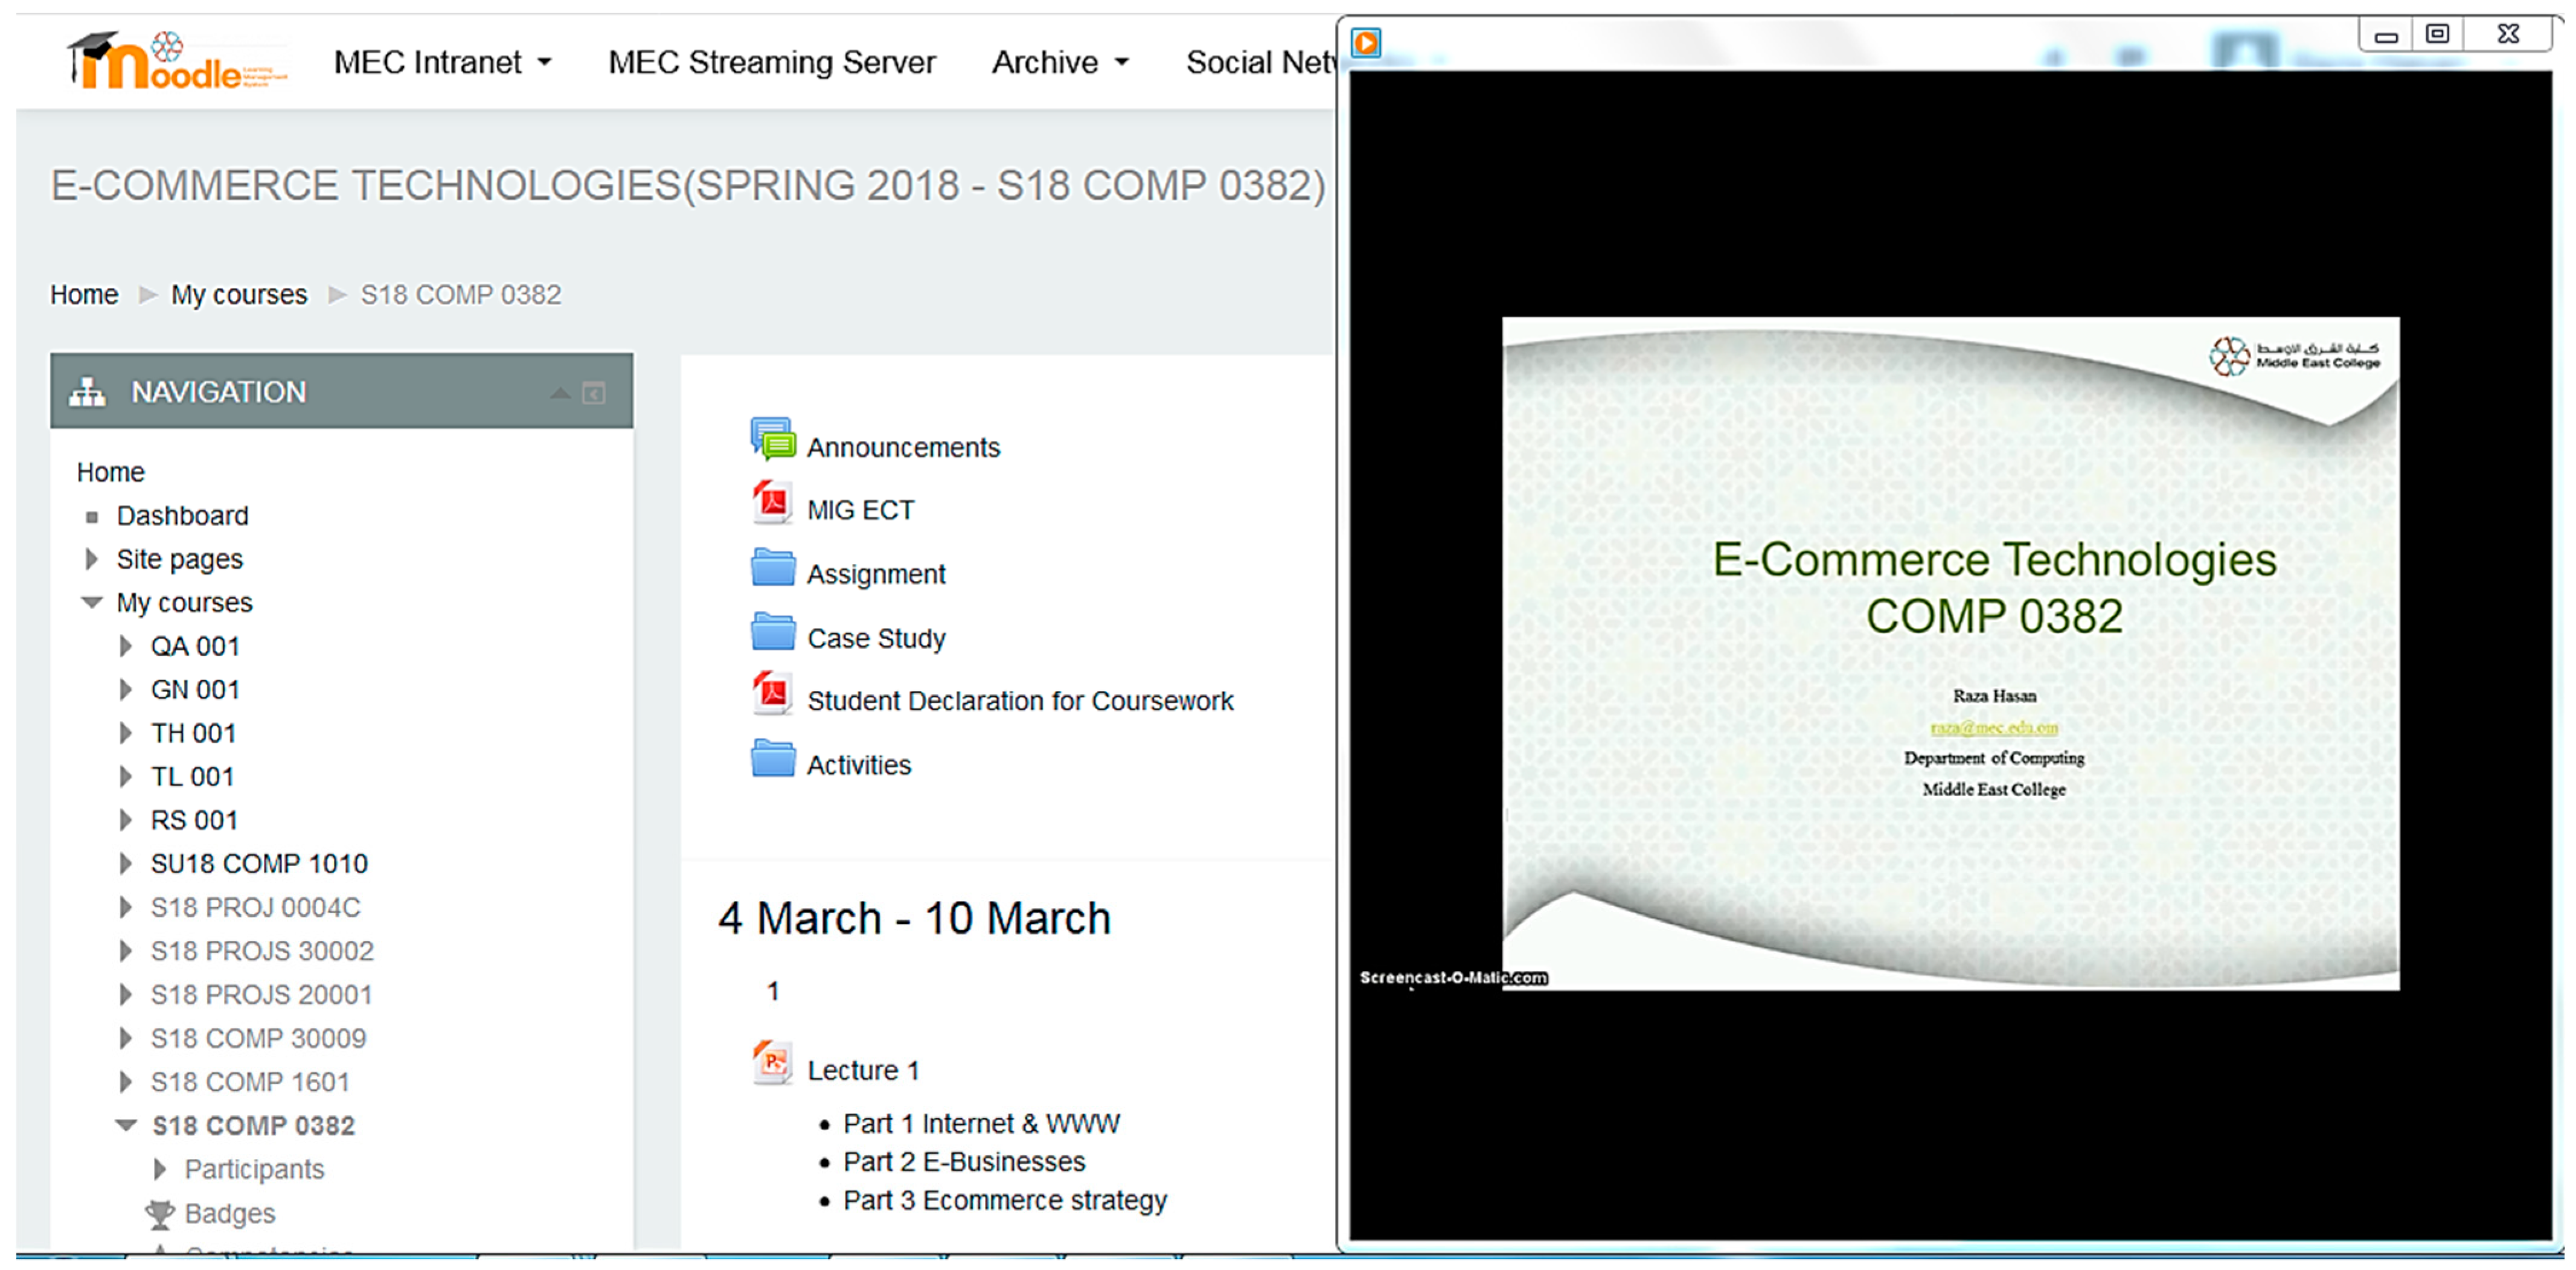
https://media.mec.edu.om/). Here faculty will log in using their college credentials. Username and password will be authenticated using Lightweight Directory Access Protocol (LDAP). Once the user is successfully authenticated it will redirect the user to their respective page. There they can select the module that they are teaching and want to upload the videos as shown in
Figure 4. After the video has been uploaded to the streaming server they can select the video to create the link for Moodle as shown in
Figure 4 (
mms://media.mec.edu.om/Folders/E-Commerce Technologies/Culture.wmv).
4.2. Predictive Forecasting Modelling
For analysis and prediction, quantitative forecasting methods are used. These methods are categorized namely (I) associative models and (II) time-series models. Firstly, in the associative models, prediction is made on the basis of associations, the variable is being forecasted in relation to other variables within the environment. Secondly, the time-series models attempt to predict the future outcome based on the underlying patterns from the past patterns of data [
22,
34].
The methods that were conducted to find the predicted results are Most Recent (Naïve Forecast Method) this uses the most recent period amount to forecast for the next period.
Average of Past Values method uses time series that has no significant trend, cyclical, or seasonal effect. For example: For period 2, use period 1 value, for period 3 use (period 1 + period 2 values)/2, for period 4 use (period 1 + period 2 + period 3 values)/3 and so on.
Moving Averages uses the moving average at a possibly weighted point in time and determines averages observed values that surround a particular time. It helps smooth out random fluctuations in the time series data. It averages the most recent
k period. Smaller the
k, better forecast that will adopt the change in level. Bigger the
k, better forecast that will adopt the change in level. For example period 4, average period 1–3 values, period 5, average period 2–4 values and so on.
Exponential Smoothing method uses assigned exponentially decreasing weights as the observations become older. It helps smooth out random fluctuations in the time series data.
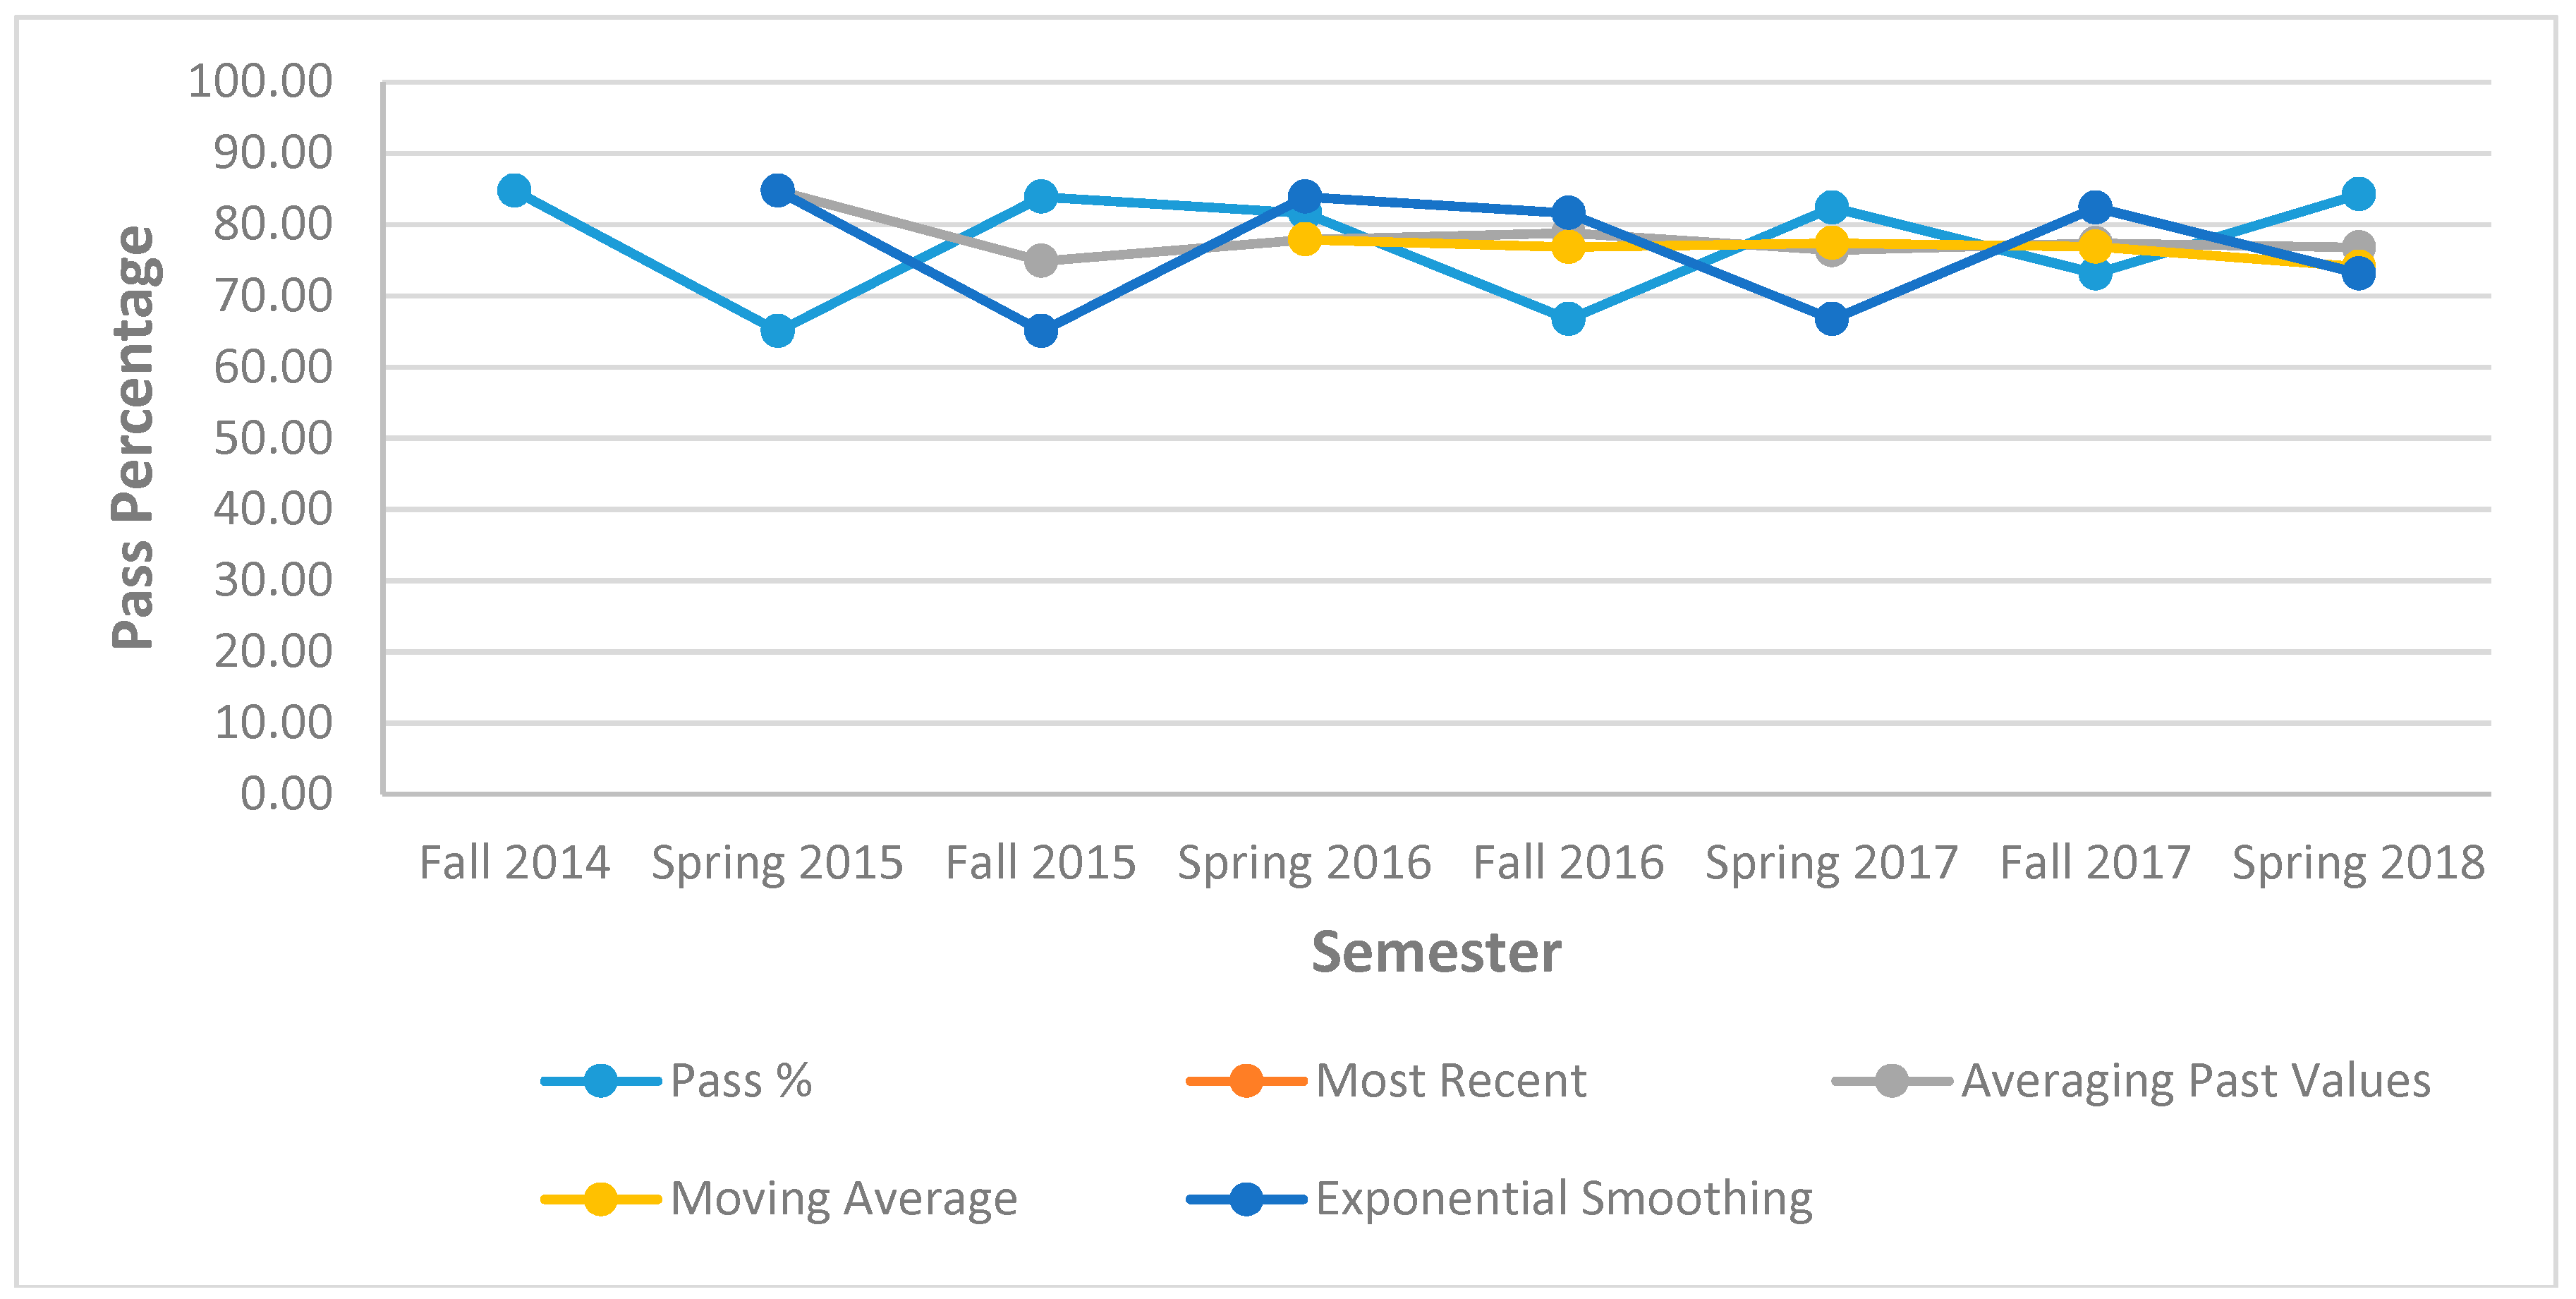
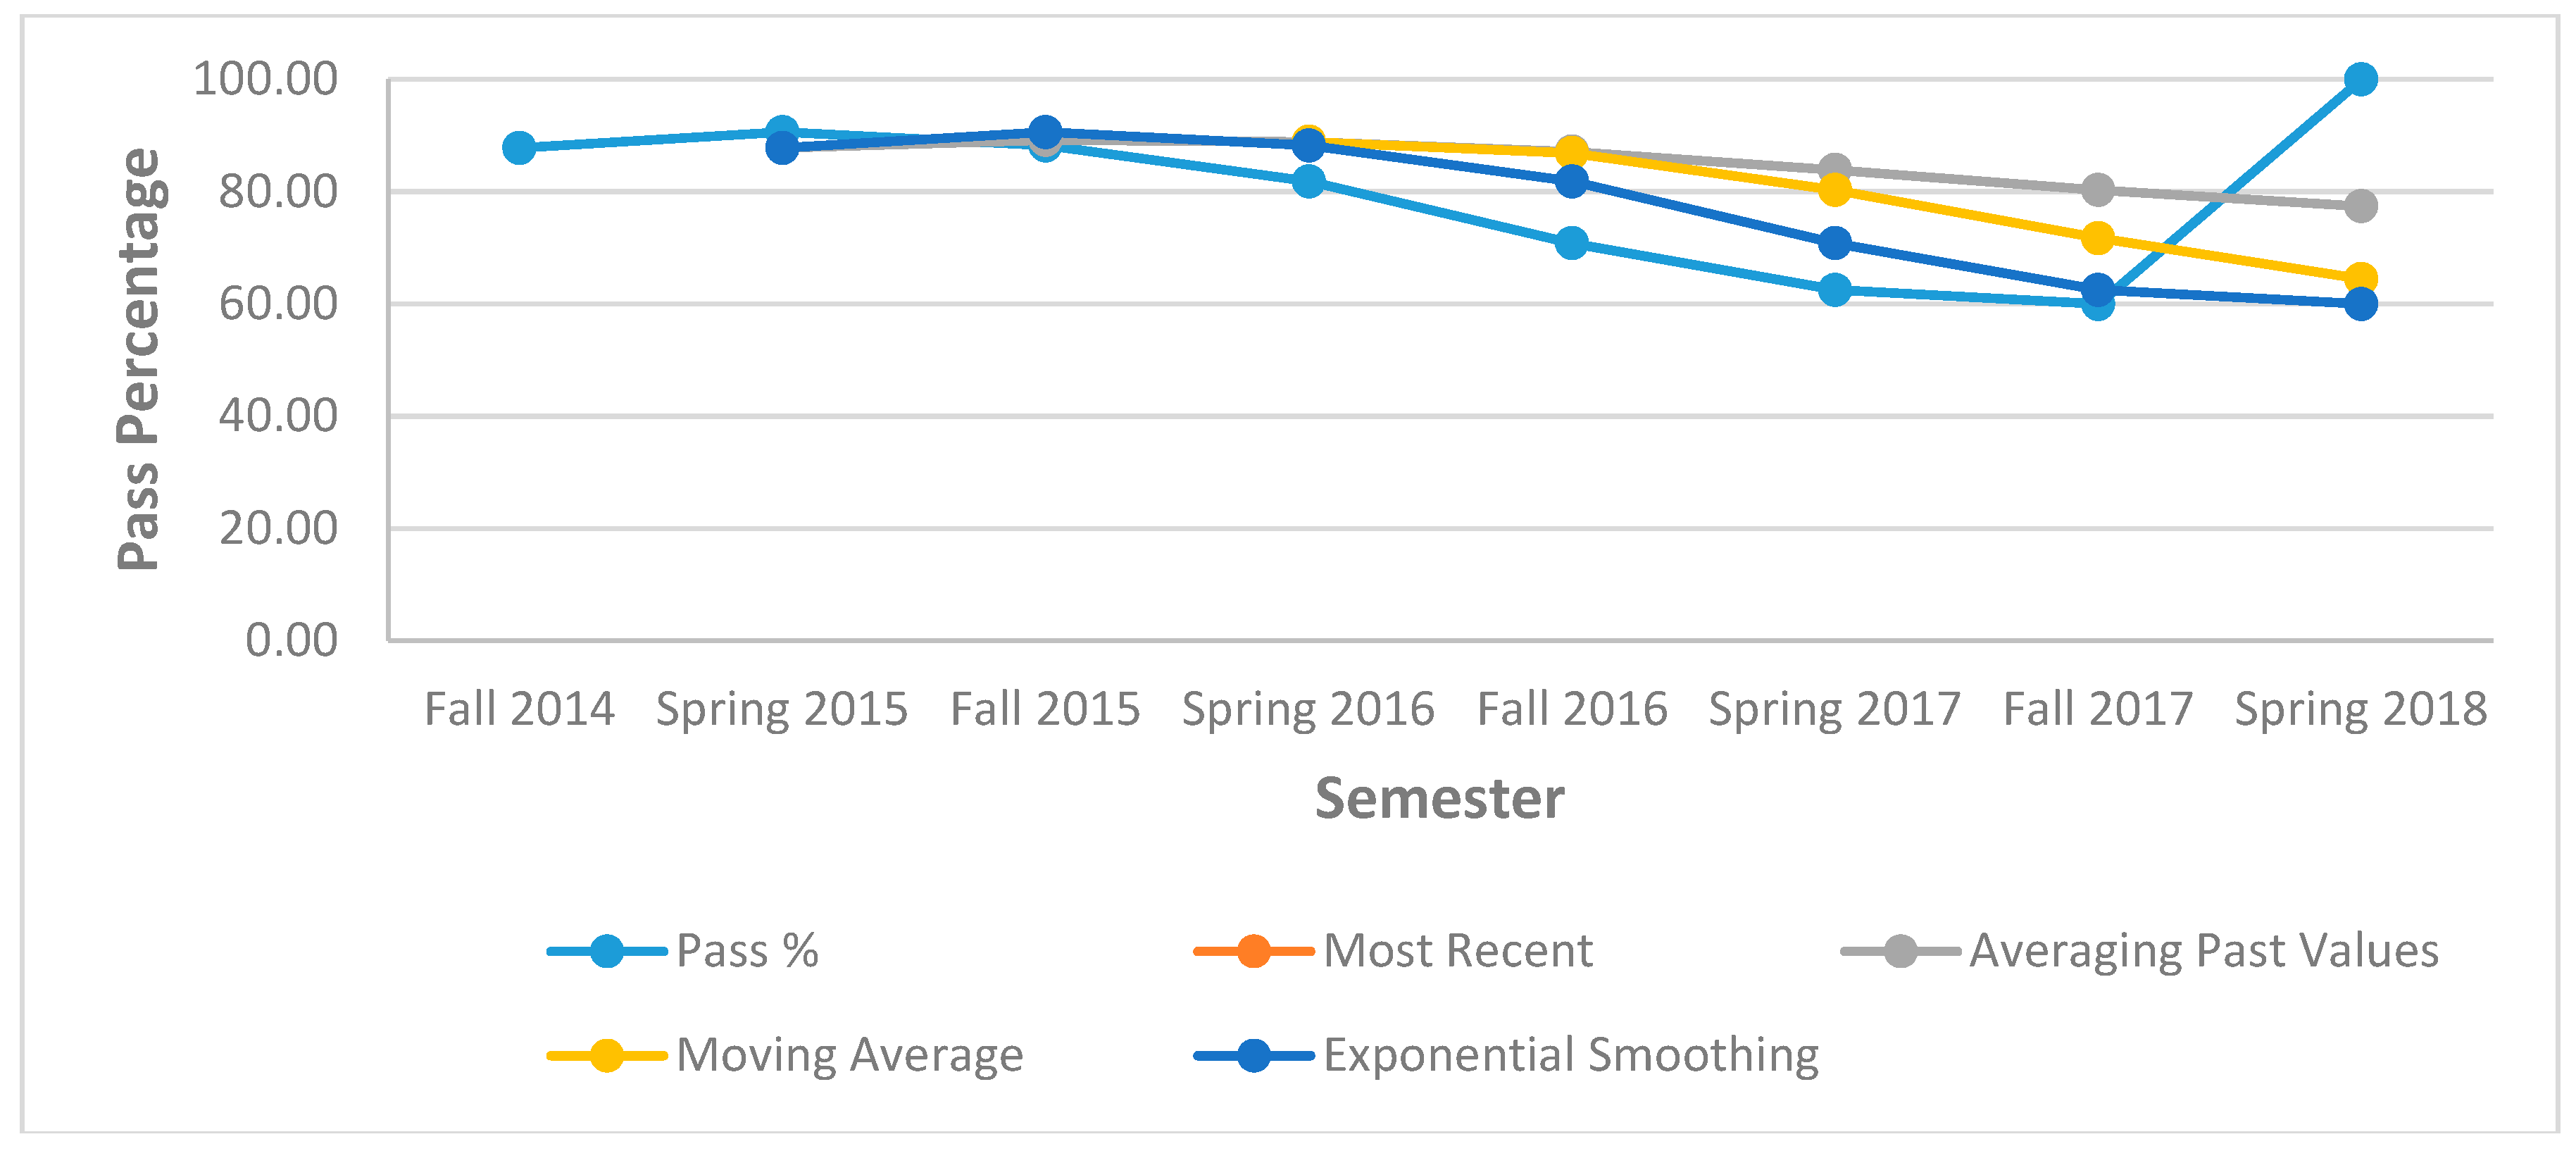
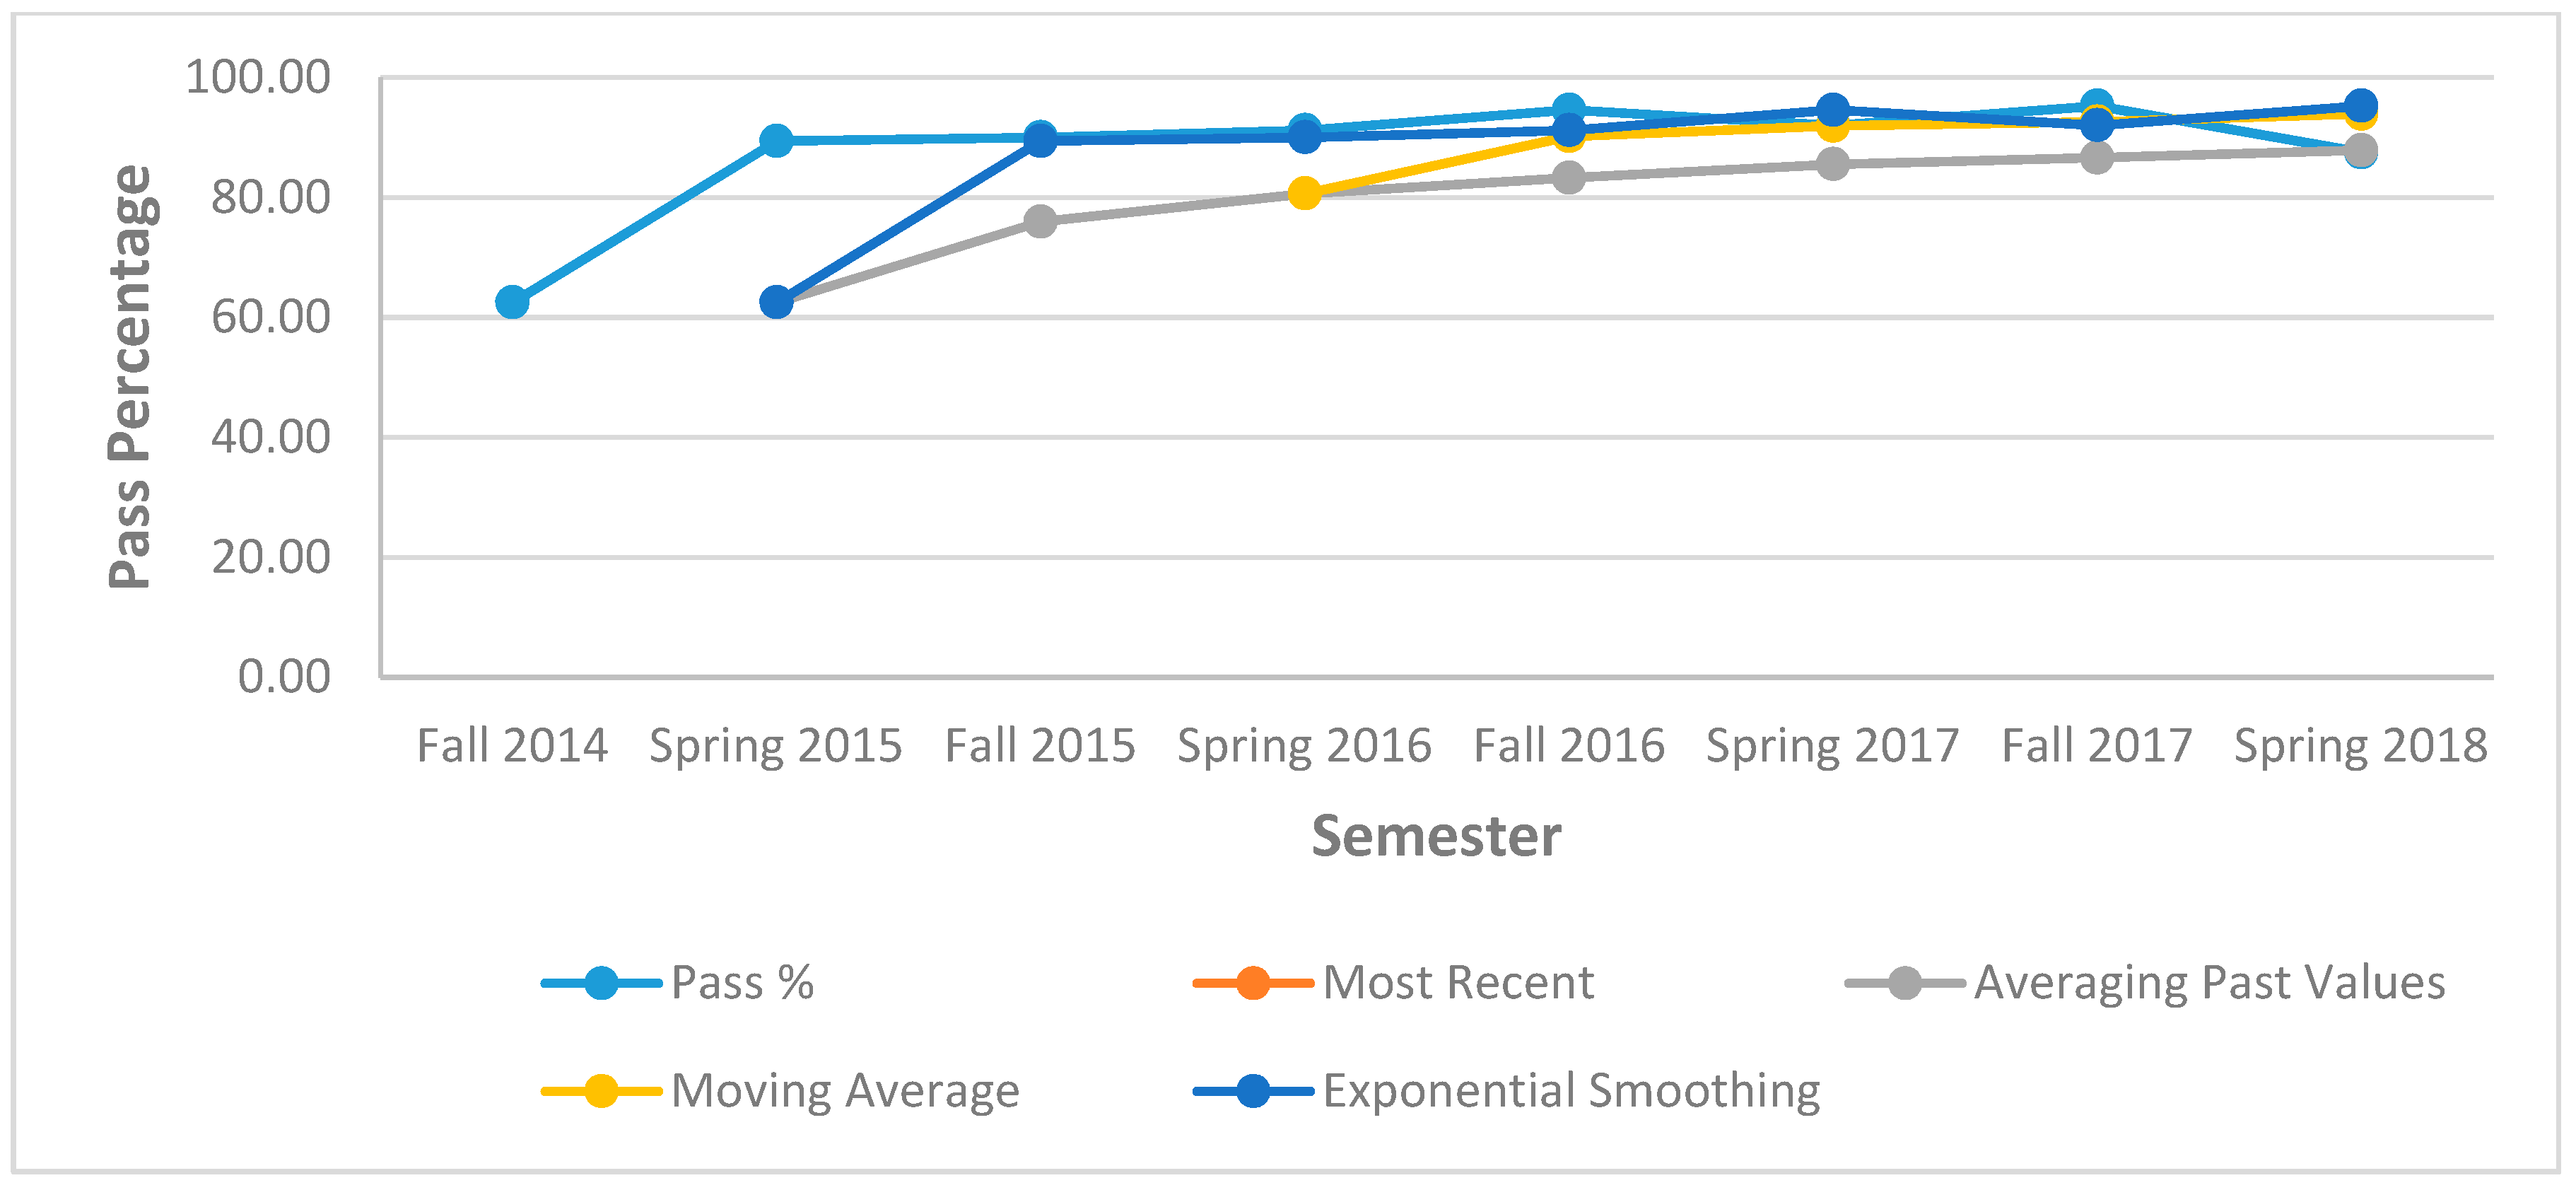
The values considered in this research for Most Recent and Averaging of Past Values are n = 6, k = 1 and for Moving Average n = 6, k = 3.
Forecasting error and accuracy will be measured by using Mean Forecast Error = MFE. MFE measures forecast error. It is a simple measure of forecast error.
Mean Absolute Error = MAE. MAE measures forecast error it avoids the problem of positive and negative forecast errors tending to offset one another when you sum the errors. Synonym for MAE is:
Mean Squared Error = MSE, it measures forecast error. It avoids the problem of positive and negative forecast errors tending to offset one another when you sum the errors.
Mean Absolute Percentage Error = MAPE, it measures forecast error in relative terms. A relative or percentage error measure that allows you to compare forecast error across forecast methods with different time intervals or time series.
For forecasting, the data used is collected from Fall 2014 to Spring 2018 as shown in
Table 2. Blended Learning teaching was implemented from Fall 2015 onwards. Below are the statistics for the modules from different levels within the college. Below are the statistics showing pass % for the modules from different levels within the college along with the number of students enrolled.
