Article

Conservation Opportunities of the Land Restitution Program Areas in the Colombian Post-Conflict Period

1
Department of Ecology and Territory, School of Environmental and Rural Studies, Pontificia Universidad Javeriana, Bogotá 110231, Colombia
2
Master’s Program in Conservation and Use of Biodiversity, School of Environmental and Rural Studies, Pontificia Universidad Javeriana, Bogotá 110231, Colombia
*
Author to whom correspondence should be addressed.
Sustainability 2019, 11(7), 2048; https://doi.org/10.3390/su11072048
Submission received: 11 March 2019 / Revised: 28 March 2019 / Accepted: 31 March 2019 / Published: 6 April 2019

Abstract

:
The Land Restitution Program (LRP) is one of the greatest challenges for Colombia’s post-conflict period; it implies the recognition of the victims of dispossession or abandonment of lands and sets the discussion for future land use planning in these areas. The 1,119,959 Ha of LRP areas (August 2018) require knowledge of their state to promote land uses that favor the conservation of priority ecosystems and forest cover. Spatial and statistical analyzes where used to study the land-cover change in and around LRP areas at the national and regional level. An index of naturalness using a multi-criteria framework was used to identify important areas for conservation. Within areas, forest cover changes, resulting from deforestation and regeneration processes, decreased between 1990 and 2017. A total of 9.4% of their area show high naturalness, while 20% of them show high importance for conservation. The results show that, despite their dispossession/abandonment, these areas continued a deforestation process. Most of the areas show low naturalness, but conservation priorities can be identified in the Andes, Amazon, and Orinoco regions.

1. Introduction

The social, economic, and political effects of social conflicts in societies have been widely studied and documented [1,2,3,4]. Sociopolitical conflicts often have an important impact on land use and occupation, because land tenure gives control over the territory, its dynamics, and resources [5,6,7]. However, the impacts of these conflicts on ecosystems and biodiversity have received fewer attention, although conflicts often occur in areas of interest to conservation, with considerable impacts on biodiversity. It has been estimated that 90% of the conflicts in the last decades have occurred in countries with biodiversity hotspots [8], and 80% of them directly in hotspot areas [9]. The environmental effects of the conflicts include the destruction of natural resources, the pollution of land and water, the increase of the ecological footprint due to the displacement of communities, the collapse of the environmental governance [7,10], the increase of the illegal crops [11], changes in land occupation and tenure [5], and loss of biodiversity and ecosystems [12].
The impacts of conflicts on ecosystems are an increasing concern for conservation [7]. Although, studies in countries with armed conflict history have found evidence of the impacts on forest cover and its effects on biodiversity, consequences can sometimes be contradictory, especially concerning the contrasting trends during and after the conflict. For example, the Democratic Republic of Congo suffered a loss of its forest cover as a consequence of the civil war in the 1997 [13]; a study in Liberia on the effects of the conflict in the forest cover in the 1990’s indicates that the illegal activities of the conflict have important consequences on the abandoned lands and the areas important for conservation [14]. Burgess et al. [15], found that in Sierra Leone the intensification of the conflict resulted in the conservation of primary forests and recovery of secondary forests. In contrast, the sociopolitical and armed conflict in Cambodia had negative impacts on biodiversity due to the intensive extraction of resources for the support of the military forces, with consequences such as the decrease in species richness and abundance, the increase of animal trafficking, and the local extirpation of five animal species [16]. In the Horne of Africa, the armed conflict led to the destruction and fragmentation of natural habitats and the increase in the soil and water pollution [7]. Stevens et al. [17] found that in Nicaragua the conflict related factors are partially responsible for an initial increase in forest cover, and its subsequent decrease.
Once the conflicts cease these dynamics change following the disarmament, demobilization, and social reintegration of illegal force members [18], as well as the beginning of transitional justice processes, constitutional reforms, and the restoration of the local domestic economy [19]. Although the termination of the conflict brings positive effects for the institutions, the population, and the economy, it also has negative impacts for the rural areas due to the intensification in the use of natural resources needed for peace construction [20]. During these periods, governments tend to focus on the reduction of poverty, the maintenance of peace, and the recovery of socioeconomic stability [21], and often leave issues related to environmental sustainability and management of natural resources aside [22]. These decisions affect the conservation of ecosystems due to the agricultural expansion and increased livestock numbers, the exploitation of natural resources, and the threat to protected areas and forest cover [20]. In Colombia, the discussion on the effects of the armed conflict on forests and biodiversity have shown contradictory evidences [11,23,24]. Forest cover dynamics respond differently among bioregions due to varying socioeconomic conditions and the biogeographical, political, and institutional contexts of the country [12,25,26].
The history of Colombia has been marked by a tradition of armed conflicts: the European colonization, the Independence wars, the Thousand Days’ War, the civil wars between liberals and conservatives, and the period known as La Violencia [27]. The most recent armed conflict started in the 1950’s, accumulating important social, political, cultural, economic, and environmental effects, partially ending in 2016 with a peace treaty with the major group, the FARC-EP (Revolutionary Armed Forces of Colombia—People’s Army). During the late phases of this conflict, particularly since the early 90’s, the paramilitary groups joined the fight for the control of the territory leading to major processes of forced migration and land dispossession [28]. Drug production and trafficking, the antipersonnel mines, and the territory dispute between the illegal armed groups (FARC-EP, ELN—National Liberation Army, EPL—Popular Liberation Army), the paramilitaries (AUC—United Self-Defense Forces of Colombia), and the Colombian Army have affected millions of people [29,30], that have been displaced from rural to urban areas, causing socioeconomic problems and an increase of poverty indicators in these areas [31]. The conflict has led to an increased land concentration, forest cover change, occupation of strategic ecosystems, expansion of the agricultural frontier, and surge of illegal economies [32,33,34]; and the combination of these factors have resulted in the displacement of 3.6 million people and the dispossession of their properties [30]. These abandoned farmlands are spread throughout the national territory, in particular in the Caribbean, Orinoco, and Andes regions, that where mainly under FARC-EP and paramilitary control [28], and are often located in agricultural frontiers with high values of conservation and environmental importance, such as national priority ecosystems, last forest remnants, areas important for conservation, high richness, endemism, and natural resources [19,23,29,35].
In 2016, the Colombian Government signed the peace agreement with the FARC-EP, with the compromise to accomplish an integral rural reform, replace the illicit crops, reestablish the victims’ rights, and end the conflict [36]. However, this agreement represents big political, economic, social, and environmental challenges. In response to the social consequences of the conflict, the law 1448 of 2011 was created in order to repair the violations to the victims’ fundamental rights. This law established the roadmap to restore the victims that have suffered losses since 1991, as a consequence of the non-compliance of the International Humanitarian Law that occurred during the internal armed conflict [37,38]. One of its main components is the Land Restitution Program (LRP) that aims to return the abandoned or dispossessed land areas to their original owners. The area of claimed properties reached 1,119,958 Ha in August 2018 [39]; these are areas that are in the process of being returned to the victims.
The coming years will be critical for the conservation of Colombia’s ecosystems. The cessation of the conflict may bring an increase in the pressures and threats to the conservation activity, and the expansion of the resource extraction, mining, agricultural intensification, and the construction of infrastructure [19,23]. The land restitution, is an opportunity to promote alternative land uses that favor the protection of ecosystems, apply figures of management of biodiversity and ecosystems services, and take into account the needs of the victims. Understanding which restitution areas are more suitable for development, management, and conservation processes is necessary and urgent. This process implies the return of the displaced populations to their territories, and the reentering of these lands to the legal economy. This means an opportunity to reshape land uses and consider the national environmental assets and uses that consider natural resources without depleting them, such as ecotourism and fauna sighting; and allowing to extend the impact of existing conservation areas.
This study sought to understand the dynamics of land use in the LRP areas during the past 30 years, providing inputs that guide their reincorporation to the agricultural frontier and the legal economy. Particularly, it aims to characterize their environmental importance and the conditions of forest cover trends. We used multi-temporal land cover series, biodiversity value maps, and protected areas data to characterize the lands under restitution process in the different regions of Colombia.

2. Materials and Methods
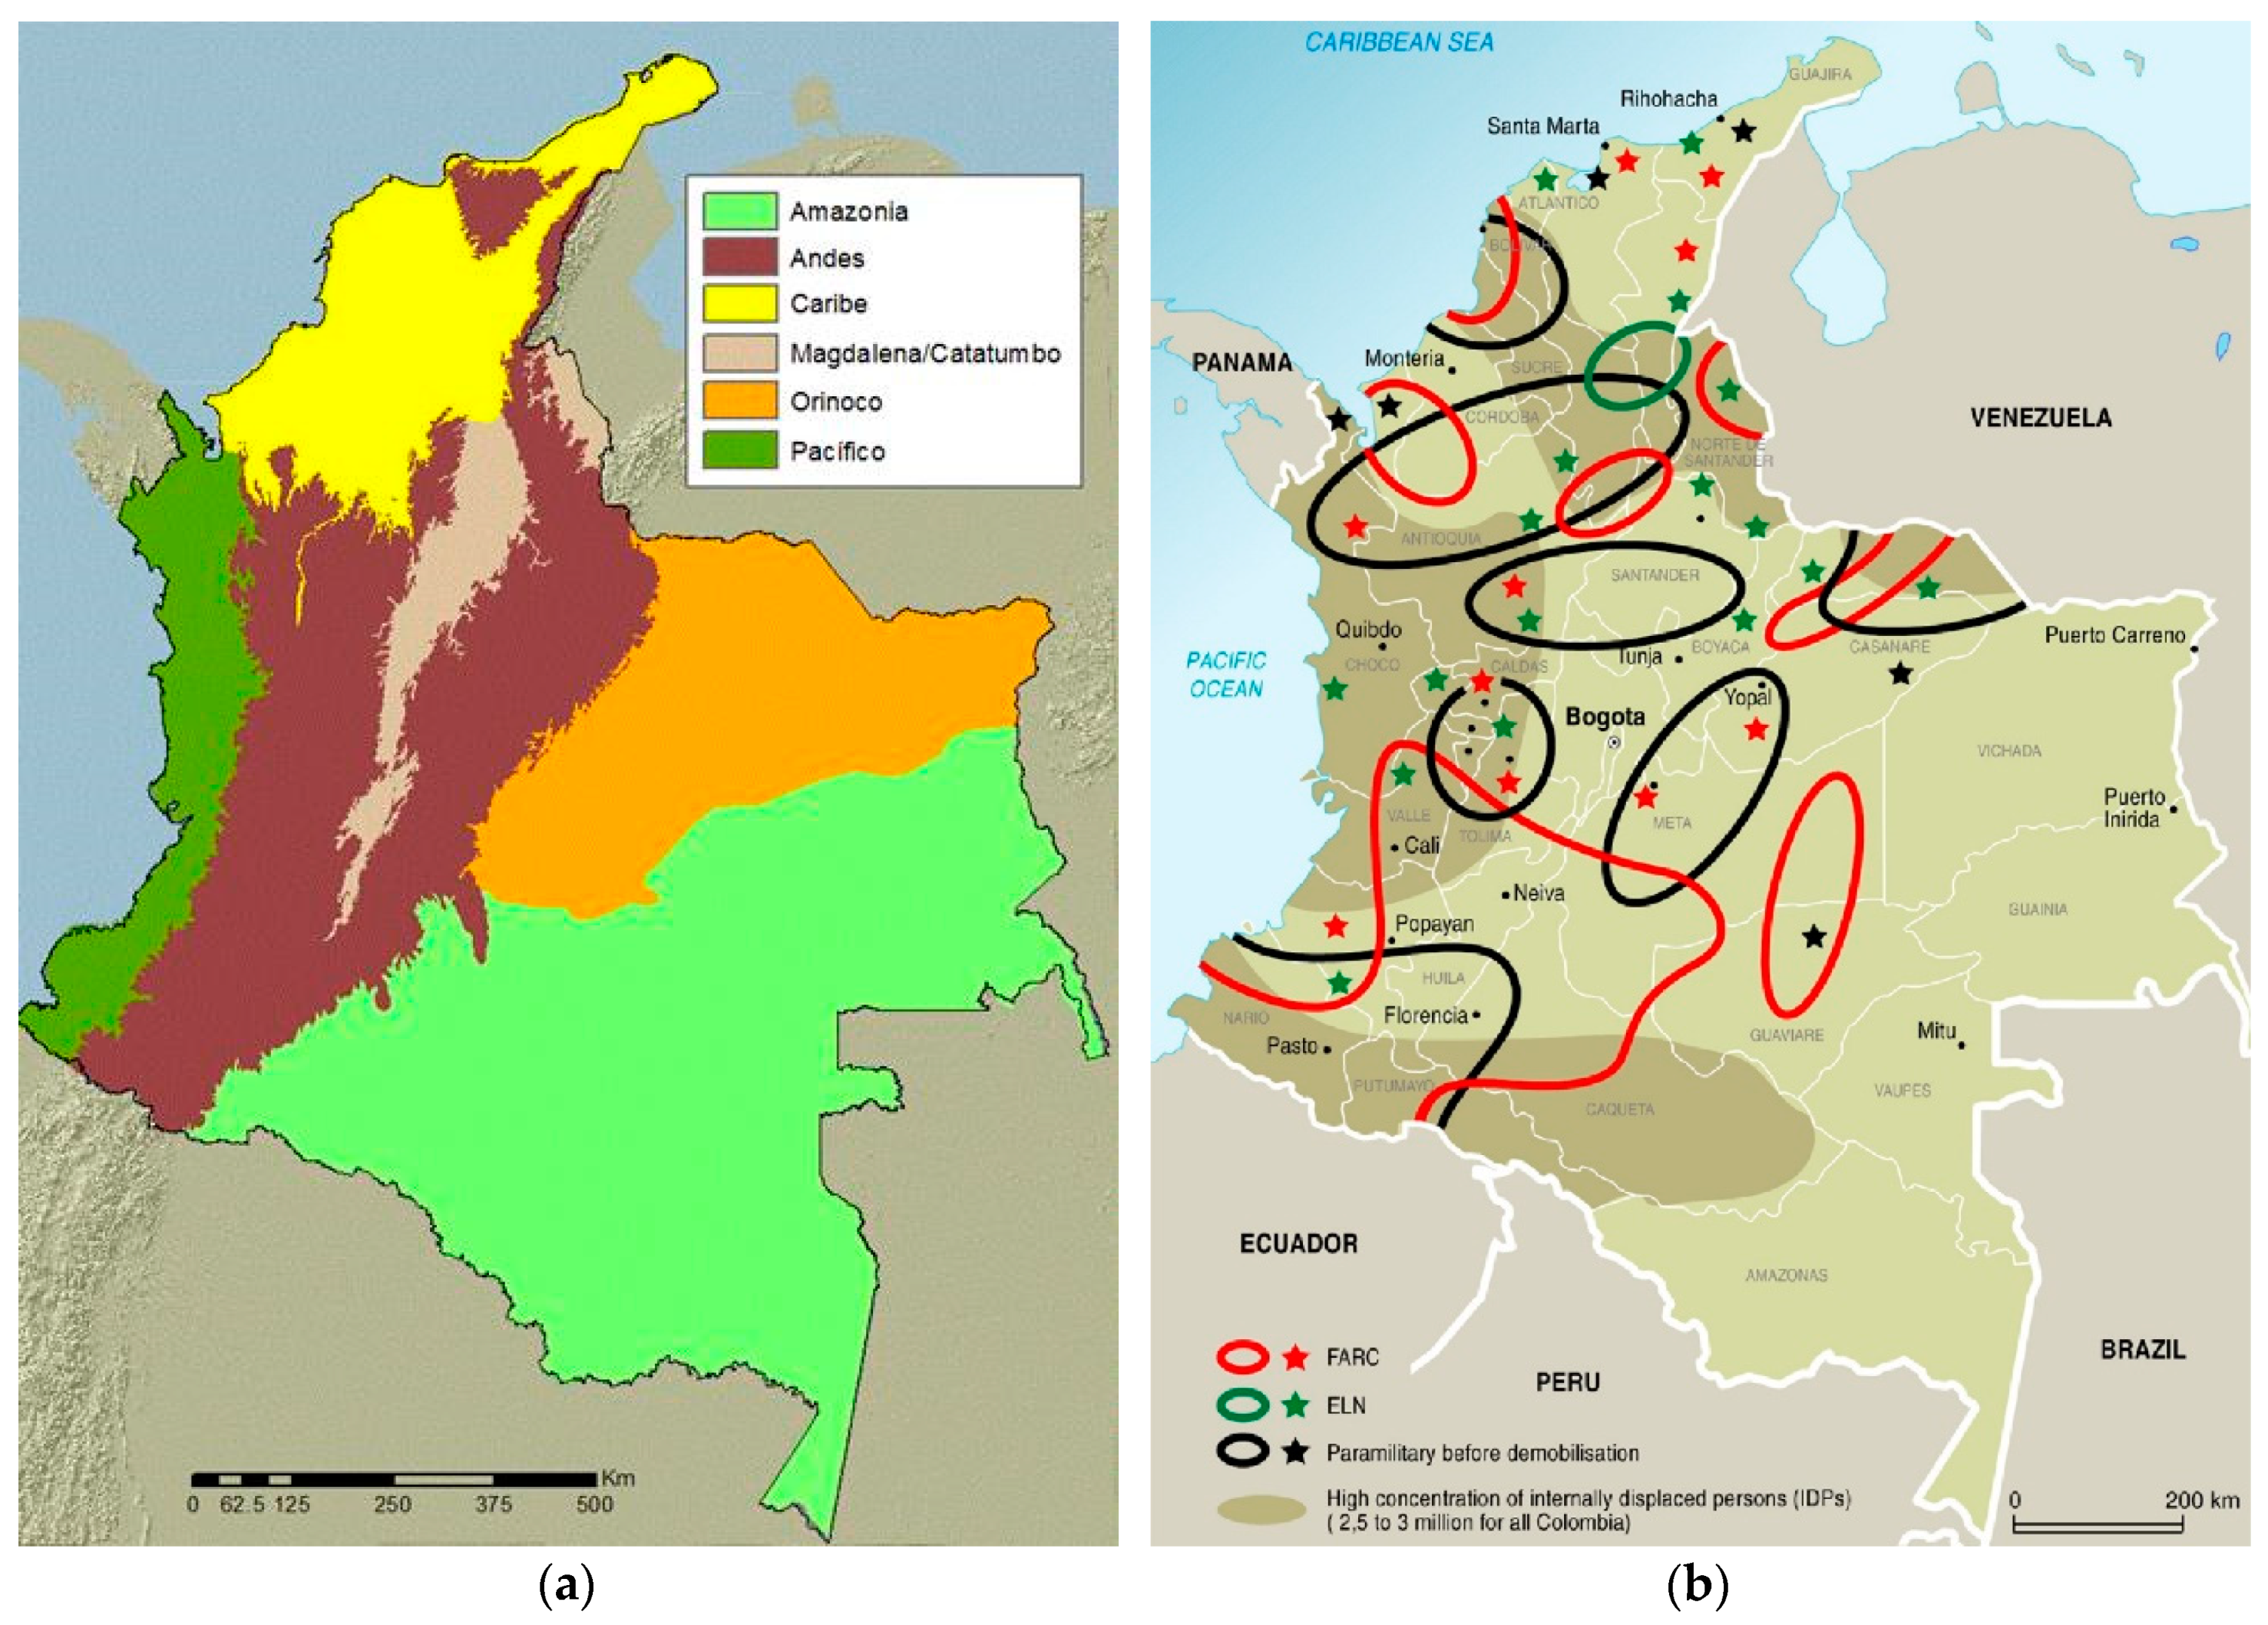
2.1. Study Area

Colombia is located in northwest South America with a land area of 1.1 million km2, and its territory is divided into six natural bio-regions: Amazon, Andes, Caribbean, Magdalena-Catatumbo, Orinoco, and Pacific (Figure 1a). Ii is a country with countless natural resources, large remnant forest areas that cover almost half of the territory, and large oil carbon, natural gas, and minerals reserves [26]. The country has high geographical variability that leads in a number of climates and ecosystems that promote a high biological diversity [40], richness, and endemism that change throughout the territory and that vary with the biogeographic conditions [41]. The topography is dominated by the Cordillera de los Andes with three mountain ranges separated by the valleys of the Cauca and Magdalena rivers; to the north is the Sierra Nevada de Santa Marta, and to the west the Serrania del Darién. To the southwest, the Orinoco savanna and the Amazonian plains, with tropical forest formations and mountains systems such as the Serrania de Chiribiquete and Macarena [40,41].
According to the DANE (National Administrative Department of Statistics), 25% of the Colombian population live in rural areas, where the forms of life are marked by multiple identities, productive organizations, and cultures [42]. Particularly, the agricultural production is increasing because of the expansion of the agricultural areas in the inter-Andean valleys, the moorland, and the tropical forest lowlands. According to the Ministry of Agriculture, 45% of the territory has been transformed to agriculture, mostly to livestock grazing, often with low environmental suitability [43]. Geographical variability and conflict history have led to areas with increased conflict (Figure 1b). These areas concentrate a larger part of the lands that make part of the LRP.

2.2. Data

The information of the lands registered in the Land Restitution Program (LRP) was provided by the Land Restitution Unit (LRU). This information was obtained in August of 2018 and may change during the awarding process. For this reason, only the properties that were georeferenced and already approved by the LRU were used (Figure 2). The data on land cover, important areas for conservation, richness, endemic species, and Red List of Ecosystems, among others, were obtained from different sources of open data (Table 1). To consider the context of the land cover dynamics and environmental characteristics of the LRP, we constructed maps of buffer zones at 1 and 5 km around the LRP and compared the differences between natural regions. The 1 km buffer was assumed as the more proximate areas to the LRP, and the 5 km buffer was assumed as the more distanced areas from the LRP, assuring independence between the areas. All data were formatted to a common grid base of 30 m resolution.

2.3. Forest Cover Change Dynamics

The analysis of forest cover change was made for the periods 1990–2000, 2000–2014, and 2014–2017, using ArcGIS.v10. We calculated the proportion of remnant forest and the changes (loss or gain) within the farms of the LRP, and their vicinity considering the 1 and 5 km buffer areas. Forest cover are represented by different types, including mangroves, wetlands, lowland forests, and Andean and high-Andean forests. The non-forest cover is represented by open vegetation, pasturelands, crops and plantations, and urban areas [46].

2.4. Kruskal–Wallis Test

With the results obtained from the forest cover, and deforestation/regeneration rates in the LRP, and buffer of 1 and 5 km, we carried out an average test using Kruskal–Wallis. The objective was to know if the behaviors of the transformation dynamics within the LRP and outside them were statistically different. Kruskal–Wallis tests were carried out both at the global national level and for each region separately.

2.5. Naturalness Index (NI)

The degree of naturalness is a valuable tool for describing the vegetation state and the status of biodiversity [60]. According to Kunttu et al. [61], forest naturalness can be defined using different criteria and specific structural variables. For this study, we evaluated the naturalness as the degree in which the natural landscape is free of perturbations associated with the society. This analysis, according to Machado [62], is graded as high, medium, and low; and the impacts considered for the analysis are, for example, forest exploitation (deforestation) and non-arid environments.
To analyze the environmental importance of the LRP areas, a naturalness index was constructed based on variables of: amount of forest cover, and the deforestation and regeneration rates (Table 2). According to Estavillo et al. [63], forest specialized species decline abruptly in landscapes below the 30% of forest cover. Additionally, according to the model of Andrén and collaborators, the threshold is located between 20% and 40% of residual habitat [64]. Based on this, we assumed a maximum residual habitat (forest cover) of 40% and a minimum of 10%. Additionally, the ranges for the deforestation and regeneration rates were selected according to the historical deforestation rates of the country.
The naturalness index was generated as the sum of the contribution of each variable in each area (Equation (1)). Its range was between 0 (minimum) and 12 (maximum). The ranges of the index were divided into: low (0–4), medium (5–8), and high (9–12).
Ftotal = Fforest + Fdeforestation + Fregeneration

2.6. Multi-Criteria Decision Analysis (MDCA) Framework

For the identification of areas of potential interest for the development of alternative land uses with a conservation approach, we implemented a MCDA [65]. It allows the integration of the criteria of interest for the identification of important conservation values such as, species and ecosystems at risk, or areas with high endemism. We built a decision tree to identify areas in terms of their potential contribution for conservation. Our aim was to identify areas in or around LRP areas with natural characteristics of interest for the conservation and sustainable use of biodiversity. We chose seven variables that describe important values for the biodiversity conservation: proximity to natural areas (DisNT), proximity to protected areas (DisSINAP), high presence of threatened species (RLS), high presence of endemic species (Endc), high richness (R), high presence of threatened ecosystems (RLE), and non-transformed areas (AreasNT) (Table 1). The layers were generated as inputs and reclassified in four values (0 to 3). This method helps to take decisions by allowing to find the maximum utility [65] of the Land Restitution Program areas. The integration of the MCDA with geographic information systems (GIS) enables to integrate and map data layers that allows a prioritization of the areas [66].

2.7. Multi-Criteria Decision Analysis Data

The spatial data was organized for the analysis and the information was constructed from data previously obtained (Table 1). A MCDA was developed and the identification of ideal LRP areas for conservation actions was realized with a GIS methodology and a weighted overlay scheme (Equation (2)). The equation was designed to obtain a score between 0 and 1 in each pixel, where the higher values indicate the most suitable areas for conservation. We used the same weight for all variables (Table 3) because we assumed equal importance for this study, as we did not have the means to outweigh any of the variables. The map algebra was realized with the variables defined for this analysis with the maps in raster format, and the results were classifieds in four classes: very high (4), high (3), medium (2), and low priority (1).
PARTi = WAreasNT × AreasNT + WRLE × RLE + WRLS × RLS + WR × R + WEndc × Endc + WDisSINAP × DisSINAP + WDisAN × DisAN

2.8. Relationship between the Priorization Areas and the Red List of Ecosystems

Areas with values 3 and 4 were selected and crossed with the RLE map [46]. The result allows one to know what ecosystems are found in these areas and in what category of threat they are classified. The percentage of each ecosystem cover was calculated for the LRP + 1 km buffer and ecosystems were tabulated with more than 5% of coverage in the LRP + 1 km or critical threat category.

3. Results

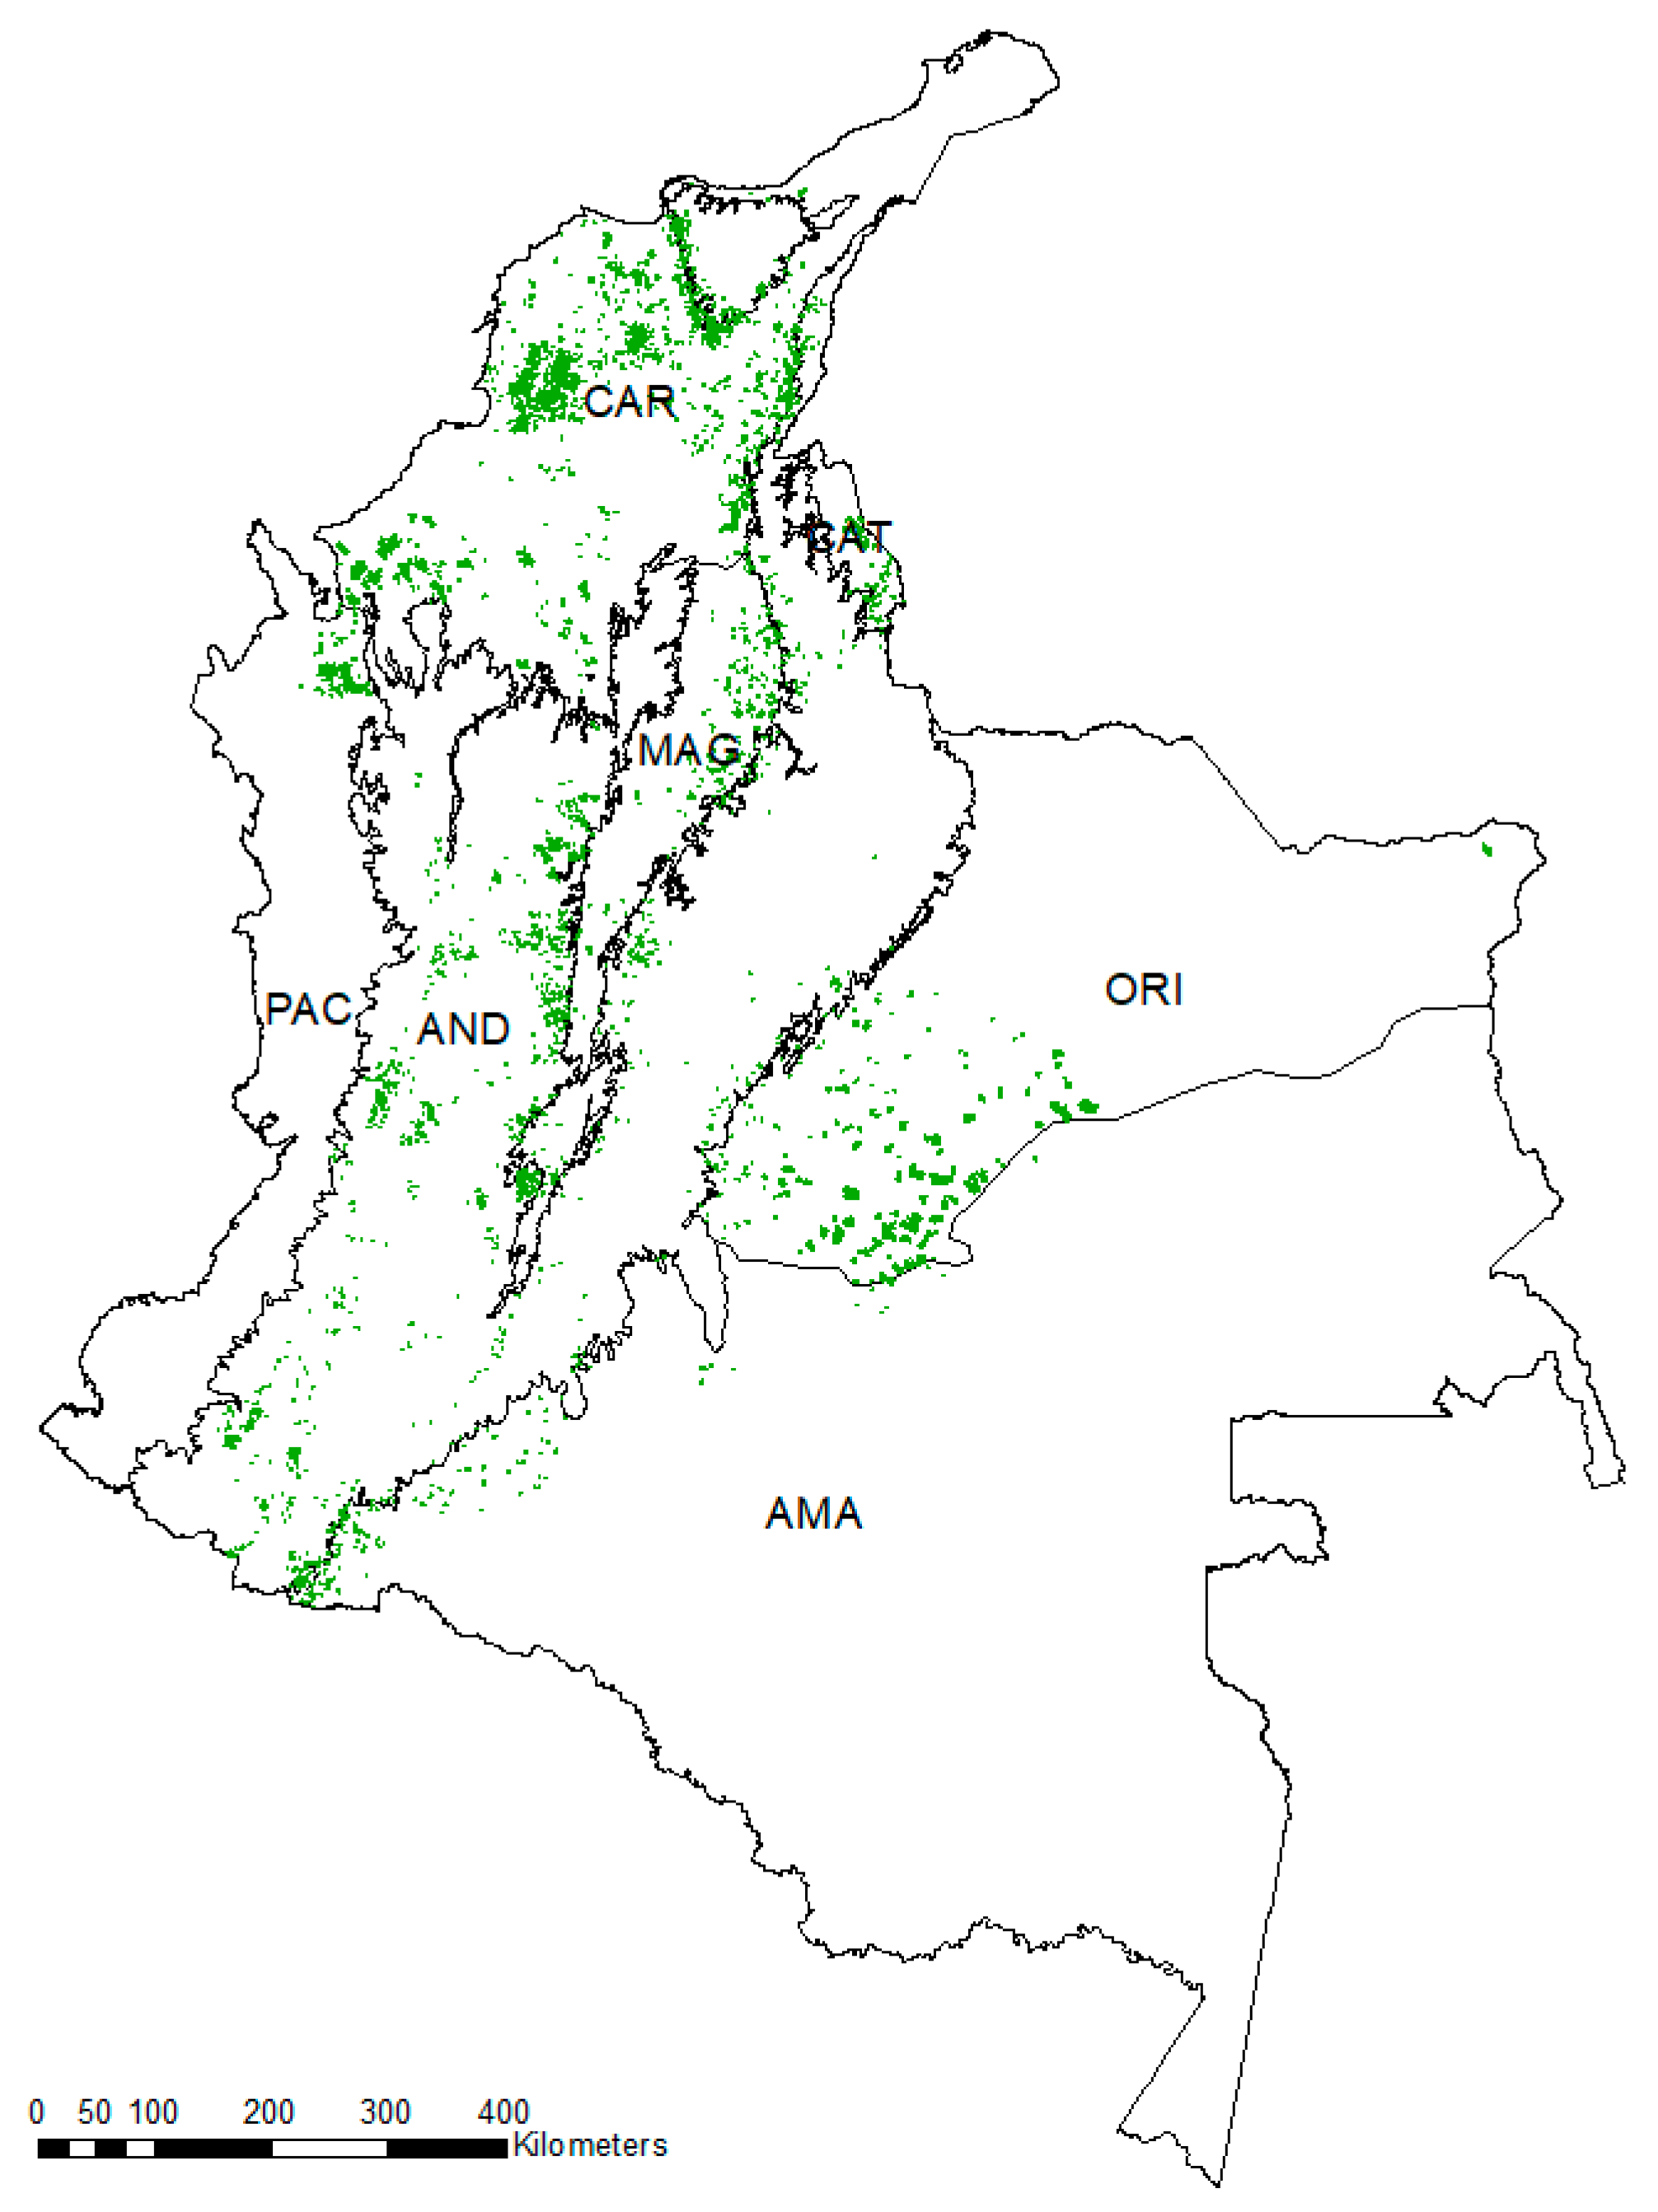
3.1. Extent and Distribution of Land Restitution Areas

The LRP used in this study were located in the six bio-regions of the country, and they covered 1,119,959 Ha at the national level (Table 4). For the solicitations up to August 2018, it was found that the Caribbean region had the largest percentage of LRP with 46.3%, the Orinoco with 30.4%, and the Andean region with 13.7%. However, at the municipality level the higher values of LRP were Mapiripán (Orinoco), and San Jacinto, and San Juan Nepomuceno (Caribbean) (Appendix C; Table A6).

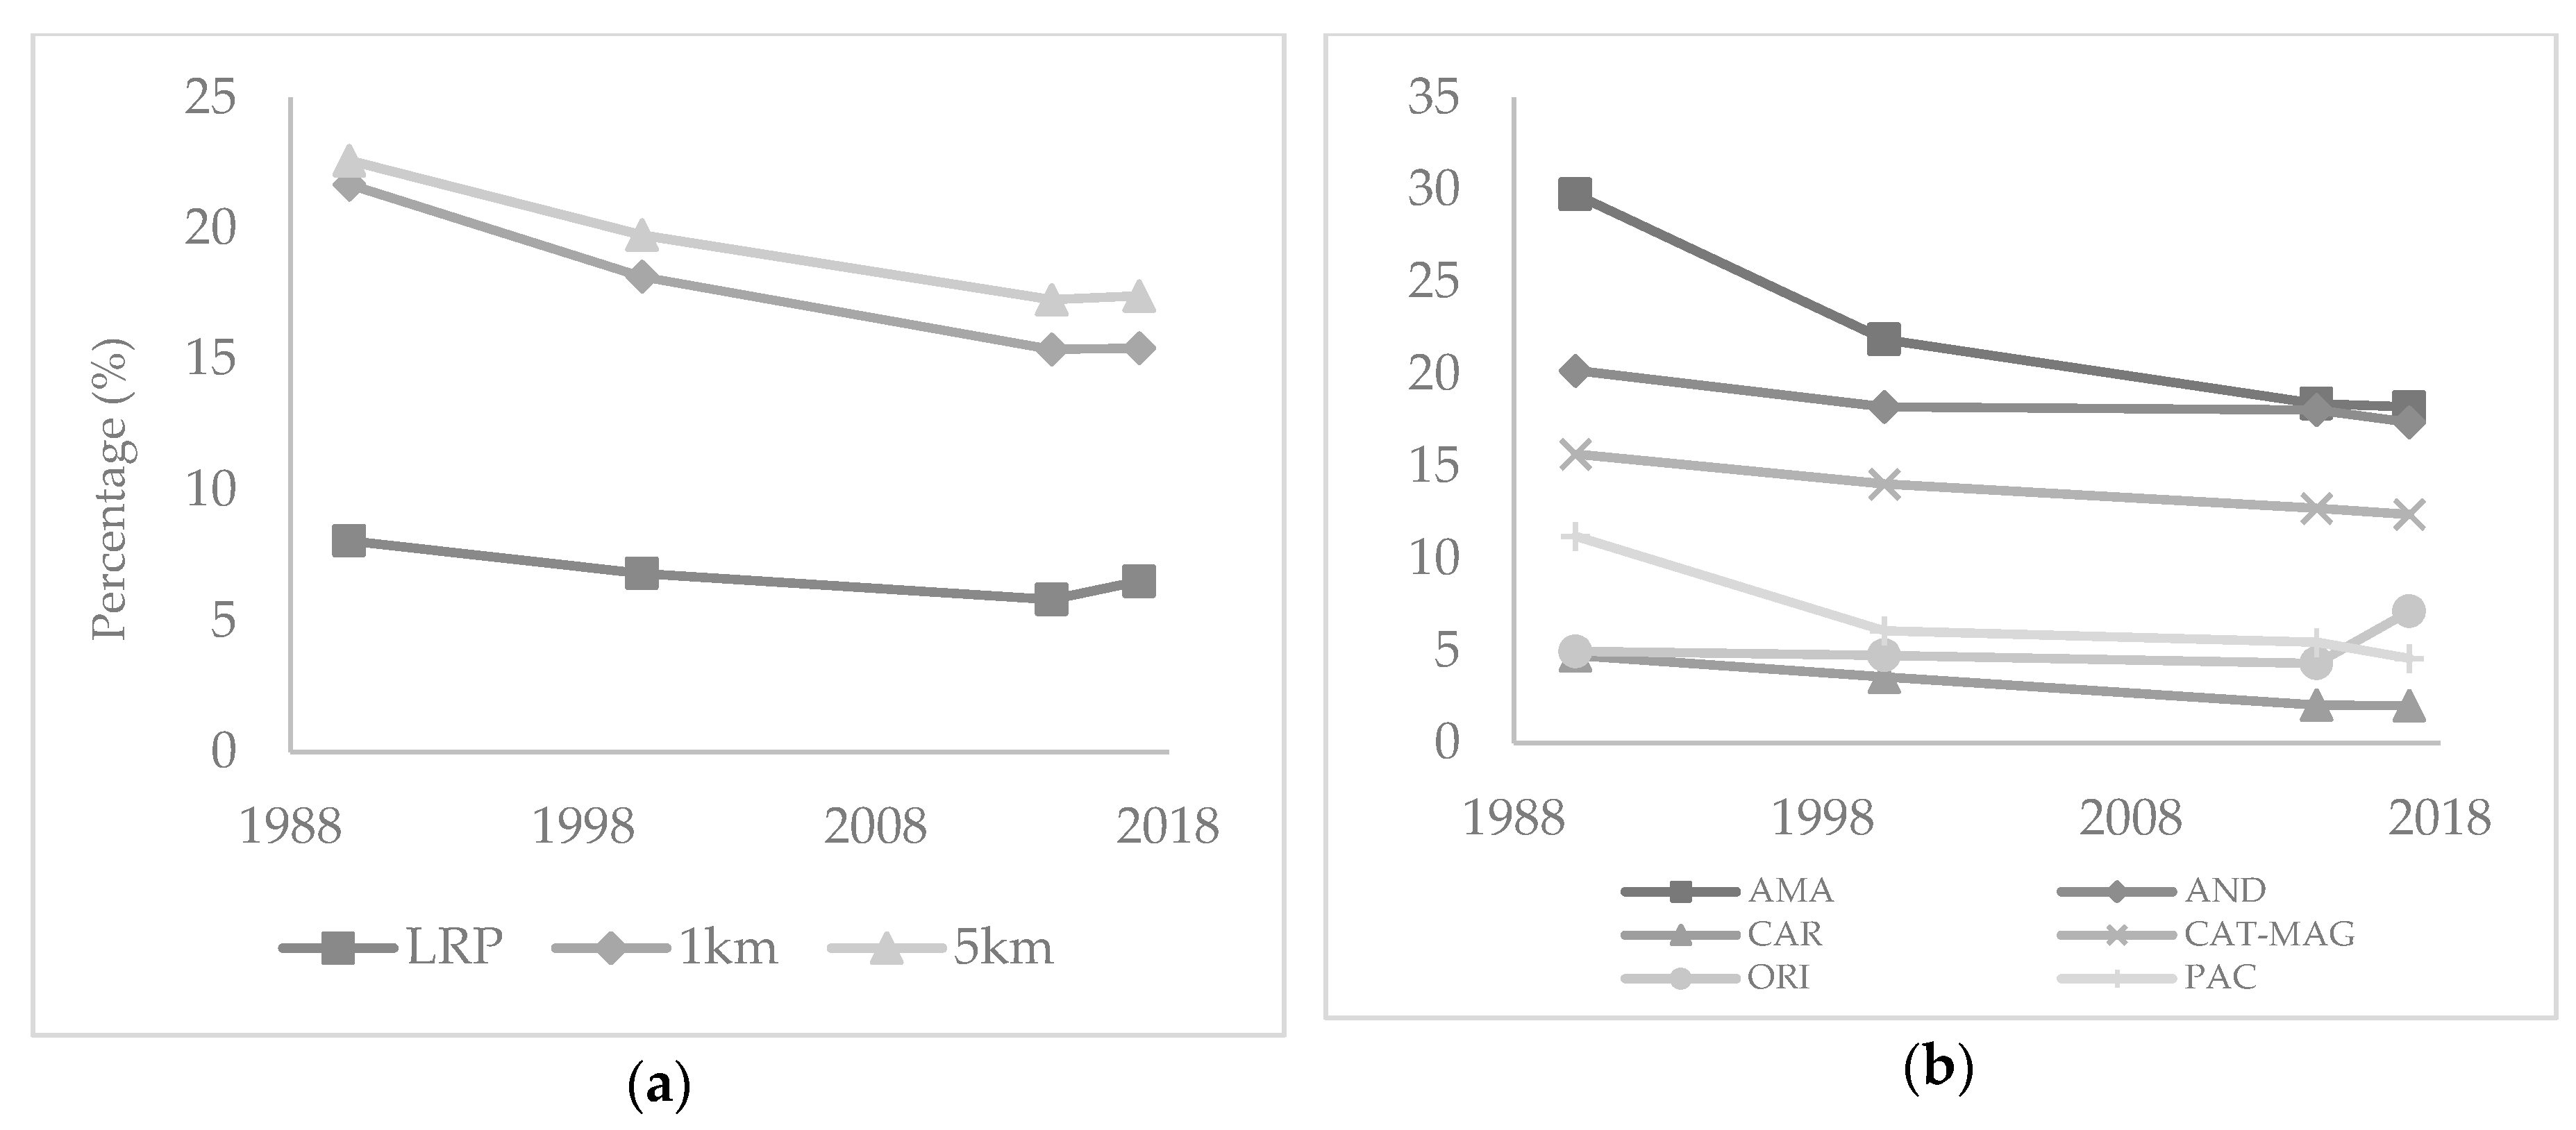
3.2. Forest Cover Change 1990–2017

The forest cover in the LRP and their buffers (Figure 3a) decreased at the national level, approximately 8% in the LRP and between 20% and 23% in the buffers of 1 km and 5 km, respectively. For the year 2017, the forest cover in the LRP decreased to 7%, and to 15% and 18% in the buffers. For the period 2014–2017, forest cover increased in the LRP but remained stable in their surroundings (buffers).
At the regional level, the Amazon had the highest forest cover for 1990 in the LRP (29%), 1 km (43%), and 5 km buffer (39%) (Appendix A; Table A2); for the Andean and Catatumbo-Magdalena the forest cover between 2014 and 2017 was more stable. Although the forest cover in the Amazon decreased, in 2017 this region maintained the highest forest cover in the LRP (Figure 3b). In the buffers, the region with the largest percentage of forest cover was the Andes. So, for 2017, none of the regions had more than 20% of forest cover in the LRP, 24% and 40% in the 1 km and 5 km, respectively; and some regions, like the Caribbean and Pacific, had less than 10%.
On the order hand, the annual deforestation rate for the LRP and buffers at national level increased from 1990 to 2017. Additionally, the rate in the LRP and its buffers for 2017 was two to three times greater than for 1990, 2000, and 2014 (Appendix A; Table A1). Although, at regional level, between 2000 and 2014, the deforestation rates decreased in the Amazon and Pacific regions, but they increased for 2017; in the 1 km and 5 km buffer, they decreased in the Pacific region between 1990 and 2017; and the region with the least deforestation rate was Orinoco (3.8%/per year) (Appendix A; Table A3). For the period 1990–2017, all the regions in the LRP increased the deforestation rate (>3%/per year). In the 1 km buffer the Caribbean region (6.3%/per year) and in the 5 km buffer the Catatumbo-Magdalena (5.5%/per year) were the regions with higher deforestation rate for 2017. Additionally, the annual regeneration rate increased in the LRP and in the buffers from 0.5% to more than 5% per year. This is reflected in the increase of the rate in the LRP and the buffers (Appendix A; Table A4) of all the regions except the Pacific. Furthermore, in 2017, the regeneration rates were above 3% per year in the LRP and in the buffers, but in the Orinoco region the regeneration rate was five times the rate of the other regions and two and a half times the national regeneration rate of the Land Restitution Program areas.

3.3. Average Test

The null hypothesis indicated that the average of the forest cover, deforestation, and regeneration rates were statistically equal in the LRP, the 1 km, and 5 km buffers; the alternate hypothesis indicated that the averages were different. By accepting the alternate hypothesis, it is accepted that the transformation dynamics of the LRP and the buffers were different from each other, with a p-value < 0.05.
The results of the Kruskal–Wallis test (Appendix B; Table A5), for the forest cover for 1990 in the LRP and in the buffers, resulted in the rejection of the null hypothesis because the p-value was less than 0.05 at the national level and in all the regions except the Amazon and the Pacific. This means that for this year, the proportion of forest cover in the requested areas was statistically different to its nearby areas and more distant ones. For the rest of the years, the forest cover of all the regions and at the national level was statistically different between the LRP and the 1 km buffer; but between the LRP and the 5 km buffer, only at the national level and in some regions. The average comparison of the rate of deforestation for the periods 1990–2000 and 2000–2014 resulted in the rejection of the null hypothesis. This means that the deforestation rate of the LRP and the buffers in 1990–2000 and 2000–2014 were statistically different, unlike the results in the period 2014–2017, in which the Amazon and the Pacific were statistically equal between the LRP and the buffers. For the regeneration rate, at the national level all the tests resulted in the acceptance of the alternate hypothesis; at the regional level, only the regeneration rate in the Andean region was statistically different, in the LRP and the 1 km and 5 km buffers. Additionally, the regions that had the higher amount of acceptance of the alternate hypothesis were the Andean and Caribbean, and the Pacific was the one with the higher amount of rejection of the alternate hypothesis.

3.4. Naturalness Index

According to the NI proposed for the determination of the environmental importance, only 9.4% of the Land Restitution Program areas had high naturalness (Table 5). These areas were mainly found in the Andes and the Catatumbo-Magdalena, south of the department of Tolima, near the Flora and Fauna Galeras Sanctuary, on the border with Panamá and in the department of Santander (Figure 4). Therefore, these areas were distributed in almost the entire territory (Appendix C; Table A6). On the other hand, 81.1% of the LRP showed low level of NI, of which more than 70% had a value of 0 naturalness. This is explained by the low levels of forest cover, high deforestation, and low regeneration. Likewise, 9.4% of the requested areas were in the middle range. These areas were located on the border between the Andes and Amazon, in the department of Santander and near Cerro Tamá and the Nevado del Ruiz.

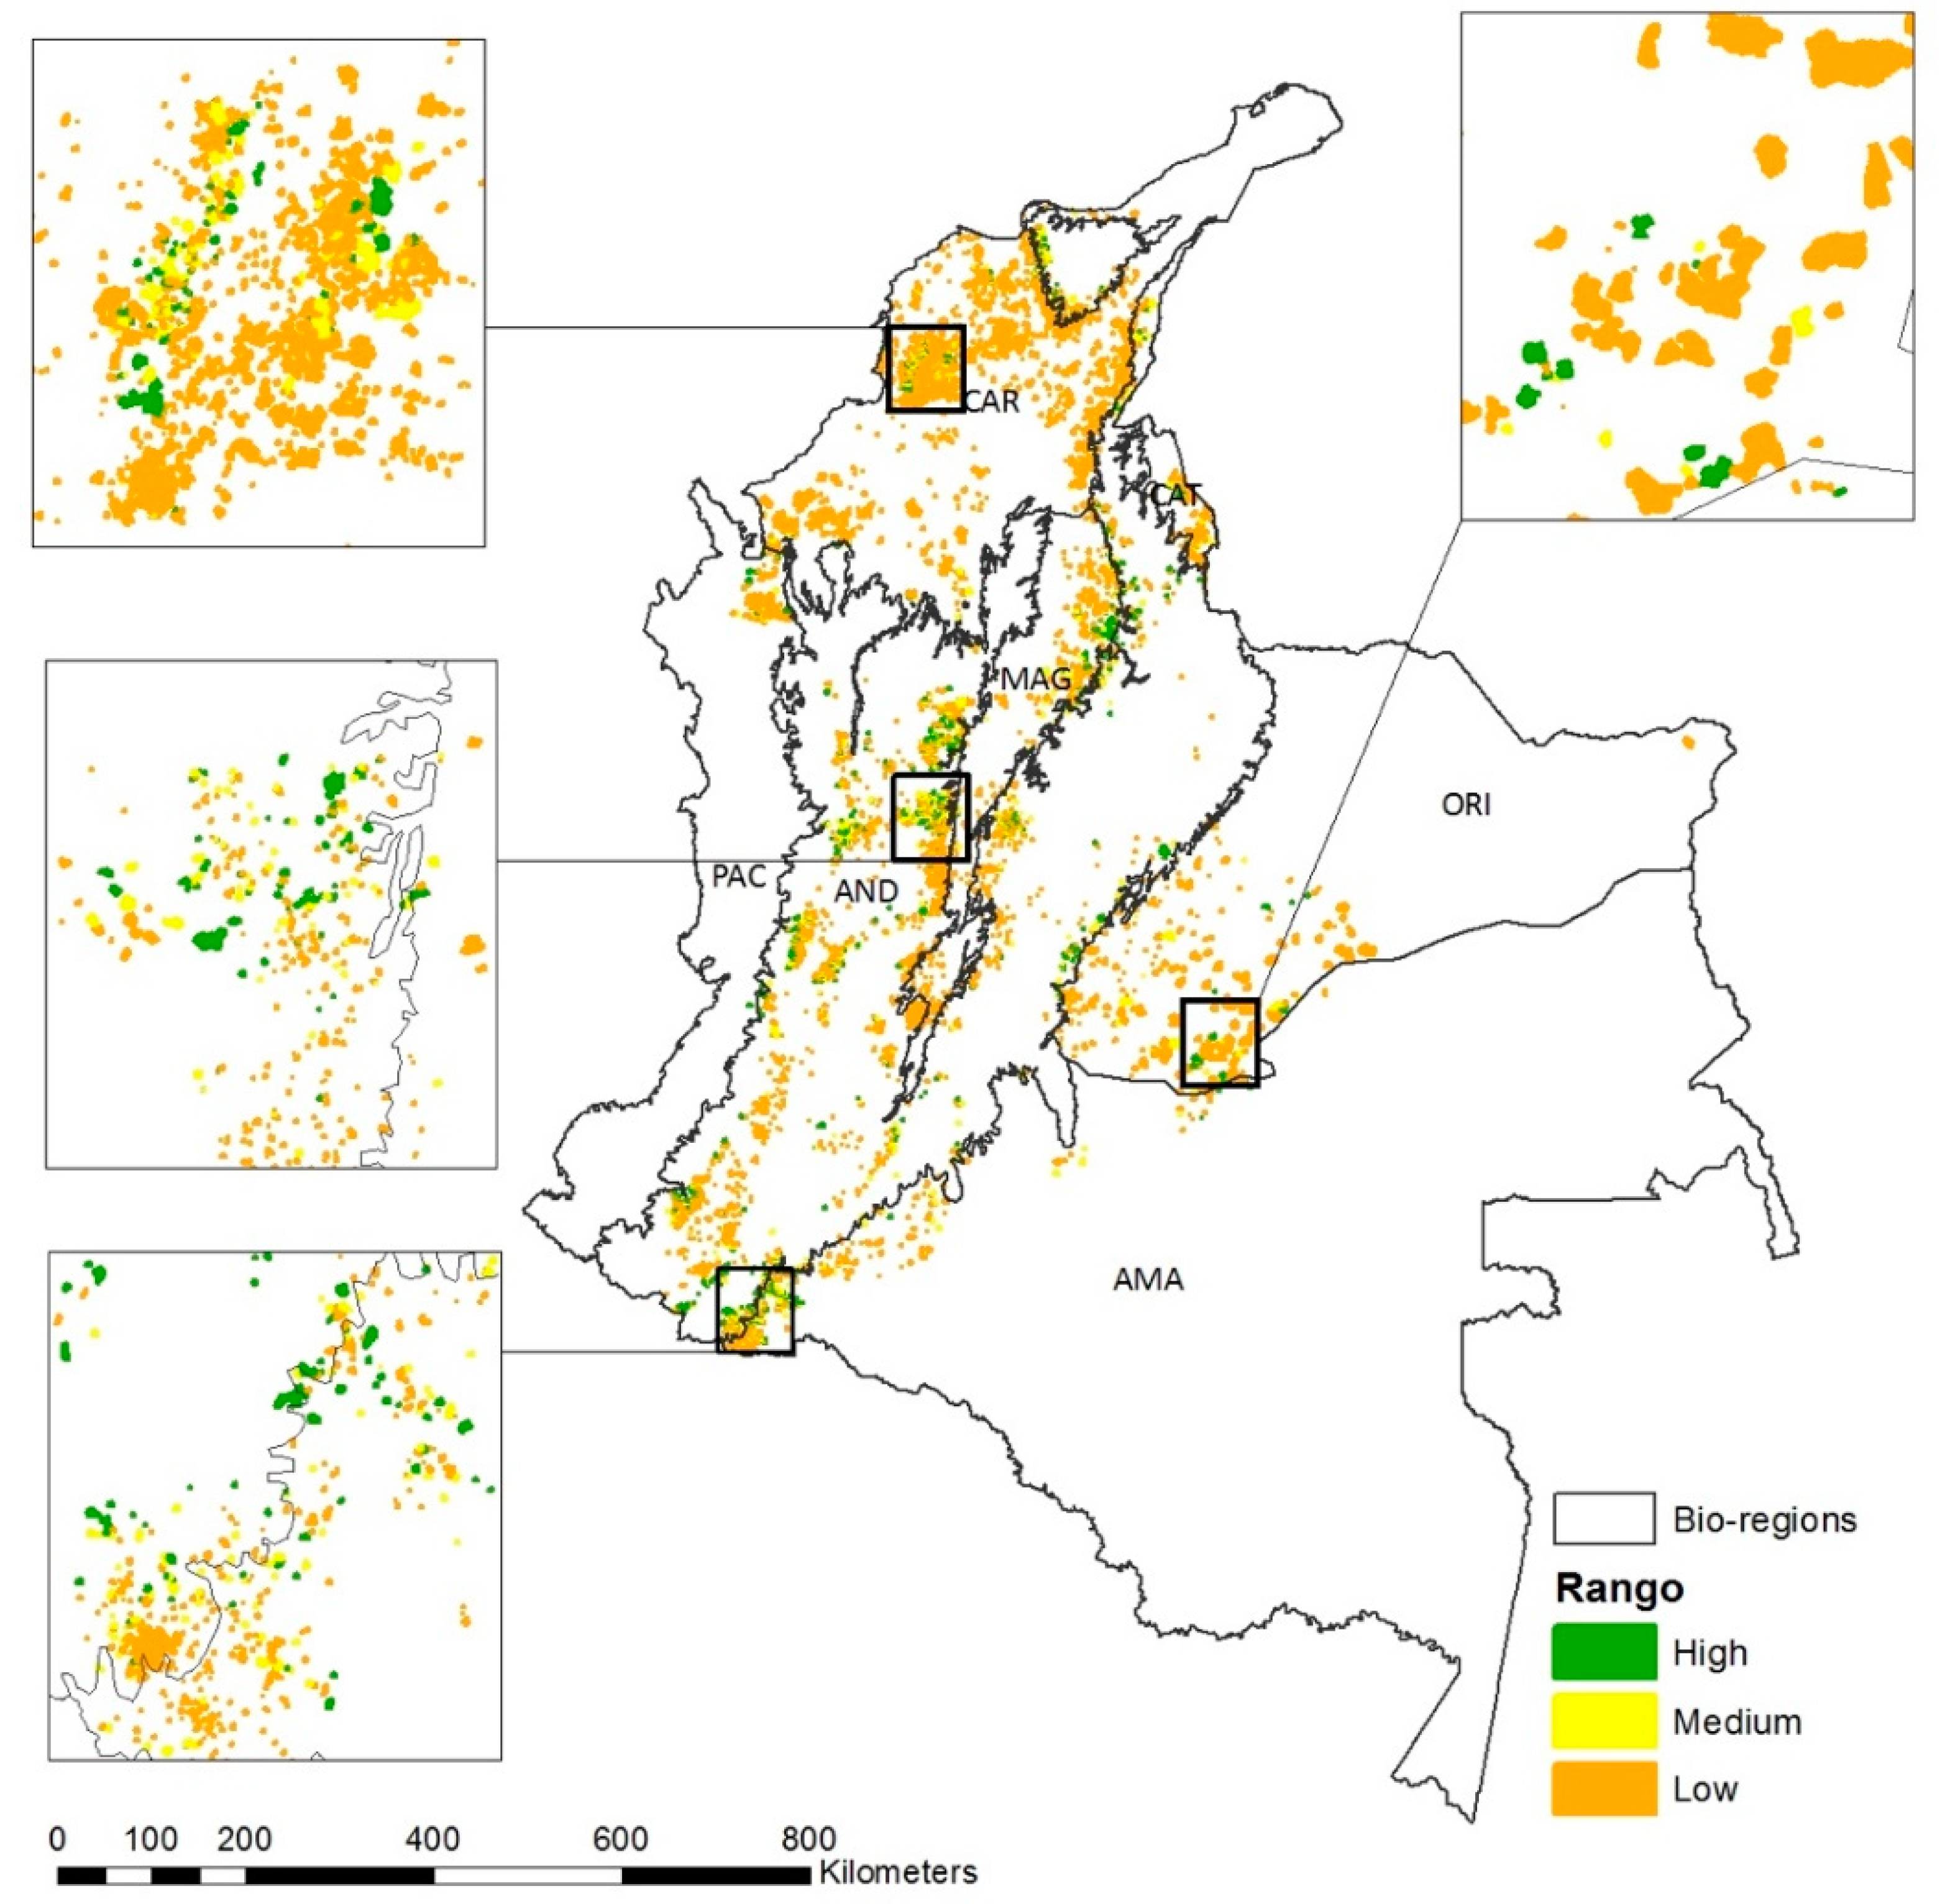
3.5. Distribution and Area of the LRP + 1 km with Importance for the Conservation

In general, the LRP + 1 km had middle values of importance for the conservation. Nevertheless, some sectors in the Andean, Caribbean, and Orinoco regions presented high values, making these areas of interest for conservation, particularly in the municipalities Cumaribo, Solano, and Mirití-Paraná (Table 6). The 18% of the LRP presented a high value and only 0.2%, in the Andean region, a very high value (Figure 5). Additionally, the Caribbean region presented the higher percentage of areas in the low and middle values, while the rest of the regions presented the major percentage of the LRP + 1 km in the middle and high categories. From above, the high priority areas were those that concentrate high naturalness, richness, endemism, threat to ecosystems and species, and proximity to natural and protected areas.

3.6. Ecosystem Representation in the LRP

The LRP + 1 km with high values for conservation (values 3 and 4) were located in different ecosystems, in all the regions except the Caribbean. 21% of the LRP + 1 km with high conservation areas were located in the tropical lowland forests of the rolling plains of the Amazon foothills and Pacific lowlands, while another 21% were located in the forest of the Amazon and Pacific regions; only 7% were in in humid Andean hill and mountain forests. Small areas that account for 3% of the LRP + 1 km encompass dense wetland tropical forests of the pacific region, which are classed as critically endangered. In general, 2.45% and 3.42% of the LRP + 1 km, were related with Critical (CR) and Endangered (EN) ecosystems, respectively (Table 7).

4. Discussion

The Land Restitution Program is one of the country’s greatest challenges in the current post conflict period. This process implies the recognition of the victims and of the dispossessed and abandoned lands. In this new period, the understanding of the dynamics of transformation of these areas during the armed conflict is important as it can deliver knowledge on their environmental status and values, to envisage sustainable use of resources and land that can also ensure the conservation of priority ecosystems, while providing economic benefits to the victims and the maintenance of their ecosystem services.

4.1. Forest Cover, Deforestation and Regeneration Rates

Deforestation has had negative effects in several countries with internal armed conflict, such as Sierra Leone, Liberia, and Rwanda [20]. In the same way, areas of the Land Restitution Program in Colombia, where a decrease in the forest cover during the years of the conflict was evident, has seen negative effects for biodiversity conservation, forest regeneration, and carbon capture in the LRPs [67]. However, we show that land cover dynamics differ in LRPs at the regional level. These differences can be explained by socioeconomic factors, armed actors, population density, land uses, and concentration of the agricultural development [26].
Although there is a decrease in the forest cover of the LRP and buffers, there is also forest regeneration in the study period, in some of the regions. This dynamic has been identified in other studies on FNF cover in Colombia [26,68,69,70], and two important factors have been identified that explain the regeneration: the intensification of the armed conflict resulting in greater abandonment and dispossession of lands; and the globalization of the market that generates the decrease of area and production of some crops [12,26,71].

4.2. Regional Dynamics

The results of the transformation dynamics show that the areas are conditioned by the armed conflict and the socioeconomic conditions of the regions. The Caribbean and the Andes have the highest population and population density [72], as well as higher economic growth and the presence of the AUC, which have been identified as an important variable in the processes of deforestation and regeneration of the forest cover [11]. The Orinoco presents the major percentage of land dispossession and presence of armed groups [73]. In addition, these regions with Catatumbo-Magdalena have forest loss and recovery statistically different from national dynamics. These depend on the landscape of the region, the availability of resources, and the importance of the territory for the control of the population [4].
The Pacific and Catatumbo-Magdalena have suffered the highest percentage of displacement of rural population. Despite this, there is no evidence of increase of forest cover in the areas requested in these regions. Additionally, in the Pacific, some of the requested areas already have crops and clean pastures, making this a possible incentive for the expansion of these uses to another LRP in the region. Likewise, the results of this study are different from those found by Sánchez-Cuervo and Aide [26] in their study on the consequences of the armed conflict in the forest cover in Colombia. This can be explained because, unlike the mentioned study, only the requested areas for land restitution are being analyzed.
For its part, the Orinoco has a high presence of illegal groups, accompanied by high population migrations due to the discovery of oil wells in the departments of Arauca and Meta, which led to a rapid socioeconomic development, with high rates of land transformation for the establishment of large areas of livestock or crops [26,74]. This region has been strategic for the development and organization of armed groups (FARC and ELN) [4], causing forced displacement that is translated into areas of PRT. In particular, the areas requested in this region could be the first to rejoin the agricultural frontier, due to their potential for the development of crops, pastures for livestock [19], and their location in mosaics of crops and pastures. It is necessary to consider that the landscape of the Orinoco is dominated by tropical savannas and gallery forests, and that the forest transformation is the only dynamic studied in this investigation, but not the transformation dynamics of other land covers. On this particular, it would be necessary to carry out a study in the transformation of the specific land covers of the Orinoco during the years of conflict, allowing one to know the loss or conservation of these in the same period.

4.3. Environmental Quality of the LRP

The fact that only 9.4% of the LRP have high NI, shows the few opportunities for forest cover conservation in these areas. These areas are not located in a single region, they are immersed along with areas of low and medium NI. This could be an important point when considering restoration processes of the mid-range areas; meaning processes of restoration could contribute to the structural connectivity of the forest and to the recovery of threatened ecosystems. On the other hand, the areas of low NI have lost most of its forest cover and have high deforestation; confirming the hypothesis that the areas of conflict suffered from deforestation dynamics.

4.4. Distribution and Extension of the LRP + 1 km Important for Conservation

Most of the areas where the armed conflict was concentrated are found in forest covers near agricultural frontiers [75]. The LRP areas where the dynamics of displacement, dispossession or abandonment, illegal extraction of resources, and conservation to point of gun generated heterogeneous processes of conservation and deforestation that resulted in mosaics and an equally heterogeneous distribution of areas, with high and low importance for conservation.
Nevertheless, the LRP + 1 km of very high priority for conservation are located in the whole Andean region, where high richness and endemism, as well as ecosystems and species in some state of risk [44] and presence of protected areas, are found. In contrast, the Caribbean has the higher presence of areas with low importance for conservation. This region has been characterized by long processes of transformation of the land by mining and livestock activities [76] that have added high risk to important ecosystems like the tropical dry forest, leaving it with low possibilities of areas with potential for conservation [26], and there are not many terrestrial protected areas. It is important to present special attention to the municipality of Cumaribo, the only area with high LRP, high NI, and high conservation importance; and Mapiripán, which has high LRP and high NI.

4.5. Possible Land Use Alternatives

The Land Restitution Program is an invitation, for the victims, to return to their territories. Depending on the process, rapid changes in land use could be generated towards agricultural and extractive activities, as has occurred in countries like Cambodia and Liberia [14,16], with high environmental costs. This process will also lead to the construction of new roads and the development of extractive, legal, and illegal activities, compromising the resilience of forests and impacting biodiversity and ecosystem services [77]. In Colombia, recent data on forest dynamics are being published, and deforestation rates have doubled since the end of the conflict [47]. This is why LRPs with high conservation values are an opportunity to promote alternative practices of development that include the extraction and sustainable production of resources and ecotourism.
Additionally, areas with high conservation values could be used for programs of ecotourism or bird watching, with the support of local communities and landowners, as proposed by Maldonado et al. [78]. Likewise, these areas include ecosystems with risk categories, according to the RLE [44], where it would be important to carry out ecological restoration processes with incentives for landowners for tree plantation, management of forest areas, and preservation of forest remnants, with potential for the improvement of ecosystem services, socio-ecological resilience, and sustainable development [77]. In addition, territorial and watershed management plans could be considered, including the diversity of forests and habitats that contain these areas as critical areas for conservation, provision of ecosystem services, and alternative economic benefits to economic extractive activities [79]. In areas of medium or low biodiversity conservation values in turn, silvicultural and agrosilvicultural programs can be implemented, to help restore the ecosystem process.

5. Conclusions

Our study shows that in spite of land abandonment or dispossession processes that occurred in the LRP areas, the economic activities and/or land transformation did not cease, implying the presence of other actors. However, although loss and gain of forest cover continued, the dynamics of these processes is statistically different from the surrounding areas, in particular in the Andean, Orinoco, and Caribbean regions.
The lack of NI differences reinforces the later, given that the LRP areas studied have low NI, showing the consequences of the conflict and other dynamics of exploitation and land transformation. Although some areas of high naturalness were identified, great efforts would be needed to make these areas important for ecological restoration processes.
The most important LRP areas in terms of conservation opportunities in ecosystems at risk and NI areas, are mostly found in the Andes, Orinoco, and Caribbean regions. In these areas, management actions should be oriented to support suitable land use alternatives for the victims, ensuring that more sustainable development options are put in place. We provide a model of analysis that can be applied in other countries with a long history of armed conflict and provide information for understanding the conservation opportunities in the post-conflict period.

Author Contributions

Conceptualization, M.U. and A.E.; data curation, M.U.; formal analysis, M.U. and A.E.; investigation, M.U. and A.E.; methodology, M.U. and A.E.; project administration, M.U.; resources, A.E.; supervision, M.U. and A.E.; validation, M.U. and A.E.; visualization, M.U.; writing—original draft, M.U.; writing—review and editing, A.E.

Funding

this research received no external funding.

Acknowledgments

We would like to thank the experts who evaluated the proposal of this study: Armado Sarmiento and Camilo Correa; and to Jorge Bonil from the Land Restitution Unit.

Conflicts of Interest

The authors declare no conflicts of interest.

Appendix A

Table A1. Deforestation and regeneration rates for the LRP and buffers at the national level.
DeforestationRegeneration
PeriodArea (Ha)Rate (%/year)Area (Ha)Rate (%/year)
LRP1990–200017,3521.9233830.37
2000–201422,8902.1411,7371.1
2014–201784064.317,7439.07
1 km1990–2000145,5232.0329,2160.41
2000–2014183,3652.1891,5071.09
2014–201770,7954.6586,5185.68
5 km1990–2000593,2311.62154,6930.42
2000–2014816,5641.83416,4270.93
2014–2017332,4773.97478,3505.71
Table A2. Forest cover percentage of the LRP and buffers at the regional level.
PeriodAmazonAndesCaribbeanCat-MagOrinocoPacific
LRP199029.7720.214.7515.674.9811.22
200021.8918.243.5914.054.766.10
201418.4118.072.0712.734.325.46
201718.2317.402.0312.407.154.59
1 km199043.3929.6611.2922.7414.2127.54
200029.0226.198.6820.7213.1317.53
201422.3824.335.2916.9211.5715.67
201721.3223.685.2016.3716.2213.27
5 km199039.5732.348.5920.4811.3235.30
200029.0329.356.4319.1010.7228.81
201423.3326.884.4415.819.5026.81
201723.2526.034.4815.5814.0922.41
Table A3. Deforestation rate of the LRP and buffers at the regional level.
PeriodAmazonAndesCaribbeanCat-MagOrinocoPacific
LRP1990–20003.041.432.501.731.054.69
2000–20141.711.423.862.531.272.78
2014–20175.223.466.015.233.676.77
1 km1990–20000.640.274.675.181.3810.49
2000–20142.061.743.732.611.522.34
2014–20175.424.096.315.663.895.84
5 km1990–20000.650.117.643.550.909.84
2000–20141.871.513.592.401.551.70
2014–20174.913.355.735.543.965.29
Table A4. Regeneration rate of the LRP and buffers at the regional level.
PeriodAmazonAndesCaribbeanCat-MagOrinocoPacific
LRP1990–20000.400.450.040.690.610.12
2000–20140.571.350.841.870.612.04
2014–20174.943.975.274.3925.501.72
1 km1990–20000.340.011.310.540.541.24
2000–20140.421.230.941.300.671.58
2014–20173.924.765.654.5417.281.27
5 km1990–20000.300.012.450.620.521.43
2000–20140.440.911.371.170.741.21
2014–20174.604.536.055.0520.111.17

Appendix B

Table A5. Test results for the differences between the LRP areas and their surroundings (buffer areas) using Kruskal–Wallis tests.
CountryAmazonAndesCaribbeanCat-MagOrinocoPacific
Forest – No Forest (FNF) 1990LRP-1 km<0.00010.195<0.0001<0.0001<0.00010.0000.053
LRP-5 km<0.00010.7880.014<0.00010.8220.0470.243
FNF 2000LRP-1 km<0.00010.000<0.00010.016<0.0001<0.00010.049
LRP-5 km<0.00010.5300.365<0.00010.5420.1840.003
FNF 2014LRP-1 km<0.0001<0.0001<0.0001<0.0001<0.0001<0.0001<0.0001
LRP-5 km<0.0001<0.00010.494<0.00010.004<0.00010.621
FNF 2017LRP-1 km<0.0001<0.0001<0.0001<0.0001<0.0001<0.0001<0.0001
LRP-5 km<0.0001<0.00010.001<0.00010.001<0.00010.749
Deforestation 90–00LRP-1 km<0.0001<0.0001<0.0001<0.0001<0.0001<0.0001<0.0001
LRP-5 km<0.00010.016<0.00010.003<0.0001<0.0001<0.0001
Deforestation 00–14LRP-1 km<0.0001<0.0001<0.0001<0.0001<0.0001<0.00010.002
LRP-5 km<0.0001<0.0001<0.0001<0.0001<0.0001<0.00010.805
Deforestation 14–17LRP-1 km<0.00010.064<0.0001<0.00010.002<0.00010.441
LRP-5 km<0.00010.747<0.0001<0.0001<0.00010.1940.361
Regeneration 90–00LRP-1 km<0.00010.048<0.00010.004<0.0001<0.00010.048
LRP-5 km<0.00010.456<0.00010.006<0.00010.0130.625
Regeneration 00–14LRP-1 km<0.00010.593<0.00010.8810.001<0.00010.997
LRP-5 km<0.0001<0.0001<0.00010.001<0.00010.2690.105
Regeneration 14–17LRP-1 km<0.00010.878<0.0001<0.00010.441<0.00010.002
LRP-5 km<0.00010.011<0.00010.219<0.0001<0.00010.029
The numbers in bold font indicate the test that accepted the alternate hypothesis.

Appendix C

Table A6. Municipalities with high area of land restitution, IN and MCDA.
LRPINMCDA
Mapiripán57.1715.717
San Carlos 5.717
San Juan Nepomuceno 3.811
San Jacinto 3.811
Villavivencio 1.906
Puerto Gaitán 1.906
El Copey 1.906
Sabana de Torres 1.906
Rionegro 1.906
Cimitarra 1.906
San Martin19.057
Turbo17.151
El Carmen de Bolívar13.340
Puerto Lopez11.434
Valencia11.434
Cumaribo9.528 462.339
Morroa7.623
Cúcuta7.623
Chivolo7.623
Solano 399.419
Mirití-Paraná 165.493
Santander 145.072
San José del Guaviare 140.689
Pacoa 135.895
Mitú 134.565
La Pedrera 133.410
Puerto Arica 132.234
La Primavera 130.303

References

  1. Pérez, M. La Conformación Territorial En Colombia: Entre El Conflicto, El Desarrollo y El Destierro. Cuad. Desarro. Rural 2004, 51, 61–90. [Google Scholar]
  2. Pineda, A. Desplazamiento Forzado En Colombia: Un Análisis de La Incidencia Del Derecho Internacional En La Normativa Nacional. EAFIT J. Int. Law 2016, 7, 6–39. [Google Scholar]
  3. Rojas, J.C. Etapas Del Conflicto Armado En Colombia: Hacia El Posconflicto. Lat. Rev. Estud. Latinoam. 2016, 62, 227–257. [Google Scholar] [CrossRef]
  4. Sánchez, F.; Chacón, M. Conflicto, Estado y Descentralización: Del Progreso Social a La Disputa Por El Control Local 1974–2002. CRIS States Program 2005, 70, 1–40. [Google Scholar]
  5. Gligo, N. La Dimensión Ambiental En El Desarrollo de América Latina; CEPAL: Santiago de Chile, 2001. [Google Scholar]
  6. Castro-Nunez, A.; Mertz, O.; Buritica, A.; Sosa, C.C.; Lee, S.T. Land Related Grievances Shape Tropical Forest-Cover in Areas Affected by Armed-Conflict. Appl. Geogr. 2017, 85, 39–50. [Google Scholar] [CrossRef]
  7. Solomon, N.; Birhane, E.; Gordon, C.; Haile, M.; Taheri, F.; Azadi, H.; Scheffran, J. Environmental Impacts and Causes of Conflict in the Horn of Africa: A Review. Earth-Sci. Rev. 2018, 177, 284–290. [Google Scholar] [CrossRef]
  8. Dudley, J.P.; Ginsberg, J.R.; Plumptre, A.J.; Hart, J.A.; Campos, L.C. Effects of War and Civil Strife on Wildlife and Wildlife Habitats. Conserv. Biol. 2002. [Google Scholar] [CrossRef]
  9. Hanson, T.; Brooks, T.M.; Da Fonseca, G.A.B.; Hoffmann, M.; Lamoreux, J.F.; MacHlis, G.; Mittermeier, C.G.; Mittermeier, R.A.; Pilgrim, J.D. Warfare in Biodiversity Hotspots. Conserv. Biol. 2009, 23, 578–587. [Google Scholar] [CrossRef]
  10. Jha, U.C. Armed Conflict and Environmental Damage; Vij Books India Pvt Ltd.: New Delhi, India, 2014. [Google Scholar]
  11. Fergusson, L.; Romero, D.; Vargas, J.F. The Environmental Impact of Civil Conflict: The Deforestation Effect of Paramilitary Expansion in Colombia. Doc. CEDE 2014, 36, 43. [Google Scholar] [CrossRef]
  12. Sánchez-Cuervo, A.M.; Aide, T.M. Identifying Hotspots of Deforestation and Reforestation in Colombia (2001–2010): Implications for Protected Areas. Ecosphere 2013, 4, 143. [Google Scholar] [CrossRef]
  13. Nackoney, J.; Molinario, G.; Potapov, P.; Turubanova, S.; Hansen, M.C.; Furuichi, T. Impacts of Civil Conflict on Primary Forest Habitat in Northern Democratic Republic of the Congo, 1990–2010. Biol. Conserv. 2014. [Google Scholar] [CrossRef]
  14. Brottem, L.; Unruh, J. Territorial Tensions: Rainforest Conservation, Postconflict Recovery, and Land Tenure in Liberia. Ann. Assoc. Am. Geogr. 2009, 99, 995–1002. [Google Scholar] [CrossRef]
  15. Burgess, R.; Miguel, E.; Stanton, C. War and Deforestation in Sierra Leone. Environ. Res. Lett. 2015. [Google Scholar] [CrossRef]
  16. Loucks, C.; Mascia, M.B.; Maxwell, A.; Huy, K.; Duong, K.; Chea, N.; Long, B.; Cox, N.; Seng, T. Wildlife Decline in Cambodia, 1953–2005: Exploring the Legacy of Armed Conflict. Conserv. Lett. 2009, 2, 82–92. [Google Scholar] [CrossRef]
  17. Stevens, K.; Campbell, L.; Urquhart, G.; Kramer, D.; Qi, J. Examining Complexities of Forest Cover Change during Armed Conflict on Nicaragua’s Atlantic Coast. Biodivers. Conserv. 2011. [Google Scholar] [CrossRef]
  18. Brown, G.; Langer, A. Elgar Handbook of Civil War and Fragile States; Edward Elgar Publishing Limited: Cheltenham, UK, 2012. [Google Scholar]
  19. WWF-Colombia. Colombia Viva: Un País Megadiverso de Cara Al Futuro. Informe 2017; WWF-Colombia: Cali, Colombia, 2017. [Google Scholar]
  20. Suarez, A.; Árias-Arévalo, P.A.; Martínez-Mera, E. Environmental Sustainability in Post-Conflict Countries: Insights for Rural Colombia. Environ. Dev. Sustain. 2018, 20, 997–1015. [Google Scholar] [CrossRef]
  21. Niño Pérez, J.J.; Devia Garzón, C.A. Inversión En El Posconflicto: Fortalecimiento Institucional y Reconstrucción Del Capital Social. Rev. Relac. Int. Estrateg. Segur. Univ. Mil. Nueva Granada 2015, 10, 203–224. [Google Scholar] [CrossRef]
  22. Beevers, M.D. Forest Resources and Peacebuilding: Preliminary Lessons from Liberia and Sierra Leone. In High-Value Natural Resources and Post-Conflict Peacebuilding; Routledge: London, UK, 2012; pp. 384–407. [Google Scholar] [CrossRef]
  23. Dávalos, L.M. The San Lucas Mountain Range in Colombia: How Much Conservation Is Owed to the Violence? Biodivers. Conserv. 2001, 10, 69–78. [Google Scholar] [CrossRef]
  24. Álvarez, M. Forests in the Time of Violence. J. Sustain. For. 2003, 16, 47–68. [Google Scholar] [CrossRef]
  25. Sánchez-Cuervo, A.M.; Aide, T.M.; Clark, M.L.; Etter, A. Land Cover Change in Colombia: Surprising Forest Recovery Trends between 2001 and 2010. PLoS ONE 2012, 7. [Google Scholar] [CrossRef]
  26. Sánchez-Cuervo, A.M.; Aide, T.M. Consequences of the Armed Conflict, Forced Human Displacement, and Land Abandonment on Forest Cover Change in Colombia: A Multi-Scaled Analysis. Ecosystems 2013, 16, 1052–1070. [Google Scholar] [CrossRef]
  27. Bushnell, D. Colombia: Una Nación a Pesar de Sí Misma; Editorial Planeta Colombiana S.A.: Bogotá, Colombia, 2003. [Google Scholar]
  28. Centro Nacional de Memoria Histórica. ¡Basta Ya! Colombia: Memorias de Guerra y Dignidad. Informe General Grupo de Memoria Histórica; Centro Nacional de Memoria Histórica: Bogotá, Colombia, 2013; Volume 12. [Google Scholar] [CrossRef]
  29. Boron, V.; Payán, E.; MacMillan, D.; Tzanopoulos, J. Achieving Sustainable Development in Rural Areas in Colombia: Future Scenarios for Biodiversity Conservation under Land Use Change. Land Use Policy 2016, 59, 27–37. [Google Scholar] [CrossRef]
  30. IDMC; Bilak, A.; Cardona-Fox, G.; Ginnetti, J.; Rushing, E.J.; Scherer, I.; Swain, M.; Walicki, N.; Yonetani, M. Global Report on Internal Displacement; IDMC: Geneva, Switzerland, 2016. [Google Scholar]
  31. Zafra, G. The Internally Displaced by Violence: A Fundamental Problem in Colombia. Available online: http://www.oas.org/juridico/english/zafrae.html (accessed on 4 April 2019).
  32. Fjeldså, J.; Álvarez, M.D.; Lazcano, J.M.; León, B. Illicit Crops and Armed Conflict as Constraints on Biodiversity Conservation in the Andes Region. AMBIO A J. Hum. Environ. 2005. [Google Scholar] [CrossRef]
  33. Rincón-Ruiz, A.; Correa, H.L.; León, D.O.; Williams, S. Coca Cultivation and Crop Eradication in Colombia: The Challenges of Integrating Rural Reality into Effective Anti-Drug Policy. Int. J. Drug Policy 2016, 33, 56–65. [Google Scholar] [CrossRef]
  34. Rincón-Ruiz, A.; Kallis, G. Caught in the Middle, Colombia’s War on Drugs and Its Effects on Forest and People. Geoforum 2013, 46, 60–78. [Google Scholar] [CrossRef]
  35. Álvarez, M. Illicit Crops and Bird Conservation Priorities in Colombia. Conserv. Biol. 2002, 16, 1086–1096. [Google Scholar] [CrossRef]
  36. Oficina del Alto Comisionado para la Paz. Acuerdo Final Par La Terminación Del Conflicto y La Construcción de Una Paz Estable y Duradera; Oficina del Alto Comisionado para la Paz: Bogotá, 2016. [Google Scholar]
  37. Congreso de la República. Ley 1448 de 2011. 10 Junio 2011. Available online: http://www.secretariasenado.gov.co/senado/basedoc/ley_1448_2011.html (accessed on 30 May 2016).
  38. Serrano, R.; Acevedo, M. Reflexiones En Torno a La Ley 1448. Fac. Derecho Ciencias Políticas 2013, 43, 533–566. [Google Scholar]
  39. URT. Requested Land Restitution Areas—August 2018; URT: Bogotá, Colombia, 2018. [Google Scholar]
  40. Ministerio de Ambiente y Desarrollo Sostenible; Programa de las Naciones Unidas para el Desarrollo. Quinto Informe Nacional de Biodiversidad de Colombia Ante El Convenio de Diversidad Biológica; MADS-UNDP: Bogotá, Colombia, 2014. [Google Scholar]
  41. Biodiversidad 2016. Estado y Tendencias de La Biodiversidad Continental de Colombia; Moreno, L., Andrade, G., Ruíz-Contreras, L., Eds.; Instituto Alexander von Humboldt: Bogotá, Colombia, 2017. [Google Scholar]
  42. Baribbi, A.; Spijkers, P.; Asistencia Técnica Internacional del Tercer Laboratorio de Paz. Campesinos, Tierra y Desarrollo Rural. Reflexiones Desde La Experiencia Del Tercer Laboratorio de Paz; Acción Social: Bogotá, Colombia, 2011. [Google Scholar]
  43. UPRA. Informe de Gestión 2013; UPRA: Bogotá, Colombia, 2014. [Google Scholar]
  44. Etter, A.; Andrade, A.; Saavedra, K.; Amaya, P.; Arevalo, P.A. Risk Assesment of Colombian Ecosystems: An Application of the Red List of Ecosystems Methodology (Vers. 2.0); Pontificia Universidad Javeriana-Conservación Internacional: Bogotá, Colombia, 2017. [Google Scholar]
  45. UNODC. Colombia Guerrillas and War. Available online: http://www.grid.unep.ch/products/4_Maps/co-guerillab.jpg (accessed on 15 January 2019).
  46. Etter, A.; Andrade, A.; Amaya, P.; Arévalo, P. Estado de Los Ecosistemas Colombianos—2014: Una Aplicación de La Metodología de Lista Roja de Ecosistemas; UICN: Bogotá, Colombia, 2015. [Google Scholar]
  47. IDEAM. Sistema de Monitoreo de Bosques y Carbono para Colombia—SMBYC. Available online: http://documentacion.ideam.gov.co/openbiblio/bvirtual/023708/boletinDEF.pdf (accessed on 10 May 2018).
  48. Calderón, E.; Galeano, G.; García, N. Libro Rojo de Plantas Fanerógamas de Colombia. Volumen 1: Chrysobalanaceae, Dichapetalaceae y Lecythidaceae; Instituto Alexander von Humboldt: Bogotá, Colombia, 2002. [Google Scholar]
  49. Renjifo, L.M.; Franco-Maya, A.M.; Amaya-Espinel, J.D.; Kattan, G.H.; López-Lanús, B. Libro Rojo de Aves de Colombia; Instituto Alexander von Humboldt: Bogotá, Colombia, 2002. [Google Scholar]
  50. Calderón, E.; Galeano, G.; García, N. Libro Rojo de Plantas de Colombia. Volumen 2: Palmas, Frailejones y Zamias; Instituto Alexander von Humboldt: Bogotá, Colombia, 2005. [Google Scholar]
  51. Rodríguez-Mahecha, J.V.; Landazábal Mendoza, C.; Nash, S.D. Libro Rojo de Los Mamíferos de Colombia; Conservation International Colombia: Bogotá, Colombia, 2006. [Google Scholar]
  52. García, N.; Galeano, G. Libro Rojo de Plantas de Colombia. Volumen 3: Las Bromelias, Las Labiadas y Las Pasifloras; Instituto Alexander von Humbolt: Bogotá, Colombia, 2006. [Google Scholar]
  53. Calderón, E. Libro Rojo de Plantas de Colombia; Instituto Alexander von Humboldt: Bogotá, Colombia, 2006. [Google Scholar]
  54. Cárdenas, L.; Salinas, N. Libro Rojo de Plantas de-Colombia-Especies Maderables Amenazadas. In Libr. Rojo Plantas Colomb. Especies Maderables Amenazadas Primera Parte; Instituto Alexander von Humboldt: Bogotá, Colombia, 2007. [Google Scholar] [CrossRef]
  55. Calderón-Sáenz, E. Libro Rojo de Plantas de Colombia. Vol. 6: Orchidaceae, Primera Parte; Instituto Alexander von Humboldt: Bogotá, Colombia, 2007. [Google Scholar]
  56. Cogollo, Á.; Velásquez, C.; Toro, J.; García, N. Libro Rojo de Plantas de Colombia. Volumen 5: Las Magnoliáceas, Las Miristicáceas y Las Podocarpáceas; Instituto Alexander von Humboldt: Bogotá, Colombia, 2007. [Google Scholar]
  57. Instituto de Investigaciones Biologicas Alexander von Humboldt. Richness Map by Region in Colombia; Instituto de Investigaciones Biologicas Alexander von Humboldt: Bogotá, Colombia, 2017. [Google Scholar]
  58. Instituto de Investigaciones Biologicas Alexander von Humboldt. Endemic Species List; Instituto de Investigaciones Biologicas Alexander von Humboldt: Bogotá, Colombia, 2017. [Google Scholar]
  59. PNN. SINAP Areas; PNN: Bogotá, Colombia, 2017. [Google Scholar]
  60. Ferrari, C.; Pezzi, G.; Diani, L.; Corazza, M. Evaluating Landscape Quality with Vegetation Naturalness Maps: An Index and Some Inferences. Appl. Veg. Sci. 2008, 11, 243–250. [Google Scholar] [CrossRef]
  61. Kunttu, P.; Junninen, K.; Kouki, J. Dead Wood as an Indicator of Forest Naturalness: A Comparison of Methods. For. Ecol. Manag. 2015, 353, 30–40. [Google Scholar] [CrossRef]
  62. Machado, A. An Index of Naturalness. J. Nat. Conserv. 2004, 12, 95–110. [Google Scholar] [CrossRef]
  63. Estavillo, C.; Pardini, R.; Da Rocha, P.L.B. Forest Loss and the Biodiversity Threshold: An Evaluation Considering Species Habitat Requirements and the Use of Matrix Habitats. PLoS ONE 2013, 8, e82369. [Google Scholar] [CrossRef]
  64. Andrén, H.; Delin, A.; Seiler, A. Population Response to Landscape Changes Depends on Specialization to Different Landscape Elements. Nord. Soc. Oikos 1997, 80, 193–196. [Google Scholar] [CrossRef]
  65. Huang, I.B.; Keisler, J.; Linkov, I. Multi-Criteria Decision Analysis in Environmental Sciences: Ten Years of Applications and Trends. Sci. Total Environ. 2011, 3578–3594. [Google Scholar] [CrossRef]
  66. Fernández, I.C.; Morales, N.S. Prioritization of Sites for Plant Species Restoration in the Chilean Biodiversity Hotspot: A Spatial Multi-Criteria Decision Analysis Approach. Restor. Ecol. 2016, 24, 599–608. [Google Scholar] [CrossRef]
  67. IPBES. Summary for Policymakers of the Thematic Assessment Report on Land Degradation and Restoration of the Intergovernmental Science-Policy Platform on Biodiversity and Ecosystem Services; IPBES: Bonn, Germany, 2018. [Google Scholar]
  68. Cárdenas, F. Consolidación y Fortalecimiento de Los Programas Ambientales En La Cuenca Media Del Río Chicamocha (Boyacá-Colombia). In Desarrollo Sostenible en los Andes de Colombia; IDEADE, Pontificia Universidad Javeriana: Bogotá, Colombia, 2000; p. 341. [Google Scholar]
  69. Dávalos, L.M.; Bejarano, A.C.; Hall, M.A.; Correa, H.L.; Corthals, A.; Espejo, O.J. Forests and Drugs: Coca-Driven Deforestation in Tropical Biodiversity Hotspots. Environ. Sci. Technol. 2011. [Google Scholar] [CrossRef]
  70. Etter, A.; Mcalpine, C.; Phinn, S.; Pullar, D.; Possingham, H. Characterizing a Tropical Deforestation Wave: A Dynamic Spatial Analysis of a Deforestation Hotspot in the Colombian Amazon. Glob. Chang. Biol. 2006. [Google Scholar] [CrossRef]
  71. Etter, A.; McAlpine, C.; Possingham, H. Historical Patterns and Drivers of Landscape Change in Colombia since 1500: A Regionalized Spatial Approach. Ann. Assoc. Am. Geogr. 2008. [Google Scholar] [CrossRef]
  72. DANE. Análisis de La Estructura y Composición de Las Principales Variables Demográficas y Socioeconómicas Del Censo 2005: Informe Final; DANE: Bogotá, Colombia, 2008. [Google Scholar]
  73. Blanco, D.; Buitrago, A.; Moreno, C.; Niño, P.; Peña, N.; Urdaneta, L. Informe de Gestión—Unidad de Restitución de Tierras; Unidad de Restitución de Tierras: Bogotá, Colombia, 2016. [Google Scholar]
  74. Romero-Ruiz, M.H.; Flantua, S.G.A.; Tansey, K.; Berrio, J.C. Landscape Transformations in Savannas of Northern South America: Land Use/Cover Changes since 1987 in the Llanos Orientales of Colombia. Appl. Geogr. 2012, 32, 766–776. [Google Scholar] [CrossRef]
  75. Morales, L. Peace and Environmental Protection in Colombia Proposals for Sustainable Rural Development Peace and Environmental Protection in Colombia; Inter-American Dialogue: Washington, DC, USA, 2017; p. 32. [Google Scholar]
  76. Etter, A.; McAlpine, C.; Wilson, K.; Phinn, S.; Possingham, H. Regional Patterns of Agricultural Land Use and Deforestation in Colombia. Agric. Ecosyst. Environ. 2006, 114, 369–386. [Google Scholar] [CrossRef]
  77. Baptiste, B.; Pinedo-Vasquez, M.; Gutierrez-Velez, V.H.; Andrade, G.I.; Vieira, P.; Estupiñán-Suárez, L.M.; Londoño, M.C.; Laurance, W.; Lee, T.M. Greening Peace in Colombia. Nat. Ecol. Evol. 2017. [Google Scholar] [CrossRef]
  78. Maldonado, J.H.; del Pilar Moreno-Sánchez, R.; Espinoza, S.; Bruner, A.; Garzón, N.; Myers, J. Peace Is Much More than Doves: The Economic Benefits of Bird-Based Tourism as a Result of the Peace Treaty in Colombia. World Dev. 2018, 106, 78–86. [Google Scholar] [CrossRef]
  79. Aguilar, M.; Sierra, J.; Ramirez, W.; Vargas, O.; Calle, Z.; Vargas, W.; Murcia, C.; Aronson, J.; Barrera Cataño, J.I. Toward a Post-Conflict Colombia: Restoring to the Future. Restor. Ecol. 2015, 23, 4–6. [Google Scholar] [CrossRef]
Figure 1. Colombia: (a) Bio-regions [44]; (b) armed groups and their areas of influence [45].
Sustainability 11 02048 g001
Figure 2. Location of the recognized areas of the Land Restitution Program (LRP)—August 2018 [40].
Sustainability 11 02048 g002
Figure 3. Forest cover percentage between 1990 and 2017: (a) LRP and buffers at the national level; (b) LRP at the regional level.
Sustainability 11 02048 g003
Figure 4. Naturalness index (NI).
Sustainability 11 02048 g004
Figure 5. Important areas for conservation and the LRP.
Sustainability 11 02048 g005
Table 1. Variables used for the forest cover change analyses.
CategoryNameDescriptionAbbreviationSource
Land Restitution UnitRestitution areasAll the requested areasLRP[39]
LULCC (Land Use Land Cover Change)Original forest cover
Cover transformation 1990–2000
Cover transformation 2000–2014
Cover transformation 2014–2017
Original forest cover in Colombia
Land cover change from 1990 to 2000
Land cover change from 2000 to 2014
Land cover change from 2014 to 2017
[46]
[47]
Land CoverLand cover mapAll land cover according to Corine—land cover methodology [47]
MCDA (Multicriteria Decision Analysis)Natural-transformed coverTotal transformation 2014AreasNT[46]
Critical, endangered, and vulnerable ecosystemsRed List of EcosystemsRLE[44]
Species in riskRed List of SpeciesRLS[48,49,50,51,52,53,54,55,56]
RichnessRichness by regionR[57]
Number of endemic speciesEndemic speciesEndc[58]
Distance to protected areasNational System of Protected AreasDisSINAP[59]
Distance to natural areasTotal transformation 2014DisAN[46]
Table 2. Range of values for each variable of the naturalness index (NI).
Contribution to the Naturalness ValueForest Cover (%)Deforestation (%/year)Regeneration (%/year)
0<20>1<0.6
120–400.6–10.6–1
2>40<0.6>1
Table 3. Scale of value range for each variable.
Contribution to the Importance ValueVariables for the Analysis
AreasNTRLERLSREndcDisSINAPDisAN
0-LC--->5 km>5 km
1TransformedVU<89<10,000<102–5 km2–5 km
2-EN89–21010,000–30,00010–631–2 km1–2 km
3NaturalCR>210>30,000>63<1 km<1 km
Relative weight (W)0.1420.1420.1420.1420.1420.1420.142
Table 4. Area percentage of the LRP by region.
RegionArea (Ha)Percentage (%)
Country1,119,959-
Amazon18,1531.6
Andes153,27613.7
Caribbean518,88546.3
Catatumbo-Magdalena52,3704.7
Orinoco340,78930.4
Pacific36,4873.3
Table 5. Percentage of the LRP by range on NI at the regional level.
RangeAmazonAndesCaribbeanCat-MagOrinocoPacificCountry
Low66.655.191.65589.110081.1
Medium8.326.53.7156.509.4
High2518.34.6304.309.4
Table 6. Percentage of the LRP by range on Multi-Criteria Decision Analysis (MCDA) for each region.
RangeAmazonAndesCaribeCat-MagOrinocoPacificNational
10.020.7220.23.60.182.447.3
281.776.175.888.452.689.174.5
318.222.93.97.847.27.918
400.20.001000.40.08
Table 7. Ecosystems in the LRP + 1 km with high values of importance for conservation and its category of threat based on the Red List of Ecosystems [44].
EcosystemMCDA (%)Threat CategoryRegion
Strongly rolling erosional surfaces of high dense forest21, 48Least Concern (LC)Amazon/Pacific
Slightly rolling erosional surfaces of high dense forest21, 47LCAmazon/Pacific
Humid Andean hills and mountains of half dense forest7, 56Vulnerable (VU)Andes
Rolling highlands of herbaceous savannas and shrublands6, 54LCOrinoco
Erosional alluvial plains of Andean rivers3.1Endangered (EN)Andes/Catatumbo-Magdalena
Open and succulent shrublands of tropical deserts0.83Critically endangered (CR)Caribbean
Lightly wavy residual sandy plains of the Guayanés Shield0.55CRAmazon
hills and serranias of tropical dry forest0.36CRCaribbean
Sub humid high Andean hills and mountains0.31CRAndes
Ancient terraces of large rivers0.23CRCaribbean
High Andean hills and mountains of dry paramunas0.18ENAndes
Low open shrublands and desert areas of tropical deserts0.17CRCaribbean
Alluvial plains of overflow Andean rivers0.14ENAndes

