Population Age Structure, Complex Socio-Demographic Systems and Resilience Potential: A Spatio-Temporal, Evenness-Based Approach


Abstract
1. Introduction
2. Materials and Methods
2.1. Study Area and Data Collection
2.2. Methodology
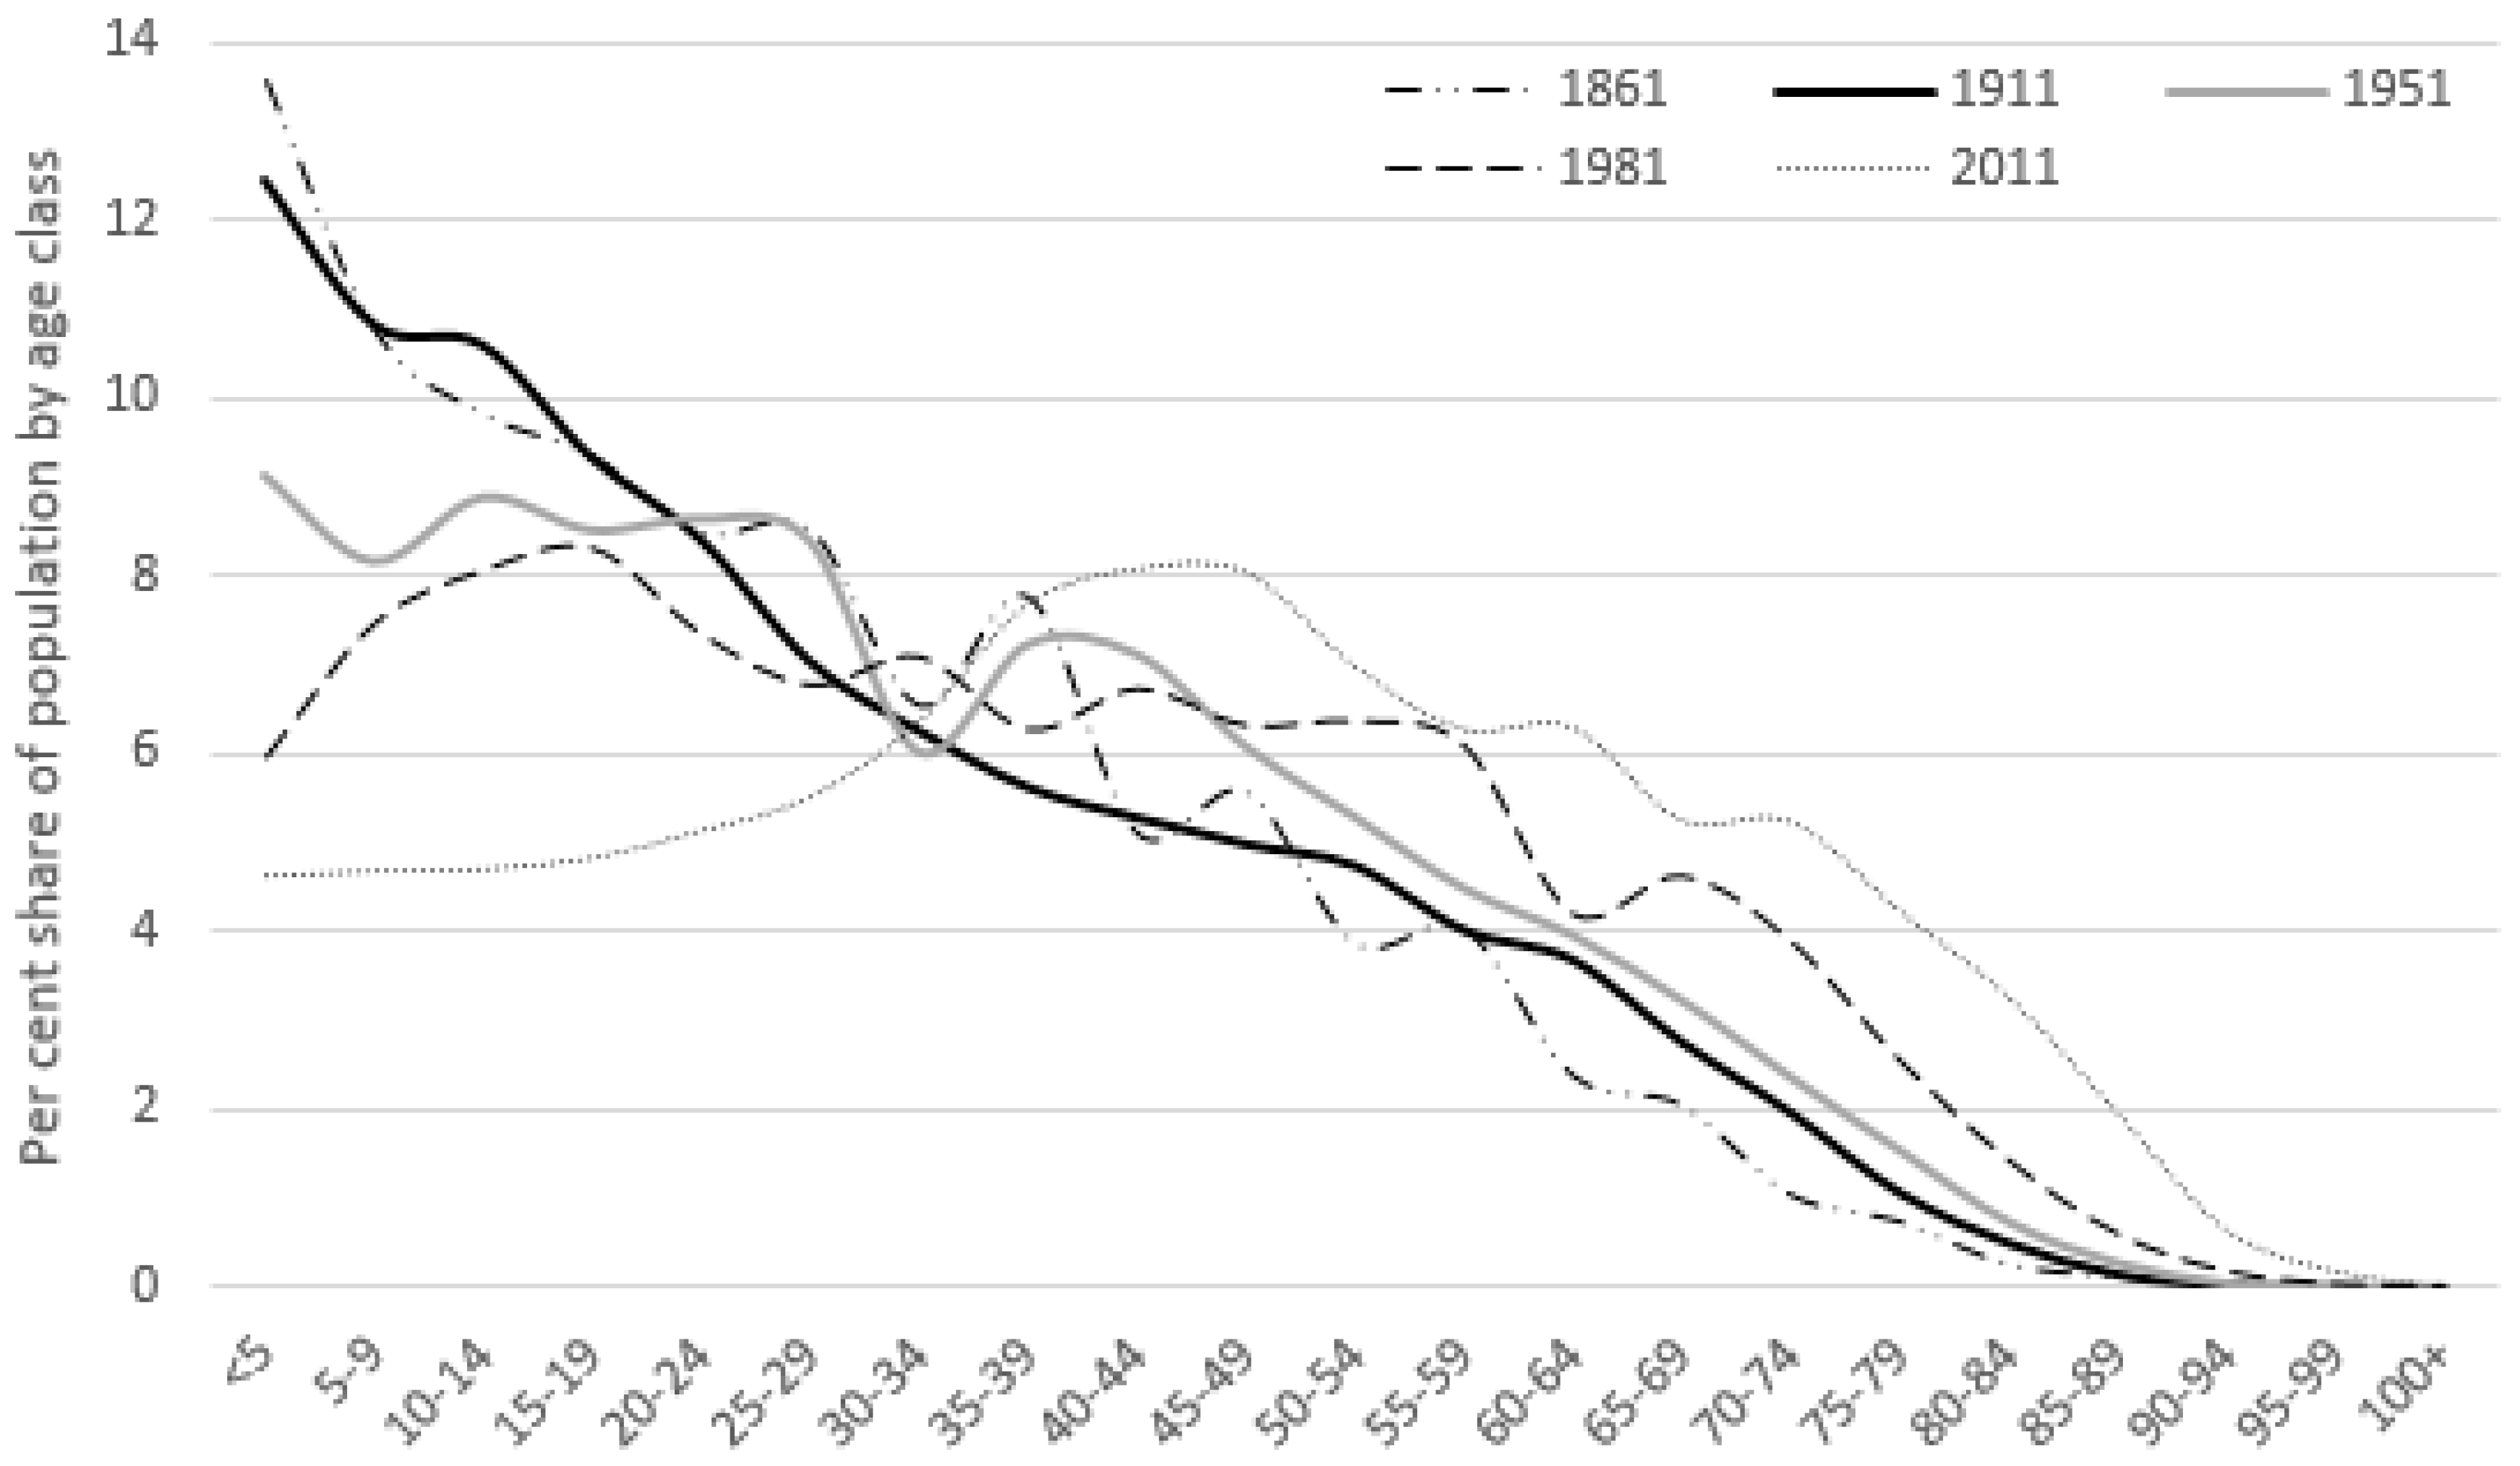
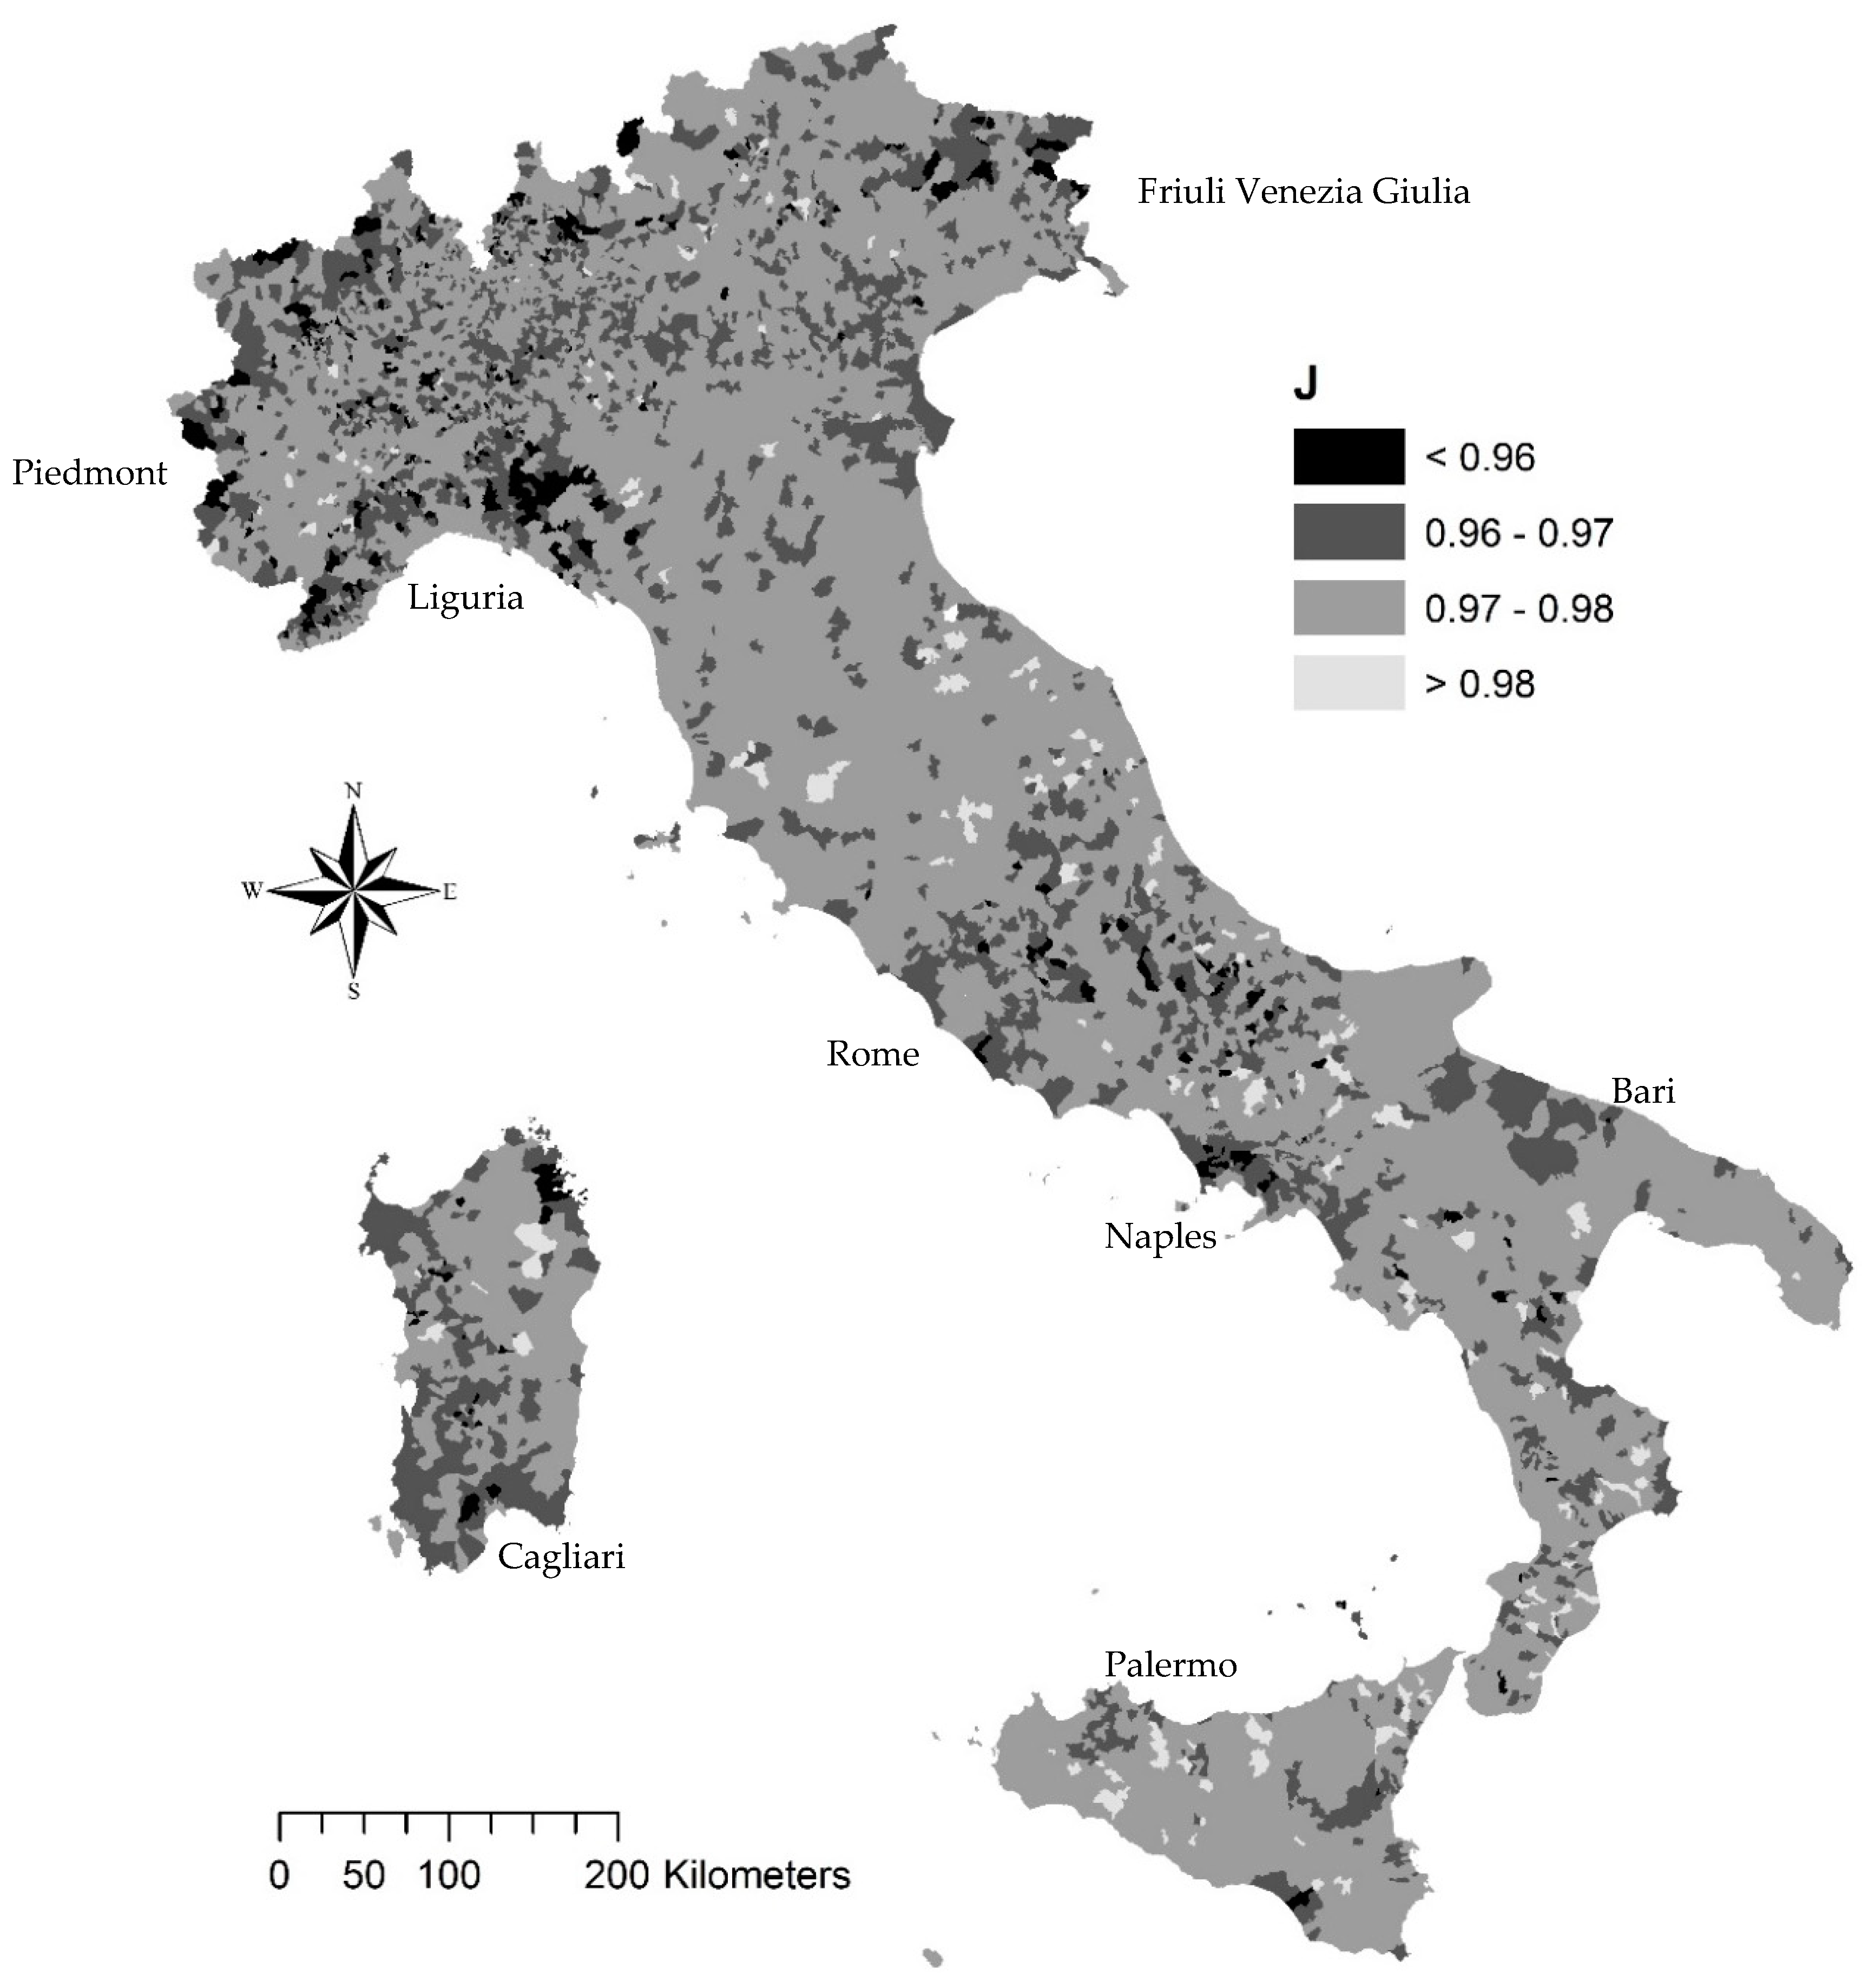
3. Results
4. Discussion
5. Conclusions
Author Contributions
Funding
Conflicts of Interest
References
- Berkes, F.; Colding, J.; Folke, C. Navigating Social–Ecological Systems: Building Resilience for Complexity and Change; Cambridge University Press: Cambridge, UK, 2003. [Google Scholar]
- Adger, W.N. Social and ecological resilience: Are they related. Prog. Hum. Geogr. 2000, 24, 347–364. [Google Scholar] [CrossRef]
- Harte, J. Human population as a dynamic factor in environmental degradation. Popul. Environ. 2007, 28, 223–236. [Google Scholar] [CrossRef]
- Brand, F.X.; Jax, K. Focusing the meaning(s) of resilience: Resilience as a descriptive concept and a boundary object. Ecol. Soc. 2007, 12, 23. [Google Scholar] [CrossRef]
- Folke, C. Resilience: The emergence of a perspective for social–ecological systems analyses. Glob. Environ. Chang. 2006, 16, 253–267. [Google Scholar] [CrossRef]
- Holling, C.S. Understanding the complexity of economic, ecological and social systems. Ecosystems 2001, 4, 390–405. [Google Scholar] [CrossRef]
- Folke, C.; Carpenter, S.R.; Walker, B.; Scheffer, M.; Chapin, T.; Rockström, J. Resilience thinking: Integrating resilience, adaptability and transformability. Ecol. Soc. 2010, 15, 20. [Google Scholar] [CrossRef]
- Carpenter, S.; Walker, B.; Anderies, J.; Abel, N. From metaphor to measurement: Resilience of what to what? Ecosystems 2001, 4, 765–781. [Google Scholar] [CrossRef]
- Folke, C.; Hahn, T.; Olsson, P.; Norberg, J. Adaptive governance of social-ecological systems. Annu. Rev. Environ. Resour. 2005, 30, 441–473. [Google Scholar] [CrossRef]
- Kelly, C.; Ferrara, A.; Wilson, G.A.; Ripullone, F.; Nolè, A.; Harmer, N.; Salvati, L. Community resilience and land degradation in forest and shrubland socio-ecological systems: Evidence from Gorgoglione, Basilicata, Italy. Land Use Policy 2015, 1146, 11–20. [Google Scholar] [CrossRef]
- Karamesouti, M.; Detsis, V.; Kounalaki, A.; Vasiliou, P.; Salvati, L.; Kosmas, C. Land-use and land degradation processes affecting soil resources: Evidence from a traditional Mediterranean cropland (Greece). Catena 2015, 132, 45–55. [Google Scholar] [CrossRef]
- Serra, P.; Vera, A.; Tulla, A.F.; Salvati, L. Beyond urban-rural dichotomy: Exploring socioeconomic and land-use processes of change in Spain (1991–2011). Appl. Geogr. 2014, 55, 71–81. [Google Scholar] [CrossRef]
- Zitti, M.; Ferrara, C.; Perini, L.; Carlucci, M.; Salvati, L. Long-term urban growth and land-use efficiency in southern europe: Implications for sustainable land management. Sustainability 2015, 7, 3359–3385. [Google Scholar] [CrossRef]
- Duvernoy, I.; Zambon, I.; Sateriano, A.; Salvati, L. Pictures from the other side of the fringe: Urban growth and peri-urban agriculture in a post-industrial city (Toulouse, France). J. Rural Stud. 2018, 57, 25–35. [Google Scholar] [CrossRef]
- Recanatesi, F.; Clemente, M.; Grigoriadis, S.; Ranalli, F.; Zitti, M.; Salvati, L. A fifty-years sustainability assessment of Italian agro-forest districts. Sustainability 2016, 8, 32. [Google Scholar] [CrossRef]
- Di Feliciantonio, C.; Salvati, L. ‘Southern’ alternatives of urban diffusion: Investigating settlement characteristics and socioeconomic patterns in three mediterranean regions. Tijdschrift voor Economische en Sociale Geografie 2015, 106, 453–470. [Google Scholar] [CrossRef]
- Walker, B.; Gunderson, L.; Kinzig, A.; Folke, C.; Carpenter, S.; Schult, L. A Handful of heuristics and some propositions for understanding resilience in social-ecological systems. Ecol. Soc. 2006, 11, 13. [Google Scholar] [CrossRef]
- Cherlin, A.; Cumberworth, E.; Morgan, S.P.; Wimer, C. The effects of the great recession on family structure and fertility. Ann. Am. Acad. Political Soc. Sci. 2013, 6501, 214–231. [Google Scholar] [CrossRef]
- Walford, N.; Kurek, S. Outworking of the second demographic transition: National trends and regional patterns of fertility change in Poland, and England and Wales, 2002–2012. Popul. Space Place 2016, 22, 508–525. [Google Scholar] [CrossRef]
- Sobotka, T.; Skirbekk, V.; Philipov, D. Economic recession and fertility in the developed world. Popul. Dev. Rev. 2011, 37, 267–306. [Google Scholar] [CrossRef] [PubMed]
- Salvati, L.; Gargiulo, V.; Rontos, K.; Sabbi, A. Latent exurban development: City expansion along the rural-to-urban gradient in growing and declining regions of southern Europe. Urban Geogr. 2013, 34, 376–394. [Google Scholar] [CrossRef]
- Caldwell, J.C. Demographic Transition Theory; Springer: Berlin, Germany, 2006. [Google Scholar]
- Chesnais, J.-C. The Demographic Transition: Stages, Patterns, and Economic Implications: A Longitudinal Study of Sixty-Seven Countries Covering the Period 1720–1984; Oxford University Press: Oxford, UK, 1993. [Google Scholar]
- Dudley, K. The Demographic transition. Popul. Stud. 1996, 50, 361–387. [Google Scholar]
- Myrskyla, M.; Kohler, H.-P.; Billari, F. Advances in development reverse fertility declines. Nature 2009, 460, 741–743. [Google Scholar] [CrossRef]
- Billari, F.C.; Kohler, H.-P.; Andersson, G.; Lundström, H. Approaching the limit: Long-term trends in late and very late fertility. Popul. Develop. Rev. 2007, 33, 149–170. [Google Scholar] [CrossRef]
- Modena, F.; Rondinelli, C.; Sabatini, F. Economic insecurity and fertility intentions: The case of italy. Rev. Income Wealth 2014, 60, S233–S255. [Google Scholar] [CrossRef]
- Vignoli, D.; Drefahl, S.; De Santis, G. Whose job instability affects the likelihood of becoming a parent in Italy? A tale of two partners. Demogr. Res. 2012, 26, 42–62. [Google Scholar] [CrossRef]
- Cazzola, A.; Pasquini, L.; Angeli, A. The relationship between unemployment and fertility in Italy: A time-series analysis. Demogr. Res. 2016, 34, 1–38. [Google Scholar] [CrossRef]
- Tragaki, A.; Bagavos, C. Male fertility in Greece: Trends and differentials by educational level and employment status. Demogr. Res. 2014, 31, 137–160. [Google Scholar] [CrossRef]
- Schneider, D. The great recession, fertility, and uncertainty: Evidence from the united states. J. Marriage Family 2015, 77, 1144–1156. [Google Scholar] [CrossRef]
- Goldstein, J.; Kreyenfeld, M.; Jasilioniene, A.; Örsal, D.D.K. Fertility reactions to the “great recession” in Europe: Recent evidence from order-specific data. Demogr. Res. 2013, 29, 85–104. [Google Scholar] [CrossRef]
- Caltabiano, M.; Castiglioni, M.; Rosina, A. Lowest-low fertility: Signs of a recovery in Italy? Demogr. Res. 2009, 21, 681–718. [Google Scholar] [CrossRef]
- Kreyenfeld, M.; Andersson, G.; Pailhé, A. Economic uncertainty and family dynamics in Europe: Introduction. Demogr. Res. 2012, 27, 835–852. [Google Scholar] [CrossRef]
- Ciganda, D. Unstable work histories and fertility in france: An adaptation of sequence complexity measures to employment trajectories. Demogr. Res. 2015, 32, 843–876. [Google Scholar] [CrossRef]
- Del Bono, E.; Weber, A.; Winter-Ebmer, R. Fertility and economic instability: The role of unemployment and job displacement. J. Popul. Econ. 2015, 28, 46–479. [Google Scholar]
- Costanza, R.; d’Arge, R.; De Groot, R.; Farber, S.; Grasso, M.; Hannon, B.; Raskin, R.G. The value of the world’s ecosystem services and natural capital. Nature 1997, 387, 253. [Google Scholar] [CrossRef]
- Van den Bergh, J.C.J.M.; Stagl, S. Coevolution of economic behavior and institutions: Towards a theory of institutional change. J. Evol. Econ. 2003, 13, 289–317. [Google Scholar] [CrossRef]
- Crews, K.A.; Peralvo, M.F. Segregation and fragmentation: Extending landscape ecology and pattern metrics analysis to spatial demography. Popul. Res. Policy Rev. 2008, 27, 65–88. [Google Scholar] [CrossRef]
- Wagmiller, R.L. Race and the spatial segregation of jobless men in urban America. Demography 2007, 44, 539–562. [Google Scholar] [CrossRef]
- Ferrara, A.; Kelly, C.; Wilson, G.; Nolè, A.; Mancino, G.; Bajocco, S.; Salvati, L. Shaping the role of ‘fast’ and ‘slow’ drivers of change in forest-shrubland socio-ecological systems. J. Environ. Manag. 2016, 169, 155–166. [Google Scholar] [CrossRef] [PubMed]
- Colantoni, A.; Mavrakis, A.; Sorgi, T.; Salvati, L. Towards a ‘polycentric’ landscape? Reconnecting fragments into an integrated network of coastal forests in rome. Rendiconti Accademia Nazionale dei Lincei 2015, 26, 615–624. [Google Scholar] [CrossRef]
- Ferrara, C.; Carlucci, M.; Grigoriadis, S.; Corona, P.; Salvati, L. A comprehensive insight into the geography of forest cover in Italy: Exploring the importance of socioeconomic local contexts. Forest Policy Econ. 2017, 75, 12–22. [Google Scholar] [CrossRef]
- Gowdy, J.M. The social context of natural capital: The social limits to sustainable development. Int. J. Soc. Econ. 1994, 21, 43–55. [Google Scholar] [CrossRef]
- Kallis, G. Socio-environmental coevolution: Towards an analytical approach. Int. J. Sustain. Dev. World Ecol. 2007, 14, 9–19. [Google Scholar] [CrossRef]
- Istat. Atlante Statistico dei Comuni; Istituto Nazionale di Statistica: Roma, Italy, 2006.
- Zambon, I.; Serra, P.; Sauri, D.; Carlucci, M.; Salvati, L. Beyond the ‘Mediterranean city’: Socioeconomic disparities and urban sprawl in three Southern European cities. Geographiska Annaler B 2017, 99, 319–337. [Google Scholar] [CrossRef]
- Salvati, L.; Carlucci, M.; Venanzoni, G. Recession, resilience, local labour markets: Wealthier is better? Lett. Spat. Res. Sci. 2017, 10, 177–204. [Google Scholar] [CrossRef]
- Biasi, R.; Colantoni, A.; Ferrara, C.; Ranalli, F.; Salvati, L. In-between sprawl and fires: Long-term forest expansion and settlement dynamics at the wildland-urban interface in Rome, Italy. Int. J. Sustain. Dev. World Ecol. 2015, 22, 467–475. [Google Scholar] [CrossRef]
- Salvati, L. Agro-forest landscape and the ‘fringe’ city: A multivariate assessment of land-use changes in a sprawling region and implications for planning. Sci. Total Environ. 2014, 490, 715–723. [Google Scholar] [CrossRef]
- Zambon, I.; Colantoni, A.; Cecchini, M.; Mosconi, E.M. Rethinking sustainability within the viticulture realities integrating economy, landscape and energy. Sustainability 2018, 10, 320. [Google Scholar] [CrossRef]
- Colantoni, A.; Marucci, A.; Monarca, D.; Pagniello, B.; Cecchini, M.; Bedini, R. The risk of musculoskeletal disorders due to repetitive movements of upper limbs for workers employed to vegetable grafting. J. Food Agric. Environ. 2012, 10, 14–18. [Google Scholar]
- Anifantis, A.S.; Colantoni, A.; Pascuzzi, S. Thermal energy assessment of a small scale photovoltaic, hydrogen and geothermal stand-alone system for greenhouse heating. Renew. Energy 2017, 103, 115–127. [Google Scholar] [CrossRef]
- Salvati, L.; Zitti, M.; Ceccarelli, T. Integrating economic and environmental indicators in the assessment of desertification risk: A case study. Appl. Ecol. Environ. Res. 2008, 6, 129–138. [Google Scholar] [CrossRef]
- Colantoni, A.; Ferrara, C.; Perini, L.; Salvati, L. Assessing trends in climate aridity and vulnerability to soil degradation in Italy. Ecol. Indic. 2015, 48, 599–604. [Google Scholar] [CrossRef]
- Salvati, L.; Serra, P. Estimating rapidity of change in complex urban systems: A multidimensional, local-scale approach. Geogr. Anal. 2016, 48, 132–156. [Google Scholar] [CrossRef]
- Rubiera-Morollón, F.; del Rosal, I.; Díaz-Dapena, A. Can large cities explain the aggregate movements of economies? Testing the ‘granular hypothesis’ for US counties. Lett. Spat. Res. Sci. 2015, 8, 109–118. [Google Scholar] [CrossRef]
- Fernandez-Vazquez, E.; Lemelin, A.; Rubiera-Morollón, F. Applying entropy econometrics to estimate data at a disaggregated spatial scale. Lett. Spat. Res. Sci. 2014, 7, 159–169. [Google Scholar] [CrossRef]
- Kallis, G.; Norgaard, R.B. Coevolutionary ecological economics. Ecol. Econ. 2010, 69, 690–699. [Google Scholar] [CrossRef]
- Carlucci, M.; Grigoriadis, E.; Rontos, K.; Salvati, L. Revisiting a hegemonic concept: Long-term ‘mediterranean urbanization’ in between city re-polarization and metropolitan decline. Appl. Spat. Anal. Policy 2017, 10, 347–362. [Google Scholar] [CrossRef]
- Ward, H. The co-evolution of regimes of accumulation and patterns of rule: State autonomy and the possibility of functional responses to crisis. N. Political Econ. 2003, 8, 179–202. [Google Scholar] [CrossRef]
- Safarzynska, K.; van den Bergh, J.C.J.M. Demand-supply coevolution with multiple increasing returns: Policy analysis for unlocking and system transitions. Technol. Forecast. Soc. Chang. 2010, 77, 297–317. [Google Scholar] [CrossRef]


| Year | Old Age Dependency Index | Structural Dependency Index | Evenness J Index |
|---|---|---|---|
| 1861 | 12.2 | 62.3 | 0.854 |
| 1871 | 15.7 | 60.2 | 0.869 |
| 1881 | 16.0 | 59.5 | 0.870 |
| 1901 | 17.7 | 67.9 | 0.871 |
| 1911 | 20.2 | 67.9 | 0.871 |
| 1921 | 23.3 | 61.2 | 0.875 |
| 1931 | 24.7 | 58.8 | 0.881 |
| 1936 | 24.3 | 61.4 | 0.884 |
| 1951 | 31.4 | 52.3 | 0.895 |
| 1961 | 38.9 | 51.6 | 0.906 |
| 1971 | 46.1 | 55.5 | 0.914 |
| 1981 | 61.7 | 53.1 | 0.921 |
| 1991 | 96.6 | 45.3 | 0.930 |
| 2001 | 131.4 | 49.0 | 0.939 |
| 2011 | 148.7 | 53.5 | 0.945 |
| Class (Years) | Axis 1 | Axis 2 |
|---|---|---|
| <5 | −0.93 | −0.19 |
| 5–9 | −0.97 | −0.15 |
| 10–14 | −0.93 | −0.10 |
| 15–19 | −0.90 | −0.03 |
| 20–24 | −0.89 | 0.32 |
| 25–29 | −0.46 | 0.74 |
| 30–34 | 0.30 | 0.70 |
| 35–39 | 0.61 | 0.27 |
| 40–44 | 0.82 | −0.14 |
| 45–49 | 0.89 | −0.10 |
| 50–54 | 0.89 | 0.11 |
| 55–59 | 0.92 | 0.03 |
| 60–64 | 0.94 | −0.01 |
| 65–69 | 0.94 | 0.09 |
| 70–74 | 0.97 | −0.05 |
| 75–79 | 0.99 | 0.01 |
| 80–84 | 0.97 | −0.12 |
| 85–89 | 0.97 | −0.15 |
| 90–94 | 0.96 | −0.11 |
| 95–99 | 0.86 | −0.24 |
| Old age dependency index | 0.98 | −0.06 |
| Structural dependency | −0.77 | −0.53 |
| Evenness J index | 0.97 | 0.09 |
| Expl. Var. | 77.3 | 7.5 |
© 2019 by the authors. Licensee MDPI, Basel, Switzerland. This article is an open access article distributed under the terms and conditions of the Creative Commons Attribution (CC BY) license (http://creativecommons.org/licenses/by/4.0/).
Share and Cite
Cecchini, M.; Cividino, S.; Turco, R.; Salvati, L. Population Age Structure, Complex Socio-Demographic Systems and Resilience Potential: A Spatio-Temporal, Evenness-Based Approach. Sustainability 2019, 11, 2050. https://doi.org/10.3390/su11072050
Cecchini M, Cividino S, Turco R, Salvati L. Population Age Structure, Complex Socio-Demographic Systems and Resilience Potential: A Spatio-Temporal, Evenness-Based Approach. Sustainability. 2019; 11(7):2050. https://doi.org/10.3390/su11072050
Chicago/Turabian StyleCecchini, Massimo, Sirio Cividino, Rosario Turco, and Luca Salvati. 2019. "Population Age Structure, Complex Socio-Demographic Systems and Resilience Potential: A Spatio-Temporal, Evenness-Based Approach" Sustainability 11, no. 7: 2050. https://doi.org/10.3390/su11072050
APA StyleCecchini, M., Cividino, S., Turco, R., & Salvati, L. (2019). Population Age Structure, Complex Socio-Demographic Systems and Resilience Potential: A Spatio-Temporal, Evenness-Based Approach. Sustainability, 11(7), 2050. https://doi.org/10.3390/su11072050