Article

The Inclusion of Socially Irresponsible Companies in Sustainable Stock Indices

by
Iván Arribas
1,
María Dolores Espinós-Vañó
2,
Fernando García
2,* and
Paula Beatriz Morales-Bañuelos
3
1
Department of Economic Analysis, Universitat de València, ERI-CES, IVIE, 46022 Valencia, Spain
2
Business School, Universitat Politècnica de Valencia, 46022 València, Spain
3
Department of Business Studies, Universidad Iberoamericana, 01219 Ciudad de México, Mexico
*
Author to whom correspondence should be addressed.
Sustainability 2019, 11(7), 2047; https://doi.org/10.3390/su11072047
Submission received: 5 March 2019 / Revised: 2 April 2019 / Accepted: 3 April 2019 / Published: 6 April 2019
(This article belongs to the Special Issue Sustainable Financial Markets)

Abstract

:
Social rating agencies implement complex filters to identify the companies with the best sustainable and social performance and help investors select the companies for their sustainable portfolios. This study analysed whether companies that are defined as ethical, sustainable and socially responsible by those agencies actually deserve this label. More specifically, the inclusion in the prestigious Dow Jones Sustainability Index (DJSI) World of companies that have been involved in controversies according to the Thomson Reuters Eikon database was studied. The results show that the inclusion of irresponsible companies in the DJSI Index is a fact. This outcome is in line with previous studies that criticise the methodologies applied by social rating agencies and those which outline the similarity of sustainable and conventional portfolios. The results may explain the contradictory conclusions regarding the performance of sustainable and conventional mutual funds in numerous studies.

1. Introduction

Throughout the last decades, investors have increased pressure on companies to consider the environmental and the social impact of their activities, while simultaneously maintaining economic performance and profitability [1]. Sustainable development, understood as economic growth that is sensitive to the environmental and social aspects of companies, has become part of the main agenda of companies, investors and governments [2,3,4,5]. Many investors believe that economic growth must be the solution rather than the problem, helping to increase people’s quality of life and preserving the environment.
The growing importance of socially responsible investment has motivated a number of studies that analyse this phenomenon from different perspectives. One of the topics that has attracted the attention of academics is the comparison of the performance achieved by sustainable and conventional investments. Although results are not unanimous, most recent studies conclude that there are no significant differences between sustainable and conventional portfolios. This is a striking result, as, theoretically, socially responsible companies have some characteristics that distinguish them from conventional ones and this difference should be reflected in the financial performance [6,7,8,9,10].
The main difference between sustainable portfolios and conventional ones is the asset selection process. Socially Responsible Investment (SRI) only deals with companies which behave in a responsible, ethical and sustainable way. The problem is that there is no widely accepted definition or methodology that can help investors to clearly identify such companies [11]. As a result, many socially responsible investors apply complex methodologies, e.g., positive screening, which, in principle, make it possible to select the most sustainable companies in each industry.
These methodologies have been criticised by some authors who question whether they can properly prevent irresponsible companies from becoming components of socially responsible portfolios. The main alternative to positive screening that could solve this problem, so-called negative screening, is only employed to exclude companies in some industries, such as the production of tobacco or alcoholic beverages. However, it is not applied to exclude companies with unethical or irresponsible practices, such as the violation of labour or environmental legislation.
In this context, one may wonder whether the explanation for the similar performance by sustainable and conventional portfolios may be that traditional screening methodologies do not correctly discriminate between responsible and irresponsible firms.
To shed light on this question, we analysed the inclusion of socially irresponsible companies in one of the most prestigious sustainable indices worldwide, the DJSI World. This index was selected for several reasons. First, it is one of the best known sustainable financial products. Second, it acts as a benchmark for many socially responsible investors who select the companies in their portfolio from the DJSI World components. Third, this index applies the methodology by RobecoSAM, one of the companies with best reputation in the field of sustainable investment in the financial markets.
Together with the inclusion of irresponsible firms in the index, it is important to analyse what type of irresponsible behaviour these companies have committed, to discover what type of bad behaviours are most penalised by the index methodology. The study included a regional analysis considering geographical area and nationality. The aim was to find whether companies are treated differently based on their geographical location or their nationality.
To carry out the study, we first defined what is an irresponsible company. Rather than using a complex definition, we defined as irresponsible companies those that have been involved in scandals related with activities such as environmental damage, violations of human rights, corruption, etc. Companies conducting such activities should never be defined as ethical, sustainable or socially responsible and should not become components of a sustainable stock index. We understand that this screening methodology is in line with the perception of most socially responsible retail investors whose main objective is to avoid investing in companies that carry out harmful, unsustainable, unethical or even illegal activities.
The remainder of the paper is structured as follows. Section 2 is devoted to the literature review. Section 3 describes the databases employed. Special attention is devoted to the screening methodology employed to select the components of the DJSI World. Section 4 presents the analyses performed and discusses the findings. Finally, Section 5 concludes.

2. Literature Review

In the last decades, socially responsible investment has experienced a dramatic growth [12,13]. According to The Global Sustainable Investment Alliance in 2016, ethical assets managed worldwide with a corporate socially responsible focus were worth $22.89 trillion [14]. This demonstrates that sustainability has become a fundamental factor to many investors. As a result, sustainability investment has attracted the attention of academics for several decades.
At the beginning of this century, some researchers [15,16,17] wondered whether “ethical” or “socially responsible” investments were actually socially responsible. Soon the focus changed and the question to be answered was whether investing in ethical or socially responsible companies paid off [18,19]. From the theoretical point of view, there are two opposite answers. On the one hand, limiting the diversification possibilities of the portfolio to include only sustainable companies should have a negative effect on return and risk [20,21,22]. In this vein, some authors analysing the effect of applying negative screening in the portfolio selection process on return and risk concluded that, in fact, it has a negative impact [23,24,25]. Other authors obtained the same findings when positive screening was employed [26].
On the other hand, after the stakeholder theory [27], selected companies in the portfolio should perform better than those excluded from the portfolio, which should lead to a better performance of the investment portfolio. The hypothesis is that socially responsible companies can avoid some risks such as consumer boycotts and legal prosecutions and fines [28]. This hypothesis has been confirmed by a number of studies [29,30,31].
Nevertheless, most researchers do not find any significant difference regarding the economic performance of sustainable portfolios and conventional ones [32,33,34,35,36,37,38,39].
A possible explanation for this situation lies in the data employed. The meta-analysis by Revelli and Viviani [37] reveals that most of the studies rely on data by social rating agencies or use companies included in sustainability indices [40,41]. This might be a problem, as the methodologies applied by social rating agencies have been widely criticised for the lack of transparency and standardisation of the processes, as well as the unreliable information used, as information is mostly provided directly by the examined companies [17,42,43]. As a result, some researchers claim that the selection process implemented by those agencies to identify ethical and sustainable companies do not actually make it possible to discriminate between those companies really engaged in social responsibility and those which are not [42]. Obviously, if this claim is correct, it has a negative impact on the studies that employ the data from social rating agencies.
Moreover, many socially responsible mutual funds also rely on the information provided by social rating agencies or invest only in companies that are included in sustainability stock indices [44]. This could explain why it is not unusual to find clearly unethical firms in the portfolio of sustainable mutual funds [45] or why firms held by socially responsible funds exhibit poorer social performance than those in conventional funds [46].
Therefore, there is a concern about the screening activity of social rating agencies and it is necessary to research this. This study addressed this gap and explored whether it is actually possible that companies which should not be defined as socially responsible are included in financial products which hold this label. After a period during which research has focused on issues such as performance measures [47,48,49,50] and rankings [51,52,53], it is necessary to question again whether “ethical” or “socially responsible” investments are actually socially responsible.

3. Database Description

3.1. The Dow Jones Sustainability Index

The Dow Jones Sustainability World Index (hereinafter, DJSI World) was created in 1999 and is recognised by investors as one of the benchmarks for sustainable stock indexes. The index is jointly managed by RobecoSAM and S&P Dow Jones, which have expertise in the evaluation of companies in the field of sustainability and the creation of financial indices, respectively. The aim of the index is to track the stock market’s performance of major global companies with best-in-class economic, environmental and social performance. It offers investors an objective reference to managing their sustainable investment portfolios [54].
The DJSI World Index belongs to the family of DJSI indices, which assess the sustainability performance of major listed companies applying economic, environmental and social criteria using the best-in-class methodology.
The purpose of the index is to select those companies that comply with certain sustainability criteria better than other firms in the same industry. This detail is fundamental. Companies are not selected due to their corporate socially responsible actions in absolute terms but are selected, once certain criteria are met, based on their relative behaviour compared to their peers. A company’s performance is not good or bad in absolute terms but needs only to be better than the other companies in the same industry.
The best-in-class methodology also implies that there are no exclusion criteria. There are no specific irresponsible or illegal practices that imply a company is automatically expelled from the index. All reprehensible actions are, in principle, considered within the relevant evaluation criteria. However, their impact on the final eligibility is diluted by many specifically weighted criteria.
In contrast to the best-in-class approach, it is a negative screening. It is an alternative selection methodology electing those companies to be included in a sustainable index. This methodology defines certain irresponsible activities that imply the automatic exclusion from the index. Most of the sustainable indices that apply this methodology focus on business industries. Many sustainable indices explicitly exclude companies engaged in the production of alcoholic beverages, weapons, nuclear power or tobacco. Negative screening based on business activities is the origin of socially responsible investment [26,55]. However, there are no sustainable indices that explicitly use negative screening to automatically exclude companies that perform illegal or controversial activities, e.g., the violation of human rights, pollution on a large scale or infringement of labour regulations.
It is the best in class methodology that makes it possible for certain companies that have performed inexcusable actions in terms of sustainability and business ethics to be included as a constituent of a sustainability index.

3.2. The Selection of Companies

The selection process of around 320 companies that are included in the DJSI World Index is quite complex. A decisive factor for incorporating a company to the index is the so-called Total Sustainability Score (TSS) calculated by RobecoSAM in its annual analysis of corporations, called Corporate Sustainability Assessment (CSA). This annual analysis begins in March and the scores are published in September.
Every year RobecoSAM invites the 2500 largest companies, in terms of market capitalisation, in the S&P Global BMI Index to participate in the CSA. There are no restrictions regarding the business activity of each corporation. This group of companies is the so-called “invited universe”.
A questionnaire containing 80–120 questions, depending on the industrial sector of the companies, is sent to these companies, which are classified into 59 sectors. The questionnaire collates relevant financial information related to the economic, environmental and social activities of the company. The goal is to analyse sustainability factors that could have an impact on the potential to generate long-term value [56]. It is important to stress that the companies are personally responsible for completing the RobecoSAM form.
The questionnaire is designed to include both industry-specific criteria as well as general criteria relating to three dimensions of corporate social responsibility (economic, environmental and social). Each question is assigned to a criterion and each criterion belongs to a dimension. Each dimension has a specific weight. The economic dimension has a weight of 27%, the environmental of 38% and the social of 35% in the final score. The maximum score that one company can get is 100 points.
The general criteria analyse aspects relating to the three dimensions. The Economic dimension includes codes of conduct, corruption and bribery, corporate governance or crisis management. The Environmental dimension includes environmental policy and reporting of environmental information. The social dimension includes philanthropy, human capital development and the attraction and retention of talent.
Not every company returns the questionnaire, so the universe of invited companies is reduced to the so-called assessed universe. The companies that belong to this universe are those that responded. To ensure the correct diversification within the index, criteria related to the regions (North America, Europe and Asia Pacific) as well as the industry sector of each corporation are taken into consideration. Companies that did not return their questionnaire can still be included in the assessed universe. Publicly available data are used to complete their questionnaires.
The so-called eligible universe is obtained from eliminating those corporations with the lowest sustainability score (40% less than the highest score company) from the assessed universe. However, it is ensured that all 59 sectors include sufficient companies.
The companies that will eventually be included in the DJSI World Index are selected from the eligible universe. The selection is based on the sustainability score of each company. Priority is given to those companies that already belong to the index to minimise the turnover. Furthermore, an appropriate industry diversification is maintained.
The constituents of the DSJI world index are released every September. However, companies can be deleted from the index throughout the year if the DSJI Index Committee determines that a corporation no longer meets its current TSS.

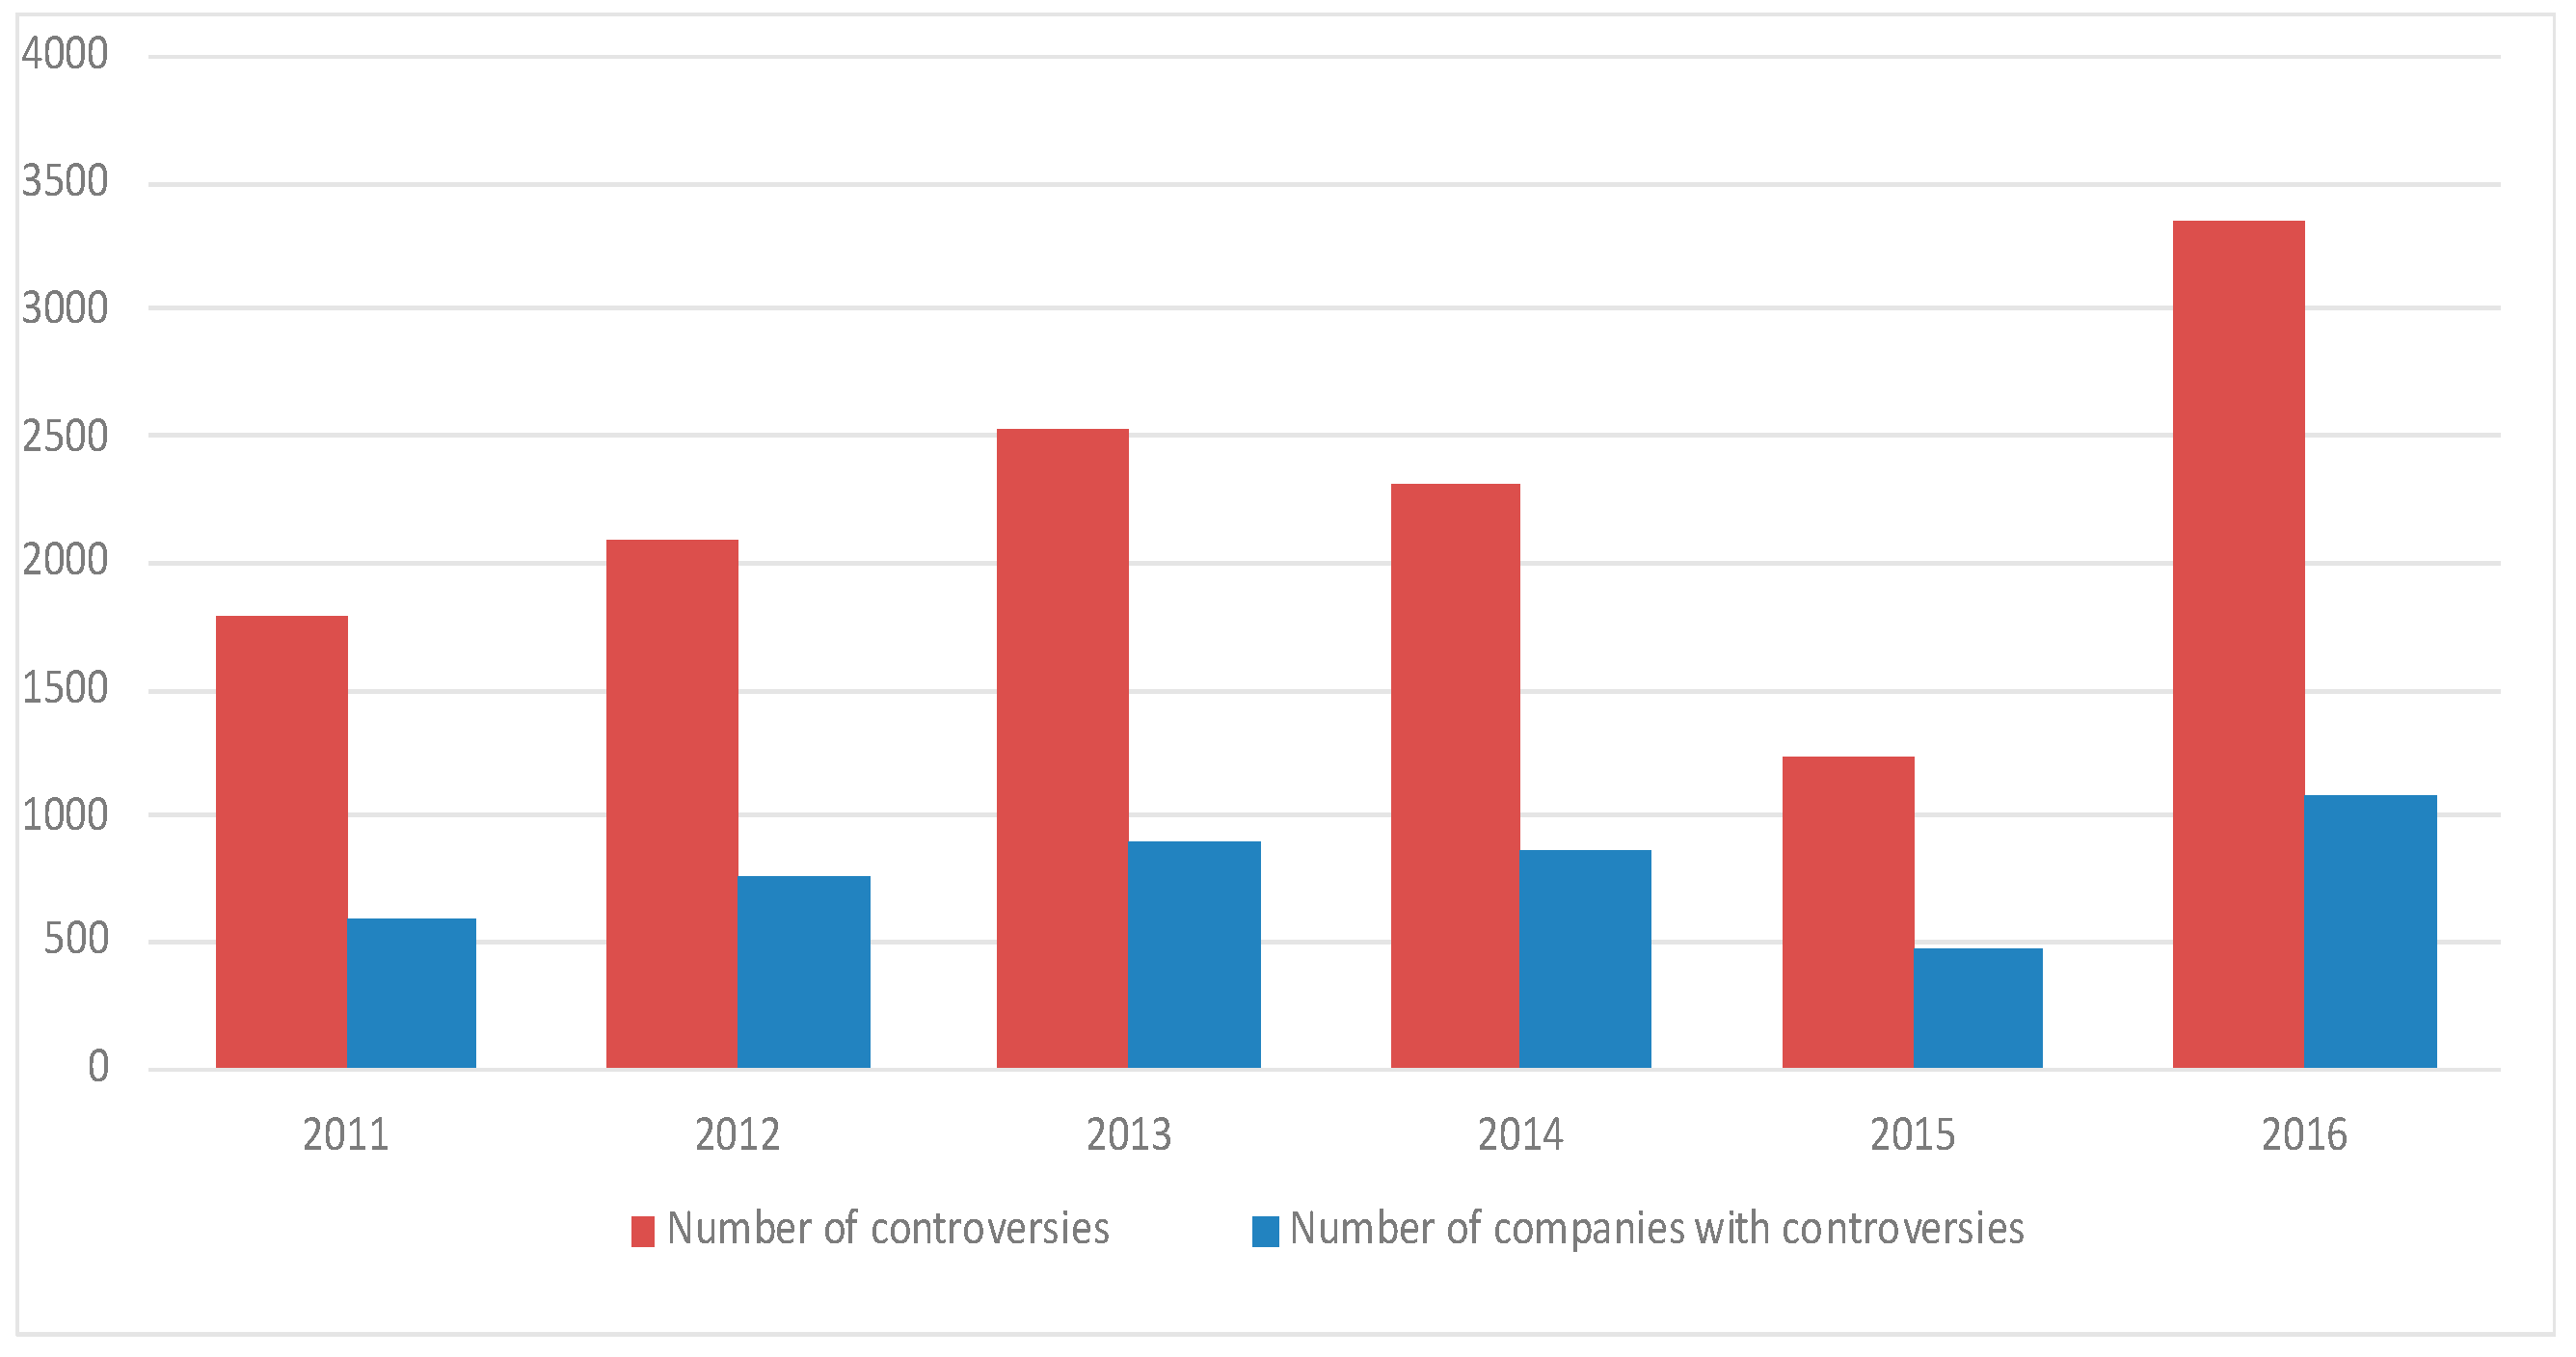
3.3. Controversies in the Thomson Reuters Eikon Database

As previously described, the sustainable stock index DSJI World selects its constituents by applying a best-in-class screening methodology. This does not guarantee that companies that have carried out irresponsible activities do not appear in the index.
Of course, it is important to define what is meant by “irresponsible activities”. A definition of the types of behaviours or actions preventing a company inclusion in a sustainable index is required. In principle, it can be argued that sustainable indices should include only a select group of companies with an unblemished record, or, at least, that constituent companies have not been involved in any scandal that reveals an irresponsible or unethical behaviour, especially those which could be the origin of legal prosecutions and fines or consumer boycotts. However, this definition is susceptible to different interpretations that can be addressed from different perspectives [40,44,45,46].
This study defined as “irresponsible activities “all those activities that have been classified as “controversies” in the Thomson Reuters’s Eikon database [57]. This is in line with other studies that use Environmental, Social and Governance (ESG) controversies to proxy the sustainable performance of companies [58].
The Eikon Thomson Reuters database draws up scores to quantify the sustainability of companies analysing the environmental, social and governance aspects from available public information of major listed companies. In addition, companies are rated depending on the controversies in which they are involved. More than 7000 worldwide listed public companies (the largest ones in terms of market capitalisation) are analysed every year. During the 2011–2016 period, 4604 companies were involved in at least one controversy.
Controversies are negative news that appear in the media. They are classified into 24 headings which in turn are grouped into seven categories (environment, community, labour, human rights, products, management team and shareholders). The impact of negative news can transcend the calendar year if there are future events related to that negative news, such as trials or imposition of fines. However, every negative news is only quantified once.
Figure 1 shows the growth of controversies as well as the number companies affected. The increase of controversies as well as the number of affected companies in 2016 is especially striking because it breaks a positive trend from 2014 and 2015. In 2016, more than 3000 controversial actions were committed by more than 1000 of the 7000 corporations analysed.

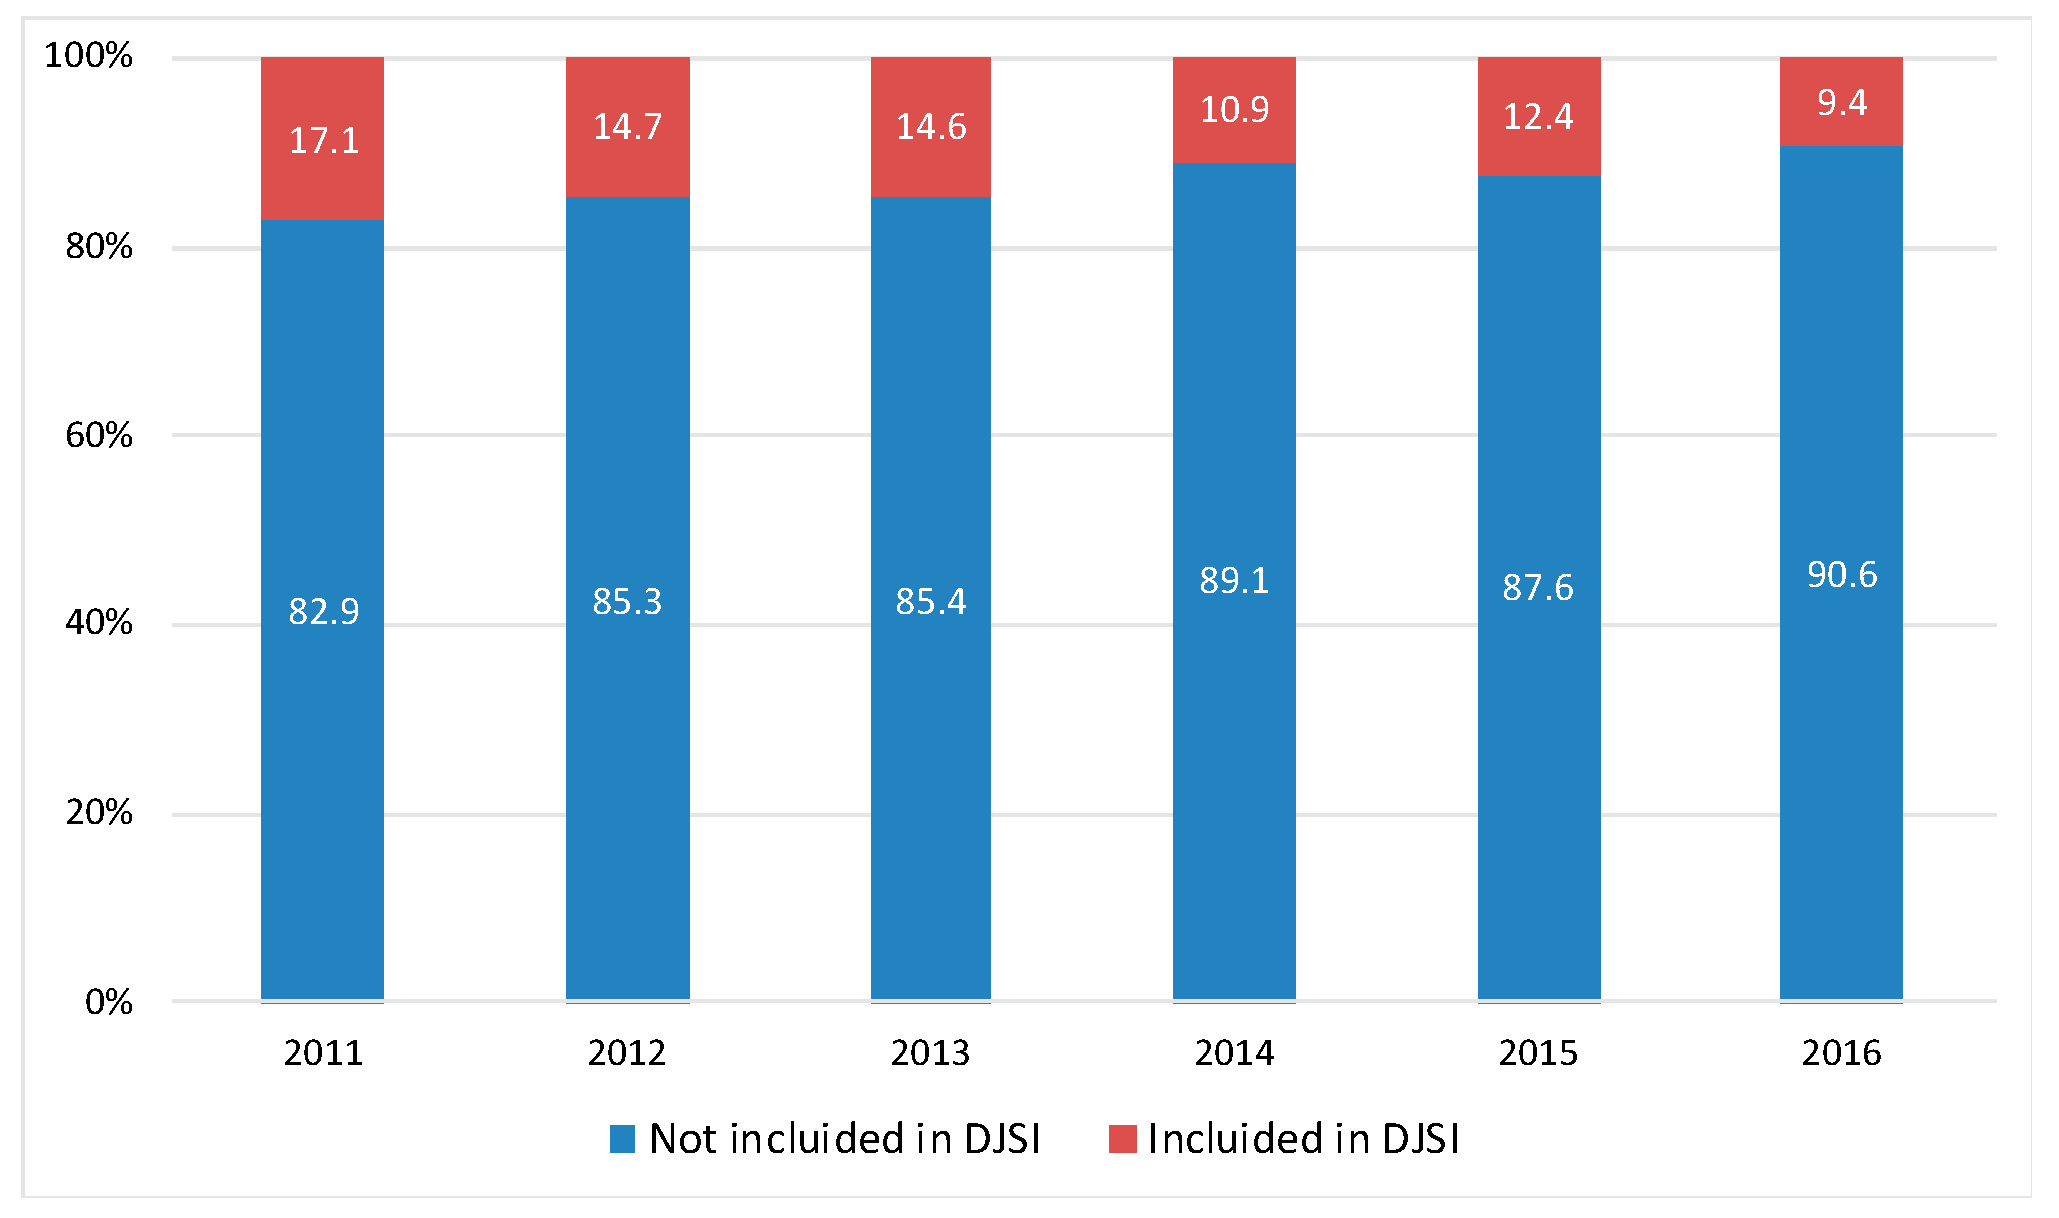
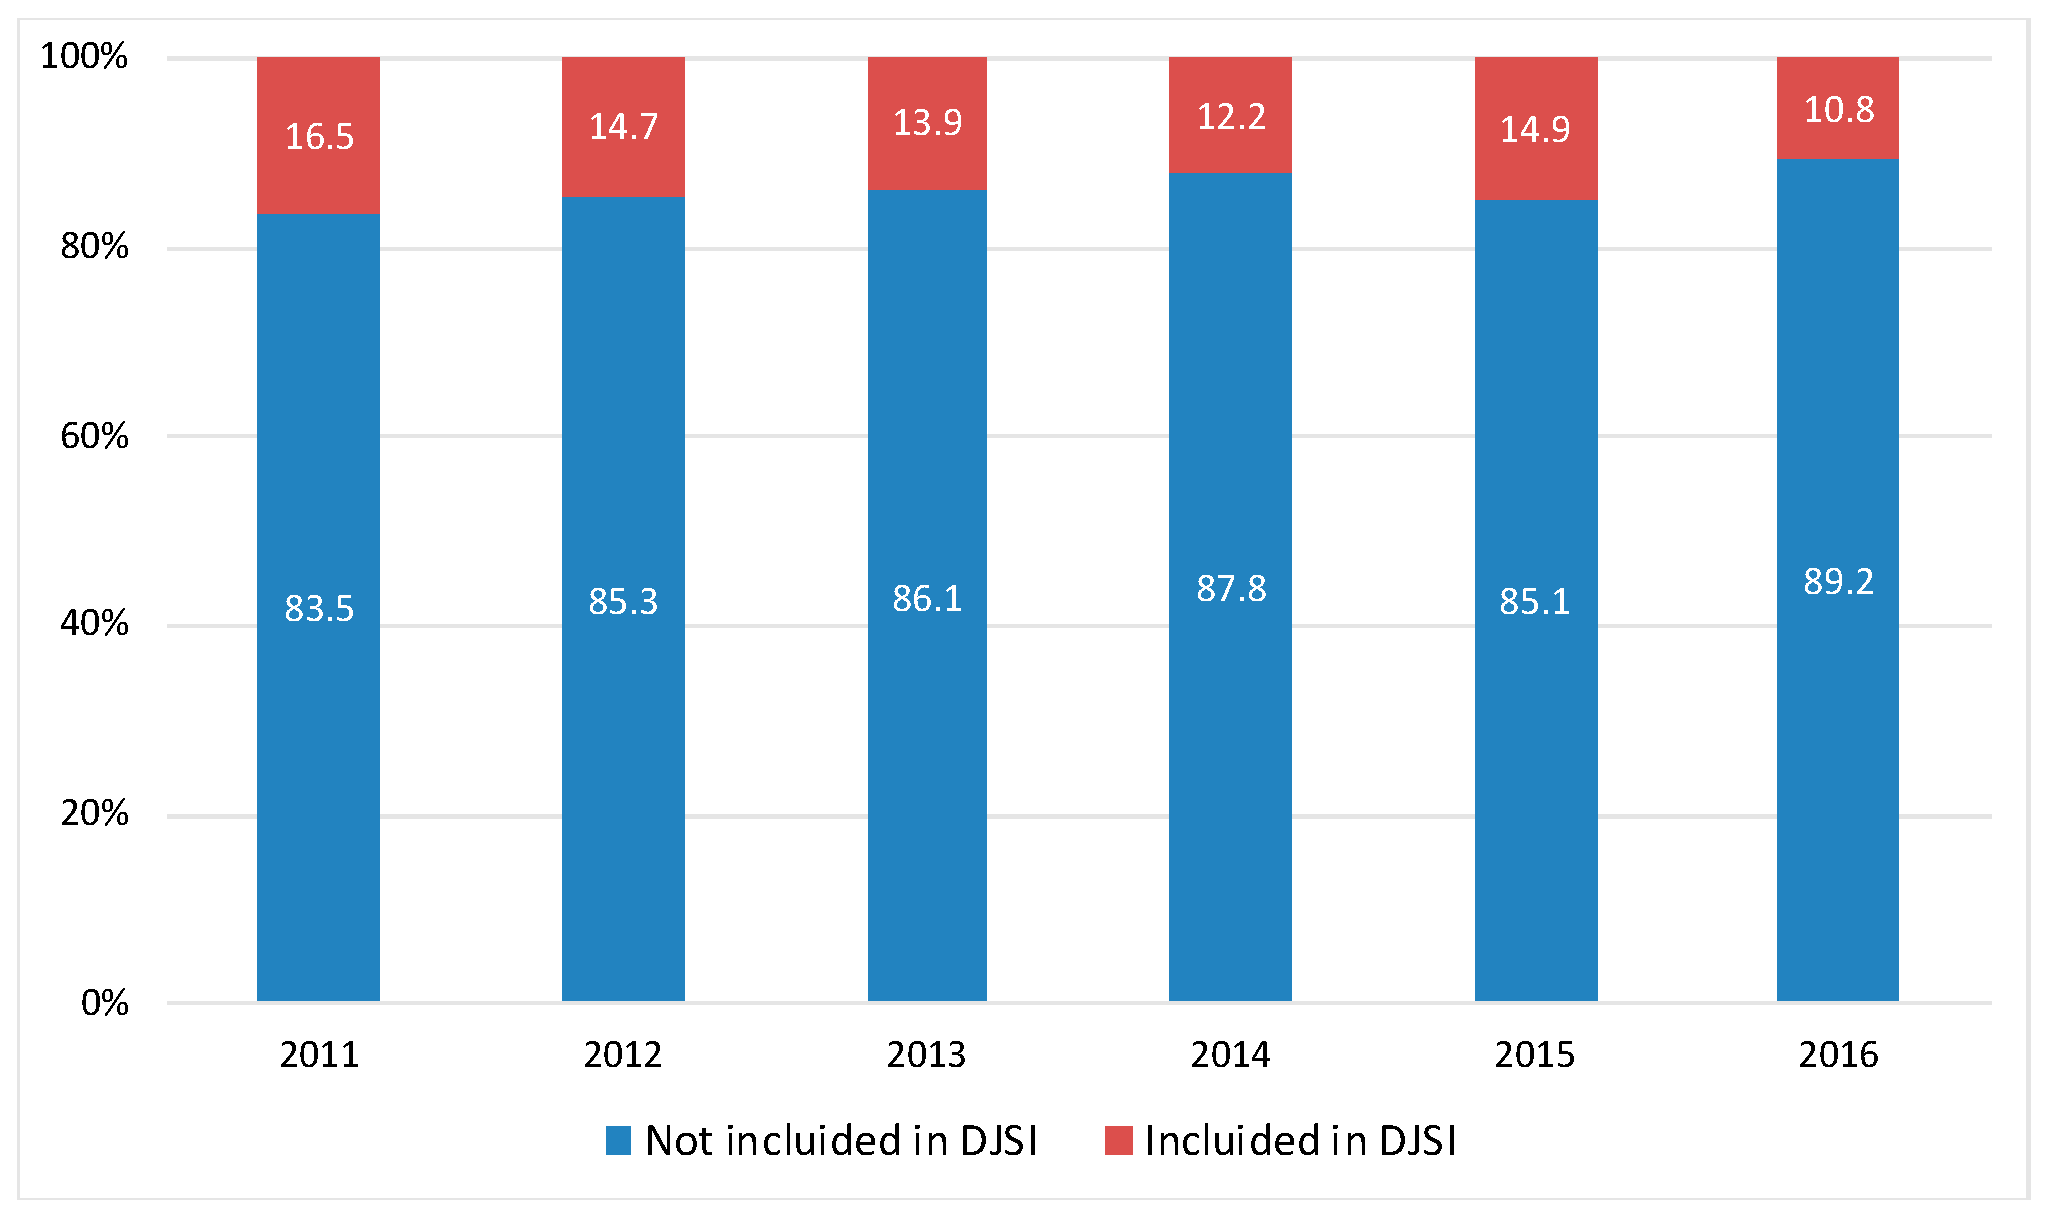
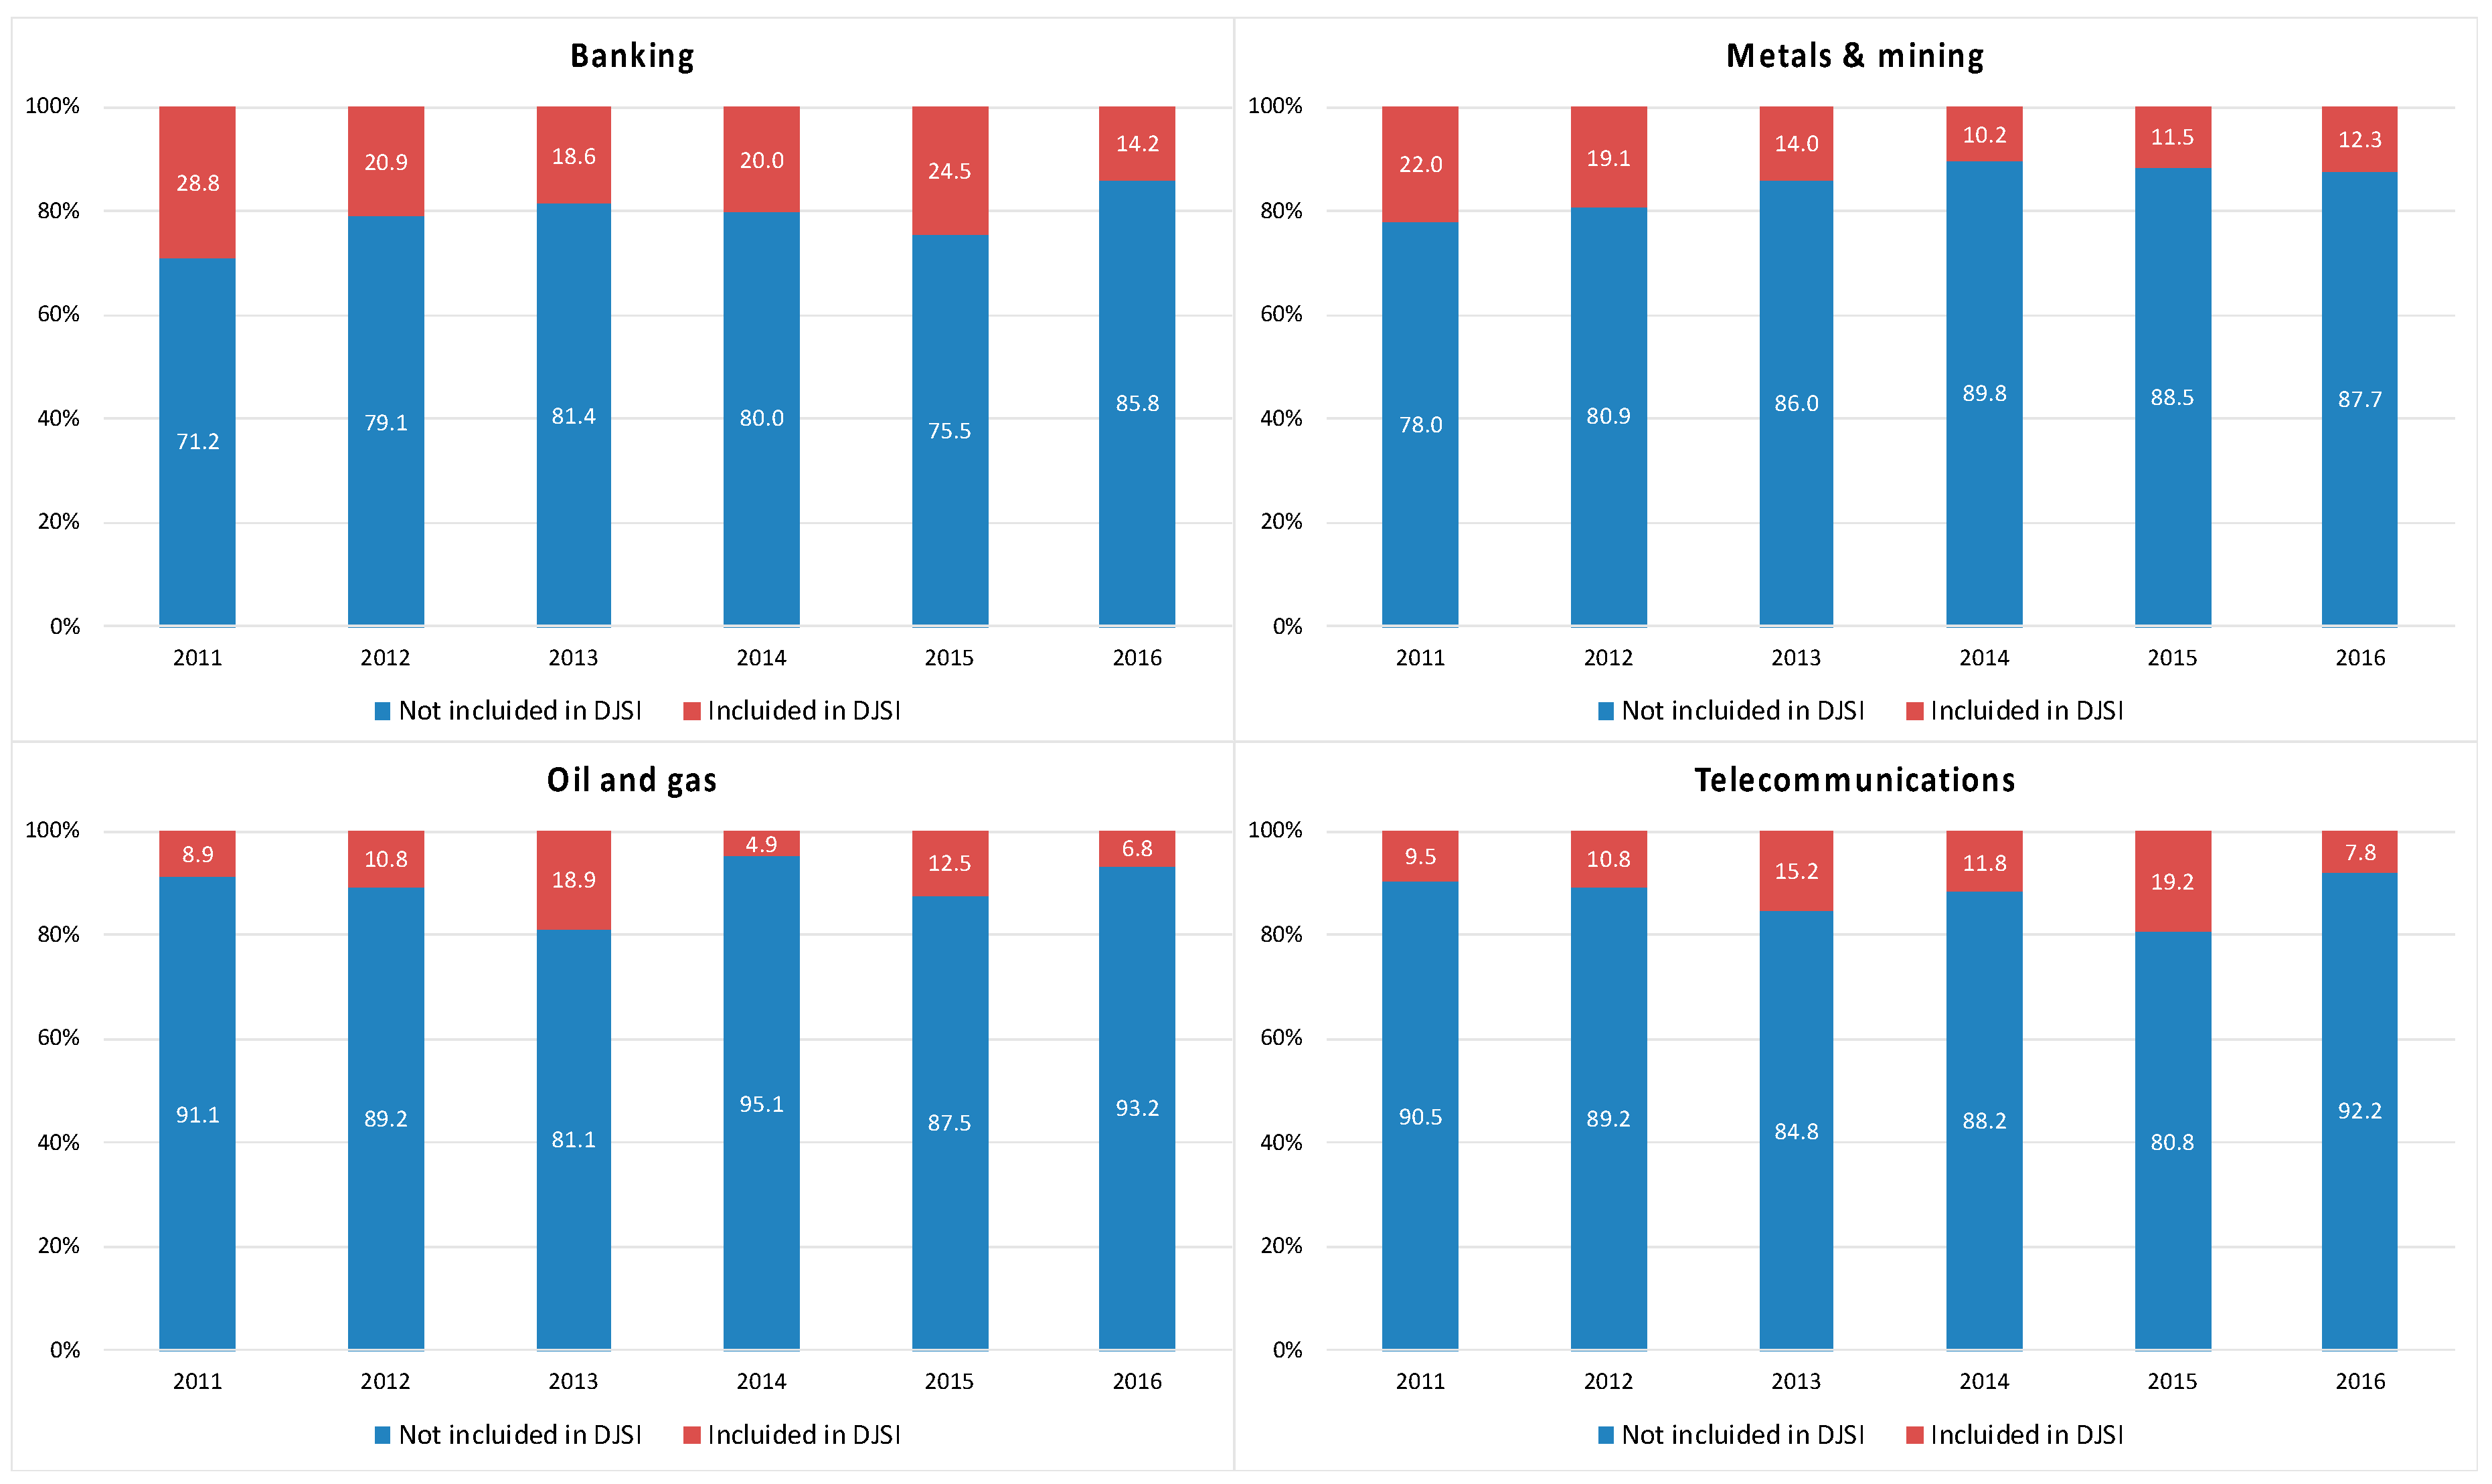
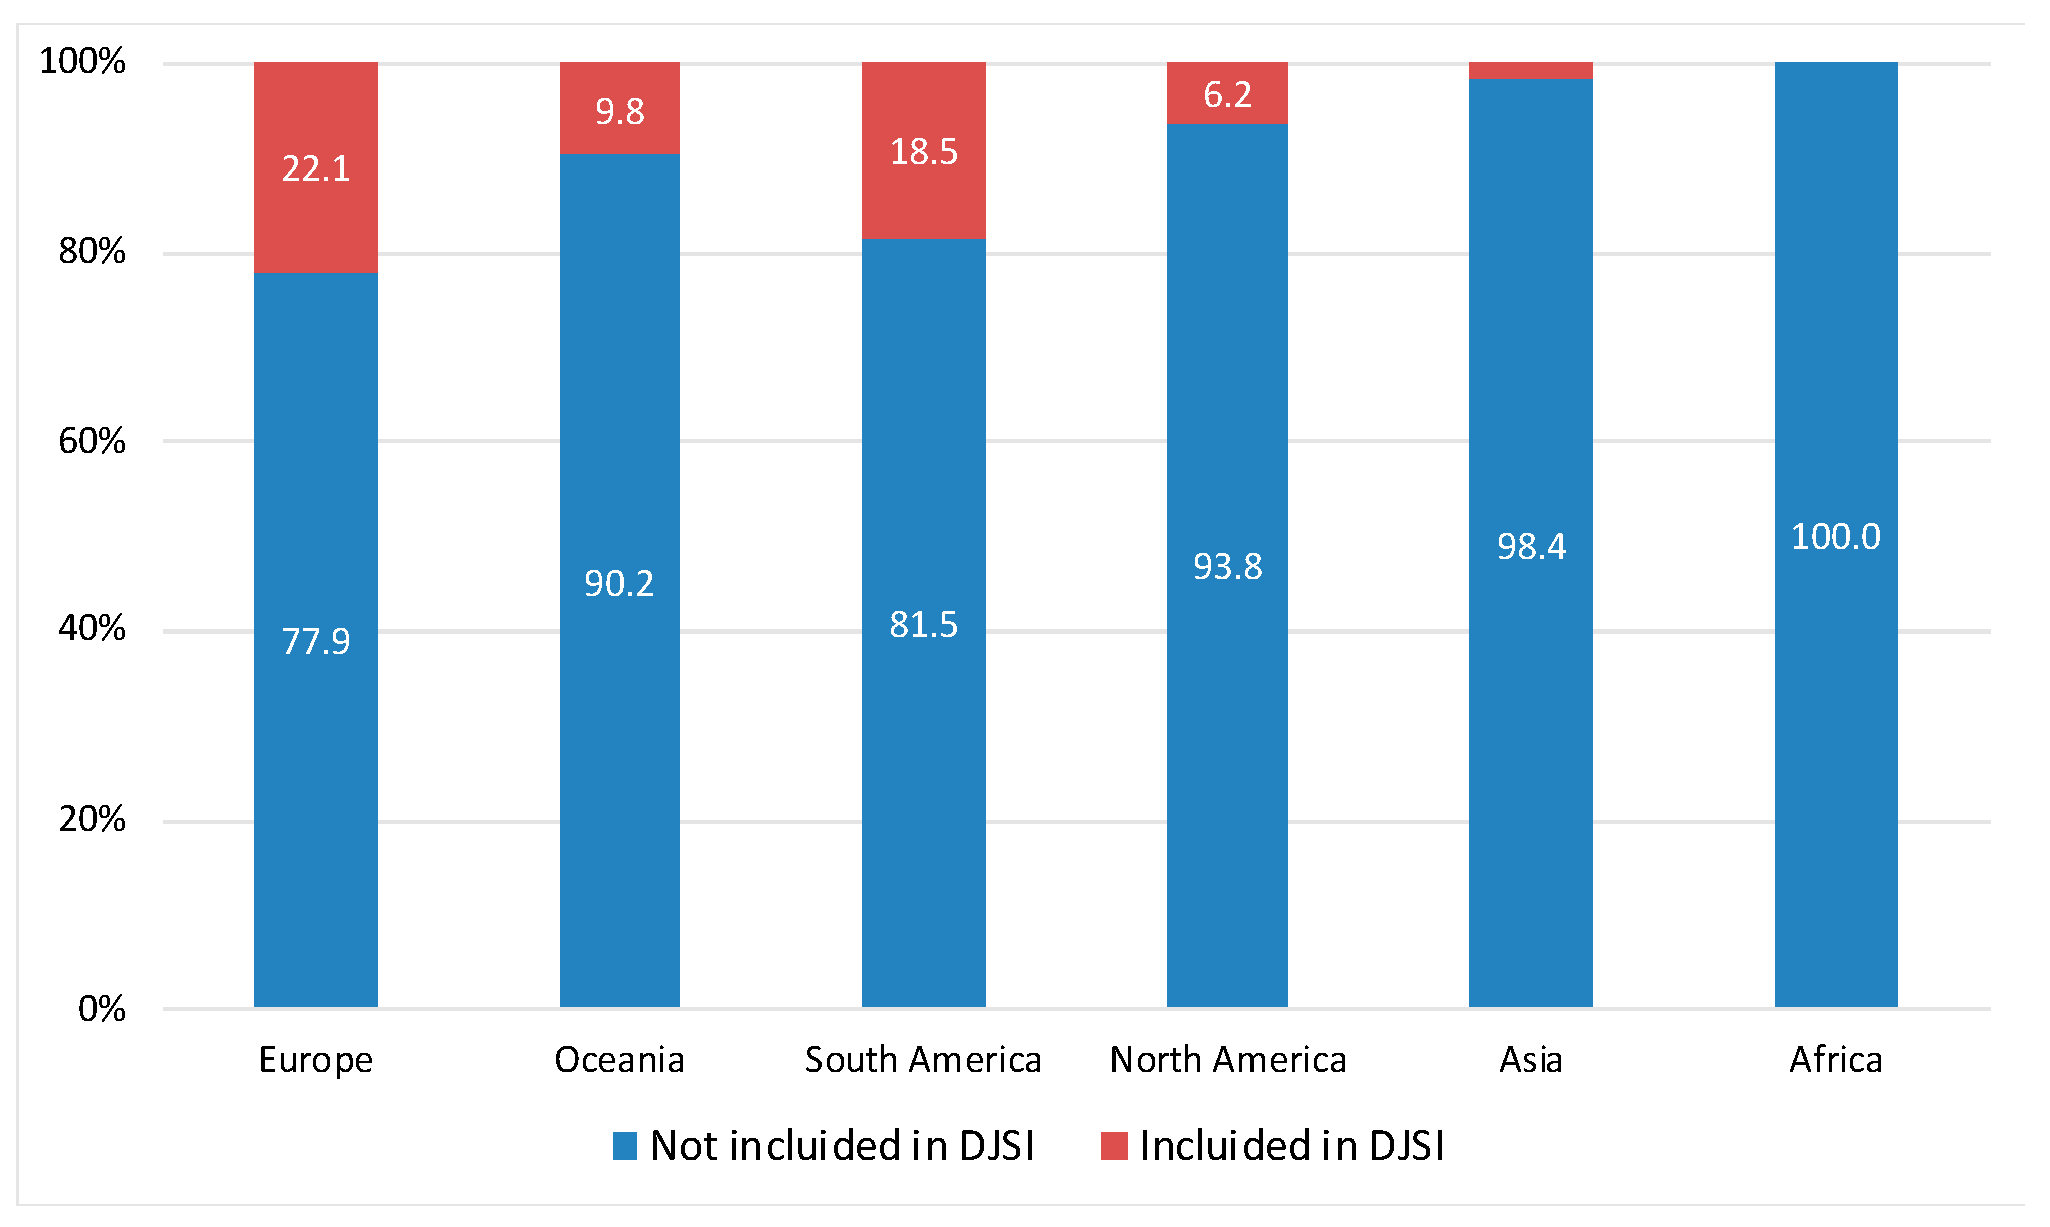
4. Results and Discussion

The objective of this study was to clarify whether the constituent selection methodology of the sustainable DJSI World Index, applying a best-in-class screening, prevents those companies with reprehensible or unethical behaviour from being selected. Unethical behaviour was defined as an action that generates negative news in the media and is considered a controversy by the Eikon database.
In principle, controversial companies are expected not to form part of the index. The average retail investor has difficulty understanding that a company involved in an environmental, labour, corruption, etc. scandal can belong to a sustainable index, regardless of the selection methodology used. An index including “controversial” companies as a reference for socially responsible investment would undoubtedly be meaningless.

Analysis of the Controversies Reported in the EIKON Database Relating to Companies Included in the DJSI World Index

Firstly, we studied the existence of controversial companies within the DJSI World Index, looking at the different industry sectors. Then, the different types of controversies and the inclusion of the controversial companies in the index were studied. Finally, it was verified whether the nationality of the controversial companies influences their inclusion in the index.
Figure 2 shows the percentage of companies that have committed irresponsible activities included in the DJSI World Index. In 2016, one in ten companies included in the index were involved in irresponsible activities. However, the percentage of corporations with a reprehensible action within the index has clearly declined in recent years. Between 2011 and 2016, the number of controversial companies included in the DJSI World Index has been reduced by 40%. This development may be due to a modification in the implementation of the methodology used by the index. As a result, more companies with bad reputation have been excluded from the index. The opposite development could have been expected, as in 2016 there was a marked increase in the controversies and the companies involved in socially irresponsible activities (Figure 1).
It is interesting to note the unusual development that takes place in 2015, as it breaks the descending trend, which continued in 2016.
An interesting aspect to analyse is whether a similar reduction has occurred in all industry sectors of controversial companies included in the DJSI World Index. To facilitate investigations, companies were classified into three industrial sectors: goods, services and works. In the period under study, corporations classified in the goods industry sector represented 48.4% of all the companies with controversies, the services industry sector represented 49.3%, and the works industry sector the remaining 2.3%. None of the companies in this 2.3% became members of the DJSI World Index. The analysis was therefore limited to the companies in the goods and services industry sectors.
Figure 3 shows an important decrease in the number of manufacturing companies included in the DJSI World index that behaved irresponsibly. Specifically, from 2011 to 2016, the percentage of manufacturing companies deemed as controversial managing to enter the index fell by 45%.
Regarding companies in the service industry, as shown in Figure 4, although the development was similar, it was not as pronounced as the goods industry sector. The percentage of controversial service industry companies in the index decreased by 35%, 10% less than manufacturing companies.
Figure 5 shows the development of the percentage of controversial companies that belong to the sustainable index DJSI World Index within specific industry sectors.
A selection of the four sectors with the largest number of companies with controversies throughout the period was made. These sectors are: banking, metals and mining, oil and gas and telecommunications.
By differentiating the companies according to their industry, it becomes evident that not every sector follows the previously mentioned development. Irresponsible companies in the banking and the metal and mining sectors are gradually reducing from the sustainable index, with only a slight increase in 2015 compared to 2014. The reduction in the banking and metal and mining sector is 51%, and 44%, respectably.
In the case of the oil and gas and telecommunications sectors, the situation is different. Firstly, the percentage of controversial companies included in the DJSI World Index in 2011 was much smaller than in the banking and metals and mining sectors, and well below the global value shown in Figure 2 (16.6%). However, in 2015, a strong increase in both sectors occurred, decreasing in 2016 to similar levels of 2011. It seems that the selection process used by DJSI World Index is somehow stricter with some sectors, while other sectors are handled with more flexibility. It would be interesting to analyse whether the industry diversification requirements of the index are responsible for this outcome.
Another aspect that is interesting to analyse is the type of irresponsible activities carried out by the companies included in the DJSI World Index. It is important to examine whether the selection criteria implemented by the index are influenced by some specific type of controversy and companies committing certain irresponsible activities are more likely to enter the index.
Table 1 shows the percentage of controversial companies that are included in the DSJI World index within the different controversy types: community, environment, human rights, management team, product, shareholders and labour.
Foremost, it is clear that the percentages of companies included vary greatly depending on the type of controversy. However, the trend is declining, in the sense that the percentage of controversial companies admitted to the index is getting lower, regardless the kind of controversy.
Special attention must be paid to companies with human rights controversies, where the percentages are especially high. This is especially striking in 2016, when there were only eight companies in the Eikon database with human rights disputes, out of which three were included in the DJSI World index.
It is also worth mentioning the development of management team related controversies. In 2011, two out of three companies with controversial actions in this area belonged to the sustainable index. Since then, the percentage has been drastically reduced, reaching 0% in 2015. It seems reasonable to think that the index selection process has been modified to be more scrupulous, or less lax, regarding this type of irresponsible activities.
Finally, it was studied if belonging to a specific country increases the probability that controversial companies become constituents of the DJSI World Index.
Table 2 shows the percentage of controversial companies that are included in the DJSI World Index, divided by country. The ten countries with the highest number of controversies during the examined period are included: Germany, Australia, Canada, China, South Korea, France, India, Japan, The United Kingdom and the United States. These 10 countries belong to the group of the 14 largest countries in the world in terms of GDP. This situation is expected, as Eikon only reports controversies from the largest companies in the world, which generally are located in high developed countries.
A simple look at Table 2 reveals that treatment by country is not homogeneous. The geographical diversification policy in the index has an impact in the selection of companies. Nevertheless, the development of every country is similar to the one described in Figure 2. That is, regardless of the country, at present, fewer controversial companies are accepted in the index compared to past years.
The percentage of controversial companies that are included in the DJSI World Index varies greatly between countries. The countries with the highest percentage in 2016, and also throughout the whole period, are Germany and France, followed by the United Kingdom. In other words, they are European countries.
The countries with fewer controversial companies within the DJSI World Index are Asian countries: China, India, Japan and South Korea. It is also striking that the United States has such a low percentage, the lowest among the Anglo-Saxon countries.
This leads us to think that the geographic diversification policy, the need to include a minimum number of companies from each region, decisively influences in the selection of companies. This impacts on the quality of the selected companies regarding their socially responsible behaviour. As the United States have a large number of global companies, well diversified among all industry sectors, it is easy to discard controversial companies. By contrast, European countries do not have such a wide range of options.
Furthermore, it should be questioned whether the analysis of companies is equally exhaustive in all regions or whether there is a language barrier to consider. It may be possible that certain companies performing irresponsible activities are both included in the DJSI World Index and not reflected in the Eikon controversies database as they are not subject to narrow scrutiny because of language barriers. It is surprising that, within the 10 countries selected with the most controversial companies, neither Italy nor Brazil, which are the eighth and ninth biggest economies in the world, respectively, are included, while Australia, which is the fourteenth biggest economy, is included.
Figure 6 also shows that the geographical diversification of the DJSI World Index plays an important role when companies are selected. This figure shows the percentage of companies with controversies that are included in the DJSI World Index, according to their region of origin: Europe, Oceania, South America, North America, Asia and Africa.
The conclusions that can be extracted are in line with those obtained analysing Table 1. It was confirmed that the percentage of companies with controversial behaviour that are included in the DJSI World Index is bigger for European countries. According to the Eikon database, in 2016 (Figure 6), of the 371 corporations performing irresponsible activities, 63 were European companies that were included in the sustainable index. Therefore, 22.1% of the European controversial companies listed in the Eikon database joined into the DJSI World Index. The second place was for South America (18.5%), although only five controversial companies were included in the sustainable index.
It is important to mention that there are no African companies in the DJSI Index, which means the index does not include controversial African companies. Regarding Asia, which only has four companies subject to controversies that have become index constituents, it is possible that the DJSI World Index selection process is stricter with Asian companies. However, it is also possible that Eikon monitors companies in this region less exhaustively than companies in other regions. A reason may be the difficulty of analysing the news in different languages. It is possible that the DJSI World Index could include controversial Asian companies that have not been identified as such by Eikon. This could explain why there is a low percentage, only 1.6%, of controversial Asian companies included in the index.
Regarding North America, of the 281 irresponsible companies, there are 23 controversial companies included DJSI World Index. In the case of North America, compared to Europe, it can be concluded that the range of large companies among which to select the constituents of the DJSI World Index is broader. Therefore, the index can include more companies that are not involved in controversial activities, explaining the low percentage (6.2%) of North American controversial companies included in the index compared to the percentage of European companies. (22.1%)

5. Conclusions

In the last two decades, sustainability has become a major concern. Thus, together with profitability and some other factors, corporate social responsibility and ethical behaviour have become important inputs in the investing decision making process.
Analysing companies in terms of sustainability and social corporate responsibility is a huge task that cannot properly be accomplished by individual investors. To facilitate this need, many social rating agencies have emerged that carry out this assessment. Their methodologies are applied by several sustainable, ethical or socially responsible stock indices that select companies based on their economic, environmental and social performance. Sustainable mutual funds and researchers suppose that companies included in these specialised indices can actually be defined as ethical, sustainable and socially responsible.
Occasionally, the media disclose scandals involving companies included in these sustainable indices that show that their behaviour is far from ethical, responsible or sustainable. Furthermore, several studies have criticised the screening methodologies employed by social rating agencies and claim they do not prevent irresponsible firms to be defined as “ethical”. In this situation, investors may wonder whether the process of selecting companies used by specialised organisations can be trusted.
This study analysed one of the most prestigious sustainable index in the world, the sustainable stock market index DJSI World. The aim was to assess to what extent companies performing controversial activities in terms of social corporate responsibility and sustainability are included. To identify irresponsible corporations within the index, the database of negative news or controversies elaborated by Eikon Thomson Reuters was used.
The principal result is that the index does include companies that have been involved in controversial activities. However, the percentage of irresponsible companies that are included in the index decreased significantly over the period analysed.
In addition, it has been concluded that, as the result of the selection process by the DJSI World Index, companies from specific geographical areas or specific industry sectors are more likely to be included in the index, even in the case of conducting socially irresponsible activities. There exists a significant geographical and industrial sector selection bias. This bias may be explained by the logical need of correctly diversifying the index and is in line with the classical portfolio management theory.
Finally, when analysing the different categories in which the controversies are classified, it is concluded that the general trend also applies. That is, the number of irresponsible companies included in the DJSI World Index is decreasing for most of the irresponsible activities covered by the Eikon database. This is particularly relevant in the case of management controversies, which have been reduced drastically.
This study is in line with previous works questioning whether all companies labelled as ethical, socially responsible or sustainable really deserve this label. It sheds light on some contradictory results obtained by researchers comparing the performance of socially responsible mutual funds and conventional funds.
At present, social rating agencies apply negative screening filters based on the industries or complex positive screening methodologies that have been widely criticised. A possible line for future research is employing simple and clear definitions and transparent filters to identify companies performing irresponsibly. In this study, we used to this end the controversies in the Thomson Reuters Eikondatabase, but there are many other options to identify bad behaviour and other databases are available. It is also interesting to conduct a similar analysis on other sustainable stock indices and socially responsible mutual funds to find whether the results obtained here reflect the general situation in the industry. Finally, quantitative models could be used to quantify the actual impact irresponsible behaviour has for social rating agencies when determining whether a company can be labelled as “ethical” or not.

Author Contributions

Conceptualisation, M.D.E.V., F.G., and P.B.M.B.; Data curation, I.A.; Methodology, I.A., M.D.E.V., and F.G.; Supervision, F.G.; Writing—original draft, P.B.M.B.; and Writing—review and editing, F.G.

Funding

This research received no funding.

Conflicts of Interest

The authors declare no conflict of interest.

References

  1. Ou, Y.C. Using a hybrid decision-making model to evaluate the sustainable development performance of high-tech listed companies. J. Bus. Econ. Manag. 2016, 17, 331–346. [Google Scholar] [CrossRef]
  2. Halkos, G.; Skouloudis, A. Revisiting the relationship between corporate social responsibility and national culture: A quantitative assessment. Manag. Decis. 2017, 55, 595–613. [Google Scholar] [CrossRef]
  3. Halkos, G.; Skouloudis, A. National CSR and institutional conditions: An exploratory study. J. Clean. Prod. 2016, 139, 1150–1156. [Google Scholar] [CrossRef]
  4. Skouloudis, A.; Evangelinos, K. A research design for mapping national CSR terrains. J. Sustain. Dev. World Ecol. 2012, 19, 130–143. [Google Scholar] [CrossRef]
  5. Achim, M.V.; Borlea, S.N.; Mare, C. Corporate governance and business performance: Evidence for the Romanian economy. J. Bus. Econ. Manag. 2016, 17, 458–474. [Google Scholar] [CrossRef]
  6. Silvestre, W.J.; Antunes, P.; Filho, W.L. The corporate sustainability typology: Analysing sustainability drivers and fostering sustainability at enterprises. Technol. Econ. Dev. Econ. 2018, 24, 513–533. [Google Scholar] [CrossRef]
  7. Rodriguez-Fernandez, M. Social responsibility and financial performance: The role of good corporate governance. BRQ Bus. Res. Q. 2016, 19, 137–151. [Google Scholar] [CrossRef] [Green Version]
  8. Tebini, H.; M’Zali, B.; Lang, P.; Perez-Gladish, B. The economic impact of environmentally responsible practices. Corp. Soc. Responsib. Environ. Manag. 2016, 23, 333–344. [Google Scholar] [CrossRef]
  9. Gherghina, Ş.C.; Vintilă, G. Exploring the impact of corporate social responsibility policies on firm value: The case of listed companies in Romania. Econ. Sociol. 2016, 9, 23–42. [Google Scholar] [CrossRef]
  10. Li, S.; Ngniatedema, T.; Chen, F. Understanding the impact of green initiatives and green performance on financial performance in the US. Bus. Strateg. Environ. 2017, 79, 776–790. [Google Scholar] [CrossRef]
  11. Jankalová, M.; Jankal, R. The assessment of corporate social responsibility: Approaches analysis. Entrep. Sustain. Issues 2017, 4, 441–459. [Google Scholar] [CrossRef]
  12. García-Melón, M.; Pérez-Gladish, B.; Gómez-Navarro, T.; Mendez-Rodriguez, P. Assessing mutual funds’ corporate social responsibility: A multistakeholder-AHP based methodology. Ann. Oper. Res. 2016, 244, 475–503. [Google Scholar] [CrossRef]
  13. Miralles-Quirós, M.M.; Miralles-Quirós, J.L. Improving diversification opportunities for socially responsible investors. J. Bus. Ethics 2017, 140, 339–351. [Google Scholar] [CrossRef]
  14. GSIA. Global Sustainable Investment Review 2016; GSIA: Washington, DC, USA, 2016; Available online: http://www.gsi-alliance.org/wp-content/uploads/2017/03/GSIR_Review2016.F.pdf (accessed on 17 October 2018).
  15. Schwartz, M.S. The “ethics” of ethical investing. J. Bus. Ethics 2003, 43, 195–213. [Google Scholar] [CrossRef]
  16. Hellsten, S.; Mallin, C. Are “ethical” or “socially responsible” investments socially responsible? J. Bus. Ethics 2006, 66, 393–406. [Google Scholar] [CrossRef]
  17. Chatterji, A.; Levine, D. Breaking down the wall of codes: Evaluating non-financial performance measurement. Calif. Manag. Rev. 2006, 48, 29–51. [Google Scholar] [CrossRef]
  18. Renneboog, L.; Ter Horst, J.; Zhang, C. Socially responsible investments: Institutional aspects, performance, and investor behavior. J. Bank. Financ. 2008, 32, 1723–1742. [Google Scholar] [CrossRef]
  19. Capelle-Blancard, G.; Monjon, S. Trends in the literature on socially responsible investment: Looking for the keys under the lamppost. Bus. Ethics 2012, 21, 239–250. [Google Scholar] [CrossRef]
  20. Markowitz, H. Portfolio selection. J. Financ. 1952, 7, 77–91. [Google Scholar]
  21. Markowitz, H. Portfolio Selection: Efficient Diversification of Investments; Yale University Press: New Haven, CT, USA, 1959. [Google Scholar]
  22. Arribas, I.; Espinós-Vañó, M.D.; García, F.; Tamosiuniene, R. Negative screening and sustainable portfolio diversification. Int. J. Entrep. Sustain. Issues 2019, forthcoming. [Google Scholar]
  23. Trinks, P.J.; Scholtens, B. The opportunity cost of negative screening in socially responsible investing. J. Bus. Ethics 2017, 140, 193–208. [Google Scholar] [CrossRef]
  24. Nainggolan, Y.; How, J.; Verhoeven, P. Ethical screening and financial performance: The case of islamic equity funds. J. Bus. Ethics 2016, 137, 83–99. [Google Scholar] [CrossRef]
  25. Lesser, K.; Rößle, F.; Walkshäusl, C. Socially responsible, green, and faith-based investment strategies: Screening activity matters! Financ. Res. Lett. 2016, 16, 171–178. [Google Scholar] [CrossRef]
  26. Von Wallis, M.; Klein, C. Ethical requirement and financial interest: A literature review on socially responsible investing. Bus. Res. 2015, 8, 61–98. [Google Scholar] [CrossRef]
  27. Freeman, R.E. Strategic Management: A Stakeholder Approach; Prentice Hall: Boston, MA, USA, 1984. [Google Scholar]
  28. Girerd-Potin, I.; Jimenez-Garces, S.; Louvet, P. Which dimensions of social responsibility concern financial investors? J. Bus. Ethics 2014, 121, 559–576. [Google Scholar] [CrossRef]
  29. Bertrand, P.; Lapointe, V. How performance of risk-based strategies is modified by socially responsible investment universe? Int. Rev. Financ. Anal. 2014, 38, 175–190. [Google Scholar] [CrossRef]
  30. Lean, H.H.; Ang, W.R.; Smyth, R. Performance and performance persistence of socially responsible investment funds in Europe and North America. N. Am. J. Econ. Financ. 2015, 34, 254–266. [Google Scholar] [CrossRef] [Green Version]
  31. Lyn, E.O.; Zychowicz, E.J. The impact of faith-based screens on investment performance. J. Investig. 2010, 19, 136–143. [Google Scholar] [CrossRef]
  32. Xiao, Y.; Faff, R.; Gharghori, P. The financial performance of socially responsible investments: Insights from the Intertemporal CAPM. J. Bus. Ethics 2017, 146, 353–364. [Google Scholar] [CrossRef]
  33. Reddy, K.; Mirza, N.; Naqvi, B.; Fu, M. Comparative risk adjusted performance of Islamic, socially responsible and conventional funds: Evidence from United Kingdom. Econ. Model. 2017, 66, 233–243. [Google Scholar] [CrossRef]
  34. Muñoz, F.; Vargas, M.; Marco, I. Environmental mutual funds: Financial performance and managerial abilities. J. Bus. Ethics 2014, 124, 551–569. [Google Scholar] [CrossRef]
  35. Van Duuren, E.; Plantinga, A.; Scholtens, B. ESG integration and the investment management process: Fundamental investing reinvented. J. Bus. Ethics 2016, 138, 525–533. [Google Scholar] [CrossRef]
  36. Ibikunle, G.; Steffen, T. European green mutual fund performance: A comparative analysis with their conventional and black peers. J. Bus. Ethics 2017, 145, 337–355. [Google Scholar] [CrossRef]
  37. Revelli, C.; Viviani, J.L. Financial performance of socially responsible investing (SRI): What have we learned? A meta-analysis. Bus. Ethics A Eur. Rev. 2015, 24, 158–185. [Google Scholar] [CrossRef]
  38. Renneboog, L.; Ter Horst, J.; Zhang, C. Is ethical money financially smart? Nonfinancial attributes and money flows of socially responsible investment funds. J. Financ. Intermed. 2011, 20, 562–588. [Google Scholar] [CrossRef]
  39. Humphrey, J.E.; Warren, G.J. What is different about socially responsible funds? A holdings-based analysis. J. Bus. Ethics 2016, 138, 263–277. [Google Scholar] [CrossRef]
  40. Charlo, M.J.; Moya, I.; Muñoz, A.M. Sustainable development in Spanish listed companies: A strategic approach. Corp. Soc. Responsib. Environ. Manag. 2017, 24, 222–234. [Google Scholar] [CrossRef]
  41. Charlo, M.J.; Moya, I.; Muñoz, A.M. Sustainable development and corporate financial performance: A study based on the FTSE4Good IBEX index. Bus. Strateg. Environ. 2015, 24, 277–288. [Google Scholar] [CrossRef]
  42. Windolph, S.E. Assessing corporate sustainability through ratings: Challenges and their causes. J. Environ. Sustain. 2011, 1, 1–22. [Google Scholar] [CrossRef]
  43. Searcy, C.; Elkhawas, D. Corporate sustainability ratings: An investigation into how corporations use the Dow Jones sustainability index. J. Clean. Prod. 2012, 35, 79–92. [Google Scholar] [CrossRef]
  44. Ziegler, A.; Schröder, M. What determines the inclusion in a sustainability stock index? A panel data analysis for European firms. Ecol. Econ. 2010, 69, 848–856. [Google Scholar] [CrossRef]
  45. Utz, S.; Wimmer, M. Are they any good at all? A financial and ethical analysis of socially responsible mutual funds. J. Asset Manag. 2014, 15, 72–82. [Google Scholar] [CrossRef] [Green Version]
  46. Gangi, F.; Varrone, N. Screening activities by socially responsible funds: A matter of agency? J. Clean. Prod. 2018, 197, 842–855. [Google Scholar] [CrossRef]
  47. Verheyden, T.; De Moor, L. Multi–criteria decision analysis: Methods to define and evaluate socially responsible investments. Int. J. Manag. Decis. Mak. 2014, 14, 44–65. [Google Scholar] [CrossRef]
  48. Lamata, M.T.; Liern, V.; Pérez-Gladish, B. Doing good by doing well: A MCDM framework for evaluating corporate social responsibility attractiveness. Ann. Oper. Res. 2018, 267, 249–266. [Google Scholar] [CrossRef]
  49. Escrig-Olmedo, E.; Muñoz-Torres, M.J.; Fernández-Izquierdo, M.Á.; Rivera-Lirio, J.M. Measuring corporate environmental performance: A methodology for sustainable development. Bus. Strateg. Environ. 2017, 26, 142–162. [Google Scholar] [CrossRef]
  50. Montiel, I.; Delgado-Ceballos, J. Defining and measuring corporate sustainability: Are we there yet? Organ. Environ. 2014, 27, 113–139. [Google Scholar] [CrossRef]
  51. Pérez-Gladish, B.; Méndez, P.; M’Zali, B. Ranking socially responsible mutual funds. Int. J. Energy Optim. Eng. 2012, 37, 559–594. [Google Scholar] [CrossRef]
  52. García-Martínez, G.; Guijarro, F.; Poyatos, J.A. Measuring the social responsibility of European companies: A goal programming approach. Int. Trans. Oper. Res. 2017, 26, 1074–1095. [Google Scholar] [CrossRef]
  53. Cervelló-Royo, R.; Guijarro, F.; Martinez-Gomez, V. Social Performance considered within the global performance of Microfinance Institutions: A new approach. Oper. Res. 2017, 1–19. [Google Scholar] [CrossRef]
  54. S&P Dow Jones Indices; RobecoSAM. Dow Jones Sustainability Indices. Methodology. Available online: https://www.sustainability-indices.com/ (accessed on 17 October 2018).
  55. Balcilar, M.; Demirer, R.; Gupta, R. Do sustainable stocks offer diversification benefits for conventional portfolios? An empirical analysis of risk spillovers and dynamic correlations. Sustainability 2017, 9, 1799. [Google Scholar] [CrossRef]
  56. RobecoSAM. Measuring “Intangibles”. Available online: https://www.robecosam.com/csa/csa-resources/csa-methodology.html (accessed on 15 October 2017).
  57. Thomson Reuters. Thomson Reuters ESG Scores. Available online: https://www.refinitiv.com/content/dam/marketing/en_us/documents/methodology/esg-scores-methodology.pdf (accessed on 17 October 2018).
  58. Aouadi, A.; Marsat, S. Do ESG controversies matter for firm value? Evidence from international data. J. Bus. Ethics 2018, 151, 1027–1047. [Google Scholar] [CrossRef]
Figure 1. Total controversies and number of companies with controversies, 2011–2016.
Sustainability 11 02047 g001
Figure 2. Percentage of controversial companies included in the DJSI World Index.
Sustainability 11 02047 g002
Figure 3. Percentage of controversial manufacturing companies included in the DJSI World Index.
Sustainability 11 02047 g003
Figure 4. Percentage of controversial service companies included in the DJSI World Index.
Sustainability 11 02047 g004
Figure 5. Percentage of controversial companies included in the DJSI World Index. Selected industry sectors.
Sustainability 11 02047 g005
Figure 6. Percentage of controversial companies included in the DJSI World by region. Year 2016.
Sustainability 11 02047 g006
Table 1. Percentage of controversial companies included in the DJSI by type of controversy.
201120122013201420152016
Community18.513.816.512.417.411.1
Environment23.830.025.914.318.611.9
Human rights20.621.433.37.19.127.3
Management75.047.423.840.00.07.1
Product25.620.614.713.011.012.1
Shareholders20.016.413.213.015.111.5
Workforce18.418.518.412.615.212.1
Table 2. Percentage of controversial companies included in the DJSI by country.
201120122013201420152016
Australia25.020.722.07.420.010.5
Canada7.711.821.417.916.712.8
China13.310.79.76.713.010.5
France41.435.737.525.942.948.1
Germany54.541.739.341.736.425.0
India8.30.02.95.63.82.2
Japan2.24.52.00.02.41.4
South Korea13.310.79.76.713.010.5
United Kingdom34.434.520.523.528.118.1
United States8.17.47.75.68.55.4

