Article

Comparative Analysis of Two Urban Microclimates: Energy Consumption and Greenhouse Gas Emissions

by
Néstor Santillán-Soto
1,*,
O. Rafael García-Cueto
1,
Alejandro A. Lambert-Arista
2,
Sara Ojeda-Benítez
1 and
Samantha E. Cruz-Sotelo
2
1
Instituto de Ingeniería, Universidad Autónoma de Baja California, Mexicali 21280, Mexico
2
Facultad de Ingeniería, Universidad Autónoma de Baja California, Mexicali 21280, Mexico
*
Author to whom correspondence should be addressed.
Sustainability 2019, 11(7), 2045; https://doi.org/10.3390/su11072045
Submission received: 11 February 2019 / Revised: 29 March 2019 / Accepted: 30 March 2019 / Published: 6 April 2019

Abstract

:
This paper presents a hypothetical and comparative performance of a 5 ton air conditioner (AC) operating in two zones in different urban microclimates for 25 days. One site represents a type of homogeneous planned urbanism and the other is a traditional heterogeneous zone. Air temperature data was collected and then processed using a linear regression model included in the operating manual of the AC in order to obtain their energy consumption. Results indicate that for an area with 500 homes, a traditional urban complex requires 12,350 kWh of electrical energy more than a planned zone (1.89%). This extra energy amounts up to $1180 and adds 9191 kg of CO2 to the atmosphere. The increased energy consumption has implications that increase the cost and environmental aspects of two urban microclimates, so that urbanization without planning is less friendly to the environment. In this sense, this study highlights the effects of urban microclimates on domestic electricity consumption from air conditioning. In addition, for a city with an arid desert climate, the variation in electricity consumption is associated with changes in the urban mosaic. The results found represent scientific evidence that can be used as a reference to establish public policies that could be incorporated into the local construction regulations, oriented to reduce the energy consumption associated with the use of air conditioning equipment.

1. Introduction

Living comfortably in a city with extreme weather requires air conditioning (AC) to be used in indoor spaces to exchange heat flow with the outside air. In growing cities, the energy, economic, and environmental benefits of AC have been accomplished as a result of implementing the use of more efficient AC and better planning zone policies [1]. For established cities located in the most extreme climates with high temperatures, AC systems remain the largest energy consumer in homes and buildings. In such cities, the priority is improving AC energy efficiency, which is central to the conservation of energy resources and environmental protection [2,3].
Residential and commercial buildings have played a major role in energy consumption, which continues to climb. An increase of 20–40% in energy usage in developed countries has surpassed the other major sectors: industrial and transportation [4]. In buildings, the fastest growing service is the use of energy for heat, ventilation, and air conditioning (HVAC) systems, and is particularly significant because 50% of the energy goes to cooling buildings, representing 20% of the total consumption in the US, and there seems to be general consensus that there are hefty swaths of energy wastage in centrally air conditioned locations, especially in public buildings [4,5]. In Malaysia, AC accounts for 57% of the energy demand, making it the major energy user [6], and in South Asia the energy demand for residential AC could increase by approximately 50% due to climate change [7].
Scott [8] and Huang [9] documented that in US cities a significant impact of energy consumption is due to climate fluctuations on individual buildings because weather conditions play a decisive role in electricity consumption [10,11]. Estimations by climate models link climate parameters like wind speed, and cooling and heating temperatures with residential electricity consumption [12], that suggest a nominal sensitivity of 2–4% for each degree increase in temperature. Sailor and Pavlova [13] applied weather sensitivity to energy consumption in response to climate variability and found that there is a saturation of the air conditioning market in 39 cities in the US, which revealed a strong relationship between the days of saturation and the degree of cooling.
On the other hand, the cities, by changing the native land cover with materials from the urbanization, modify the energy balance in the lower atmosphere, favoring the formation of the urban heat island (UHI), a phenomenon in which the temperatures of urban areas are hotter than their surroundings [14,15,16]. An important effect of the UHI is the increase in the use of energy, especially to cool buildings with air conditioning [17]. Due to the use of more fossil fuels to meet energy demands, urbanization has global repercussions, for the increase in greenhouse gases (GHG), and consequently in global climate change, and locally in urban warming.
Due to the above, it is observed that the UHI has a direct effect on the urban microclimate and the energy consumed to heat and cool buildings [18]. The magnitude of the UHI and its effect on energy consumption depends on many parameters, in particular, the excessive urban warming, the types and characteristics of the constructions under consideration, and the local microclimate [19,20,21]. In a review of studies conducted by Santamouris [17], he concludes that the average increase in cooling demand for these causes is up to 23%. In Athens, it was found that the cooling load in urban constructions can be doubled, and the peak electricity load for cooling purposes can be tripled [22]. Regarding the cooling load, in typical urban constructions it is 13% higher than similar constructions in rural areas [17]. In a study carried out in the Mediterranean area [23], the effect of the urban heat island (UHI) is particularly worrisome, since climate change and the UHI scenarios foresee a rapid growth in energy consumption for the upcoming years, due to the generalization of air conditioning systems and the increase in cooling demand. The intensity of the UHI is, therefore, a key variable for the prediction of energy needs in urban areas.
Smith and Levermore emphasize that the most severe effects of greater warming will be felt in large cities, so the cooling of the urban environment will be a high priority for urban planners and designers [24]. To achieve this, it will be necessary to modify the urban microclimate, changing its absorption and heat emission through, for example, the implementation of green areas, the use of highly reflective materials, and an increment of the opening between buildings to allow convective cooling of the wind. All this must be accompanied by complementary policies and planning commitments to manage their implementation, especially in buildings and existing urban areas. In this sense, it is important to analyze the different urban microclimates present in a city, as well as perform a comparative analysis of the energy consumption associated with them. These would provide tools to plan and manage the sustainable growth of cities. Meggers analyzed the loss of efficiency of AC systems, and the corresponding impact on the coefficient of performance (COP), as a consequence of the increase in temperature in the local microclimate due to the increase in heat emission from the same systems. Their COP values indicate an increase in energy consumption in a range of 7–47% [25].
It is noteworthy that in Mexico it is estimated that CO2 emissions by fuel/electricity related to domestic AC or cooling energy consumption was 5.5 Tg CO2 [26]. Some data indicate that, globally, the associated CO2 emissions for both heating and cooling will increase to 2.2 Gt C in 2100, i.e., about 12% of the total CO2 emissions from energy use, with the biggest contributors being China and the U.S.A. and, particularly as a result of climate change, air-conditioning energy demand will increase by 72% for the same year [7].
Considering the energy consumption due to urbanization, its inherent thermal impact, and potential environmental effects mentioned above, a comparative approach was taken to study the effects of AC in two residential areas in the city of Mexicali, Mexico. Each zone is different in its urban setting, consequently creating different microclimates where a hypothetical 5 ton AC unit is located in each house. Therefore, the research question is established as follows: How much is the extra electrical energy consumption by an AC due to different urban microclimates within an extreme climate city? To answer this question, this research was carried out in terms of energy consumption, costs and environmental effects.

2. Materials and Methods
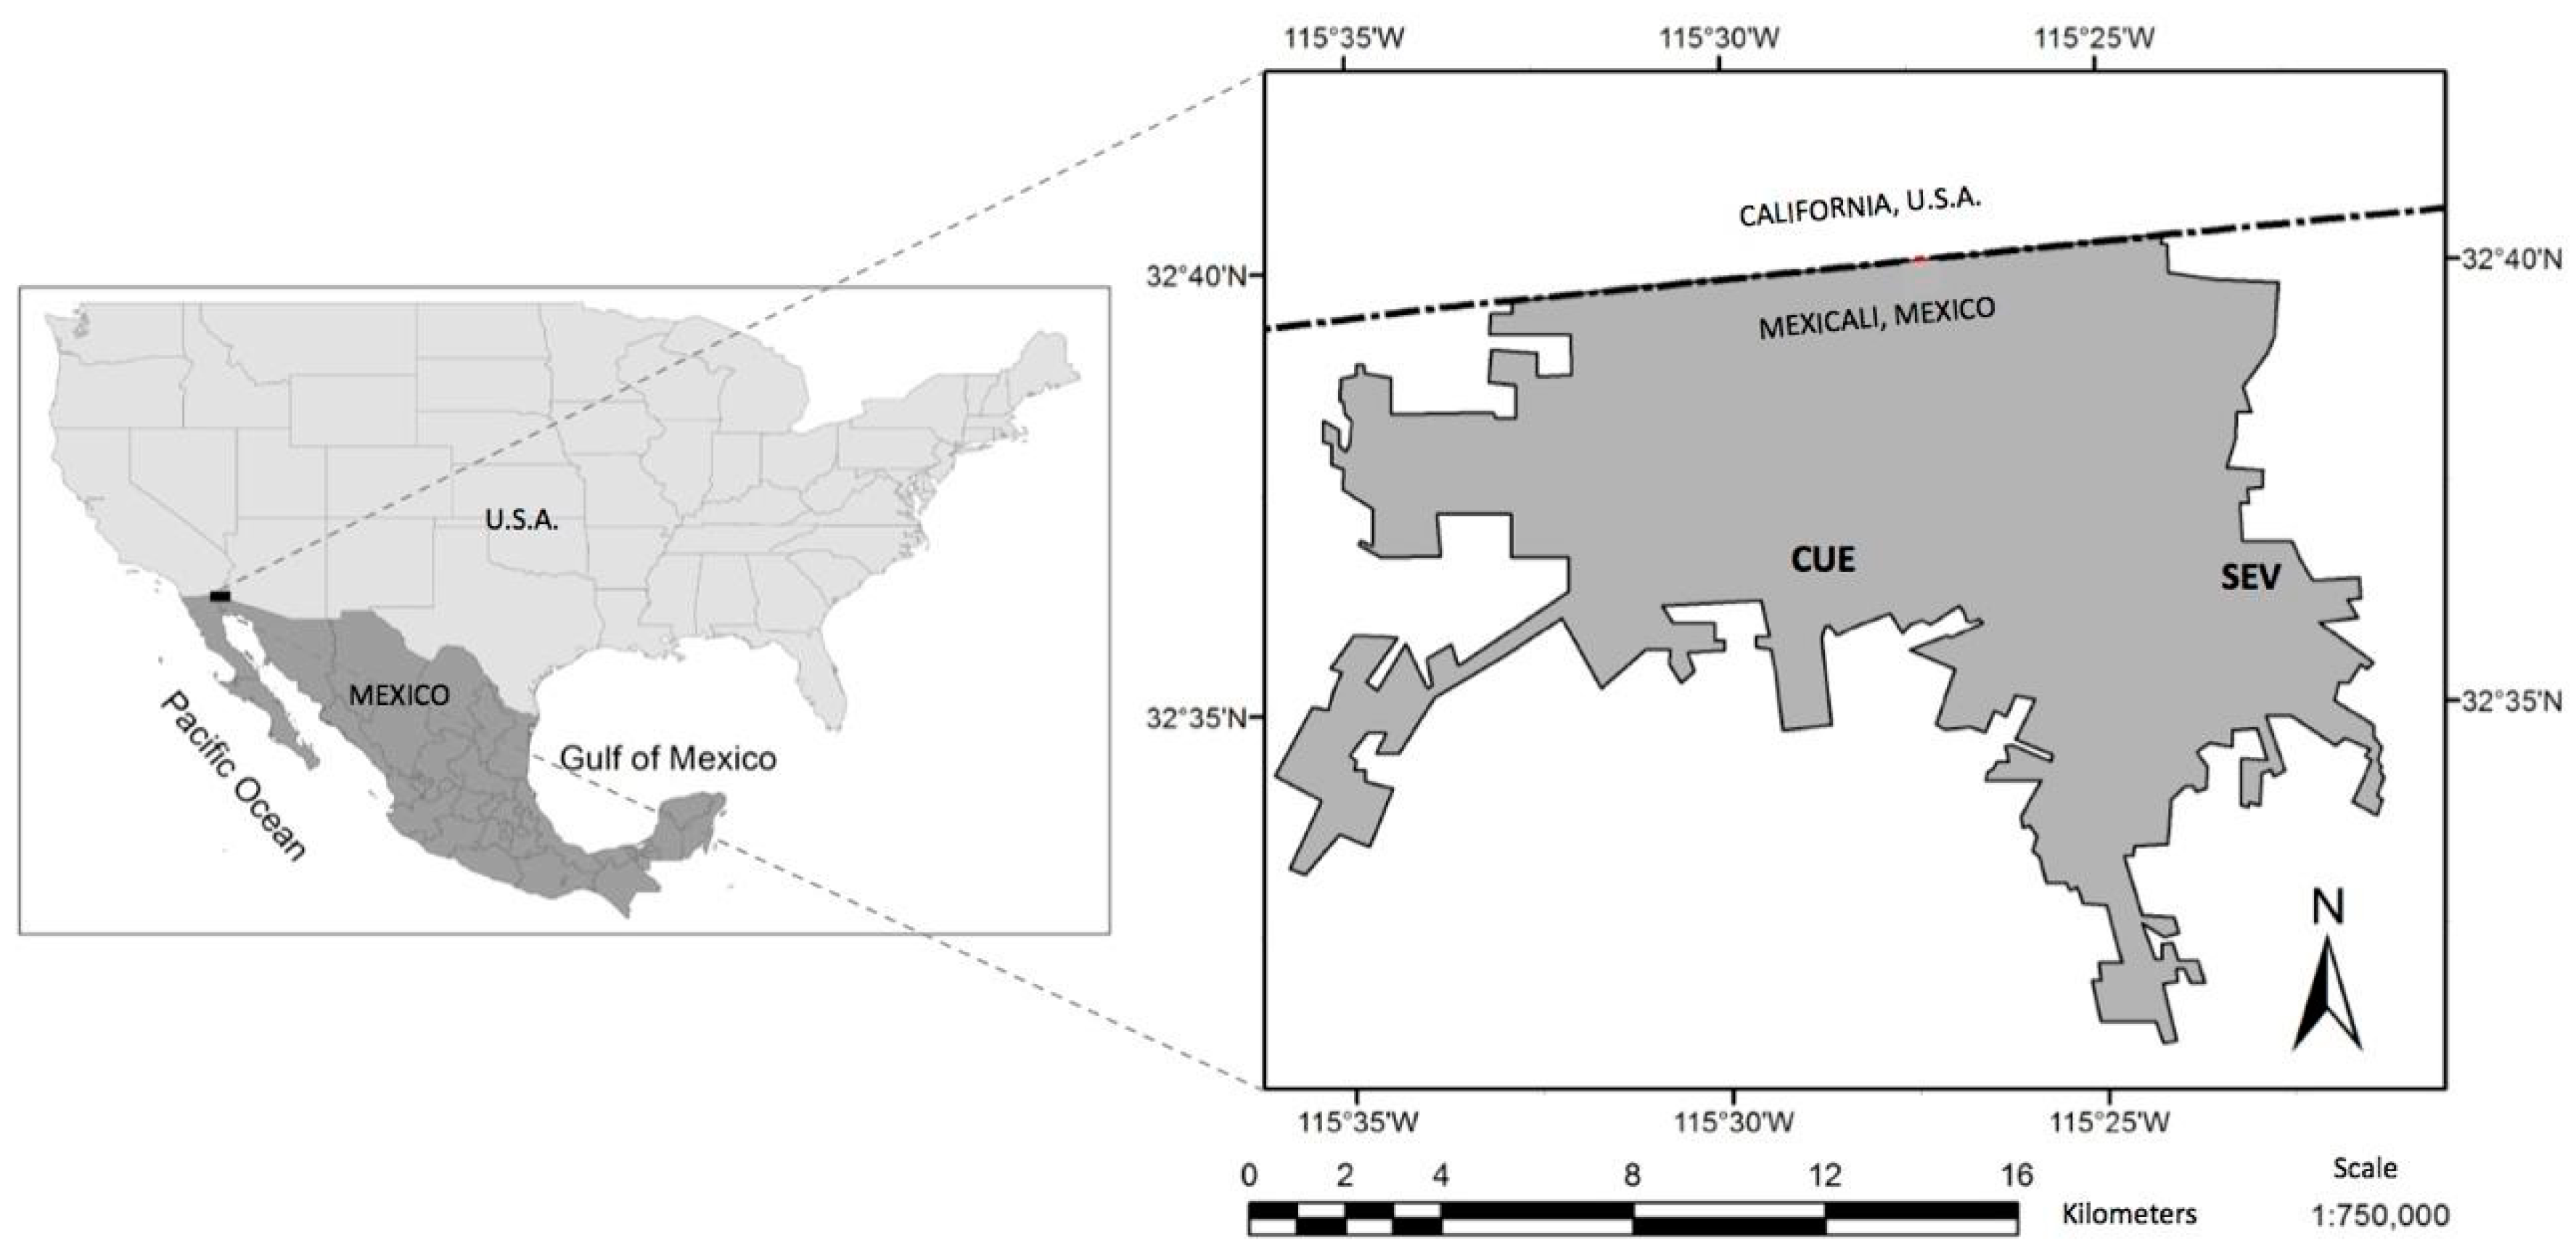
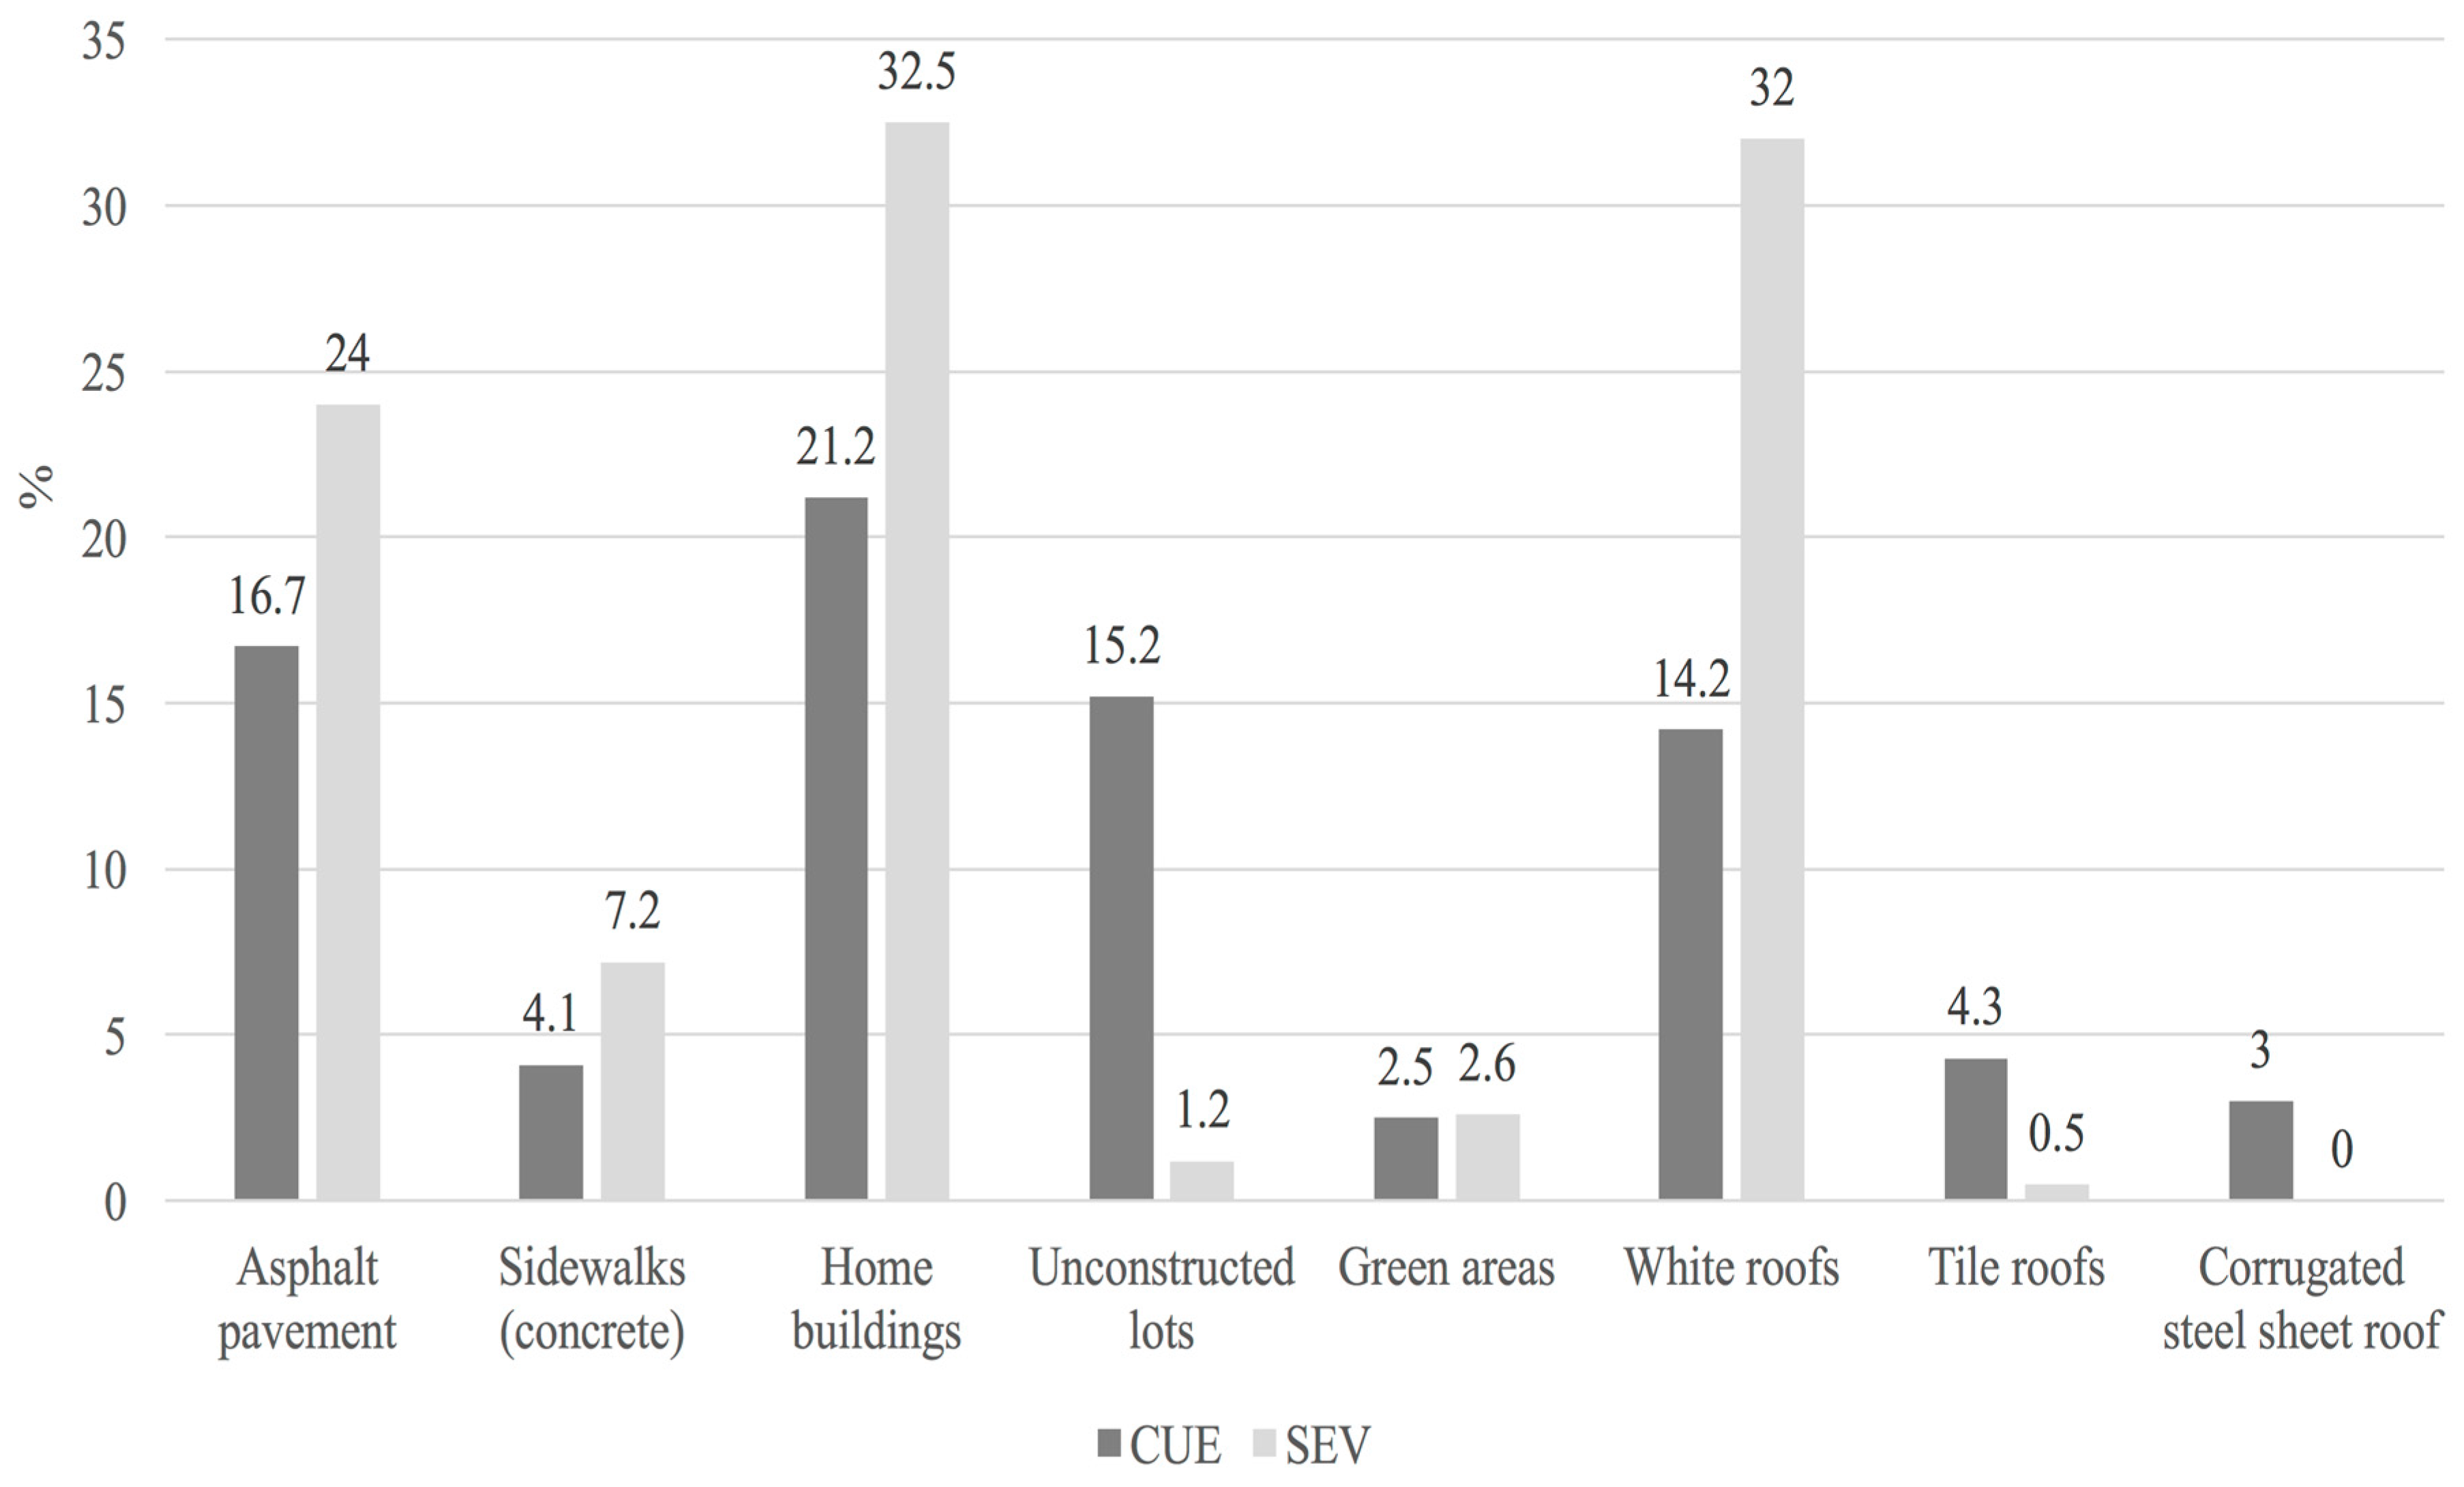
2.1. Sites and Data

Mexicali is a city located in the northwest of Mexico, coordinates 32°39′48” N, 115°28′4” W (Figure 1). Its climate is one of the driest and warmest, and it has a long period of high temperatures that extends from late spring to mid-autumn; the maximum daily temperatures in that period exceed 38 °C, averaging in July a high of 42.2 °C, and an average January high of 21 °C, and there is a historical maximum of 52 °C. Its activities are mainly manufacturing and commerce. Its location as a border city with the United States has always been a pole of attraction for immigrants from all over Mexico, so there is a high rate of population growth, and consequently urbanization. This rapid urbanization has generated problems of air pollution, coupled with those caused by the presence of the urban heat island, such as the elevation in temperature, high energy consumption, and amplification of deaths by warm waves. In 1999, the maximum temperature difference between the urban area of Mexicali and its rural area was 11 °C, which speaks of the importance of urban warming [27,28].
García-Cueto showed the presence of the heat island in Mexicali and its relationship with the coverage and land use. It was found that the highest temperatures correspond to the built areas, and in particular, to residential and commercial uses, while the lower temperatures correspond to the green areas [29]. In another study, he showed that the intensity of the urban heat island between the urban area of Mexicali and the rural area has the highest average value during the winter with a value of 5.7 °C in the hours close to dawn, while in the fall it had the lowest average value, of 5 °C [30].
The above acquires relevance in a city like Mexicali, where high temperatures make it necessary to use air conditioning to have thermal comfort, and the corresponding extra energy consumption representing more than 60% is accrued to this cause. Therefore, it is important to evaluate the impact of urban settlements and their effects on residential energy consumption from a microclimatic perspective.
Regarding the area for the experiment, two separate housing complexes 9 km apart were chosen as the testing sites (Figure 1). These two zones are Sevilla (SEV, a planned and homogenous urbanization) and Conjunto Urbano Esperanza (CUE, a traditional heterogeneous urbanization). An outstanding characteristic of the planned area is that the roofs of the houses are painted white and the construction materials are the same for all the houses. Contrastingly, in the unplanned area, the materials of the houses and roofs are of different types and colors, and there are some unconstructed lots. Both complexes have a low percentage of green areas, as could be observed in Figure 2, related to the percentage and types of land surfaces in each area. Temperature measurements were made using a sonic anemometer (CSAT3) sensor located 20 m high. The sensor was placed at this height to get a more representative and stable reading of the area, with less turbulence from the surface and from the ACs installed on nearby roofs, as buildings in the areas have a maximum height of 7 m. Data loggers (CR3000) recorded temperatures every 30 min and averaged them each hour for a 25 day period. The measurement campaign was conducted from 20 March to 14 April, 2015. In order to know if there is a statistical difference between the average temperatures of the two sites, a comparative statistical test of means was used with a level of significance of α = 0.05.

2.2. Air Conditioner

A hypothetical 5 ton AC unit was considered for each house of the housing complexes. Its consumption performance under outdoor temperature test conditions is listed in the manufacturer’s product specifications [31]. The regression model, in terms of the outdoor temperature versus the energy consumed to obtain a 23.8 °C (75 °F) indoor temperature, is presented in Equation (1). In the linear regression model, the independent variable x is the outside temperature at which the proposed AC was tested by the manufacturer. Subsequently, this data was substituted in the regression model by onsite temperature, in order to obtain the electrical consumption per hour (kWh), and then all these results were added to obtain a daily sum for each of the 25 days of the measurement campaign.
y = 0.0446x + 3.182.
It is important to mention that this linear regression model is the one that best fits with this study, since the dependent and independent variables have a very high correlation, which means that temperature is the most important climatic variable to determine electricity consumption [32,33]. On the other hand, in the review by Santamouris et al. [21], 26 studies related to the electrical consumption of several cities in different latitudes were analyzed. In these, aspects related to climate, urban configuration, and the influence of anthropogenic activities were considered, which, together or individually, modify the energy demand. In some studies, multiple independent variables were considered to estimate the electricity consumption, because the particular conditions of the studies required it. For example, the variables of relative humidity, amount of rain, cooling degree-days, and winds were included, since the spatial and temporal scale of some studies were very extensive. Consequently, their magnitudes showed a very wide variation, which in some cases generated a behavior that could only be described by non-linear models, but without distinguishing the type of consumption (residential, commercial, industrial) and the source of energy. Similarly, when the spatial and temporal scale was very large, the seasonality of economic, social, and demographic behavior was significantly influential in electricity consumption, even in the same way as the variation in urban temperatures, since the dynamics of the population exerted a strong pressure on the electricity demand. This was not the case in our study, where the spatial and temporal scale allowed us to delimit the experimentation in similar conditions of solar radiation, relative humidity, and winds. The aspects related to human behavior were not part of the scope of the project, only climatic and thermodynamic variables. However, to not overlook these important aspects, and to be able to make the comparison of the electric consumption between the two residential areas, the standard conditions of the human consumption profile for each site were established—500 houses with the same equipment of 5 tons working at a use factor of 0.5.

3. Results and Discussion

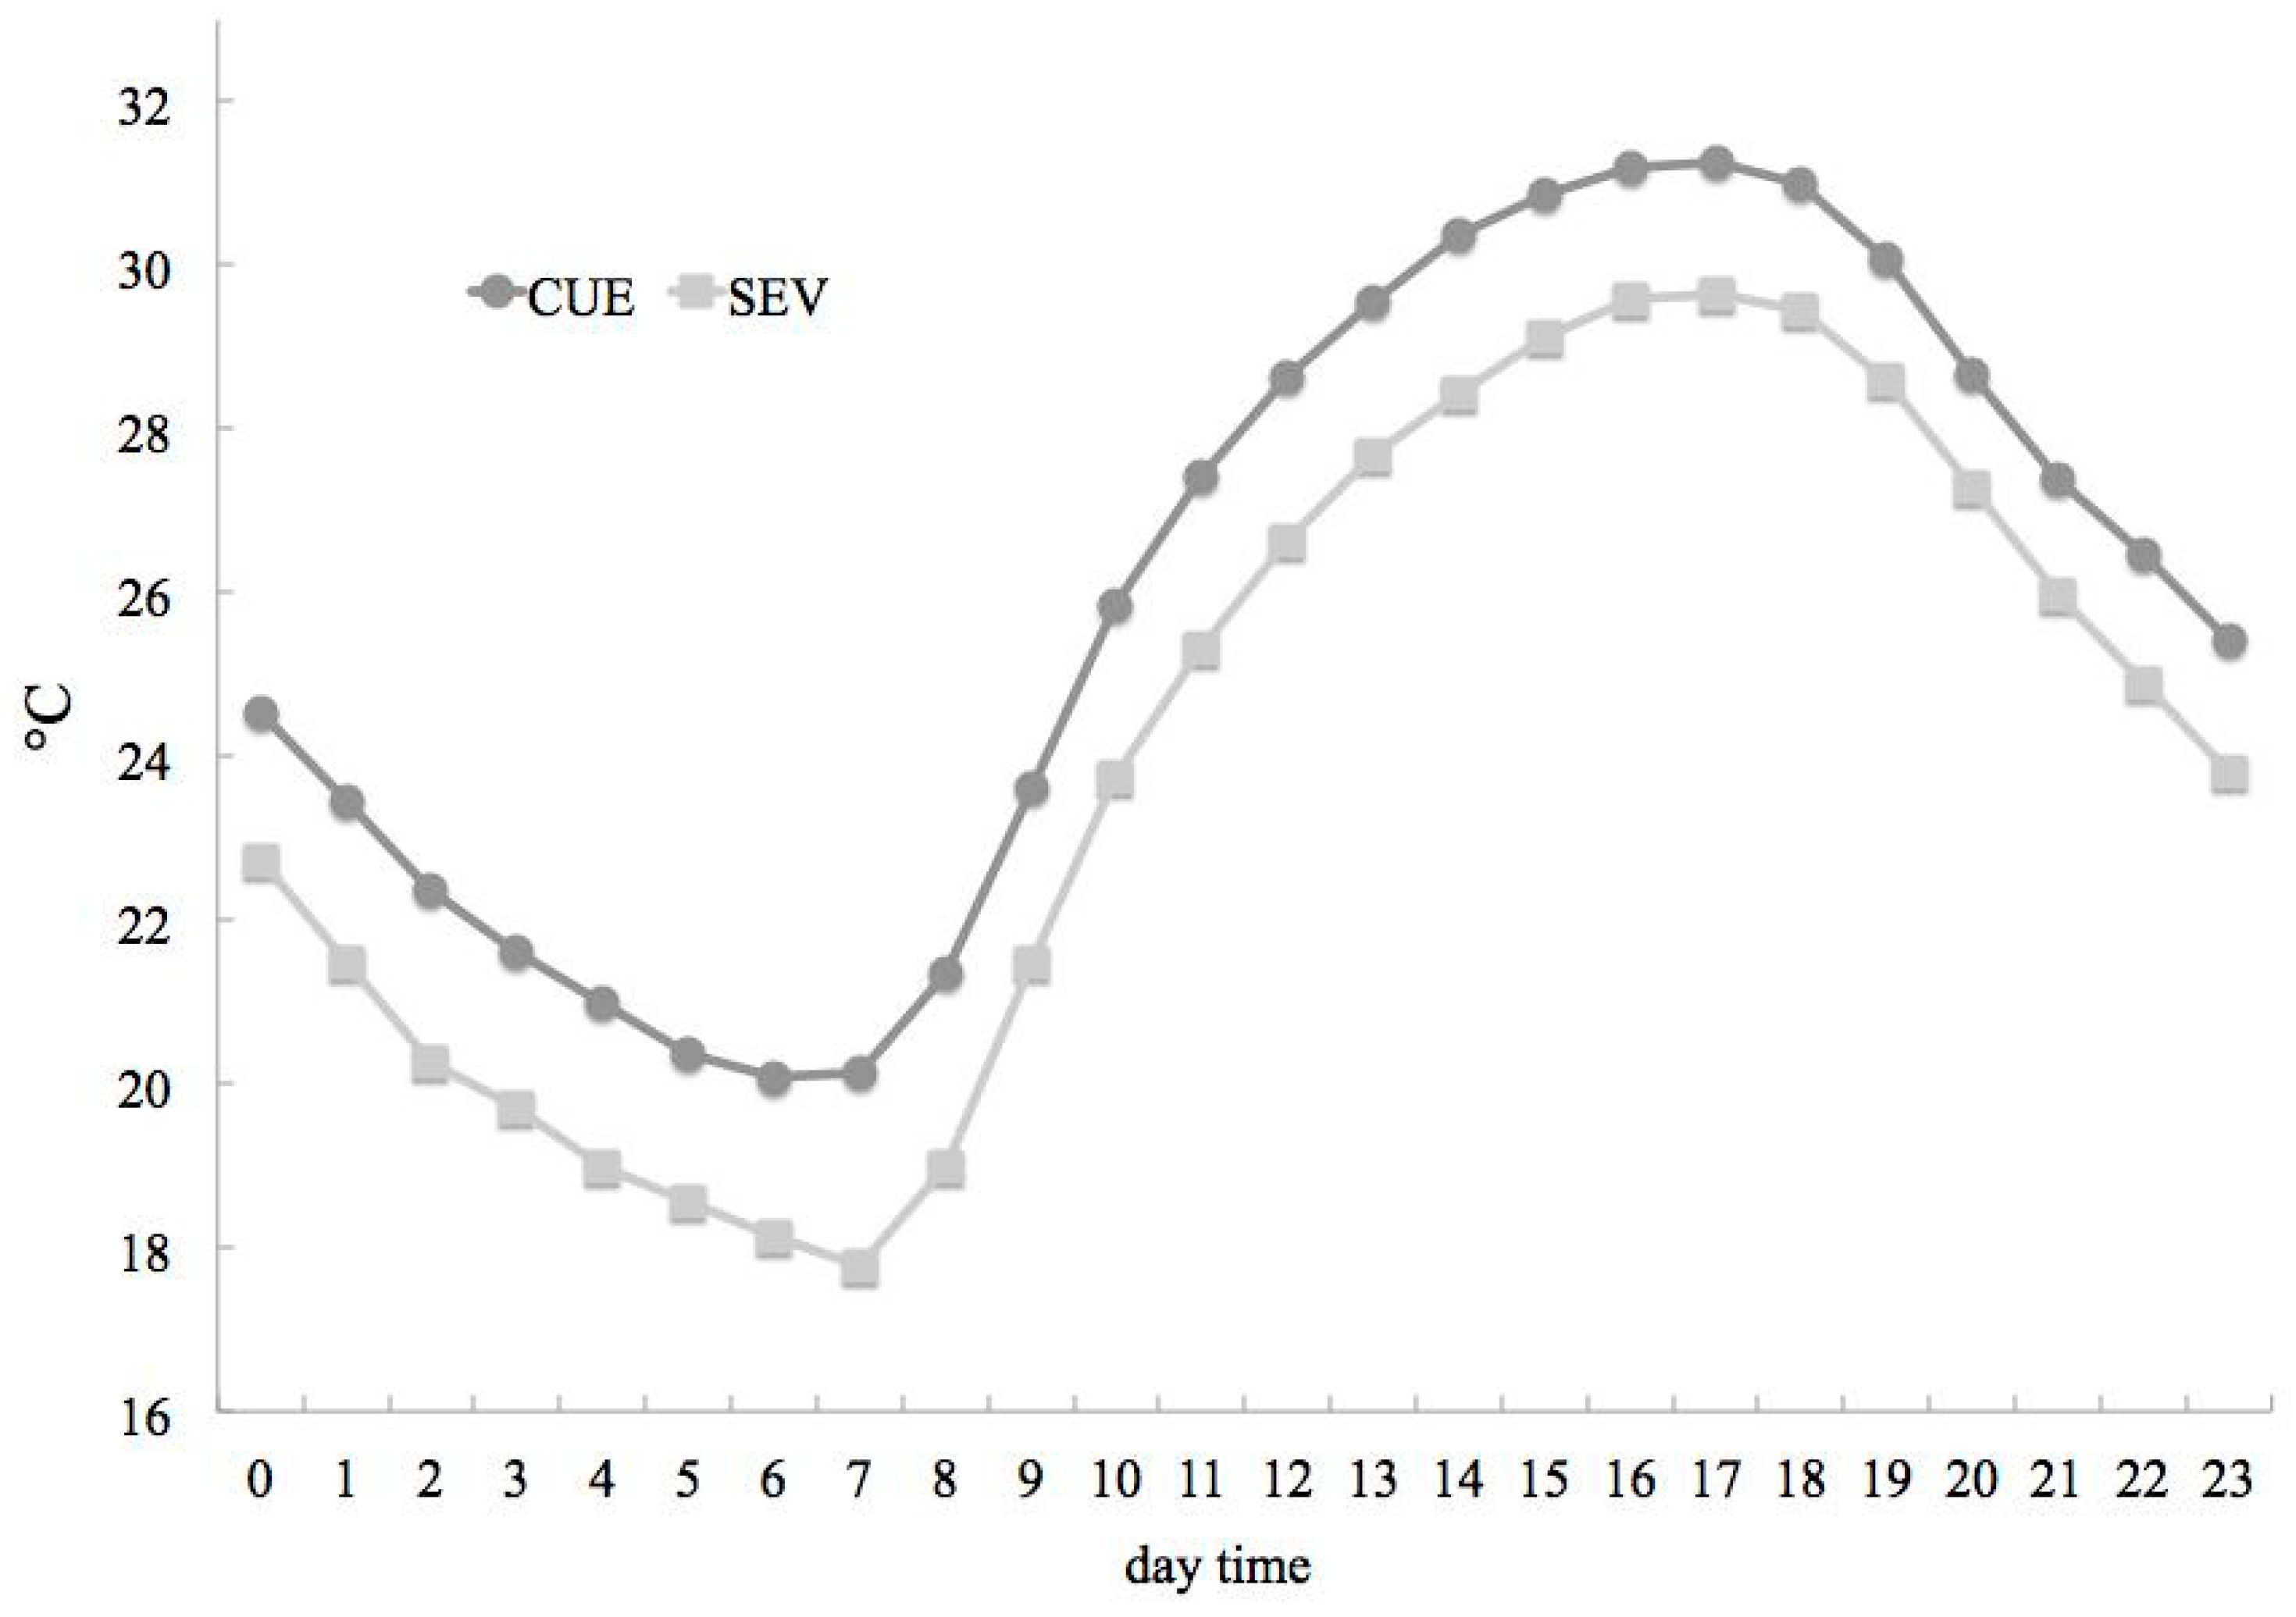
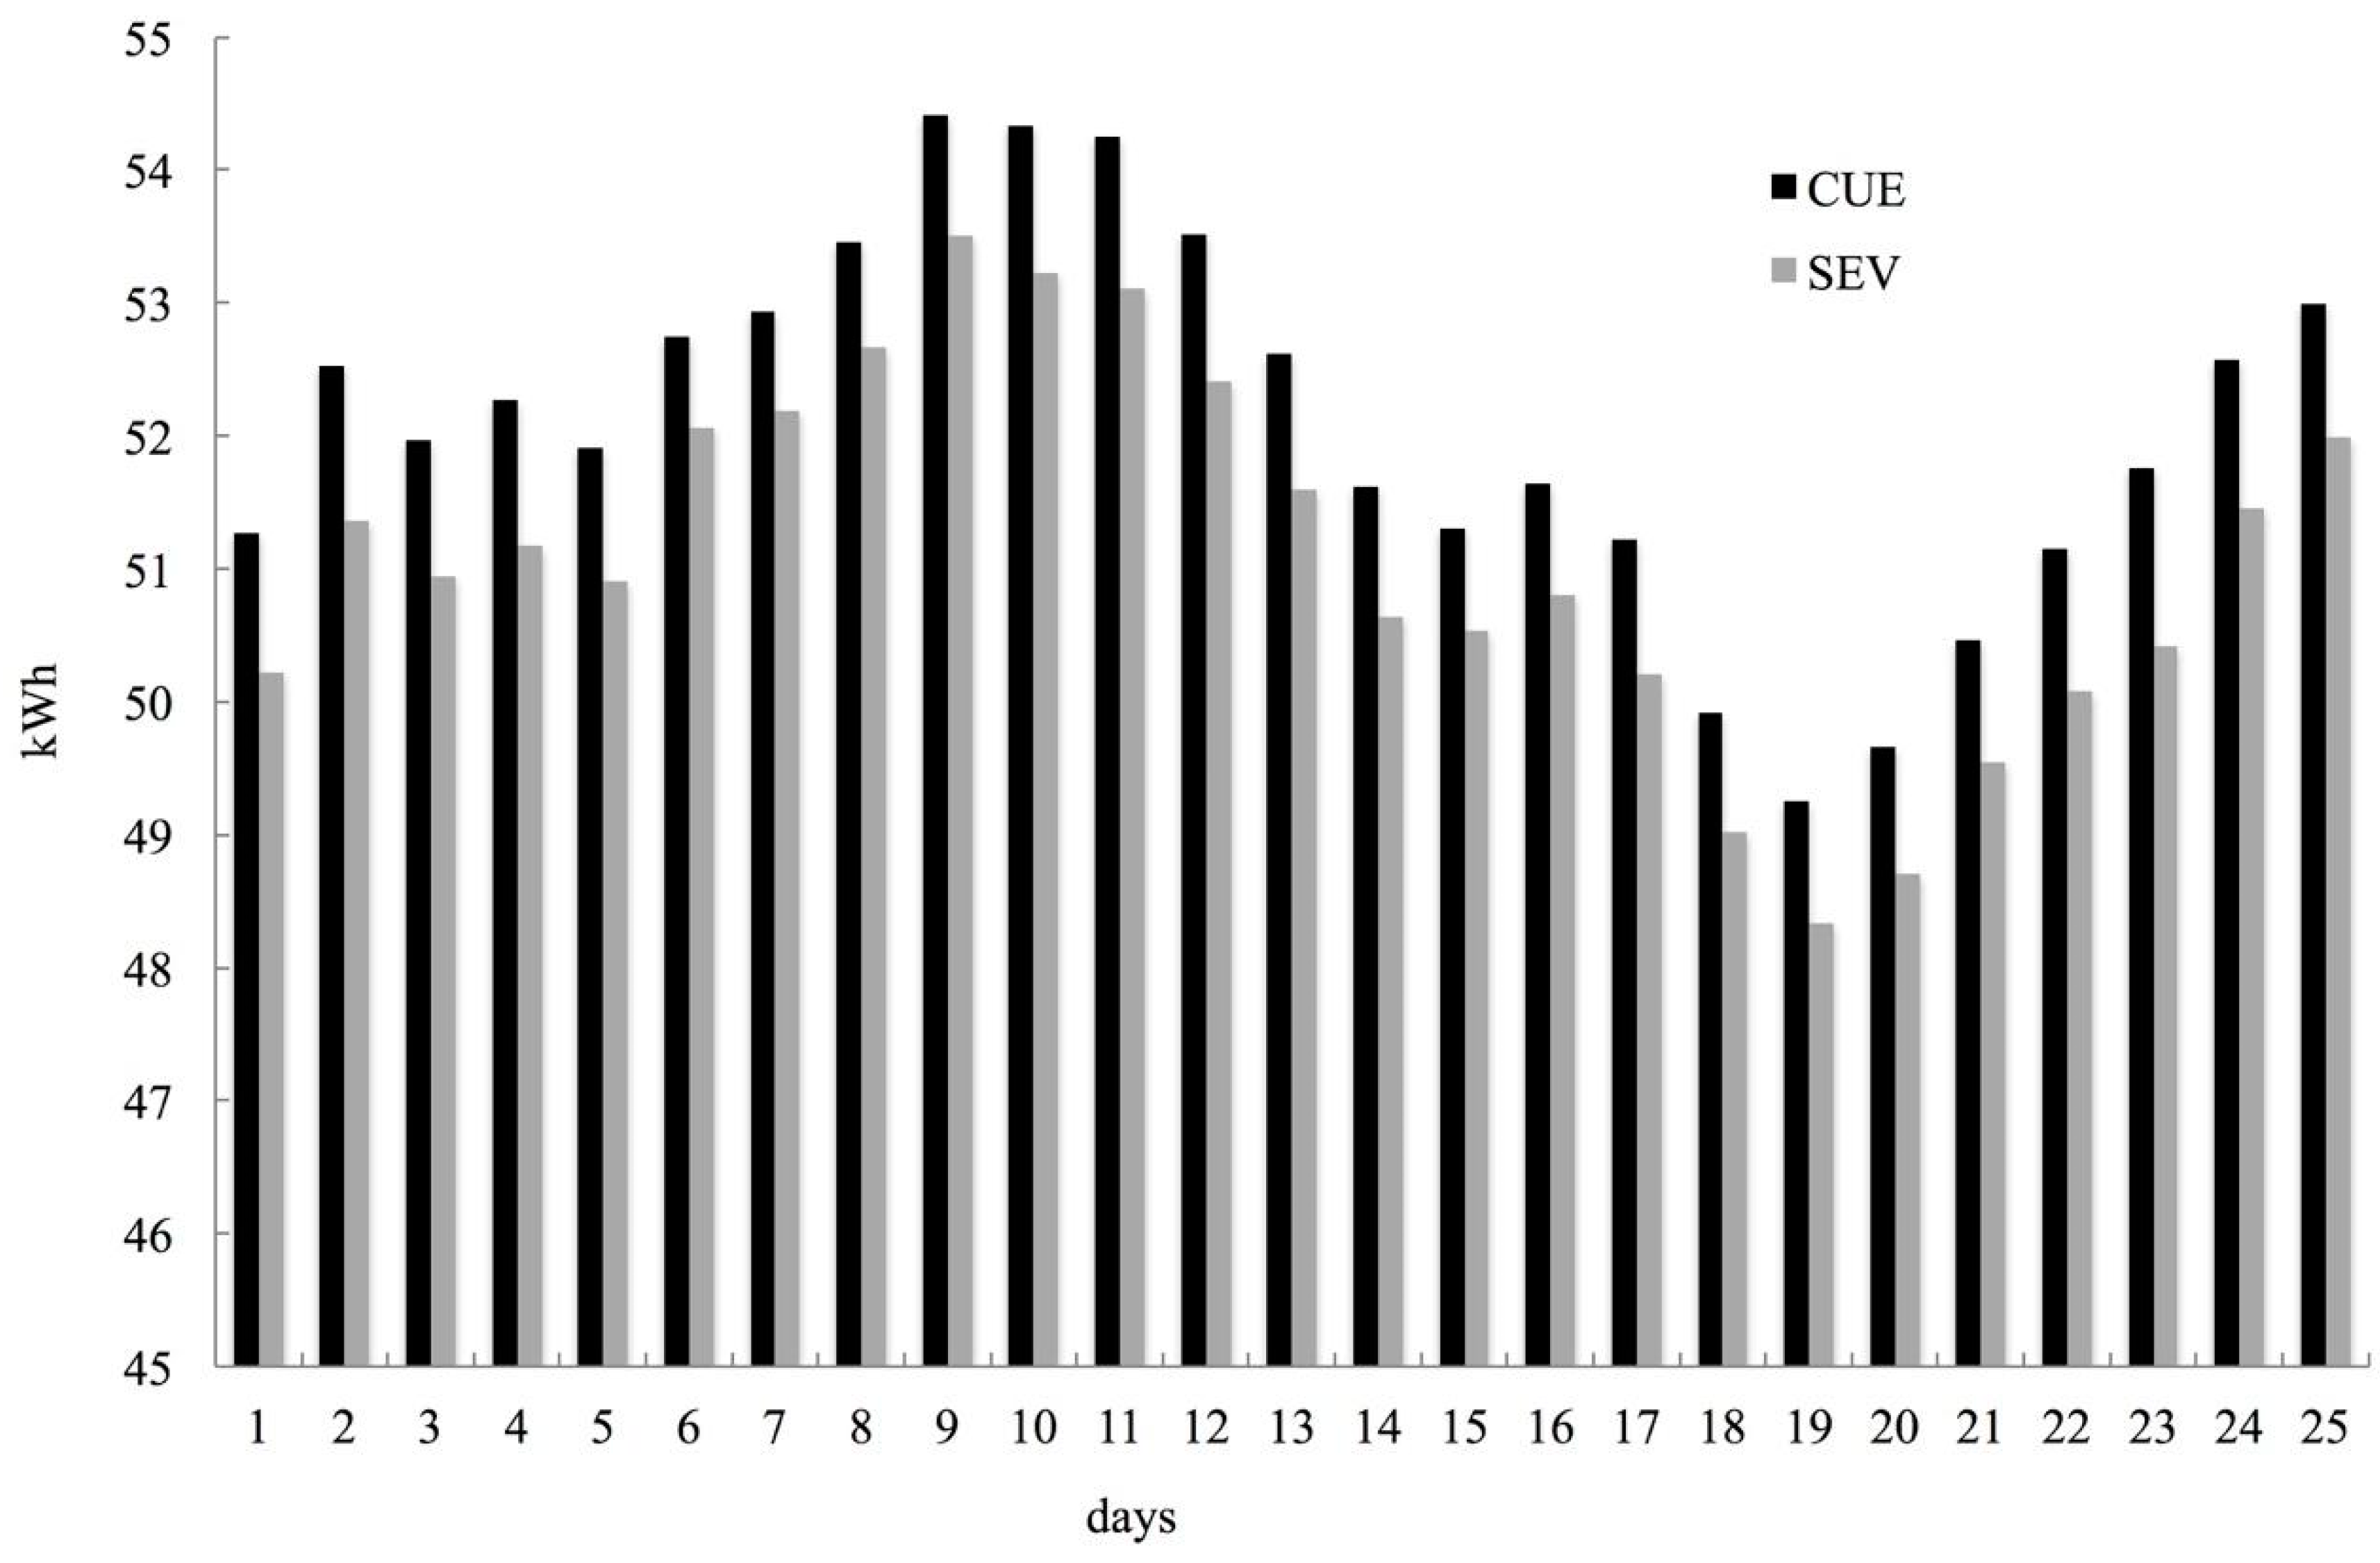
3.1. Temperatures and Consumption

Hourly temperature averages for the 25 days are presented in graphical form in Figure 3, showing that the CUE zone has higher temperature values than the SEV zone. These temperatures were used as input data for the regression model to calculate daily energy consumption. This graph represents the average behavior of a cycle of 24 h during the 25 days of experimentation. According to the means test, a statistically significant difference was verified at the previously chosen level (0.05). All the hourly data of electric consumption was added to obtain the daily consumption, which is shown in the Figure 4. For this study, we do not consider addressing the design and construction materials of homes, so we assume a work factor of 0.5, which is possible as long as the equipment works optimally.
As can be expected, energy consumption in the CUE zone is greater than the SEV zone, as a result of higher temperatures in CUE (Figure 4). This means that the microclimate surrounding CUE presents thermal influences that raise the temperature of the area and increase the energy consumption. The differences between each zone can also be corroborated because the average temperature differential is 1.8 °C, with CUE being higher. For the above mentioned and considering the percentages of Figure 2, the reflective white surfaces in the SEV zone stand out, which leads to an increase in the albedo and, consequently, less energy gain due to the fact that more solar radiation is reflected [34,35]. This contributes to lower temperatures in this area compared to CUE, because of the dark coloration of the buildings in the latter location, and surfaces partially covered with metal that contribute to increased temperatures in the area [15].
It is important to mention that the electricity consumption used to cool homes in Mexicali with an extreme warm climate has a very close correspondence with the outside temperature [36], for this reason, this comparative study was carried out using a linear regression model based on two reasons. First, the outside temperature is the variable that most impacts electricity consumption, especially in arid zones, either in simulations or real measurements. Second, in both cases, high correlations between temperature and electrical consumption are obtained [37,38]. These authors also mention that the differences in electricity consumption are associated with land uses and the urban surfaces characteristics, and highlight the high correspondence between urban temperatures and electricity consumption.
Regarding other topographic and meteorological variables, that could be related to electricity consumption, we can mention that Mexicali is a city with a flat orography, where the experimental sites are between 3 to 6 m above sea level and buildings of one and two levels prevail by the highly seismic zone. During the measurement time, the wind speed averages (m/s) were 2.7 for SEV and 2.4 for CUE. Relative humidity (% RH) was 27.9 and 26.2, respectively. Given that these variables were very similar between both sites, it was assumed that the thermal conditions were associated only with the horizontal surfaces in each site, and therefore, the measured temperature was the result of convective transport.
When looking at the 25 day period, the additional electricity accumulated for the CUE zone averaged 24.7 kWh per house, equivalent to 5.8 h of energy consumption for the SEV zone (Table 1). This means that 500 houses located in the SEV zone could be cooled for approximately 5.8 extra hours in 25 days, so the residual energy of 500 homes located in CUE can supply power to maintain a house in SEV for a period of 9 months. These amounts could be increased if we consider an entire summer, and gives us an idea of the wasted energy due to high temperatures inside the same city.

3.2. Costs and CO2 Emissions

This disparity causes a significant economic impact per household. Although the cost difference is only 4.33%, this increase in cost per house is $2.36 (USD), which represents 49.47%, of the minimum worker’s daily wages in Mexico (salary during the experimentation time). For 500 homes located in the CUE zone, this is an equivalent cost of 247 workers earning the minimum daily wage. Previous data was obtained from Table 1, and some CO2 emissions resulting from the additional kWh required for CUE are shown. According to the greenhouse gas equivalencies calculator, the GGE estimations were documented from their environmental web [39] and are presented in Table 2. This table shows that the additional energy required for those living in the CUE zone imposes extra burdens on the environment. 12,350 kWh is the equivalent of generating 9191 kg of CO2 (left column). The right column shows other equivalent quantities in terms of other forms of energy, that can be calculated in the website mentioned above by entering the additional kWh. From this table, there are two issues related to energy consumption in homes: 0.992 homes energy use for one year and 1.4 homes electricity use for one year. These results give us an idea of the environmental impact that 500 ACs have on the city when exposed to high temperatures, compared with another 500 running at 1.8 °C less than average. As stated previously, and in agreement with Mahlia et al. [40], the results validate the claim that the economic and environmental impacts are a function of the use and energy demands, which are the primary dominant factors that determine energy consumption and emissions of greenhouse gases. That energy demand is closely linked to the microclimates, which normally cause thermal differences as a result of the location and urban typology of the housing complexes, density, and other design factors such as size, geometry, and materials [41,42], and which can generate a spatial variability of ambient temperatures between 3.2 to 6.5 °C. [43]. These microclimatic differences lead to negative environmental effects, which consequently increase the demand for electrical energy to cool interior spaces. This negative impact generates waste heat and also causes an increase in the consumption of fossil fuels. Therefore, if this phenomenon continues, a high risk arises, because UHI increases uncontrollably the consumption of electricity and, consequently, the anthropogenic greenhouse gases such as CO2, which is the main cause of global climate change [44].

4. Final Comments and Conclusions

All aspects related to the development of cities will certainly affect, among other things, energy supply, cost of services, and the environment. The analysis of these aspects could be tools that enable urban planners to propose urbanization that minimizes thermal differences within the city, and hence, to minimize the formation of undesirable microclimates, because this problem could be exacerbated by the increase in population. For these reasons, we can avoid some negative impacts through mitigation strategies, such as the improvement of the urbanization schemes of cities. It is important then to manage urban growth, changes in land use, and energy demands, because they have economic and environmental implications. As was mentioned earlier, urbanization schemes should aim towards smart homogeneity, because cities are the promoters of their own harmful urban environment. Within cities, energy demands are generated, and these demands are sometimes disorganized, unplanned, and therefore less sustainable. It is possible that the differences found in this study are imperceptible, but if we consider the surplus energy of all heterogeneous zones, then the convenience of urbanizing the cities with a homogeneous and planned scheme makes sense. It is possible that the differences found in this study are imperceptible in the context of a thought-out city, but if we add the surplus energy magnitudes, it is then that the convenience of urbanizing the cities with a homogeneous and planned scheme makes sense.
With the model proposed in Equation (1), it was possible to estimate and compare the electrical consumption of two housing sites within the same city but with different urban configurations. This methodology can be used if the spatial and temporal scale of the case studies are short, that is, no seasonal change and the climatic conditions are similar. Additionally, if the variables related to the electricity demand profile are considered constants. Under the aforementioned conditions, the model will estimate the consumptions attributed to the thermal impact generated by the different urban surfaces.
Briefly, as was demonstrated in this study for Mexicali city, power consumption, costs and pollutant emissions increase when an AC is used in an area with higher temperatures, compared to another area with lower temperatures within the same city. We found that, even with a small (but statistically significant) average thermal difference between the two urban complexes, built differently and with different percentages of land surfaces, these increases or surpluses are 12,350 kWh, $1180, and 9191 kg of CO2, electric consumption, costs, and pollutant emissions, respectively. The aforementioned differentials correspond to disorganized urban planning, such as in CUE, so building with a planned scheme (SEV) is the model that is most associated with sustainability, and therefore the one towards which we should move in the near future. It is obvious that this is a task in which government and society must go hand in hand. Although this study is very simple because of the linear model used, it has allowed us to highlight the problem that many cities in Mexico and the developing world are probably facing, in which climate is an important factor for economic development, but there is also an awareness of the thermal comfort and environmental health that the urban citizen should enjoy. At present, at the local level, the use of surface covers that reduce the cumulative effect of heat and, therefore, reduce the increase in temperature that characterize urban heat islands is not regulated. Our results represent scientific evidence that can be used as a reference to establish public policies that could be incorporated into local construction regulations, oriented to reduce the energy consumption associated with the use of air conditioning equipment.

Author Contributions

N.S.-S., O.R.G.-C., A.A.L.-A. wrote the paper towards the energy, economic and environmental approach. S.O.-B. and S.E.C.-S. contributed to in the emissions focus.

Funding

We thank the National Council of Science and Technology (CONACYT), for the financing of this project through the resource of Basic Science CB 2011-167595.

Acknowledgments

The authors are grateful to the National Council for Science and Technology (CONACYT) and the Universidad Autónoma de Baja California for the support given to conduct this project.

Conflicts of Interest

The authors declare no conflict of interest.

References

  1. Pérez-Lombard, L.; Ortiz, J.; Coronel, J.F.; Maestre, I.R. A review of HVAC systems requirements in building energy regulations. Energy Build. 2011, 43, 255–268. [Google Scholar] [CrossRef]
  2. Yik, F.W.H.; Burnett, J.; Prescott, I. Predicting air-conditioning energy consumption of a group of buildings using different heat rejection methods. Energy Build. 2001, 33, 151–166. [Google Scholar] [CrossRef]
  3. Matar, W. Beyond the end-consumer: How would improvements in residential energy efficiency affect the power sector in Saudi Arabia? Energy Effic. 2016, 9, 771–790. [Google Scholar] [CrossRef]
  4. Pérez-Lombard, L.; Ortiz, J.; Pout, C. A review on buildings energy consumption information. Energy Build. 2008, 40, 394–398. [Google Scholar] [CrossRef]
  5. Al-Rabghi, O.M.; Akyurt, M.M. A survey of energy efficient strategies for effective air conditioning. Energy Convers. Manag. 2004, 45, 1643–1654. [Google Scholar] [CrossRef]
  6. Saidur, R. Energy consumption, energy savings, and emission analysis in Malaysian office buildings. Energy Policy 2009, 37, 4104–4113. [Google Scholar] [CrossRef]
  7. Isaac, M.; Van Vuuren, D. Modeling global residential sector energy demand for heating and air conditioning in the context of climate change. Energy Policy 2009, 37, 507–521. [Google Scholar] [CrossRef]
  8. Scott, M.J.; Wrench, L.E.; Hadley, D.L. Effects of climate change on commercial building energy demand. Energy Sources 1994, 16, 317–332. [Google Scholar] [CrossRef]
  9. Huang, Y.J.; Ritschard, R.; Bull, J.; Chang, L. Climatic Indicators for Estimating Residential Heating and Cooling Loads; Lawrence Berkeley Laboratory Report LBL-21101; Lawrence Berkeley Laboratory: Berkeley, CA, USA, 1986. [Google Scholar]
  10. Sailor, D.J. Relating residential and commercial sector electricity loads to climate evaluating state level sensitivities and vulnerabilities. Energy 2001, 26, 645–657. [Google Scholar] [CrossRef]
  11. Baker, L.A.; Brazel, A.J.; Selover, N.; Martin, C.; McIntyre, N.; Steiner, F.R.; Nelson, A.; Musacchio, L. Urbanization and warming of Phoenix (Arizona, USA): Impacts, feedbacks and mitigation. Urban Ecosyst. 2002, 6, 183–203. [Google Scholar] [CrossRef]
  12. Ihara, T.; Kikegawa, Y.; Asahi, K.; Genchi, Y.; Kondo, H. Changes in year-round air temperature and annual energy consumption in office building areas by urban heat-island countermeasures and energy-saving measures. Appl. Energy 2008, 85, 12–25. [Google Scholar] [CrossRef]
  13. Sailor, D.J.; Pavlova, A.A. Air conditioning market saturation and long-term response of residential cooling energy demand to climate change. Energy 2003, 28, 941–951. [Google Scholar] [CrossRef]
  14. Stewart, I.D.; Oke, T.R. Local climate zones for urban temperature studies. Am. Meteorol. Soc. 2012, 93, 1879–1900. [Google Scholar] [CrossRef]
  15. Lee, S.; Moon, H.; Choi, Y.; Yoon, D.K. Analyzing Thermal Characteristics of Urban Streets Using a Thermal Imaging Camera: A Case Study on Commercial Streets in Seoul, Korea. Sustainability 2018, 10, 519. [Google Scholar] [CrossRef]
  16. Parece, T.E.; Campbell, J.B. Intra-Urban Microclimate Effects on Phenology. Urban Sci. 2018, 2, 26. [Google Scholar] [CrossRef]
  17. Santamouris, M. On the energy impact of urban heat island and global warming on buildings. Energy Build. 2014, 82, 100–113. [Google Scholar] [CrossRef]
  18. Arifwidodo, S.; Chandrasirib, O. Urban Heat Island and Household Energy Consumption in Bangkok, Thailand. Energy Procedia 2015, 79, 189–194. [Google Scholar] [CrossRef] [Green Version]
  19. Kolokotroni, M.; Rena, X.; Daviesb, M.; Mavrogiannib, A. London’s urban heat island: Impact on current and future energy consumption in office buildings. Energy Build. 2012, 47, 302–311. [Google Scholar] [CrossRef]
  20. Papanastasiou, D.K.; Fidaros, D.; Bartzanas, B.; Kittas, C. Impact of urban heat island development on buildings energy consumption. Fresen. Environ. Bull. 2013, 22, 2087–2092. [Google Scholar]
  21. Santamouris, M.; Cartalisb, C.; Synnefab, A.; Kolokotsac, D. On the impact of urban heat island and global warming on the power demand and electricity consumption of buildings—A review. Energy Build. 2015, 98, 119–124. [Google Scholar] [CrossRef]
  22. Santamouris, M.; Papanikolaou, N.; Livana, I.; Koronakis Georgakis, C.; Argiriou, A.; Assimakopuolus, N. On the impact of urban climate on the energy consumption of buildings. Sol. Energy 2001, 70, 201–216. [Google Scholar] [CrossRef]
  23. Salvatia, A.; Coch Rourab, H.; Cecerea, C. Assessing the urban heat island and its energy impact on residential buildings in Mediterranean climate: Barcelona case study. Energy Build. 2017, 146, 38–54. [Google Scholar] [CrossRef] [Green Version]
  24. Smith, C.; Levermore, G. Designing urban spaces and buildings to improve sustainability and quality of life in a warmer world. Energy Policy 2008, 36, 4558–4562. [Google Scholar] [CrossRef]
  25. Meggersa, F.; Aschwandenc, G.; Teitelbaumd, E.; Guoa, H.; Salazara, L.; Bruelisauere, M. Urban cooling primary energy reduction potential: System losses caused by microclimates. Sustain. Cities Soc. 2016, 27, 315–323. [Google Scholar] [CrossRef]
  26. Rosas-Flores, J.A.; Rosas-Flores, D.; Morillón-Gálvez, D. Saturation, energy consumption, CO2 emission and energy efficiency from urban and rural households appliances in Mexico. Energy Build. 2011, 43, 10–18. [Google Scholar] [CrossRef]
  27. Casillas-Higuera, A.; Garciía-Cueto, R.; Leyva-Camacho, O.; Gonzalez-Navarro, F.F. Detección de la Isla Urbana de Calor mediante Modelado Dinámico en Mexicali, B.C., México. Inf. Tecnol. 2014, 25, 139–150. [Google Scholar] [CrossRef]
  28. Santillán-Soto, N.; García-Cueto, R.; Ojeda-Benítez, S.; Velázquez-Limón, N.; Quintero-Núñez, M.; Schorr, M. Greenhouse gases mitigation against climate change: United States-Mexico border study case. Atmósfera 2013, 26, 499–507. [Google Scholar] [CrossRef] [Green Version]
  29. García-Cueto, O.R.; Járegui-Oslos, E.; Toudert, D.; Tejeda Martínez, A. Detection of the urban heat island in Mexicali, B.C., México and its relationship with land use. Atmósfera 2007, 20, 111–131. [Google Scholar]
  30. García-Cueto, O.R.; Tejeda, A.; Bojórquez, B. Urbanization effects upon the air temperature in Mexicali, B.C., Mexico. Atmósfera 2009, 22, 349–365. [Google Scholar]
  31. Goodman Air Conditioning & Heating. Available online: http://www.goodmanmfg.com/Portals/0/pdf/SS/SS-GPC14H.pdf (accessed on 31 January 2018).
  32. Yi-Ling, H.; Hai-Zhen, M.; Guang-Tao, D.; Jun, S. Influences of urban temperature on the electricity consumption of Shanghai. Adv. Clim. Chang. Res. 2014, 5, 74–80. [Google Scholar] [CrossRef]
  33. Yee, Y. Climate and residential electricity consumption in Hong Kong. Energy 1998, 23, 17–20. [Google Scholar] [CrossRef]
  34. Levinson, R.; Akbari, H. Potential benefits of cool roofs on commercial buildings: Conserving energy, saving money, and reducing emission of greenhouse gases and air pollutants. Energy Effic. 2010, 3, 53–109. [Google Scholar] [CrossRef]
  35. Jandaghian, Z.; Akbari, H. The Effect of Increasing Surface Albedo on Urban Climate and Air Quality: A Detailed Study for Sacramento, Houston, and Chicago. Climate 2018, 6, 19. [Google Scholar] [CrossRef]
  36. Pérez-Tello, C.; Magaña-Almaguer, H.D.; Suástegui-Macías, A.; Reyes-Rodríguez, C. Metodología que utiliza horas-grado para determinar comportamiento energético del sector residencial en México. Congreso Univ. 2016, 5, 122–132. [Google Scholar]
  37. Radhi, H.; Sharples, S. Quantifying the domestic electricity consumption for air-conditioning due to urban heat islands in hot arid regions. Appl. Energy 2013, 112, 371–380. [Google Scholar] [CrossRef]
  38. Hirano, Y.; Fijuta, T. Evaluation of the impact of the urban heat island on residential and commercial energy consumption in Tokyo. Energy 2012, 37, 371–383. [Google Scholar] [CrossRef]
  39. EPA. United States Environmental Protection Agency. Greenhouse Gas Equivalencies Calculator. Available online: https://www.epa.gov/energy/greenhouse-gas-equivalencies-calculator (accessed on 2 February 2018).
  40. Mahlia, T.M.I.; Masjuki, H.H.; Choudhury, I.A.; Ghazali, N.N.N. Economical and environmental impact of room air conditioners energy labels in Malaysia. Energy Convers. Manag. 2002, 43, 2509–2520. [Google Scholar] [CrossRef]
  41. Fuller, R.J.; Crawford, R.H. Impact of past and future residential housing development patterns on energy demand and related emissions. J. Hous. Built. Environ. 2011, 26, 165–183. [Google Scholar] [CrossRef]
  42. Guo, J.; Liu, H.; Jiang, Y.; He, D.; Wang, Q.; Meng, F.; He, K. Neighborhood form and CO2 emission: Evidence from 23 neighborhoods in Jinan, China. Front. Environ. Sci. Eng. 2014, 8, 79–88. [Google Scholar] [CrossRef]
  43. Jin, H.; Cui, P.; Wong, N.H.; Ignatius, M. Assessing the effects of urban morphology parameters on microclimate in Singapore to control the urban heat island effect. Sustainability 2018, 10, 206. [Google Scholar] [CrossRef]
  44. Kikegawa, Y.; Genchi, Y.; Kondo, H.; Hanaki, K. Impacts of city-block-scale countermeasures against urban heat-island phenomena upon a buildings energy-consumption for air-conditioning. Appl. Energy 2006, 83, 649–668. [Google Scholar] [CrossRef]
Figure 1. Study sites locations. The names of the housing sites are Sevilla (SEV) and Conjunto Urbano Esperanza (CUE).
Sustainability 11 02045 g001
Figure 2. Representation of the surfaces (%) on the study sites. Note: Due to the heterogeneity of the CUE site, only 81.2% of the surfaces are described.
Sustainability 11 02045 g002
Figure 3. Hourly temperatures average in the two study zones.
Sustainability 11 02045 g003
Figure 4. Daily electrical consumption calculated using the regression model.
Sustainability 11 02045 g004
Table 1. Variables of analysis for the study sites.
Concept/VariableCUESEV
Average Temperature (°C)25.924.1
kWh accumulated per house1301.71277
kWh daily average per house4.334.25
kWh Total (500 houses) 1650,850638,500
Cost per house U.S. dollar 2,454.4952.13
Total cost U.S. dollars (500 houses) 1,2,427,24526,065
Total Emissions kg. CO2 Equiv.484,374475,183
Δ kWh (Additional) 312,350
Δ$ (Additional) 3,41180
Δ Emissions (Additional) 39191
1 Homes considered in each site are 500 with 5 ton air conditioner. 2 The cost of the first 300 kWh is 0.583 Mexican pesos M.P. (0.031 U.S. dollar). For next 900 kWh the rate is 0.726 M.P. (0.039 U.S. dollar) and the remainder 1.768 M.P. (0.095 U.S. dollar). 3 The differences between CUE and SEV are labeled as “Additional”. 4 Fee cost during the experimentation time.
Table 2. Surplus consumption in kWh, CO2, and equivalences.
Δ Kilowatt-Hour = Δ EmissionsGreenhouse Gas Emissions Equivalent to
12350 kWh = 9191 kg CO21034 gallons of gasoline consumed
22527 miles driven by an average passenger vehicle
0.992 homes’ energy use for one year
1.4 homes’ electricity use for one year
3.2 Tons of waste recycled instead of landfilled
308 Incandescent lamps switched to LEDs
21.3 barrels of oil consumed
376 propane cylinders used for home barbeques

