Article

Coupling Research on Land Use and Travel Behaviors Along the Tram Based on Accessibility Measurement—Taking Nanjing Chilin Tram Line 1 as an Example

School of Architecture, Nanjing Tech University, Nanjing 211800, China
*
Author to whom correspondence should be addressed.
Sustainability 2019, 11(7), 2034; https://doi.org/10.3390/su11072034
Submission received: 2 March 2019 / Revised: 29 March 2019 / Accepted: 31 March 2019 / Published: 5 April 2019
(This article belongs to the Section Sustainable Urban and Rural Development)

Abstract

:
The expansion of urban space makes citizens more dependent on cars, resulting in various urban environmental and traffic problems. Advocating low-carbon travel and building a sustainable low-carbon city are the major trends of urban development. Many scholars have pointed out that the urban spatial environment will lead residents to change their travel modes, but the residents’ travel patterns will also have an impact on the urban spatial layout. Based on the interaction between the two, most of the studies have been evaluated and studied from the level of rail transit and normal bus transit. The traffic volume level of trams lies between the rail transit and the normal public transit. However, the research and discussion on the relationship between the surrounding land use and residents’ travel behaviors are not yet perfect domestically. This paper takes Nanjing Chilin Tram Line 1 in China as the research object, combines the research of the the social attributes of the passengers who live along the tram line and the psychological accessing threshold of different travel purposes, provides analysis and evaluations of the coupling degree between the present situation of land use around its various stations and the residents’ actual travel demand with the measure of accessibility. The traffic volume level of trams lies between the rail transit and the normal public transit. However, the research and discussion on the relationship between the surrounding land use and residents’ travel behaviors are not yet perfect domestically. Taking Nanjing Chilin Tram Line 1 in China as the research object, this paper combines the research of the the social attributes of the passengers who live along the tram line and the psychological accessing threshold of different travel purposes. Furthermore, based on the measure of accessibility, it provides the analysis and evaluations of the coupling degree between the present situation of land use around its various stations and the residents’ actual travel demand. The research method of this paper is divided into three parts. Firstly, based on the questionnaire and OD survey, the coupling degree between the type of the station along the tram line and the distribution of passenger flow and the purpose of passenger travel is analyzed. Secondly, the KLP model is used to calculate and determine the effective influence range of the tram through the critical accessing distance for pedestrians psychologically. Based on different psychological thresholds for different purposes, the land use index within the influence range of the station is evaluated and analyzed, and the controlled circle of land use around each type of station is defined. Finally, the coupling degree between the actual land use status in each circle and residents’ psychological threshold with different purposes is analyzed, and the optimization strategy is proposed from the coupling degree between the overall station type & passenger flow along the line and the land use layout around the station & the residents’ psychological threshold.

1. Introduction

“The New Town” usually refers to a group of tectonic plates that can realize urban function and spatial expansion in a certain distance from the central city during the process of continuous spatial expansion of space in a large city, relying on certain resource conditions [1]. In order to maintain the sustainable competitiveness of the new town, it is essential to make intensive use of urban land [2], strengthen the coordinated development of land use and urban transportation, and effectively construct the urban public transportation system that will lead residents to choose low-carbon travel. The tram system, as a transportation system with the traffic volume level between subways and buses, can effectively improve the accessibility of the previous “metro+bus”-based transportation models in many large cities, and promote the construction of a multilevel low-carbon public transportation system [3]. Trams will become an important mode of public transport in developing countries. In China, the total mileage of trams has reached 10378 km. It is necessary and of theoretical and practical value to study trams. Condon P believed that the urban public transit system such as trams should be regarded as a kind of developing mode of urban space and the overall planning of transportation, and the principles of interconnecting transportation network and diversified land use should be combined with this mode to promote the sustainable development of the city [4]. By analyzing the case of trams in Sweden, Svensson T argued that it needed to stimulate the potential of trams and to with the help of strong support and promotion from more favorable urban planning policies [5]. In some large cities with dense population and more developed subway system, the capacity of trams makes it definite that they are suitable for accessing the surrounding satellite cities with the main urban areas [6]. For example, three tram lines in the south of central London serve the satellite city of Croydon. The tram line distributed in the suburbs of Paris intersects with many subways and RER, and a multilevel transportation network system is thus constructed. Suzhou Tram Line 1 serves as an extended tram, which effectively strengthens the traffic connection between the high-tech zone and the old town. These cases all show that trams play an important role in the public transportation system of the new town.
As large cities expand rapidly, the increasingly prominent issues of transportation and environmental problems have made the research on low-carbon transportation more and more concerned. The development of urban traffic system and land use patterns interact with each other [7]. Based on the relationship between them, Martínez put forward that the accessibility of urban space, which is related to urban spatial form, urban traffic and land use, plays a significant role in determining the scale of urban land use, the intensity of development and land use layout [8]. For example, Abigail L, Bristow A L and others proposed that the land use which encourages high-density and non-motorized travel is one of the measures to realize low-carbon travel [9]. After the research, Cervero [10], Levinson and Kumar [11], Schwanen et al. [12] pointed out that the compact development, which is characterized by high density, high volume ratio, and high balanced degree of jobs-housing balance distance and compact urban space form, would increase the accessibility of residents to all kinds of travel modes, reducing the residents’ travel distance and the use of private cars. Jiang Y.H and others proposed that the smoothness of the trip road, the accessibility of the destination, the perfection of the transportation facilities and the fairness of travel mode are the important indicators to describe the travel behaviors [13]. Shen [14] defined accessibility as an indicator of the depth and breadth of urban space, which is also proved by the research of scholars such as Pan et al. [15].
The construction of rail transit has promoted the accessibility of transportation and location advantage of the areas along the line, which have great impact on the value of land use. Cervero R confirmed that transit ridership can strongly influence the increase of land value around the stations through multiple regression analysis [16]. Mohammad et al. pointed out that many factors of the rail like the type of land use, the type of rail service can increase the impact of rail on land value changes through the meta-analysis [17]. Połom et al. studied the accessibility of the space along the railway through GIS, direct measurements of passenger flow and public opinion, arguing that there is a need to connect railway lines to urban transport systems and to plan more residential projects around them in order to attract more potential passengers [18]. Sutcliffe E analyzed eight cases of rail transit and concluded that mature rail transit had high passenger source, good corridor effect and strong impact on land use, which was supported by relatively scientific related policies and relatively consistent surrounding transportation system [19].
In order to change the negative effect of urban sprawl development, more and more scholars put forward the development modes like community development oriented by public transport and new urbanism. The study of urban built environment and traffic travel behaviors provides empirical basis for the implementation of these models [20]. travel behaviors are the foundation of urban traffic flow, and low-carbon travel is a manifestation of low-carbon behavior. By using travel diary data and land-use records in the San Francisco Bay Area, Cervero R and Kockelman K analyzed the impact of 3Ds (density, diversity, and design) of the built environment on trip rates and mode choice of residents [21]. Zhang L and Levinson D M found that different travel purposes have various determinants, and travel time has a more significant impact on commuting, the degree of commercialization is the decisive factor for consumers, and roadside esthetics landscape is more important to travelling for recreational trips [22]. In order to explore which kind of built environment factors plays a decisive role in travel behaviors, Cervero R and Ewing R H summarize the relevant research in the 20th century and draw a conclusion: Trip lengths mostly depend on the built environment, and trip mode choices depend on both the built environment and socioeconomics [23]. They also found that walking is most strongly related to measures of land use diversity, intersection density, and the number of destinations within walking distance. Bus and train use are equally related to proximity to transit and street network design variables, with land use diversity a secondary factor [24].
It can be seen that the urban spatial environment will lead to the choice of travel mode, and the travel behaviors mode will also have an impact on urban spatial form, which are interrelated and developed dynamically. In the above studies, from the perspective of urban space and travel behaviors, the domestic and foreign scholars studied the methods to lead and promote low-carbon travel to reduce the negative impact of urban traffic through a variety of ways, especially through the use of models and empirical researches. Therefore, based on the measure of accessibility, the author believes that analyzing and evaluating the coupling between land use (the mixed degree, land use layout, and development intensity) and residents’ travel behaviors along the tram line and studying the land use development mode along the line which can meet the travel demands of residents can provide reference for leading citizens to choose low-carbon travel transportation mode, which has positive significance for the sustainable development of the city.
At present, the research results on urban space and public transit at home and abroad are mostly concentrated on the areas along the rail transit lines such as subways and light rails, and the research on the land use along the tram line is relatively less.Based on the existing theory and research review, this paper analyzes the relationship between land use and the behavior of tram-takers along the line of Nanjing Chilin Tram Line 1, and explores the coupling development of land use and travel behaviors along the tram line from the perspective of the users.
Compared with the existing research, the main contributions of this paper include three aspects:
  • Object of study: Compared with mass transit and low-capacity conventional public transit, this paper studies the coupling relationship between land use and residents’ travel behaviors from the tram with traffic volume between them.
  • The influence scope of tram stations: In general, the research on the area of influence of trams mainly refers to subway stations whose influence is mainly discussed at the theoretical level by analyzing the empirical value and the practical investigation, or by adopting the theoretical modeling. The tram, as the rail transit with medium and low volume, cannot be compared with the conventional subway station. Therefore, the Kishi’s Logit PSM (Price Sensitivity Measurement) model is used in this paper to determine the effective range of influence by calculating the psychological threshold of the pedestrians access to tram stations along the tram line.
  • Nanjing Chilin Tram Line 1 is located in Nanjing Chilin New Town, which is a typical extended tram accessing the new town and the main urban area of a large city. In this research, the evaluation of coupling degrees between residents’ travel behaviors and land use along the tram line have definite typicality, whose research method can be used for reference for the trams of the same type to develop the areas along the tram line.

2. Research Methods

In this research, Nanjing Chilin Tram Line 1 and the areas along the line are taken as research samples, and its surrounding built-up environment and the passengers are studied through field observation, questionnaires and interviews to obtain the data of the residents’ travel behaviors and social attributes, and the present situation of built-up environment along the tram. Through statistical calculation and analysis of the data, this paper evaluates the coupling between different types of stations and the residents’ travel demand, and between the land use around all types of stations and the psychological threshold of residents’ travel demand respectively.
The research is divided into three steps:
Firstly, through the questionnaire survey, the social attributes, travel purposes and paths, the time consumption of each travel and the travel mode of the passengers living along the tram line, and the psychological distance threshold for pedestrians access to the tram stations are obtained. Through the information of urban planning with relevant control, constructive detailed planning and design provided by the urban planning commission, which is combined with the field research of built environment, the data such as the built environment, land use property and the plot ratio of the areas along Chilin Tram Line 1 are determined.
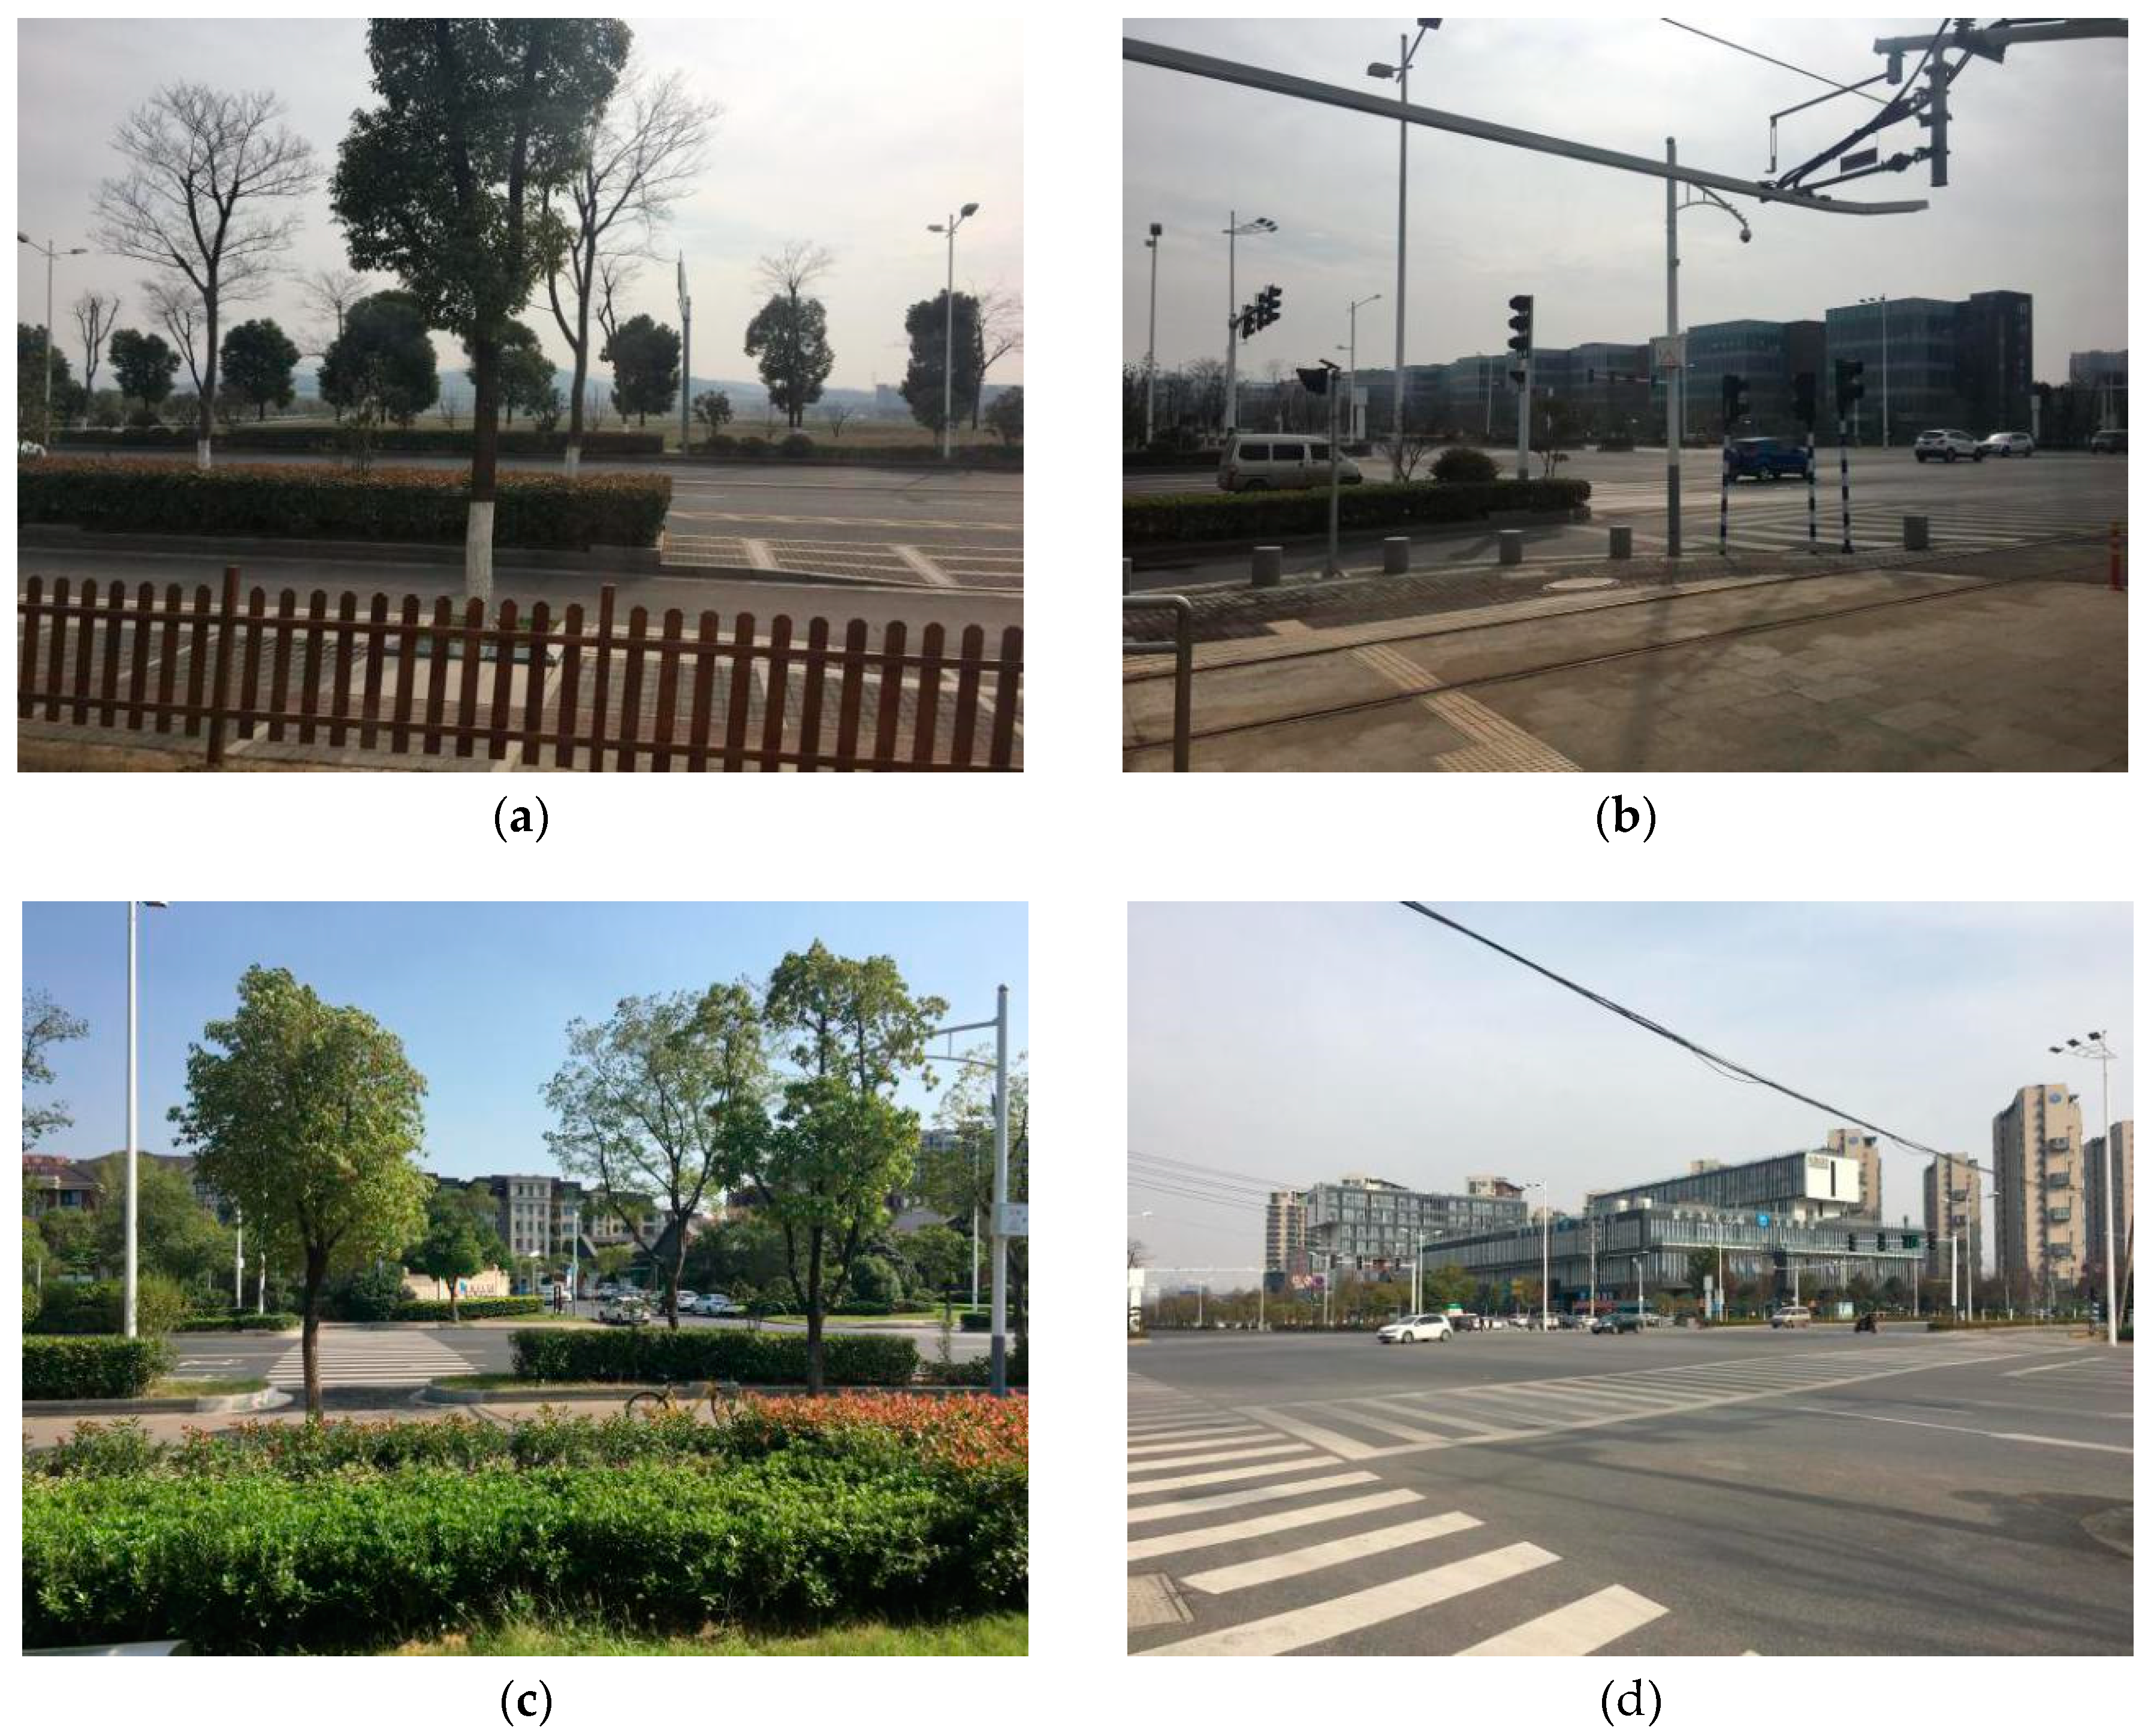
After that, the coupling between passengers’ travel behaviors and land use along the tram line is analyzed from two aspects. On the one hand, by investigating the OD trajectory of passengers with different travel purposes, the passenger flow intensity is calculated, and the correlation between the passengers’ travel demand and the type of stations is analyzed. On the other hand, based on the psychological distance threshold for pedestrians’ access to the tram stations through questionnaires, the Kishi’s Logit PSM (KLP) model is used to delineate the radiation range of the actual influence of each station that was studied, and to evaluate and analyze the coupling between the land use index & the rules for change within the influencing circle and the psychological threshold of residents’ travel demand. Among them, the land use index includes the degree of mixed land use, dominance index of land use and the diversity index of land use. Besides, since Chilin New Town stands for the development area of the new town that is still under construction, there are quite some similarities among the width of the road, the width of the sidewalk, and the form of the road cross-section around the stations (Figure 1). Through measurement and research, these areas around stations have the same standard for scale, cross-section and green design on the same level of road. Therefore these indexes are thus not considered as the main influencing factors in this research, with only the accessibility, the density of road network and the attractiveness of land use property taken in consideration.
Finally, based on the previous analysis, this research evaluates the coupling degree between land use and residents’ travel behaviors along Chilin Tram Line 1 from the perspectives of the coupling between the station types and the passengers’ travel demand, and the coupling between the land use situation around the stations and the psychological threshold of residents’ travel demand.

3. Research Content

3.1. Overview of the Research Area

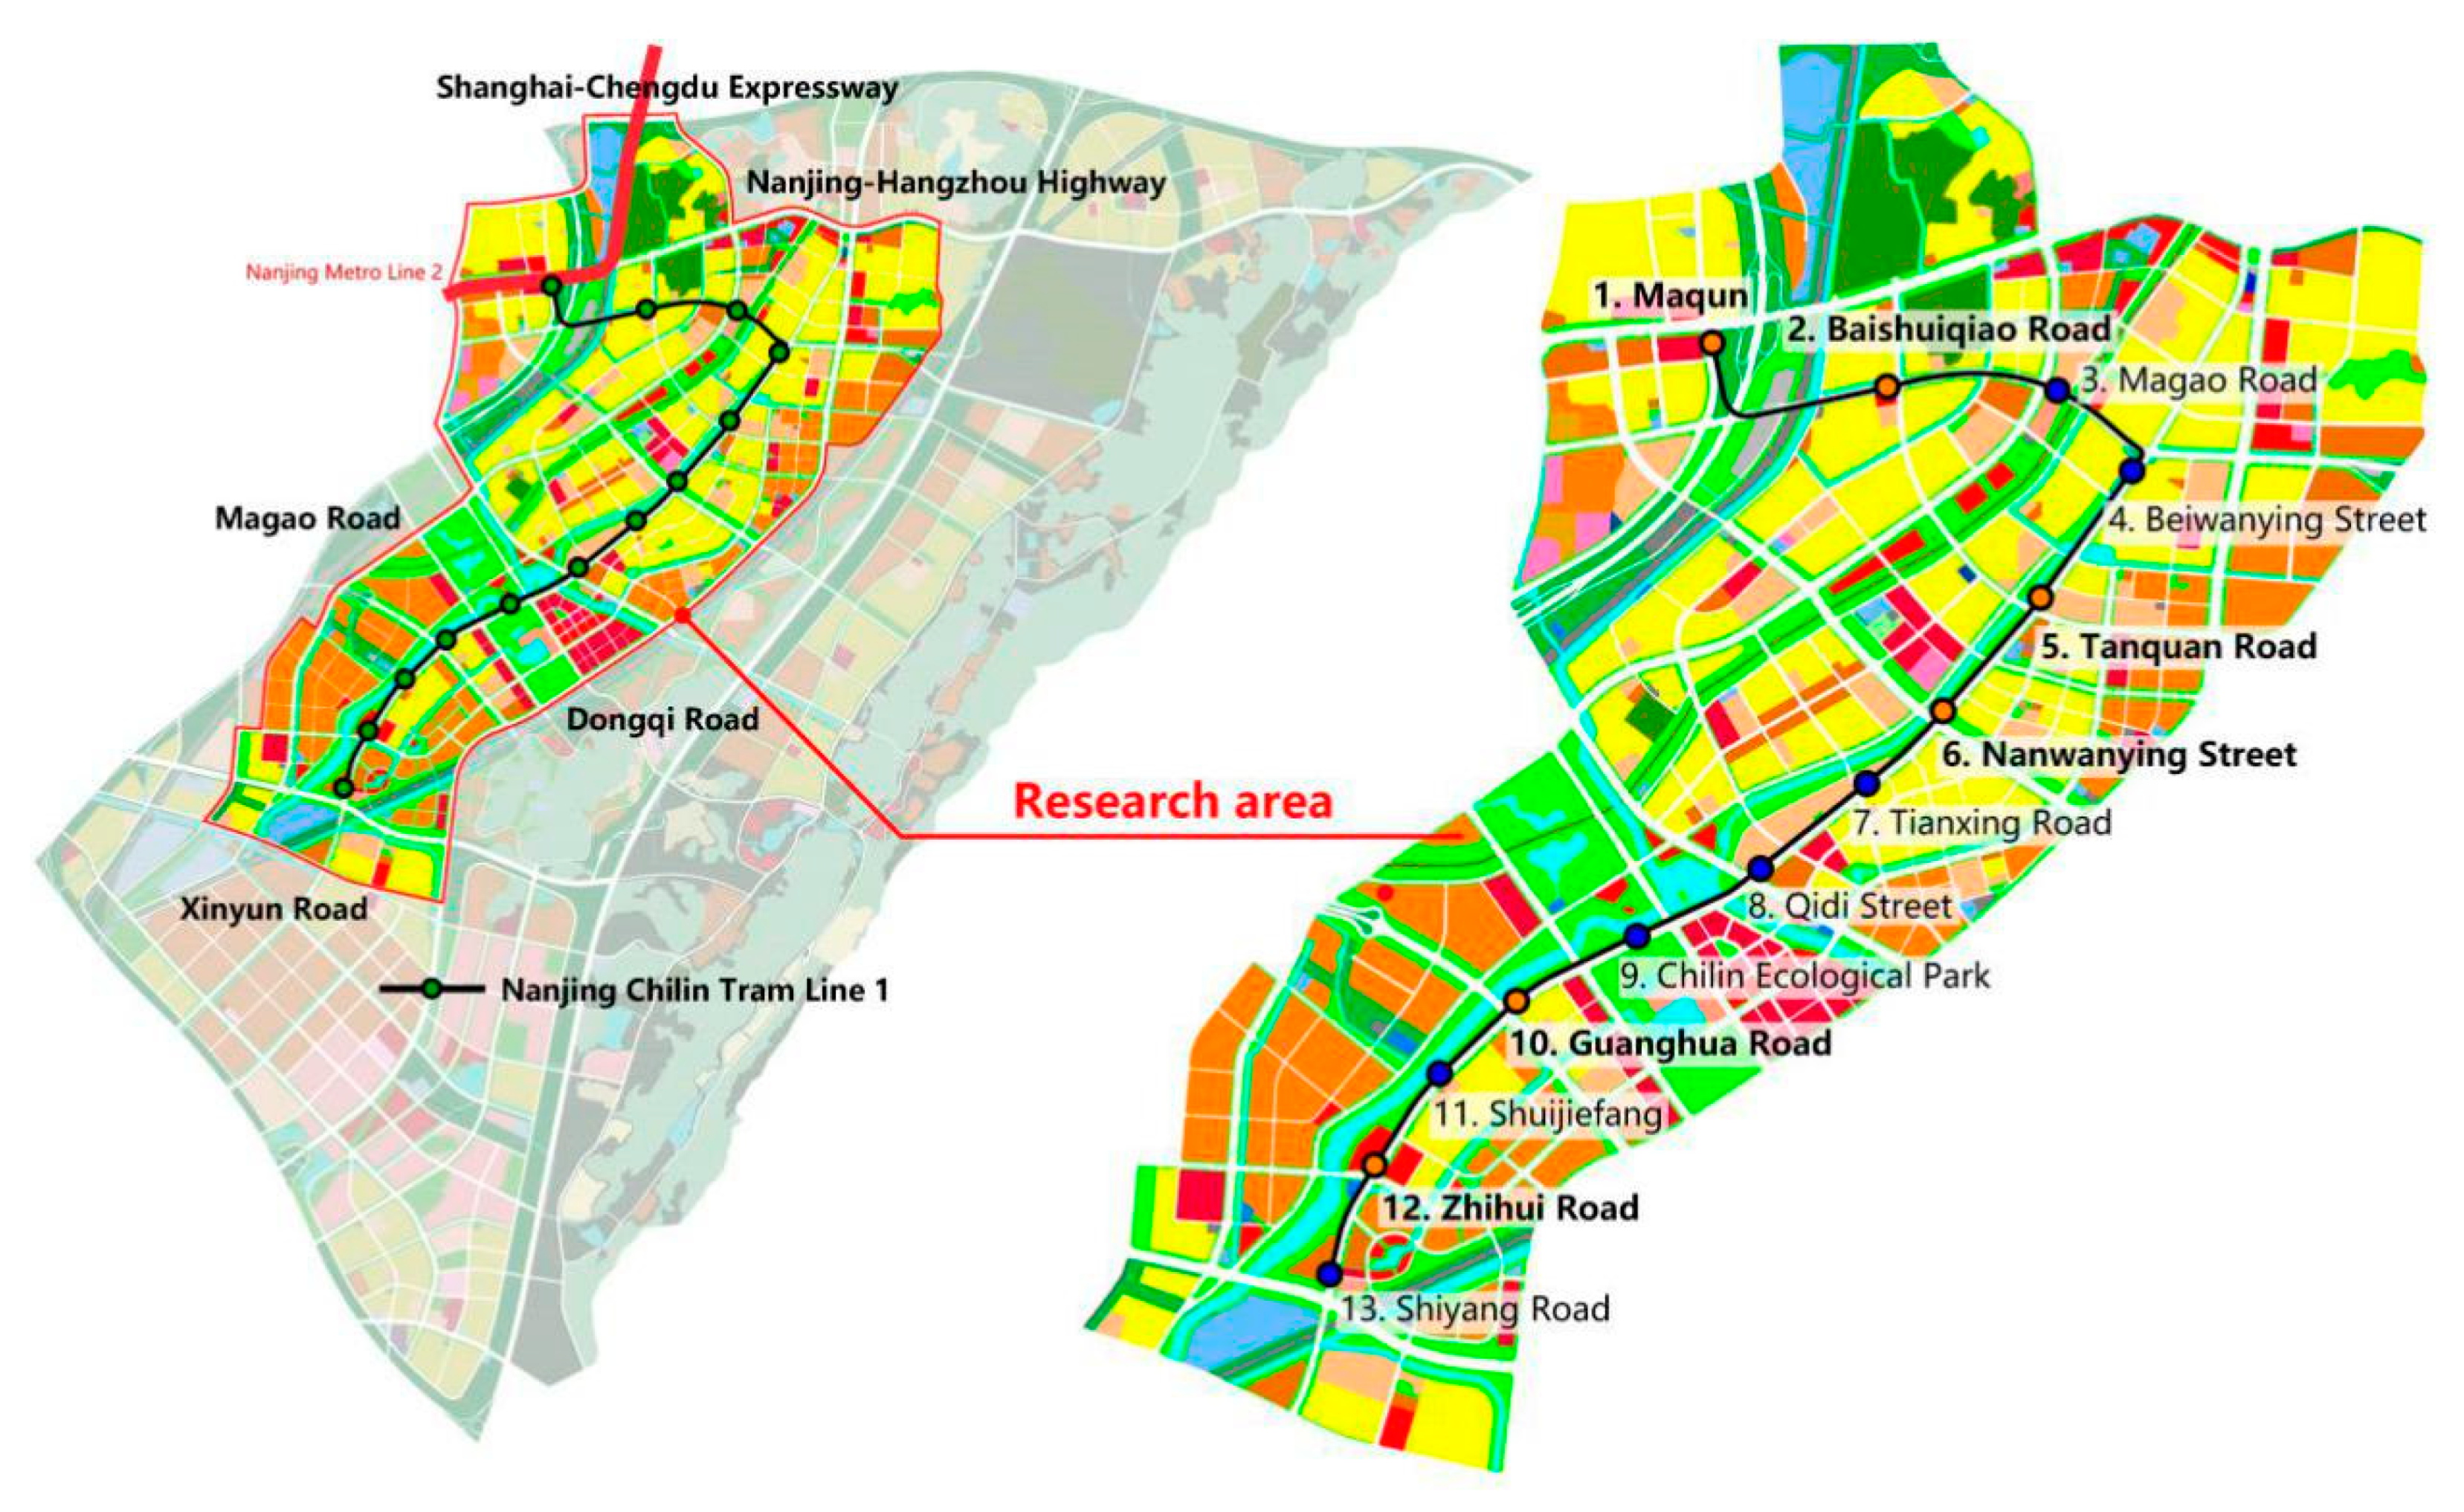
In July 2010, Nanjing Chilin Hi-tech Innovation Park, also known as Chilin New Town started its construction officially, which is the newly developed urban area, located in the east of the main city, with superior location, good ecological environment, and rich historical and cultural resources (Figure 2). Chilin New Town is defined as an ecological comprehensive new town, of which the function orientation is given priority to the scientific and technological research and development, while the comprehensive functions such as residence, commerce and education are complementary. The overall development intensity is not too high and can be defined as the medium development intensity.
With a total of 13 stations, the overall length of Chilin Tram Line 1 is about 8.95 km, the average station spacing is 728 m, and the time consumption of one-way travel is about 26 min. As the entrance of Chilin New Town, Maqun Station, the original station of Chilin Tram Line 1, is connected to Maqun subway station of Nanjing Metro Line 2. The tram improved the rail transit network in the east part of Nanjing, and at the same time promoted the development and construction of the land along the tram line.
The types and layout of land use along and around the tram line have generated the corresponding travel behaviors of the residents to meet different needs, which is an essential way to evaluate the coupling degree between land use layout and passengers’ travel behaviors along the tram line.

3.2. Selection of Research Samples

In order to truly understand the travel behaviors characteristics and land use characteristics data of residents along Chilin Tram Line 1, the author conducted a survey on the travel characteristics of residents and land use layout of the research area in October 2018. The scope of this research was mainly composed of the 1km areas along the tram line, which is surrounded by Nanjing-Hangzhou Highway, Dongqi Road, Xinyun Road-Magao Road and Shanghai-Chengdu Expressway. This research classifies the 13 stations along the line according to the land use characteristics around the stations (Table 1), and numbers the selected stations from the origin station to the terminal station sequentially to make it clear (Figure 3).
In this research, the tram is divided into upper and lower ends. The upper section is called Chilin residential section (No. 1–7), along which the land is basically used for residence with relatively small block scale. The lower section is called Chilin Hi-tech Innovation Park section (No. 8–13), along which the land is basically used for scientific research and design. According to the classification oriented by different functions of land use, the stations along the tram line are divided into four types: the accessing station, function-oriented stations, group development stations and the special function station. The accessing station is designed to connect the stations which are important metro transportation hubs, so the P&R (Park & Ride) function of bus stations and rail transit stations should be properly matched. Group development stations are defined as the group-level public service center, which is mainly surrounded by commercial buildings and large public service facilities. At the same time, the group development stations will be the public transit hub in urban areas. The land use types around function-oriented stations are mainly undertake a certain kind of function within the community. According to the survey, this paper subdivides the stations into the residence-oriented stations which are dominated by residential communities, the public service-oriented stations that undertake the public activities, education and scientific research and other public services in the community, and the scientific research office-oriented stations that meet the needs of residents for their jobs. Among them, the level of the public service facilities around the group development stations is higher than that of the function-oriented stations which undertake the public service function in the community.
According to the typicality of each station type, six representative stations of different types were selected as the research object, and their passengers were investigated through interview questionnaire. These stations are No. 1 Maqun station which is accessing station, No. 2 Baishuiqiao Road Station and No. 5 Tianquan Road Station which are residence-oriented stations, No.6 Nanwanying Street Station which is public service-oriented station, No.10 Guanghua Road Station and No. 12 Zhihui Road Station which are scientific research office-oriented stations (Figure 3). Qidi Street Station, Shiyang Road Station and Magao Road Station are typical stations of some kind with a certain degree of representativeness, but they are not taken as the research objects for the time being because the construction of surrounding areas has not been basically completed yet.

3.3. Content

3.3.1. Content of Questionnaires and Interviews

The data collection of passengers’ travel at the typical stations can be mainly divided into three types: 1. Residents’ socio-economic attributes and travel purposes. 2. travel demand of the travelers. 3. The psychological threshold of pedestrians’ access to the tram stations.
Research method: Based on the questionnaires, this survey is recorded through questionnaires in the form of face-to-face interviews with travelers. The researchers, with a total of 6 people, went to the selected typical tram stations in 5–6 days. As a new town under construction with low development intensity of the land, Nanjing Chilin New Town has far less local population than that of the central urban areas and it’s rather difficult to get a large number of interview questionnaires, so each station was issued 50 questionnaires, and a total of 300 questionnaires were distributed, of which 289 effective questionnaires were received. The research objects of the study are randomly selected residents who live along the tram line and walk to the corresponding tram stations to take the tram. The time for the research was for both weekdays and holidays in good weather. The questionnaires were mainly in the form of multiple-choice questions and blank filling.
  • The socio-economic attributes: The socio-economic attributes include gender, age, educational background, family car ownership and dwelling state.
  • The travel demand: The travel demand mainly includes the travel purpose of the residents, the time consumption of one-way travel, the focus on choosing the common travel modes, and the origin-destination stations (OD), The distance threshold of pedestrians’ access to the tram stations. This paper mainly studies the distance threshold of pedestrians’ access to the tram stations, including the actual distance threshold of accessing to the origin-destination stations and the most acceptable distance threshold which can be accepted psychologically by the pedestrians.

3.3.2. Research on the Built Environment

The research contents include the general situation of land use, the width of the road, the width of the sidewalk, and the form of the road cross-section around the stations. The acquisition of the data was mainly based on the topographic map and the vector map of the land use situation in Nanjing which were obtained from Nanjing Urban Planning and Research Center. At the same time, the data were checked and corrected with the information of the drawings according to the on-site observation and measurement, so as to supplement and improve the parts of the drawings which were missing and needed to be updated. On this basis, the data were analyzed and obtained with the help of AutoCAD, EXCEL and other software.

4. The Passengers’ Demands Satisfied by Various Types of Stations

4.1. Coupling Analysis of Passenger Flow Intensity and Station Type Based on Origin-Destination Survey

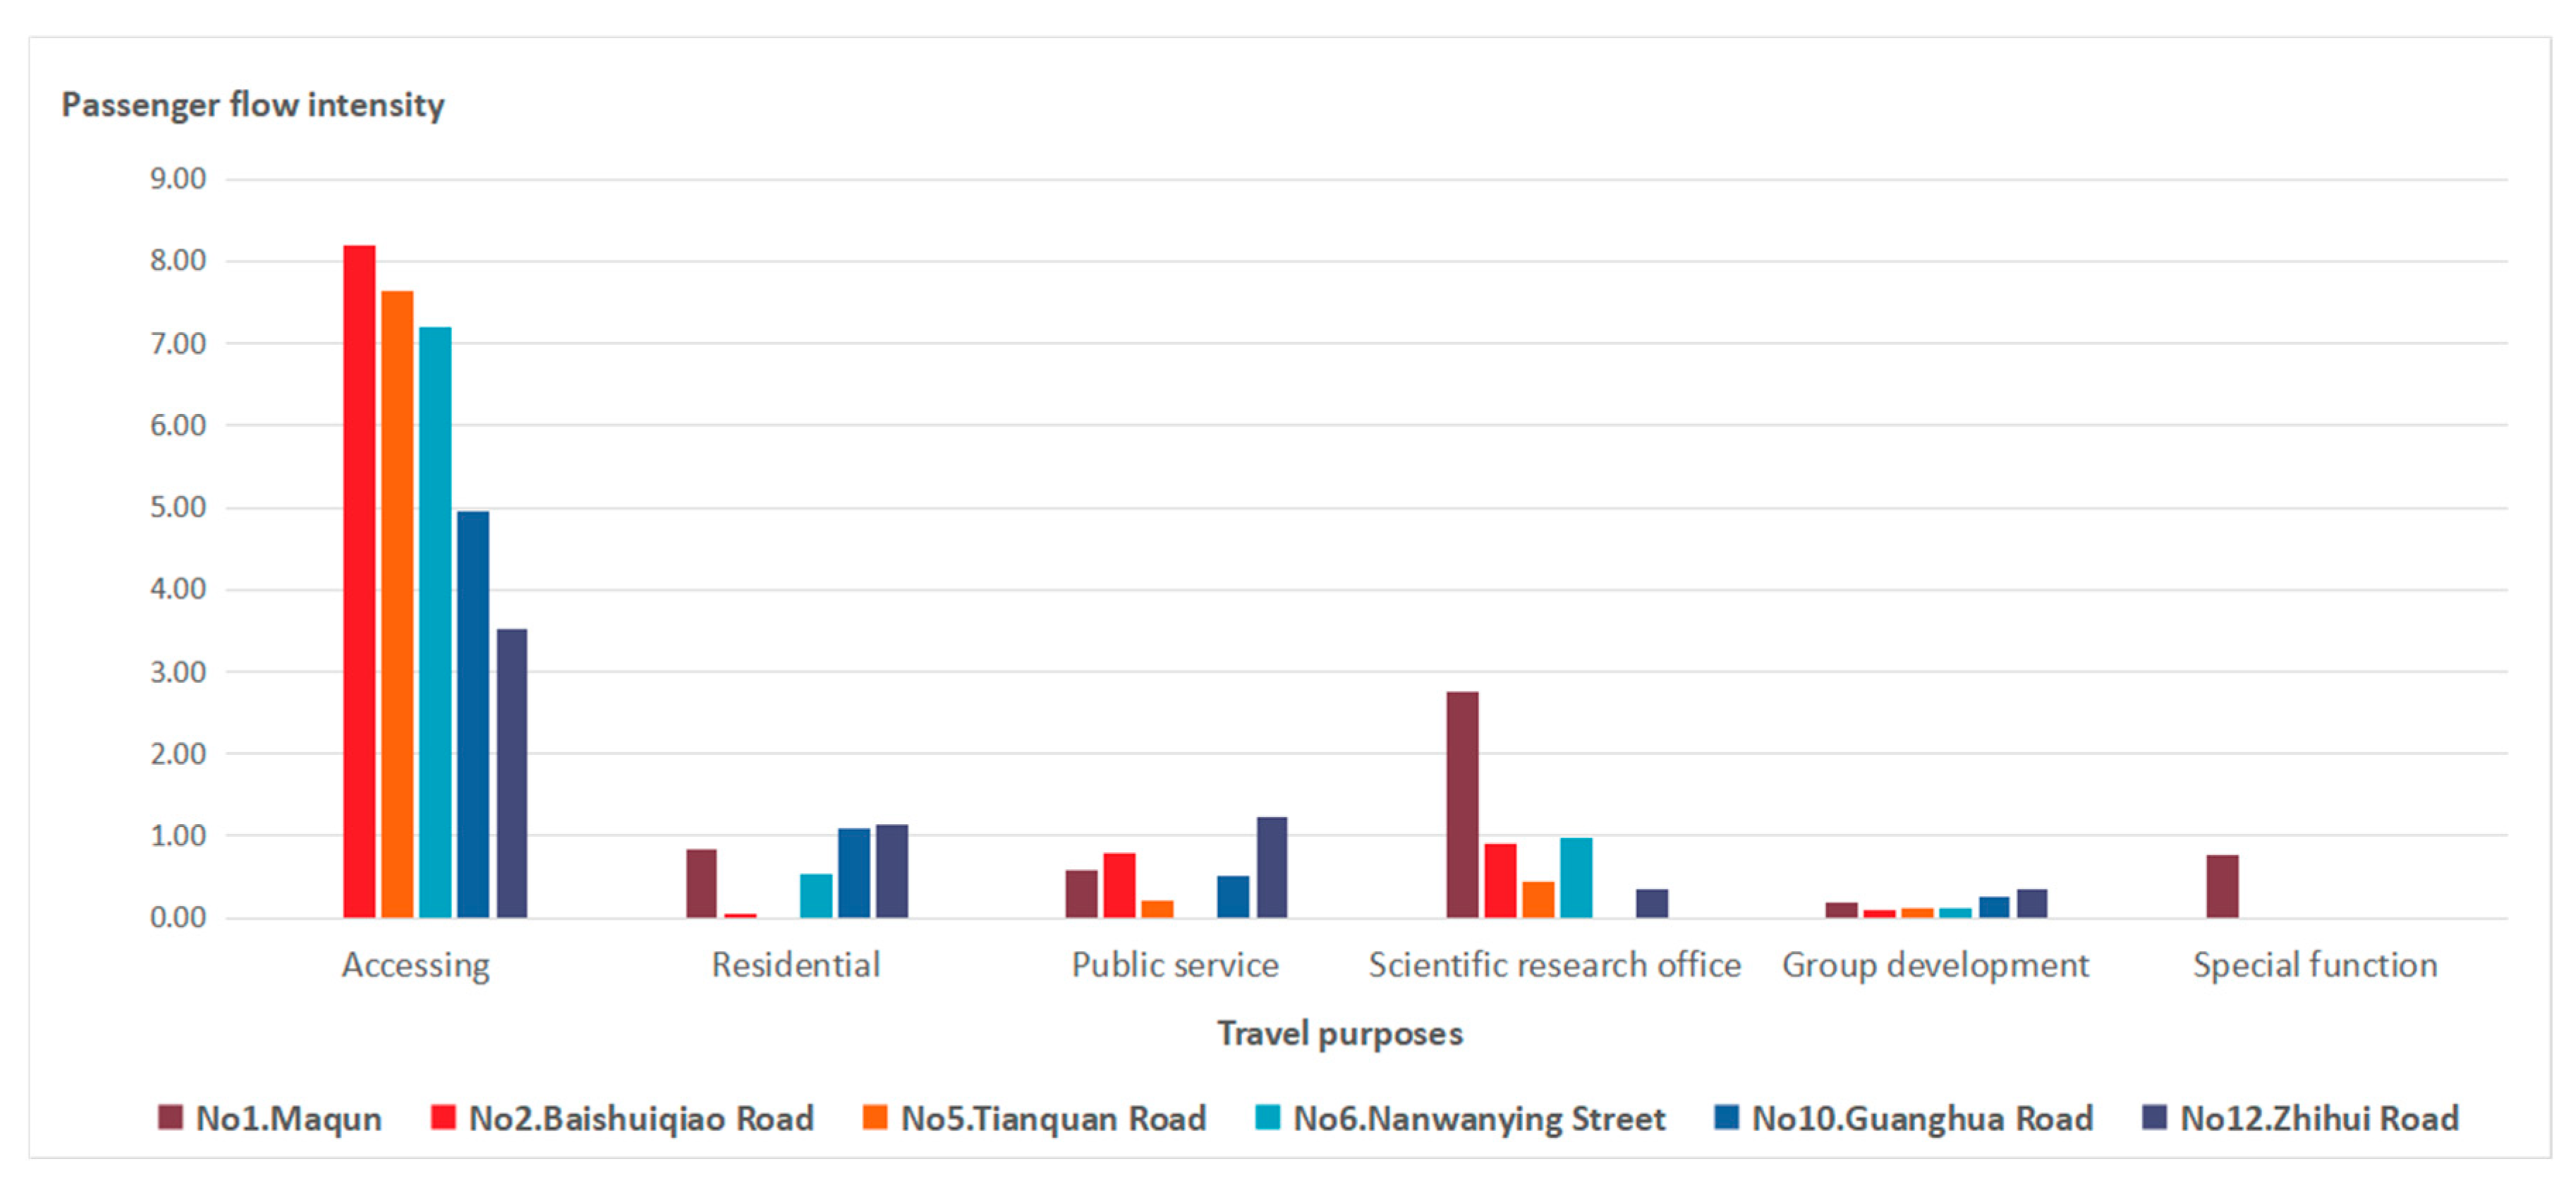
In this research, we compared and analyzed the different station types and the passenger flow intensity among different types of stations by counting the number of passengers who took the six sample stations as their original stations and went to other stations, so as to analyze the attractiveness of different types of stations to passengers.
In this research, the six stations are regarded as the original stations to calculate passenger flow of origin-destination stations, the destination stations were classified according to station types, and the number of passengers arriving at different types of stations from the six stations was calculated, which was called the mean value of OD (the class mean) from the stations to different types of stations is calculated, which is compared with the average value of OD (the grand mean) from this station to the other stations of the whole line, thus we can get the class mean/the grand mean [25], and the distribution results of passenger flow intensity between different types of stations as shown in Figure 4 are obtained.

4.1.1. The Accessing Station

There is a distribution of passenger flow between the accessing station and other types of stations. The intensity of passenger flow to scientific research office-oriented stations is higher, followed by resident-oriented stations, and there is no obvious distribution of passenger flow in other stations. Most passengers leaving their homes will travel from Shiyang Road Station to Maqun Station, while the reverse passenger flow is less.

4.1.2. Residence-Oriented Stations

The passenger travel characteristics of two stations under investigation are obviously consistent. The passenger flow intensity between residence-oriented stations and the accessing station is much higher than that of other types of stations, and there is a passenger flow distribution among residence-oriented stations, the public service-oriented station and scientific research office-oriented stations with low intensity, and there is no passenger flow between residence-oriented stations and the special function station. No significant passenger flow distribution is found in other stations.

4.1.3. The Public Service-Oriented Station

Passenger travel characteristics have certain similarities with residence-oriented stations. The traffic flow intensity towards the accessing station is the strongest. The relationship of passenger flow between scientific research office-oriented stations and residence-oriented stations is significantly stronger.

4.1.4. Scientific Research Office-Oriented Stations

The distribution of passenger flow between the two research stations has obvious consistency. The passenger flow distribution between scientific research office-oriented stations and the accessing station is the highest, followed by residence-oriented stations. However, compared with the passenger flow intensity between other types of stations and the accessing station, the passenger flow intensity is relatively lower.
According to the above analysis, the overall distribution of the passenger flow intensity along the line is extremely uneven. The flow of passengers from other types of stations to the accessing station is much stronger than other types of stations. The overall passenger flow mainly moves towards Maqun Station but less towards Shiyang Road Station, which shows that Chilin Tram Line 1 in the interior of the new town is relatively less attractive to passengers. Among them, the passenger flow intensity between the accessing station and scientific research office-oriented stations is the highest, followed by residence-oriented stations. The passenger flow is generated between each type of stations and residence-oriented stations. Public service-oriented stations and scientific research office-oriented stations mainly have a close relationship with the accessing station and residence-oriented stations. Because of the insufficiency of the status quo, group development stations and the special function station become the weakest stations in the whole tram line, which is less attractive to passengers. There is almost no passenger flow among the same types of stations. It is thus clear that the functions of different types of stations are complementary, which can better attract the passenger flow.
To sum up, there are great differences in the OD travel volume between different types of original and destination stations, and the passenger travel characteristics of the same type of stations have obvious similarities.

4.2. The Travel Demand of Various Station Types Based on Questionnaire Investigation

By calculating the distribution law of passenger flow intensity, it is shown that the distribution of passenger flow is obviously affected by the type of stations, which means the type of land use around the station determines the station property, affecting the travel characteristics of passengers. On this basis, this study will continue to subdivide the social attributes and travel behaviors of passengers with different types of stations as the original and destination stations, and analysis the relationship between station types and passengers’ travel demand.

4.2.1. Analysis of the Questionnaire Survey Regarding Passengers’ Travel

(1)
Passengers’ Social Attributes
(a)
Age structure: The residents under 18 and over 60 years old account for 5.54%, and the residents aged between 19- and 30-years old account for more than a half. The research data are basically consistent with cognitive observation, which shows that the majority of tram-takers are young and middle-aged people, while the retired, unemployed and underage residents are less willing to take trams (Table 2).
(b)
Economic level: Among the tram-takers, 37.72% of whom have no cars at home, 65.4% are permanent residents, 27.68% are tenants, and 6.92% are temporary residents, among which 93.42% of the passengers live along the tram line. It can be seen that the accessing of Chilin Tram Line 1 with the mass transit system has great attraction to the choice of living places for middle- and low-income families living in the residential areas along the tram line.
(c)
Educational background: Nearly 70% of the passengers have college and bachelor degree or above. The residents are relatively well educated.
(d)
Economic level: Among the tram passengers, 37.72% of whom have no cars at home, 65.4% are permanent residents, 27.68% are tenants. The temporary residents only account for 6.92%, which is relatively small. Among the investigation samples, 93.42% of the passengers live along the tram line. It can be seen that Chilin Tram Line 1 is highly efficient in connecting the rail transit that has large capacity, which has rather great attractions to the residents living along the tram line when choosing their travel modes.
(2)
Passenger Travel Characteristics
(a)
Travel purpose: Passengers commuting for work and study account for the highest proportion, followed by consumption and entertainment, showing that Chilin Tram Line 1 is mainly responsible for daily commuter travel needs of passengers, followed by the residents’ demand for commercial shopping, consumption and entertainment along the line, which is less attractive to the travelers who have needs for fitness and recreation.
(b)
Time consumption of one-way travel: More than 70% of the passengers travel within 40 min (including arrival and off-site threshold). After weighted average calculation, we can learn that the average travel time is 33.74 min. The result shows that the majority of travelers tend to take trams when the overall travel time is within the range of 35 min. In order to increase the attention of residents along the line to the tram, it is suggested that the travel purposes and needs of passengers should be met as far as possible in the urban space along the line within the above time consumption.
(c)
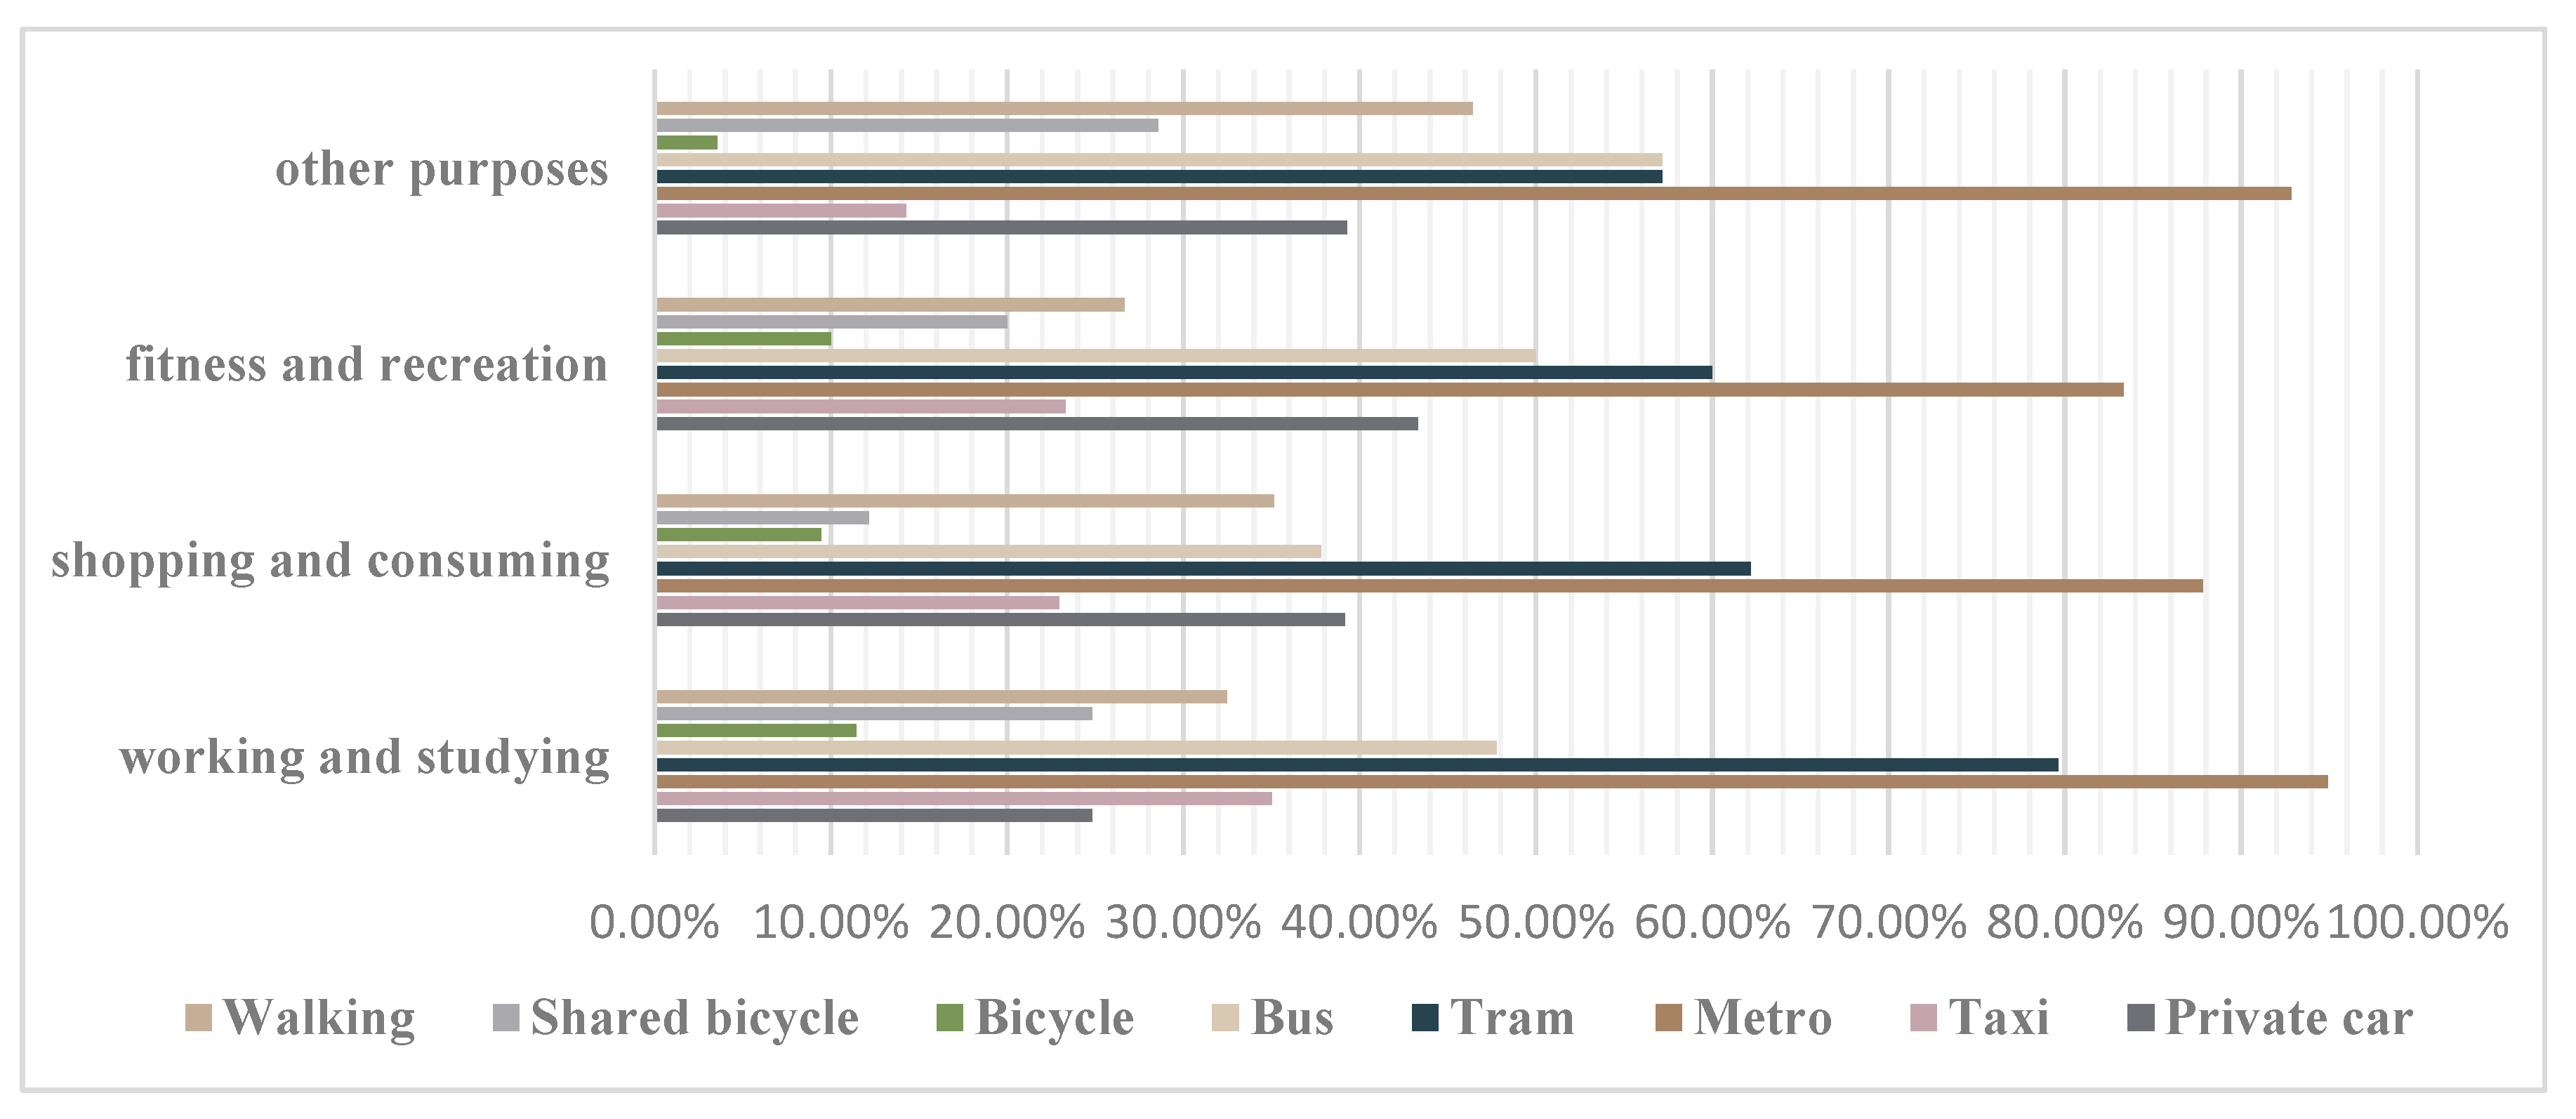
Transport mode preference: As shown in Figure 5, about 80% of the passengers choose trams for daily commuting, while only 60% of the passengers who have the needs for consumption, entertainment, fitness, recreation and other purposes choose trams, paying less attention to trams compared to commuters. It can be seen that travel purposes have a certain impact on residents’ choice of daily transport. The author believes that appropriately strengthening the construction of commercial and recreational facilities along the line is helpful to increase the attention of the residents to the tram.

4.2.2. Correlation Analysis of Passengers’ Travel Demand and OD Stations

(1) OD Trajectory Analysis of Passengers with Different Travel Demand
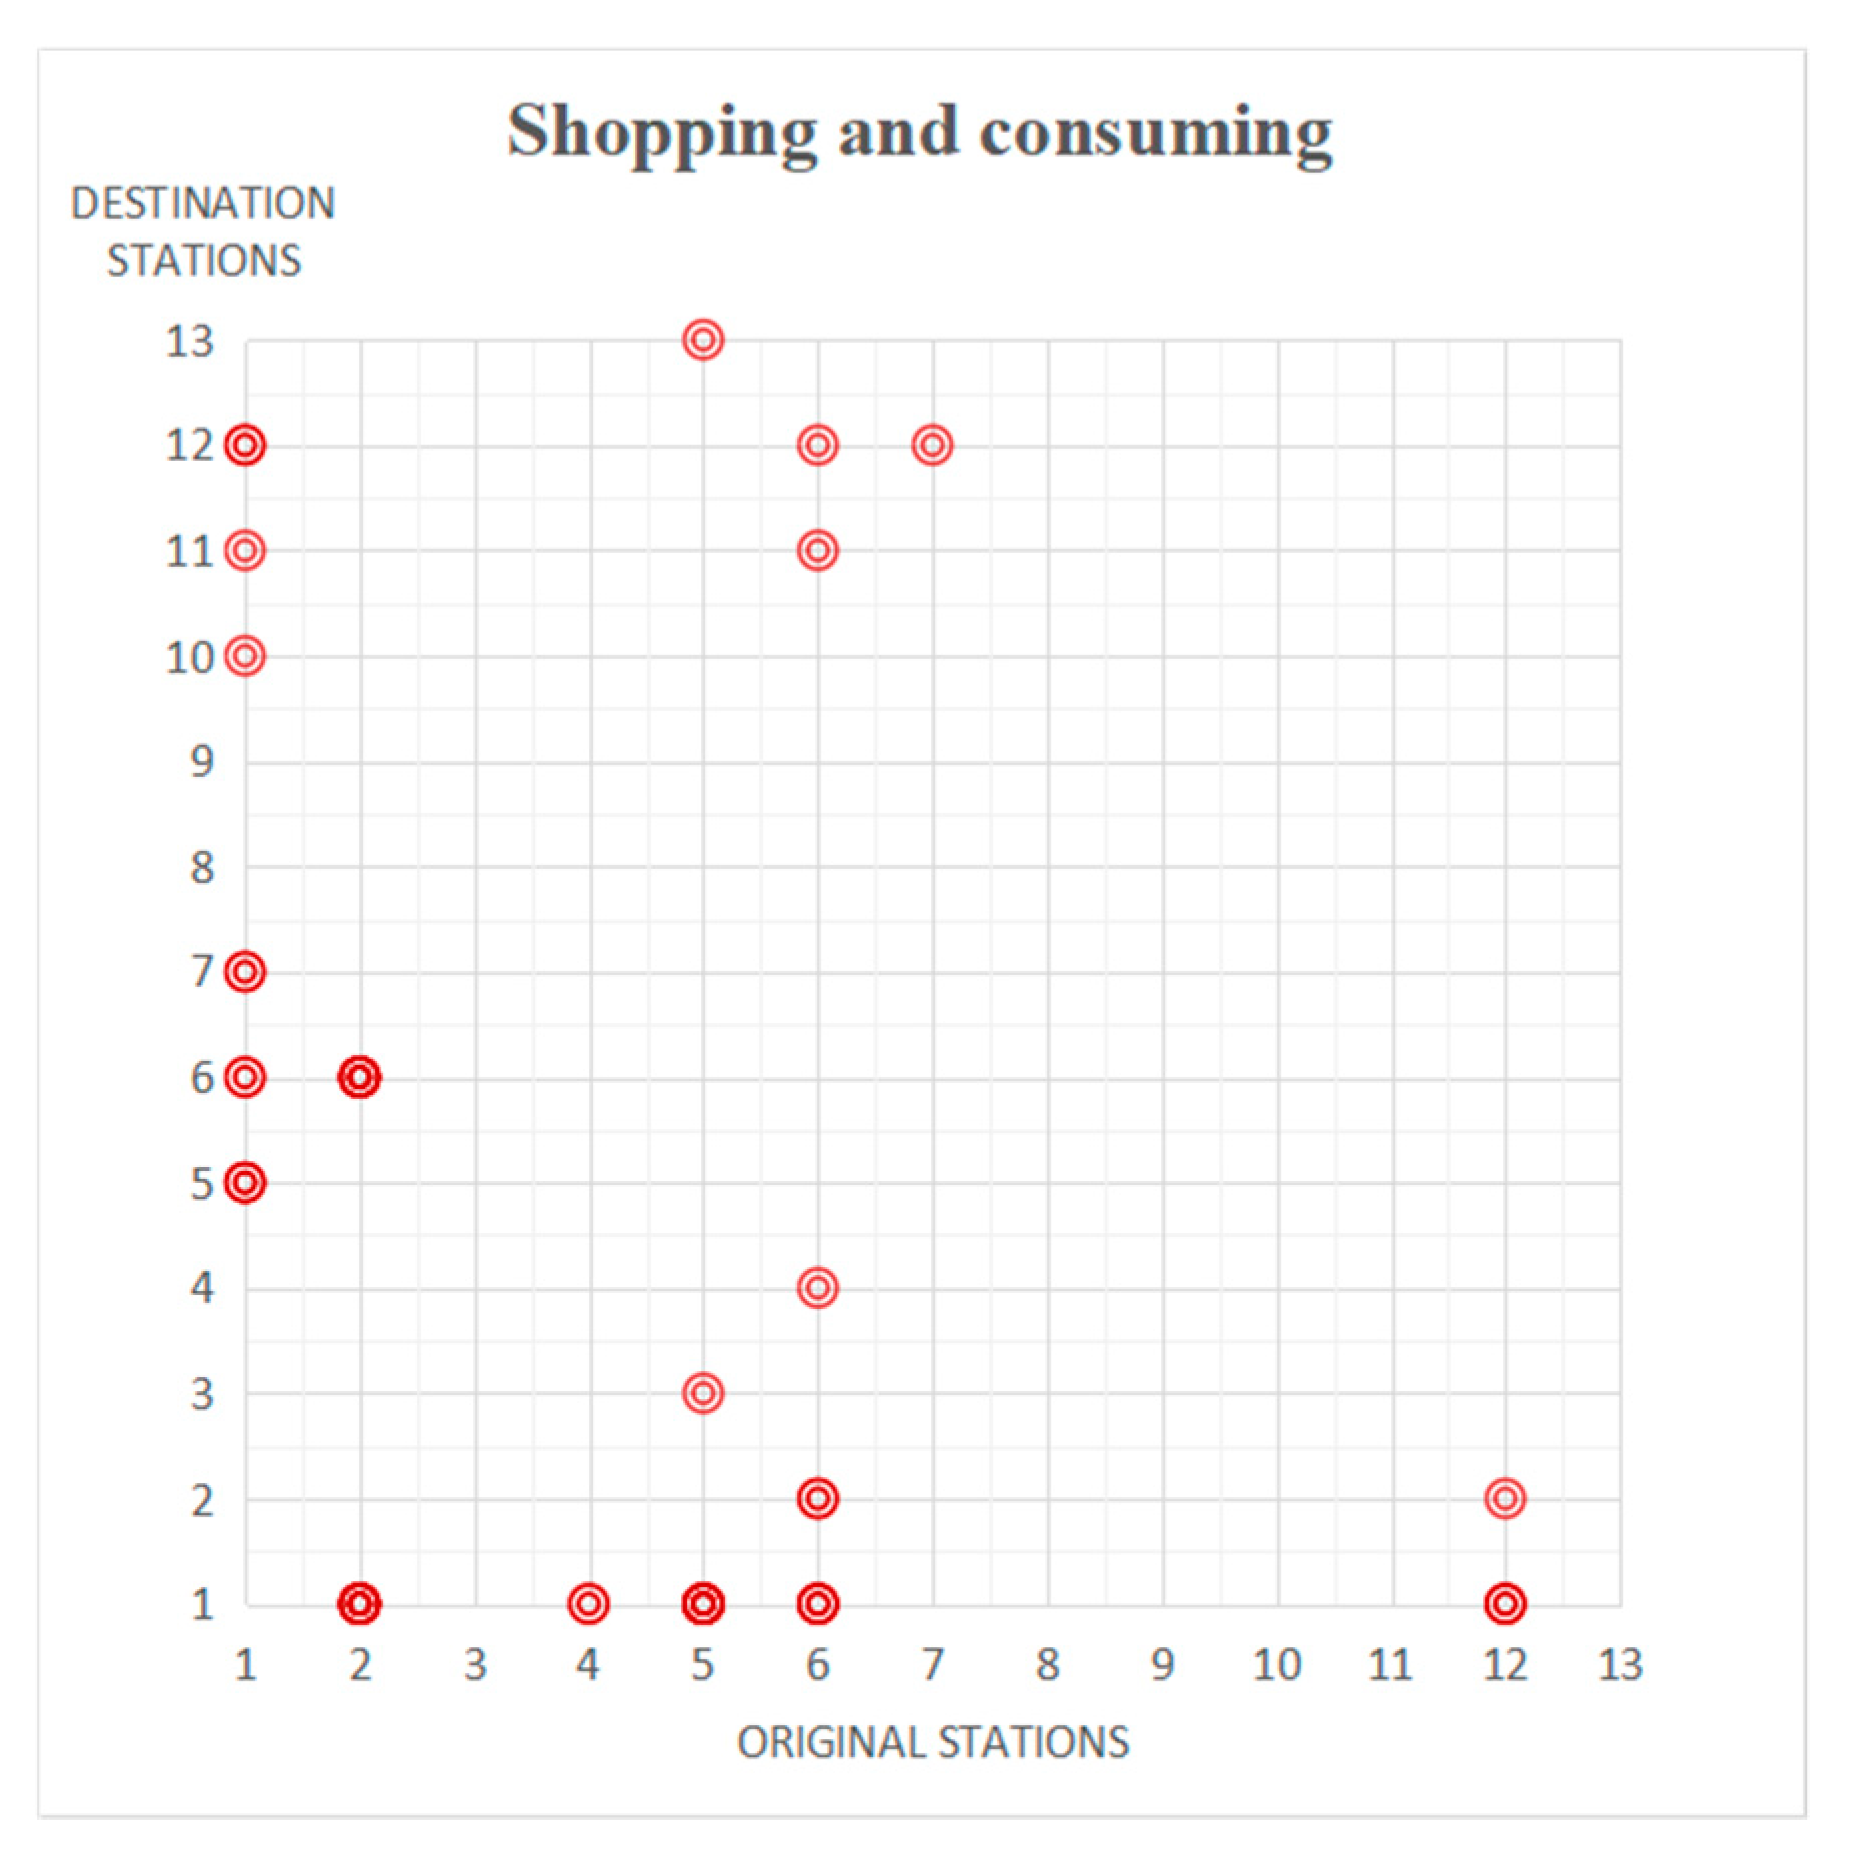
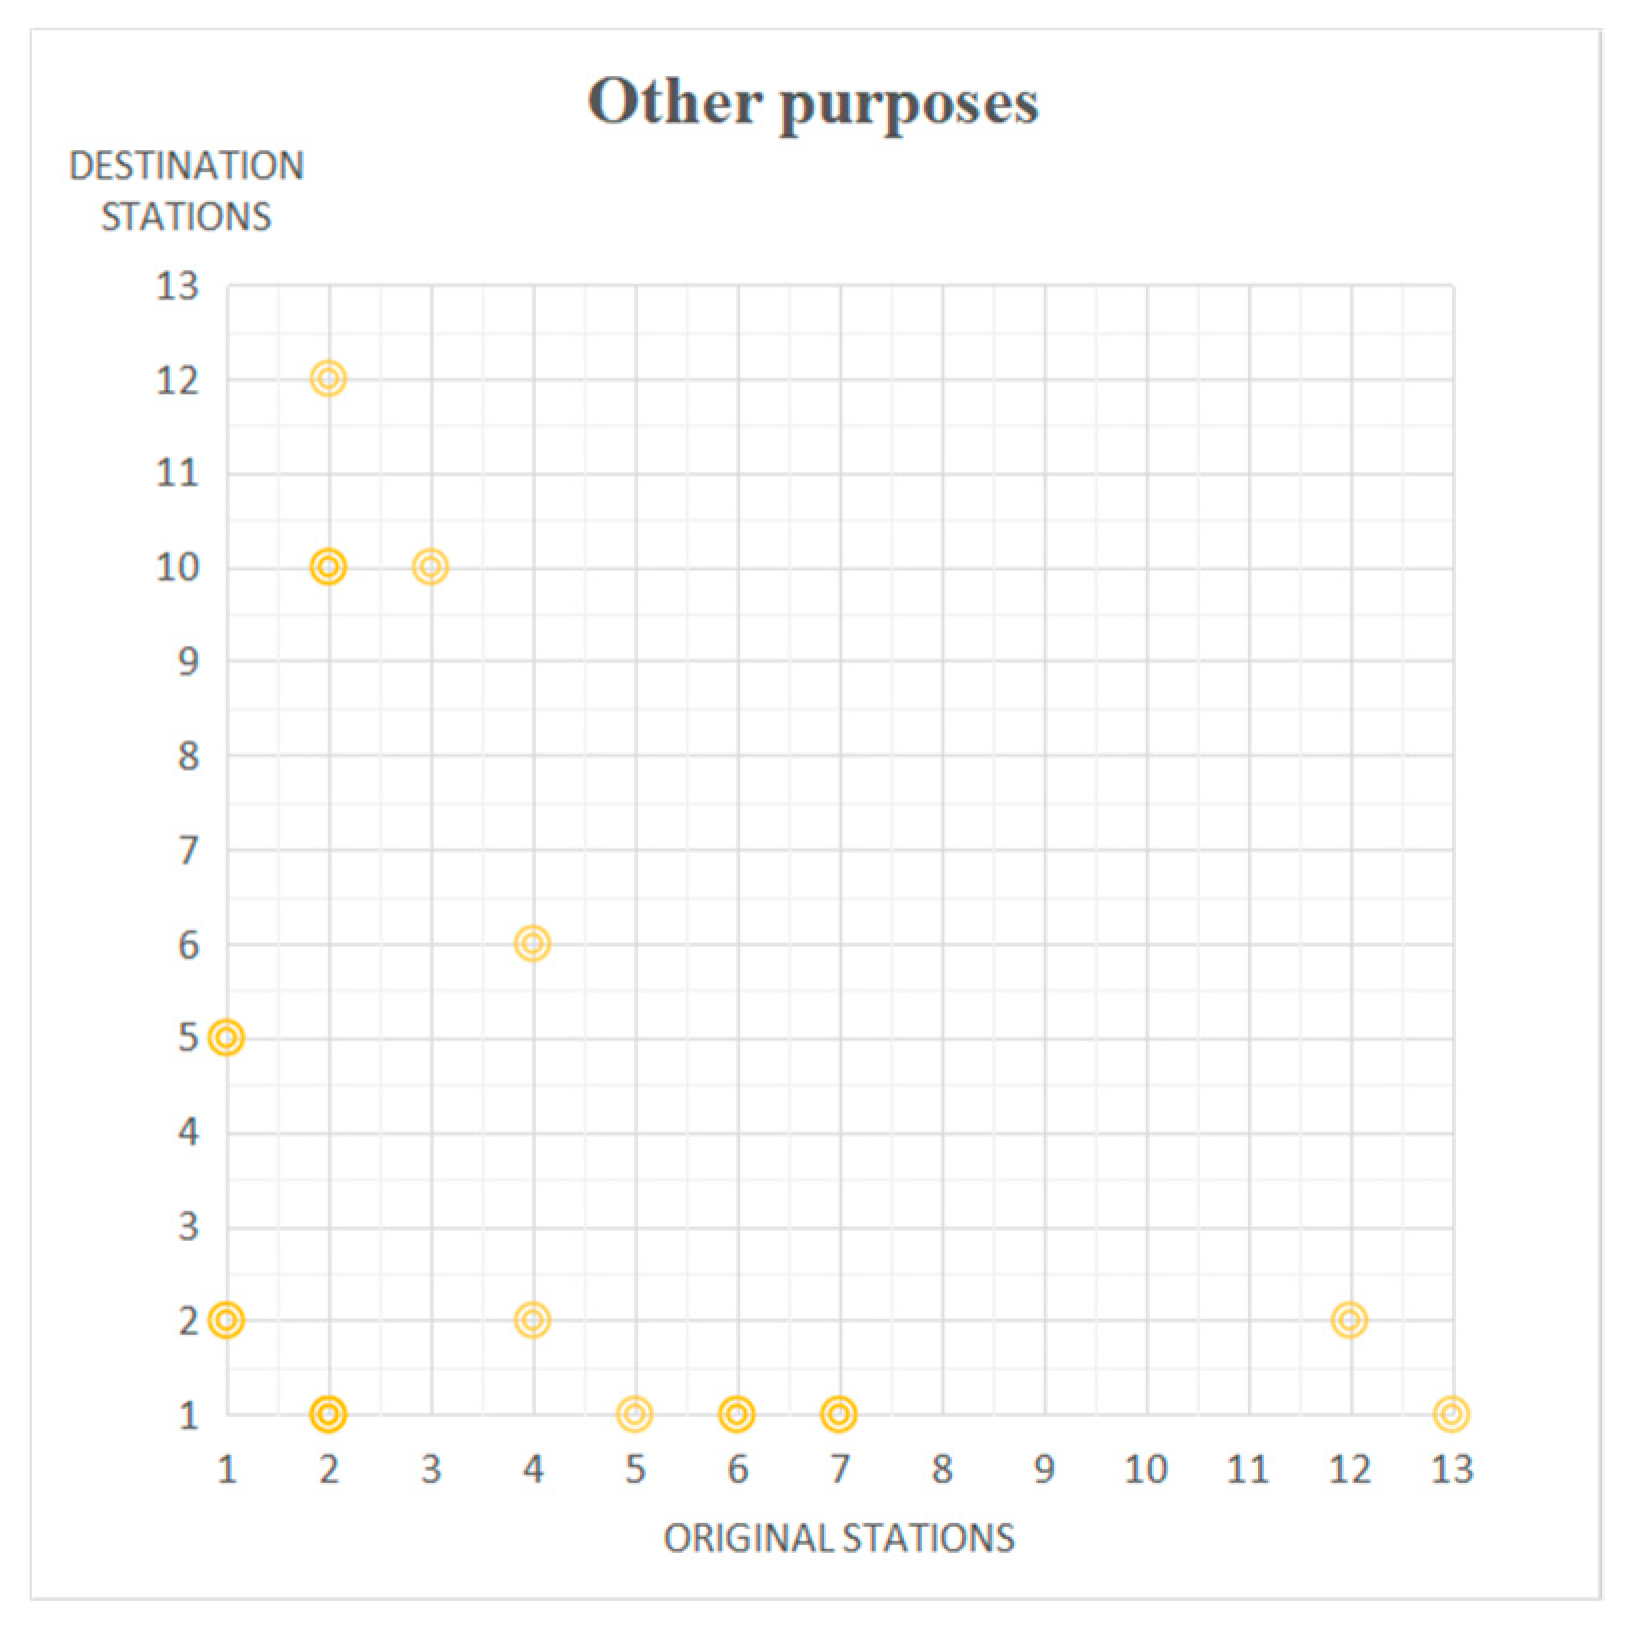
As shown in Figure 6, Figure 7, Figure 8 and Figure 9, there are the OD diagrams of the origin-destination stations for passengers with different travel purposes. The abscissa is the original station x, and the ordinate is the destination station y, and (x, y) represents an OD data pair. The darker the dots in the figures, the stronger the connection between the stations.
• Travelling for Working and Studying
Daily commuters mostly travel to Station 1, 10 and 12, starting from Station 1 to 7 basically, which demonstrates the strong attraction of scientific research office-oriented stations to commuters along the line. The number of commuters travelling to the periphery of Station 1 accounts for 29.93% of the total commuting population (Figure 6). It can be seen that the surrounding areas of the accessing station should provide more job opportunities, attracting a large number of passengers.
• Travelling for Shopping and Consuming
Among the passengers who have the needs of shopping and consuming, 78.38% of the passengers choose to finish shopping and consuming along the tram line. As can be seen from Figure 7, more than half of the passengers choose to go to Station 1 and 15.52% of the passengers go to Station 6 from Station 1 and 2. It is thus clear that the accessing station not only meets the working and accessing needs of the residents along the tram line, but also undertake the consuming and entertaining needs of most residents along the line.
• Travelling for Fitness and Recreation
In this research, the number of passengers who have the needs of fitness and recreation is relatively small (Figure 8). Most passengers travelling for fitness and recreation mainly start from Station 2, 5 and 6 to Station 1, 6 and 9. Station 9 is a special function station and Station 6 is a public service-oriented station, which are surrounded by public service facilities such as grassroots community centers, having certain attractions to passengers.
• Travelling for Other Purposes
As can be seen from Figure 9, passengers travelling for other purposes mainly go to Stations 1, most of whom come from Station 2, 5, 6, and 7. A few passengers go to Station 2.
(2) Summary of Travel Trajectory Analysis
There is a certain similarity between the original and destination stations of passengers for the same travel purpose. Commuters mainly come from Station 1~7, to whom Station 1, 10 and 12 have strong attraction. Stations 1, 6, and 12 have certain attraction to the passengers with shopping needs, especially Station 1 shows a strong appeal. There are few passengers travelling for fitness and recreation, who mainly go to Station 1 and 9.
  • The accessing station: The number of users far exceeds that of other types of stations, attracting more types of passengers to travel, and the surrounding land use facilities can basically meet more travel needs of residents along the tram line.
  • Residence-oriented stations: They are more attractive to passengers returning home. The passengers from residence-oriented stations mainly go to the accessing station and other function-oriented stations, showing a high demand for working and shopping.
  • The public service-oriented station: It shows certain attraction to passengers travelling for shopping and consumption. There is no lack of residents around the station to go to scientific research office-oriented stations and the accessing station to meet commuting or consuming demand.
  • Scientific research office-oriented stations: The passengers who are attracted by scientific research office-oriented stations have simple purposes, mainly for commuting to work, most of whom come from residence-oriented stations. The connection between scientific research office-oriented stations and the accessing station is relatively weak compared with other stations, which indicates that most of the passengers attracted by scientific research office-oriented stations are the residents who live along the line and are close to Chilin Hi-tech Innovation Park section.

5. The Characteristics of Land Use Around the Stations within the Range of the Psychological Threshold of Pedestrians’ Access to the Tram Stations

From the above analysis, it can be seen that passengers with various travel purposes will go to different original and destination stations, whose travel purposes are strongly affected by the type of destination stations. The type of station is mainly determined by the type of land use around the stations.
Therefore, based on the the psychological threshold of pedestrians’ access to the tram stations, this paper will define the effective influence range of the stations through calculation, classify the arrival and departure psychological time threshold of passengers arriving at each type of stations according to their travel purposes. According to the weighted average time threshold, the land use around the stations is divided into different time circles, and the related land use indexes are evaluated. On this basis, the coupling degree between the actual situation of land use within each circle and the psychological threshold of residents’ travel demand is analyzed.

5.1. Calculation of Stations’ Influence Range

As a medium volume rail transit, the tram has lower traffic volume and speed than conventional mass transit and light rail transit, whose empiric value of the influence on surrounding areas and the attraction region of conventional rail transit cannot be generalized. In this paper, Kishi’s Logit PSM (Price Sensitivity Measurement) is used to calculate the reasonable time and space threshold of pedestrians access to the tram along the line as the actual attraction range of the tram line 1 to the surrounding areas.

5.1.1. Calculation of Psychological Distance Threshold for Pedestrians Access to the Tram

(1) Kishi’s Logit PSM (KLP)
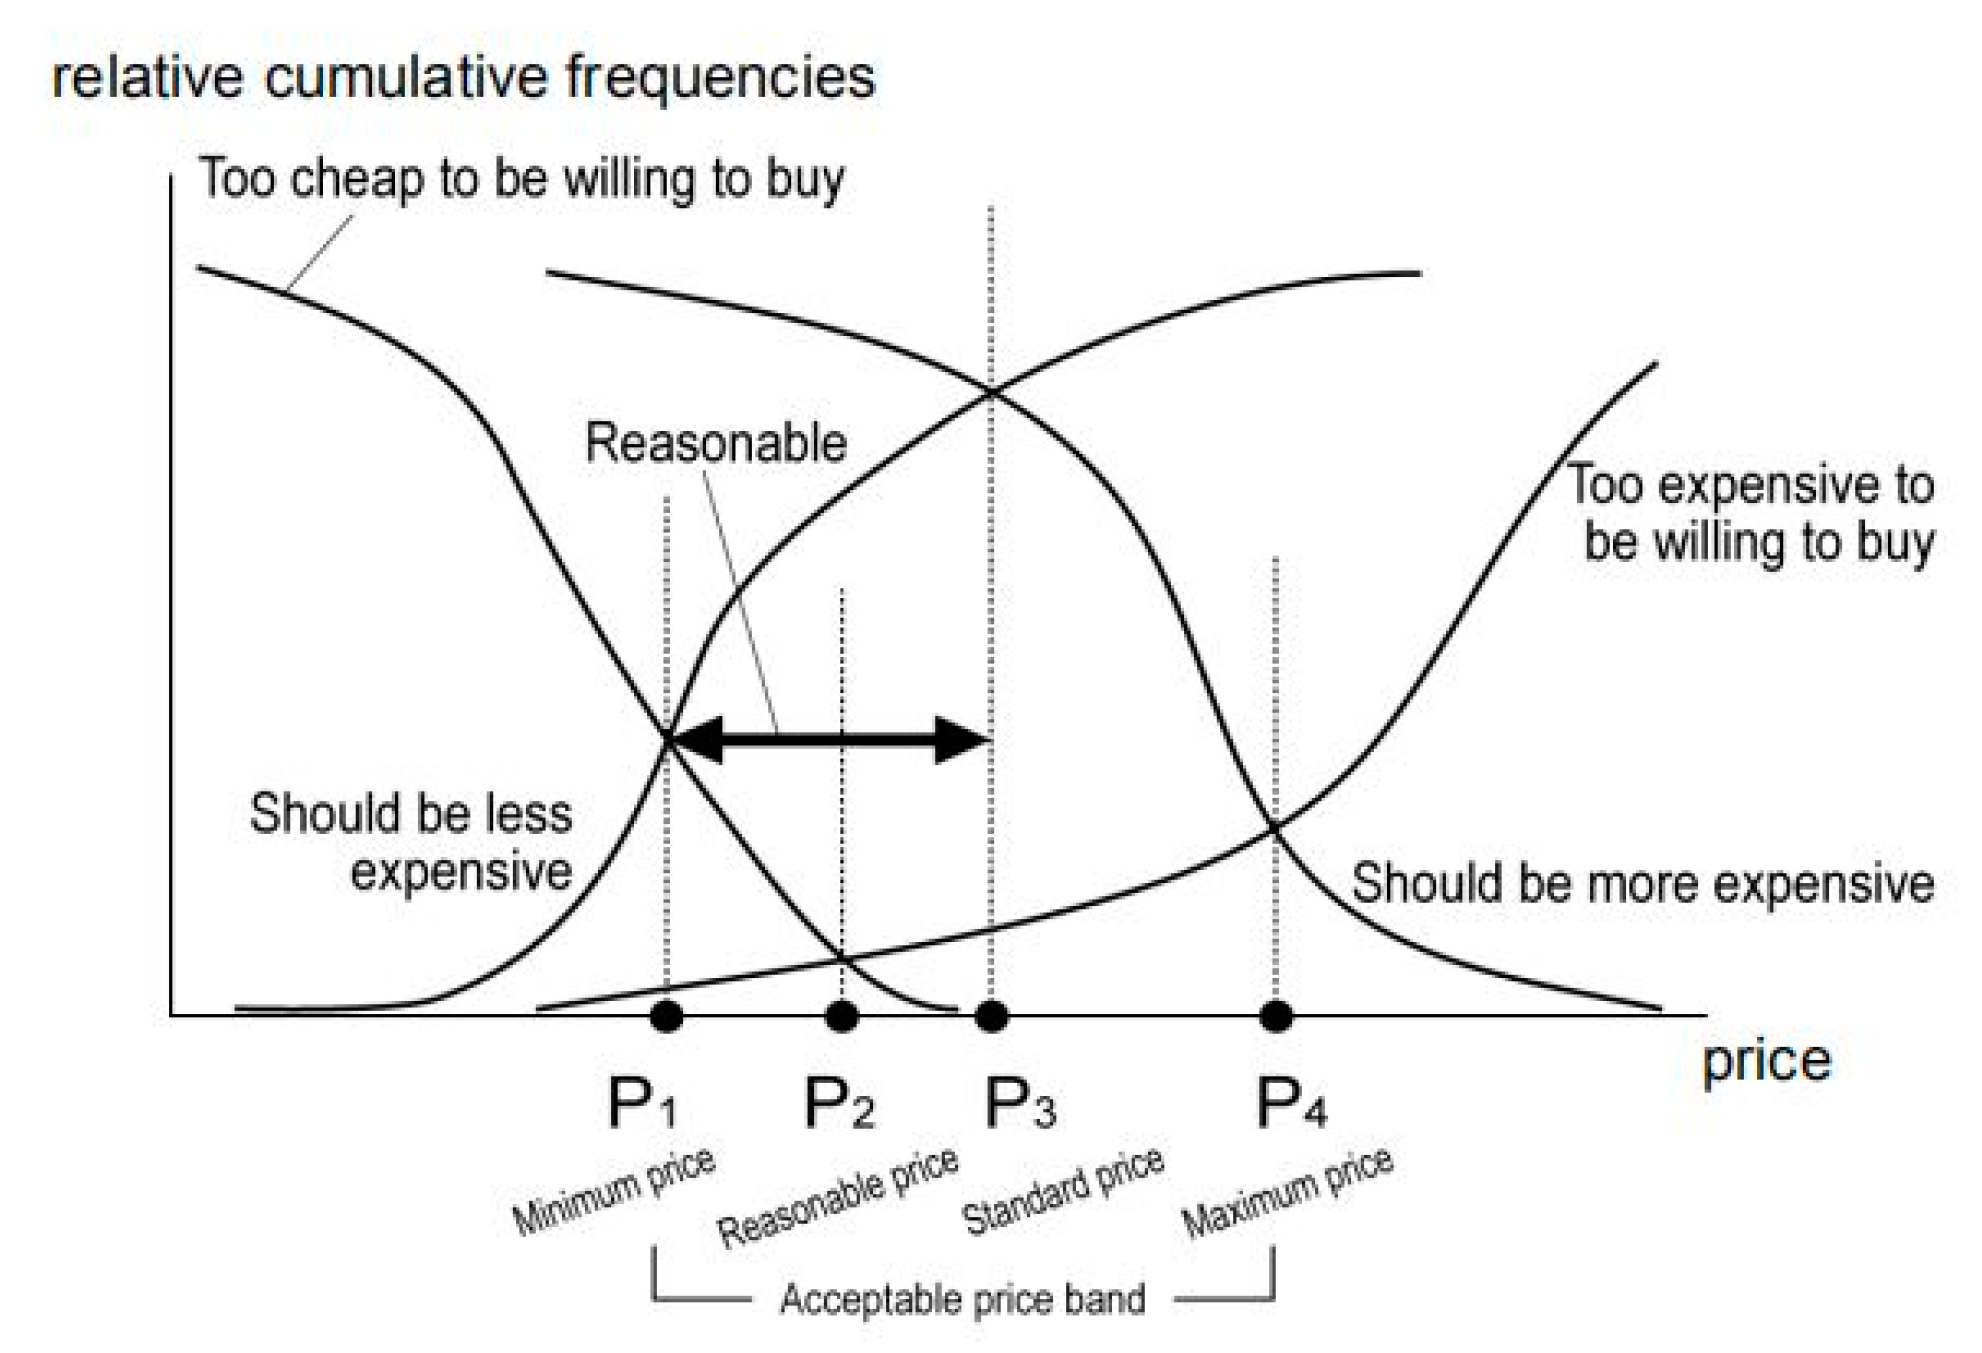
KLP comes from Price Sensitivity Measurement (PSM). The basic principle of PSM is to reasonably determine the commodity price based on consumers’ subjective perception of the commodity price. Respondents answered four questions that they thought: “cheap”, “expensive”, “too expensive to buy” and “too cheap to buy”. Calculate the frequency and the cumulative percentage of the frequency at different price points and establish the relevant cumulative frequency curve. The intersection point of the curves is the relevant price threshold point. The psychological price curve in the PSM model regressed by the disaggregate model is the KLP model (Figure 10) [26,27], as shown in Equations (1) and (2):
T i = 1 1 + exp F i ( x )
F i ( x ) = a x + b
Among them, Ti is the relevant cumulative frequency, i = 1, 2, 3, 4; Fi(x) is the price function: x is the price; a and b are parameters. T1, F1(x) represent “should be cheaper (no more expensive)”; T2, F2(x) represent “should be more expensive”; T3, F3(x) represent “too expensive to buy”; T4, F4(x) represent “too cheap to buy”.
Yan H et al. used the KLP model to calculate the psychological threshold of pedestrians’ and cyclists’ access to rail transit service [28]. He J et al. used the KLP model to quantify and evaluate the reasonable transfer distance in rail transit stations [29]. Qin H.M et al. used the KLP model to analyze the maximum transfer threshold that the passengers can accept to go to the park and ride facilities [30].
(2) Calculation of Passengers’ Psychological Distance Threshold for Taking the Tram
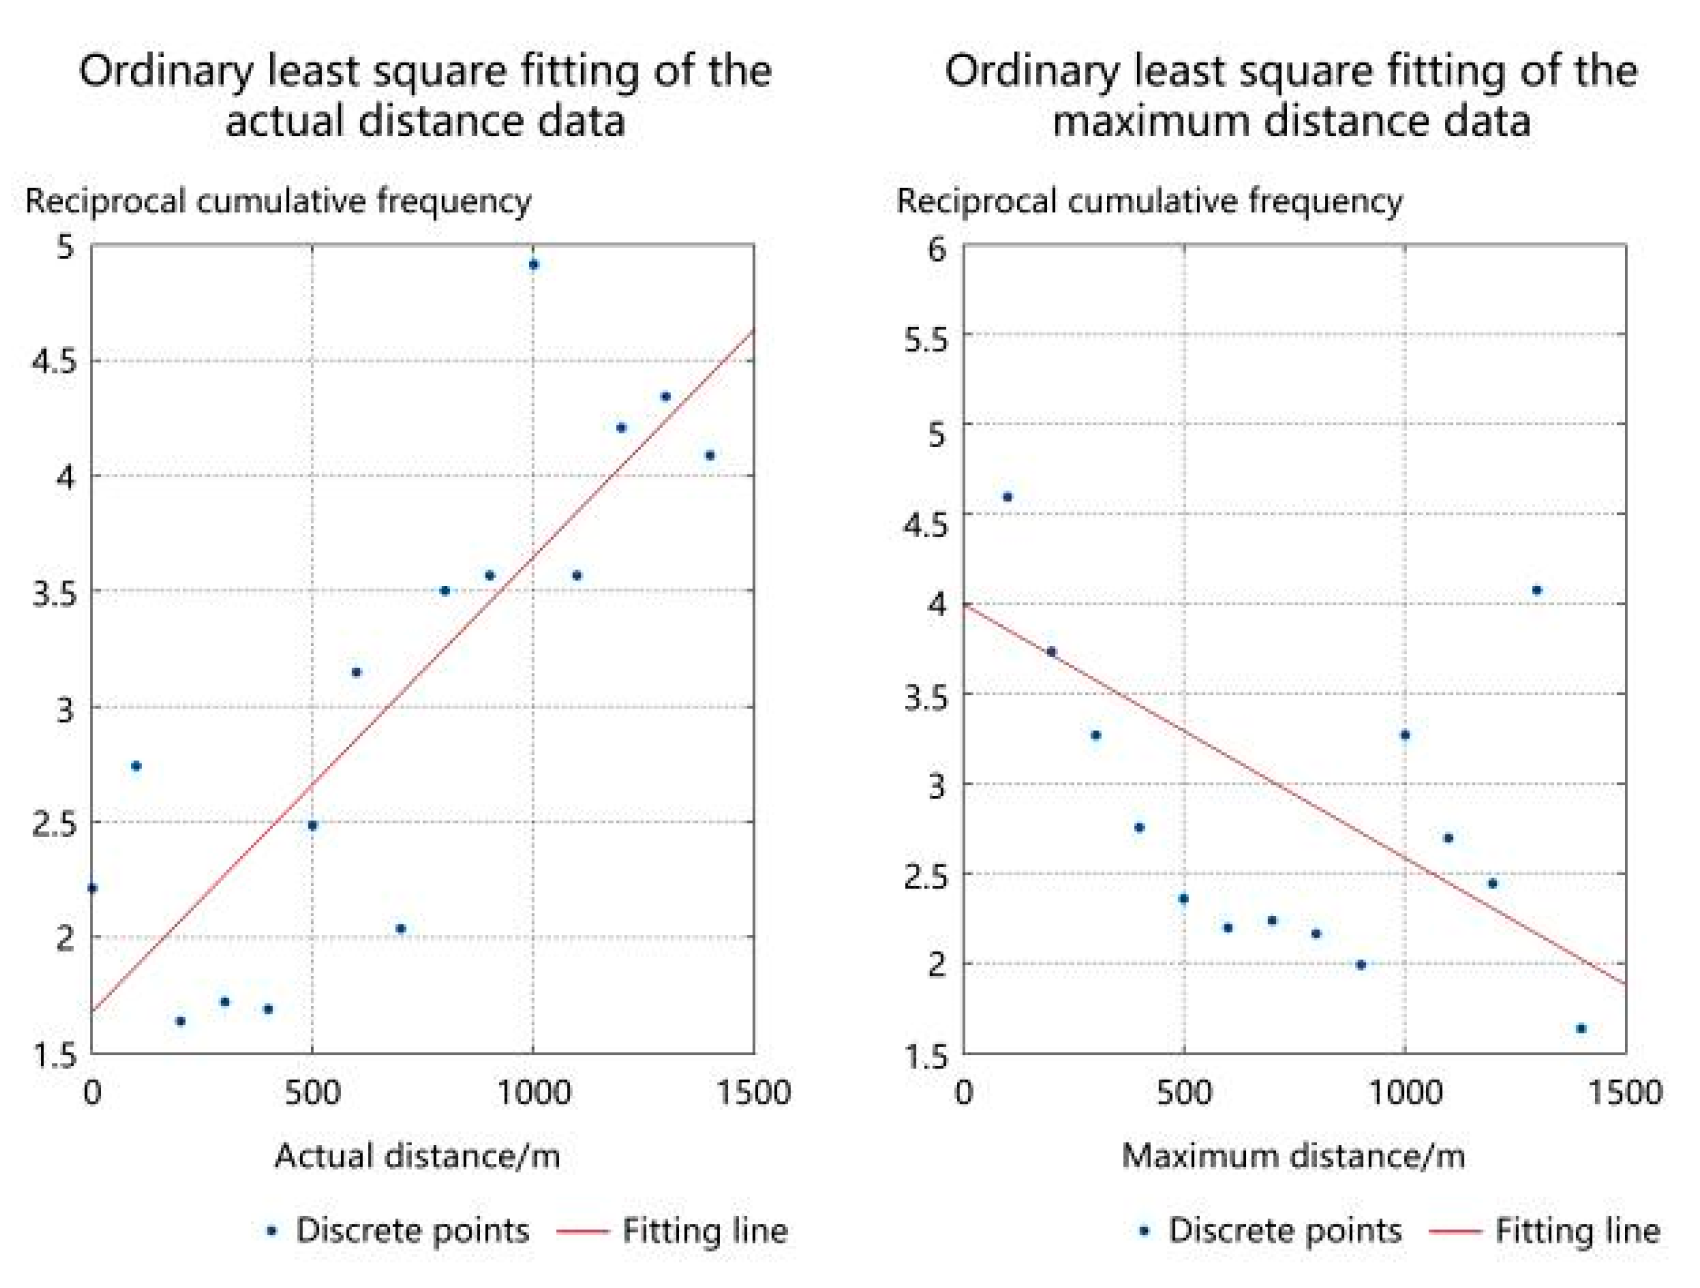
Based on the relevant researches of some scholars, this paper believes that the distance range that travelers can bear when access to the tram on foot is similar to consumers’ feelings on commodity prices. Therefore, the KLP model is used to quantitatively analyze the psychological threshold of pedestrians’ accessing distance.The author makes two distance-related cumulative frequency curves based on the actual pedestrians’ accessing distance (T1) of the respondents and the maximum pedestrians’ accessing distance (T2) psychologically acceptable to the respondents, and take the intersection of the two cumulative frequency curves as the upper limit of pedestrians’ accessing distance, so as to reflect the effective influence range of the stations under investigation. The questionnaire is valid when the actual pedestrians’ accessing distance is less than the maximum pedestrians’ accessing distance acceptable to the respondents psychologically.
Using Matlab7.0 and ordinary least square (OLS) method to calibrate the parameters of the equation, we can obtain a 1 = 0.0019 , b 1 = 1.6755 , a 2 = 0.0014 , b 1 = 3.997 , thus we can get two images of linear equations with one variable (Figure 11):
L 1 ( x ) = 0.0019 x + 1.6755
L 2 ( x ) = 0.0014 x + 3.997
The intersection point of the two cumulative frequency curves is 686 m, which means that the psychological distance threshold of pedestrians access to Chilin Tram Line 1 is 686 m (Figure 12). If the distance exceeds 686 m, the number of pedestrians will be significantly reduced or the accessing mode will be changed.

5.1.2. Calculation of the Actual Influence Range of Each Station

(1) Pedestrian Route Directness around Each Station
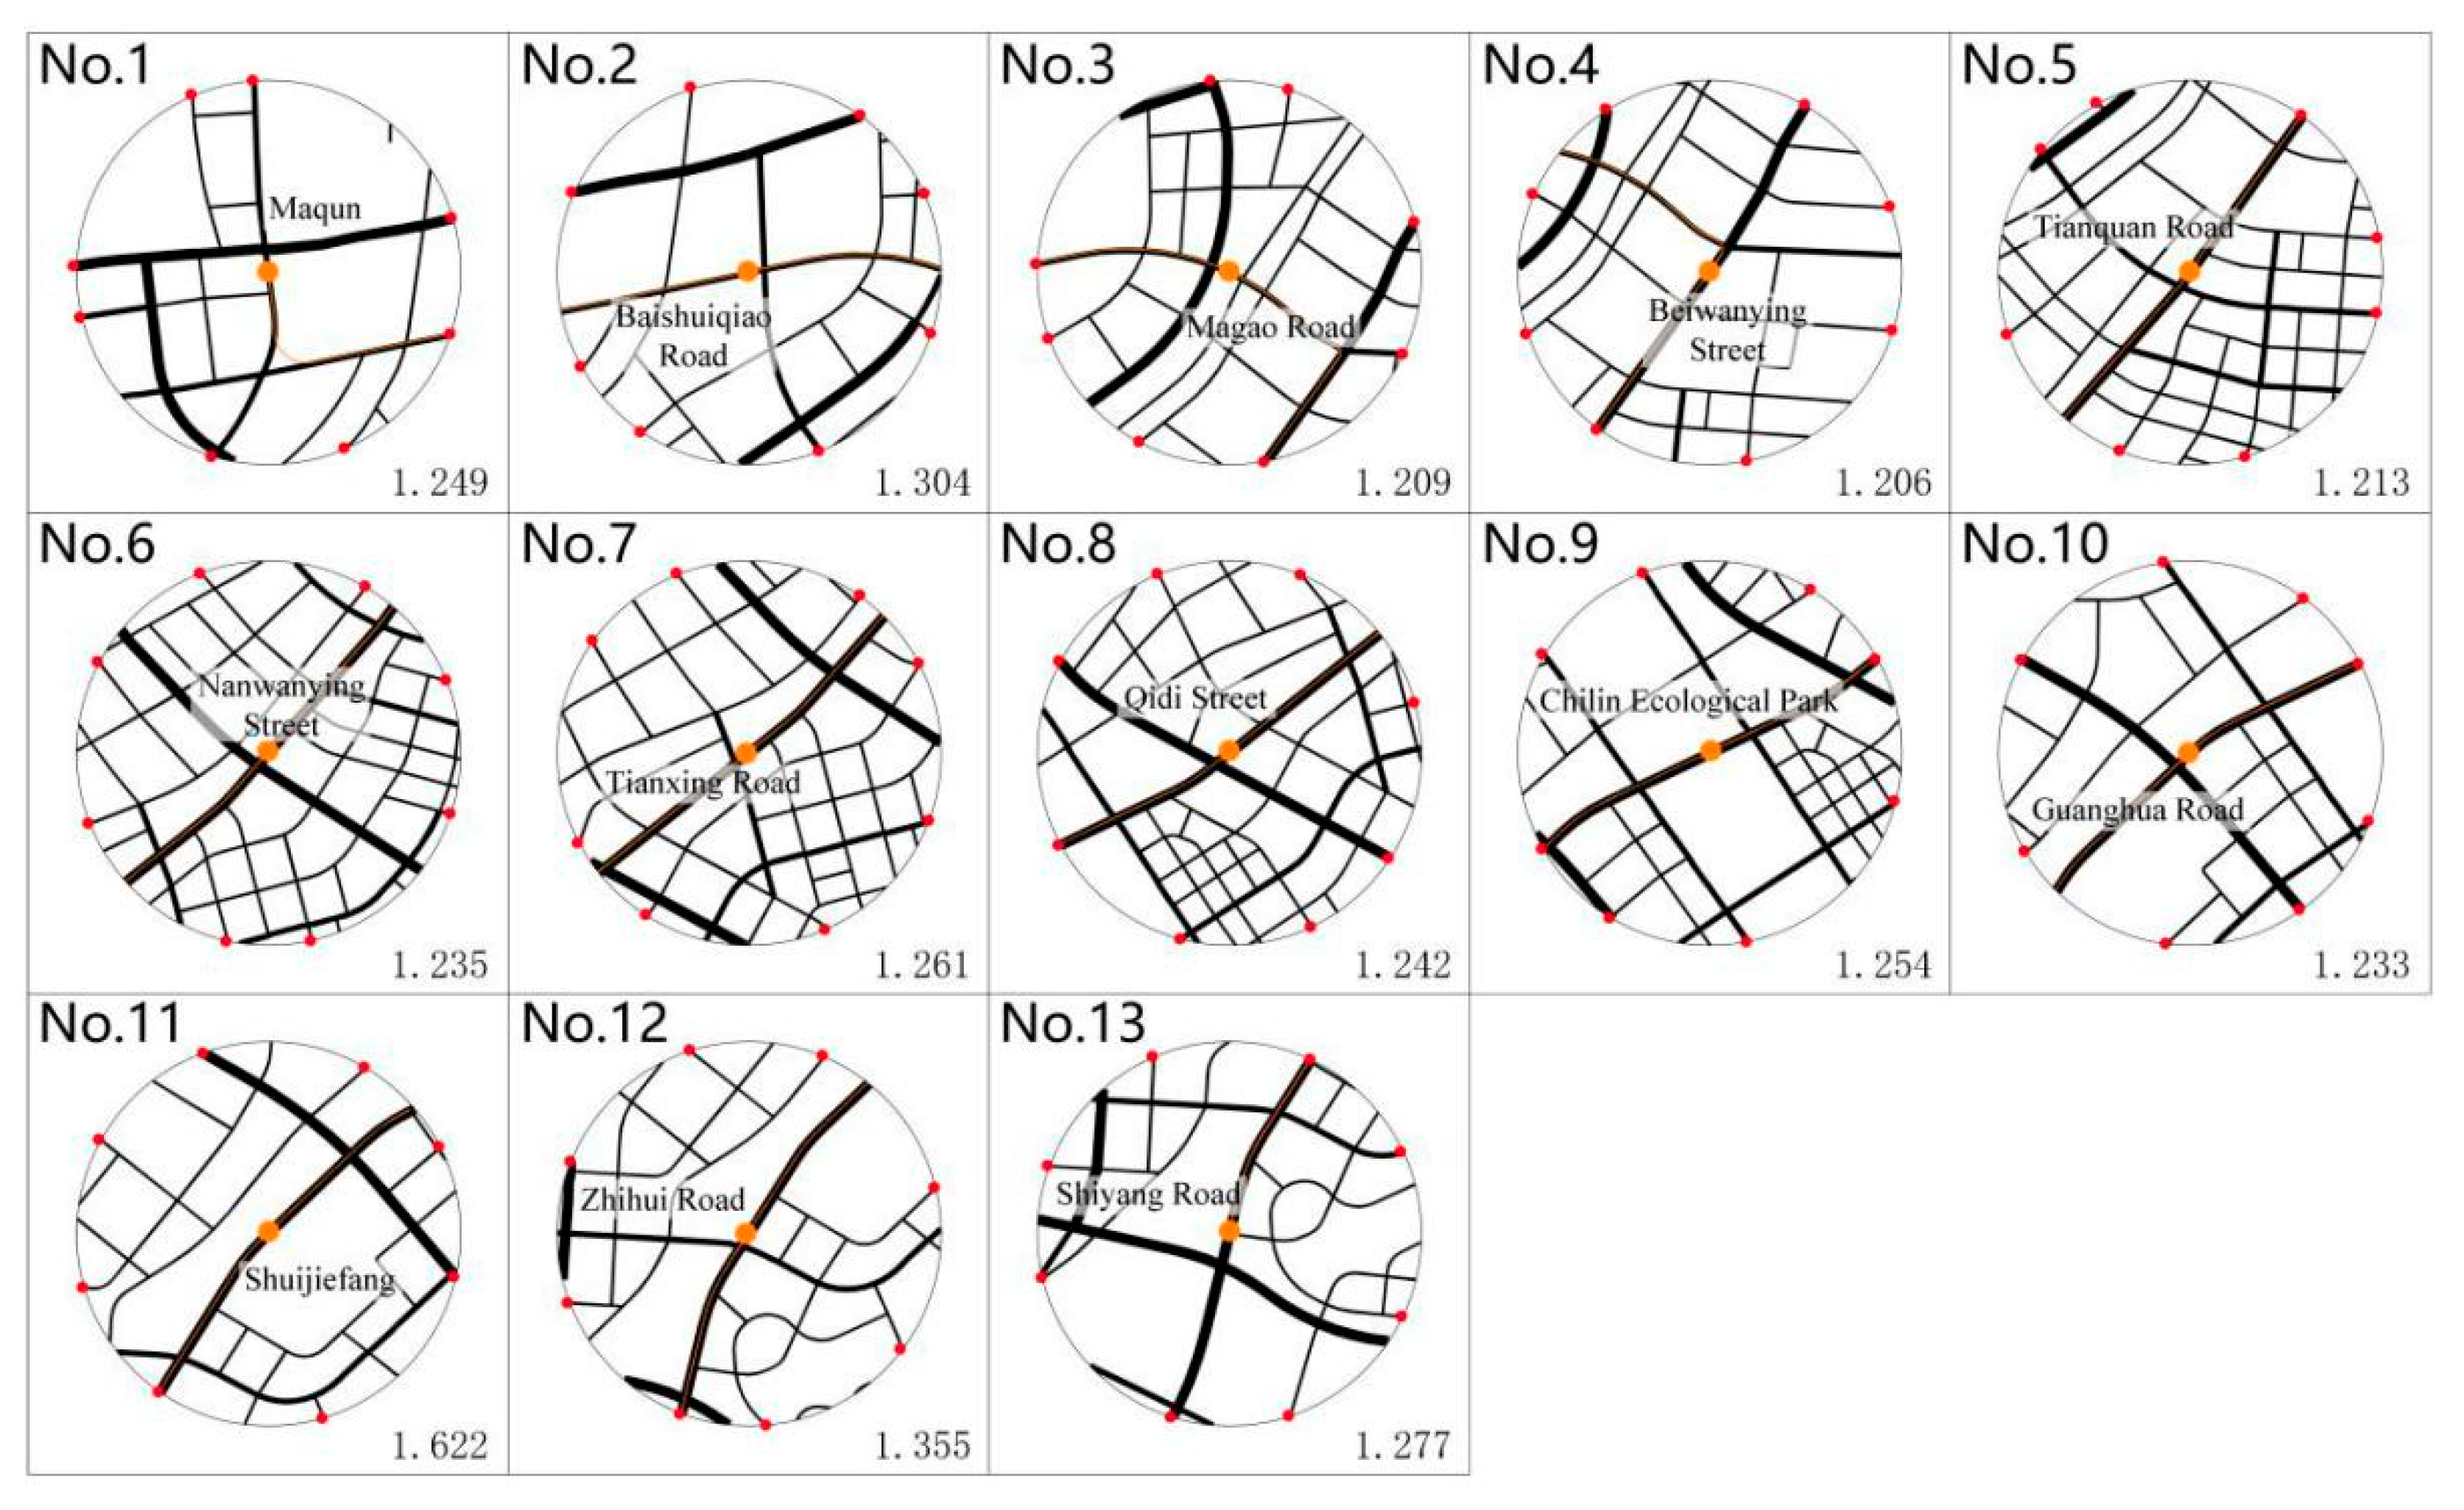
As shown in Figure 13, the author takes the tram station as the center and 800 m as the radius of the circular area to calculate the pedestrian route directness (PRD) of the road network around the station. In this paper, PRD is mainly calculated through Hess’s calculation method [31].
The PRD value of the lower section of the tram is 1.331, slightly higher than 1.24. Except the PRD value of Shuijiefang Station (No. 11) is 1.622, the PRD value of the other 12 stations is concentrated in the range of 1.2~1.4 without much fluctuation (Table 3).
(2) Calculation of the Time Threshold of the Influence Range for Each Station
According to the average adult walking speed of 75 m/min, the accessing time threshold=actual pedestrians’ accessing distance threshold/PRD÷75 m/min is calculated, which is the actual radiation scope of each tram station on the surrounding areas (Table 4).

5.2. Land Use Indexes Around Different Stations

According to the research method in this paper, the author selects the diversity index of land use, dominance index of land use and the degree of mixed land use as indexes to evaluate the situation of land use. The higher the value of the degree of mixed land use, the more balanced the distribution of various land functions and the higher the degree of mixed land use [32]. However, the concept of dominance index of land use [33] is opposite to the degree of mixed land use. The higher the value of dominance index of land use, the simpler the land use allocation of the street and the lower the degree of mixed land use (Table 5). The land use diversity can be expressed by Simpson’s diversity index [34].

5.2.1. The Land Use around the Stations in the Influence Range Based on the Time Threshold

(1) The Accessing Station: No. 1 Maqun Station
The index of land use diversity around the station is 0.69, the dominance index of land use is 0.69, and the degree of mixed land use is 0.68. The type of land use is acceptable with slightly uneven distribution, and the degree of mixed land use is relatively general compared with the stations along the line. The commerce & office mixed and commercial land which can meet the needs of commuting and shopping is mainly distributed in the 0–3.36 min circle, with a relatively high plot ratio which is more than 3. The plot ratio of 3.36–5.28 min circle attenuates to 2 and above, mainly for residential and commercial use, and the proportion of commerce & office mixed land use decreases sharply. The plot ratio of 5.28–7.32 min circle continues to decline to 1, mainly for residence and public service. The plot ratio shows obvious gradient field effect (Table 6).
(2) Residence-oriented Stations
I. Typical station: No. 2 Baishuiqiao Road Station
The diversity index of land use around the station is 0.64, the dominance index of land use is 0.6, and the degree of mixed land use is 0.69. The degree of mixed land use is rather ordinary compared with other stations along the line. The proportion of residential land use is the highest, mainly distributed in the circle of 0–5.03 min, and the proportion decreases beyond the circle of 5.03 min. Compared with the passengers travelling for commuting and consuming whose off-site threshold is 6.13 min, the commercial land is only distributed in the 0–4.5 min circle, which is within the passengers’ psychological threshold. The proportion of commerce & residence mixed land increases with the expansion of the circle, having the highest proportion within the 6.13–7.01 min circle. The plot ratio of each circle remained relatively stable between 1 and 1.3 (Table 7).
II. Typical Station: No. 5 Tianquan Road Station
The diversity index of land use around the station is 0.67, the dominance index of land use is 0.64, and the degree of mixed land use is 0.67. The degree of mixed land use is rather ordinary compared with other stations along the line. Among them, the total residential land areas account for the largest, reaching 41.87%, followed by the proportion of the land used for public service which is 15.29%, showing some advantages. The proportion of residential land increases steeply in the 5.5–7.54 min circle, stablizing at more than 45%. Commercial and commerce & office mixed lands are mainly distributed in the 0–4.4 min circle, basically accord with the psychological threshold of passengers who have the needs of leisure and recreation. The plot ratio of each circle is kept steady between 1.8 and 2.5, and the development intensity is relatively higher than that of the whole area along the tram (Table 8).
III. Summary of the Characteristics of Land Use around Residence-oriented Stations
Based on the analysis of land use around Station 2 and Station 5, it can be concluded that residence-oriented stations mainly attract commuters. Within the influence range of the stations, the land use property is rather single, which is dominated by residential land, reaching 40%, followed by the land used for public service. Commerce & office mixed and commerce & residence mixed land account for a relatively small proportion, but both of which are developed in medium or high intensity.
(3) The Public Service-oriented Station: No. 6 Nanwanying Street Station
The diversity index of land use around the station is 0.67, the dominance index of land use is 0.61, and the degree of mixed land use is 0.71. The degree of mixed land use is relatively better than other stations along the line. According to field survey and the reference to the controllable detailed planning, in addition to 32.72% of the residential land, the land mainly planned to be used for building schools, primary community center and the only medical institution along the line around the stations, which can assume the function of community-level public service, presenting certain advantages and attractive to the commuters. The plot ratio of the 0~3.24 min circle reaches 2.8, mainly distributing residential land and greenbelts and water areas. The public service land used for building educational facilities is mainly distributed in the 4.32~6.79 min circle, the proportion of residential land increases to over 30%, which basically accords with the passengers’ psychological threshold. The total plot rate around the stations is stablized at between 2 and 3, with moderate intensity development (Table 9).
(4) Scientific Research Office-Oriented Stations
I. Typical station: No. 10 Guanghua Road Station
The diversity index of land use around the station is 0.61. The dominance index of land use is 0.42 and the degree of mixed land use is 0.74. The distribution of all types of land use is uniform compared with other stations along the line. The proportion of residential land is 15.92%, which is much smaller than that of the stations in the Chilin residential areas, and the land is distributed in each circle. The proportion of the land used for scientific research and design which provides major job opportunities increases with the expansion of the circle. There is no commercial land distributed around the stations, and the commerce & office mixed land is mainly distributed in the 4.06–6.63 min circle, which can provide spaces for shopping and consuming. The plot ratio of the areas around the stations is basically between 1.5 and 2, and the total plot ratio decreases with the expansion of the circle (Table 10).
II. Typical station: No. 12 Zhihui Road Station
The diversity index of land use around the station is 0.66, the dominance index of land use is 0.6, and the degree of mixed land use is 0.69. The types of land use are slightly more than that of Guanghua Road Station. The degree of mixed land use is reasonable and the distribution of each type of land use is slightly uneven compared with other stations along the line. The land used for scientific research and design which provides major job opportunities increases as well as the plot ratio. The proportion of the land use increases with the expansion of the circle. There is no obvious distribution of commerce & office mixed land. The proportion of residential land further decreases, and the distribution of which can be found in each circle. The plot ratio around the station is between 1.5 and 2, showing no obvious distribution characteristics along with the circle (Table 11).
III. Summary of the Characteristics of Land Use around Scientific Research Office-Oriented Stations
The land is mainly used for scientific research and design, residence and commerce & office. The plot ratio is about 1.5–2, which is of low and middle development intensity. Commercial land use and river reach are the influence areas in the center of the stations, and the land-use intensity is thus affected. Going deeper into Chilin Hi-tech Innovation Park from Station 10 to Station 12, the proportion of the land used for scientific research and design gradually increases, while the proportion of residential land gradually decreases. There is no obvious distribution of public service land around the stations, commerce & office mixed and commerce & residence mixed land is mainly distributed beyond the circle of 0–4 min.

5.2.2. Analysis of the Plot Ratio of the Circle in the Stations without Gradient Field Effect

Generally, the gradient field effect of the plot ratio of land use around the station is essentially the potential benefit of land use which attenuates along with distance [35]. In this research, the plot ratio around some stations does not have an obvious gradient field effect. In this paper, the plot ratio of the main types of land use around these stations is compared with the circle change of total plot ratio. The special details are as follows (Figure 14).
• Rescidence-oritend Station
The change of the overall plot ratio of the areas around Baishuiqiao Road Station is consistent with that of residential land use.The change of the overall plot ratio of the areas around Tianquan Road Station is consistent with the potential land used for public services.
• Scientific Research Office-oriented Station
The change of the overall plot ratio of the areas around Zhihui Road Station is consistent with the land used for scientific research and design.
To sum up, the change of the plot ratio around the stations without obvious gradient field effect is greatly affected by the dominant and potential types of land use.

6. Results

6.1. Coupling Evaluation of Stations along the Line and Passengers’ Travel Demand

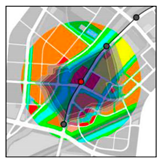
On the basis of preliminary analysis, the author evaluates and compares the mix degree and dominance degree of land use around the above 13 stations. According to the current situation of land use in the research area, when conducting classification, the major land use properties are divided into 6 categories: commercial, residential, public service, commerce & residence mixed, commerce & office mixed and scientific research design land use. This paper will conduct hierarchical comparison through the diversity index of land use in case of incomplete land use types in the calculation. As shown in Table 12, blue indicates a lack of one kind of land use facilities and red indicates a lack of two kinds of land use facilities.
As shown in Figure 15, the functional layout rule of land use around the stations along the tram line is obvious. The residence and public service land mainly distributed in Station 1 to 7 along the line. The overall trend is that, except the public service-oriented stations (Station 3 and 6), the land used for public service from Station 2 to 7 increases with the decrease of residential land. The entire development is of low and medium intensity, and the type of stations transit from residence-oriented stations to public service-oriented stations. The land between Station 8 and Station 9 is the central green belt of the new town, mainly distributed commerce & office mixed land with high volume ratio and park green land. It enters into the core area of scientific research from Station 10 to 13, except the residence-oriented stations (Station 11), the proportion of residential land along the line reduces obviously, while the land used for scientific research, design and the commerce & office mixed land begin to increase with low development intensity.
From the above analysis, it can be seen that the main problems existing in the coupling between different station types along the line and the travel demand of passengers are as follows:
(a)
Around the accessing station, the functional land is complete, the degree of mixed land use is relatively general and the dominance index is relatively high. The type of land use is acceptable with slightly uneven distribution. In addition to the transferring function, the accessing station undertakes the function of meeting most of the travel needs of residents along the line with high passenger flow intensity. especially that the middle- and low-income families and tenants along the line have a high demand for the subway.
(b)
No. 9 Chilin Ecological Park Station is less attractive to the residents along the line and fails to fully play its expected role. The author argues that the land around the stations is mainly used for building a large-scale park green space, and it is rather difficult to attract the residents who live along the tram line to use it for the moment, which affects the passenger flow of Station 9. It is essential to improve the diversity of facilities, landscape settings and the attractiveness of services. This research believes that the group development of the land between and around the two stations can be developed into a center which is characterized by commerce, culture and tourism within the new town, and strengthen the attractiveness of trams to residents with the needs of consumption and recreation along the line.
(c)
There is a lack of commercial facilities and stations along the line. The result shows that, in addition to working and commuting, the purpose of residents along the line to take the tram is to go shopping and consuming, but there is no obvious facilities and stations of commerical type through the classification of stations. To a certain extent, it reflects the lack of commercial facilities around the tram line in the current situation, which is difficult to gather consumer flow. The residents’ travelling for consuming mainly depends on the accessing station or other types of stations with commercial land and facilities.

6.2. Coupling Evaluation of Land Use and Psychological Threshold of the Areas around Typical Stations

6.2.1. The Accessing Station

Affected by subway stations, the plot ratio presents a certain degree of gradient field effect, which is attractive to the passengers with all kinds of travel purposes along the line, especially to commuters and shoppers. Combined with the passengers’ psychological time threshold, there is a relatively lack of public green space and public service land within the circle of 0–3.5 min to meet passengers’ needs of leisure and recreation. The circle of 3.5–5.5 min lacks commerce & office mixed land use to meet passengers’ needs of working and commuting. The residential land can be distributed in the circle of 5.5–7.5 min appropriately, so as to couple the land use with the threshold of passengers’ psychological time threshold.

6.2.2. Residence-Oriented Stations

The residence-oriented stations obviously attract commuters, and the number of passengers having other travel purposes is rather small. Residents show complementary demand for the stations with other functions. The threshold of travelling for leisure and recreation is lower than that of other travel demand psychological threshold (Table 7 and Table 8), which shows residents’ demand for the land use services and facilities with the function of leisure and fitness. This paper believes that the land used for public service which meets the needs of leisure and recreation is mainly distributed in the 3.5 min circle. It is recommended to arrange a small number of commercial facilities according to the psychological time threshold of the main attracting population of the residence-oriented stations. The surrounding areas of residence-oriented stations are developed in low intensity, and there is no significant changes of the plot ratio.

6.2.3. The Public Service-Oriented Station

The public service-oriented stations are attractive to the passengers returning home because of the high proportion of residential land and the relatively high development intensity in the surrounding areas affected by the stations. As the peripheral public service and medical facilities are still under construction and are less attractive to the people who have the needs of leisure and recreation and receive public medical services, passengers need to go to the facilities beyond the effective influence range of the stations to meet their corresponding needs. Within the circle of 0~3.5 min, since the waterfront landscape of Yunlianghe River is included, the land use efficiency in the influence range of the station center is not high. In this paper, it is believed that some street-side greenbelts can be opened as public communication spaces and attract the residents who live around the nearby stations. The facilities that can satisfy the passengers’ needs of shopping and consuming should be increased in the circle of 3~4.5 min circle.

6.2.4. Scientific Research Office-Oriented Stations

The land use around the scientific research office-oriented stations mainly attracts commuters, but its less attractive to shoppers and consumers. There is no obvious attraction to the passengers travelling for leisure and recreation. The effective accessibility is limited due to the waterfront landscape of Yunliang River reach in the influence range of the station center. It is suggested to appropriately improve the development intensity of the land used for scientific research and office that is dominant in land use within the circle of 5.5~6.5 min in combination with the commuters’ off-site threshold.

7. Conclusions

This paper is aimed at evaluating the land use situation within the influence range along the tram line and analyzing whether it is coupled with passengers’ travel demand. By investigating the data of passengers’ travel behaviors, calculating the passenger flow intensity and analyzing the relationship between station types and passengers’ travel purposes, this research studies the relevance between the land use properties and residents’ travel purposes around the stations. It is found that many stations (No 8, No 9) fail to give full play to their functions and efficiency, and it’s necessary to further improve their attractiveness. It is suggested that a variety of functions should be arranged along the line within 35 min’s running time of the tram. In order to further verify the coupling degree of the above two aspects, the psychological distance threshold of pedestrians’ access to tram stations is taken as the basis for dividing the influence range of the tram. Furthermore, the coupling degree between actual land use and passengers’ travel demand within each circle is evaluated and studied according to the time circle of passengers’ psychological threshold regarding different types of travel demand.
In this paper, according to the calculation, we can obtain that the psychological distance threshold of pedestrians’ access to tram stations is 686 m, and the circle of the effective influence range of the tram on the land use along the line is thus determined to be about 7.5 min. Optimizing the land use layout and development intensity within the range can more effectively lead passengers along the line to take trams.
In the construction of the new town, there are many stations with various types, among which the stations with the accessing function are showing rather obvious gradient field effect and have a high passenger flow intensity, which are the major stations and should be combined with subway stations for the functional development with greater intensity.
The park green stations distributed along the tram line of the new town are more targeted at serving the residents of the new town. It is difficult to attract residents around the stations to travel for daily recreation in terms of time accessibility, so as to better attract and serve for the crowds that travel on the weekends.
In this study, the psychological threshold of residents’ travel accessibility is investigated in different tram stations, which can be used as a reference for exploring the coupling degree between land use development and residents’ needs. This paper takes the psychology time threshold of passengers’ demand as the basis for the land use layout and optimization around each station, presenting the following rules as a whole:
(a)
The accessing station: working and commuting threshold>homeward journey threshold>consuming threshold>leisure and recreation threshold
(b)
Residence-oriented stations: working and commuting threshold≈consuming threshold> leisure and recreation threshold
(c)
The public service-oriented station: leisure and recreation threshold>homeward journey threshold>consuming threshold>working and commuting threshold
(d)
Scientific research office-oriented stations: homeward journey threshold>working and commuting threshold>consuming threshold decrease in turn.
The results show that there is uneven distribution of passenger flow along the tram and the pressure of passenger flow in some stations is relatively high. According to types of the function of each station, considering the travel purpose of the main crowd attracted by which and satisfying the travel demand of the passengers within the appropriate threshold, the attraction of some stations can be enhanced and the distribution of passenger flow along the line will be balanced.
Author Contributions

Y.Z. designed the analytical framework and revised the paper. C.Q. co-wrote the paper and revised the paper. H.X. constructed the model, analyzed the data and co-wrote the paper. J.X. used GIS to calculate relevant data. Z.W. collated the references, did translation and proofreading. Q.F. helped to draw relevant figures and tables. All authors read and approved the final manuscript.

Funding

This study was supported by National Natural Science Foundation of China (No. 51578282 and No. 51508265); Foundation of the “333 High-Level Talents” of Jiangsu Province of China (No. BRA2016417); Science and Technology Project of Ministry of Housing and Urban-Rural Development of China (2016-K2-027); Postgraduate Research & Practice Innovation Program of Jiangsu Province of China (No. KYCX18_1097)

Conflicts of Interest

The authors declare no conflict of interest.

References

  1. Zhang, X.Y.; Li, G.W.; Zeng, Y. New City Development Model and Trajectory Around Great Cities in China. Planners 2011, 27, 93–98. [Google Scholar]
  2. Zhang, X.F.; Wang, Y.; Chen, G.H.; Lu, J. Study on Planning and Evaluation of Tramway Network in Comprehensive New Town. Highw. Transp. Technol. 2015, 5, 265–267. [Google Scholar]
  3. Xu, C.Y. Research on the Adaptability of Modern Tram. Urban Rapid Rail Transit 2013, 26, 112–115. [Google Scholar]
  4. Patrick, M.C. Seven Rules for Sustainable Communities: Design Strategies for the Post-Carbon World; Island Press: Washington, DC, USA, 2010. [Google Scholar]
  5. Svensson, T.; Nilsson, J. A Tramway Line Extension in Sweden: Integrated Town and Traffic Planning in Local Practice; Swedish National Road and Transport Research Institute: Linköping, Sweden, 2004. [Google Scholar]
  6. Wei, C.; Gu, B.N. The Typical Modern Tram Systems in Europe. Urban Mass Transit 2008, 11, 11–14. [Google Scholar]
  7. Ewing, R.H. Pedestrian- and Transit-Friendly Design. Available online: https://scholarsbank.uoregon.edu/xmlui/bitstream/handle/1794/10317/TE279.5_E9_1996.pdf;sequen (accessed on 2 April 2019).
  8. Martínez, F.J. Access: The transport-land use economic link. Transp. Res. Part B Methodol. 1995, 29, 457–470. [Google Scholar] [CrossRef]
  9. Bristow, A.L.; Tight, M.; Pridmore, A.; May, A.D. Developing pathways to low carbon land-based passenger transport in Great Britain by 2050. Energy Policy 2008, 36, 3427–3435. [Google Scholar] [CrossRef] [Green Version]
  10. Cervero, R. Planned Communities, Self-containment and Commuting: A Cross-national Perspective. Urban Stud. 1995, 32, 1135–1161. [Google Scholar] [CrossRef]
  11. Levinson, D.; Kumar, A. Density and the Journey to Work. Growth Chang. 2010, 28, 147–172. [Google Scholar] [CrossRef]
  12. Schwanen, T.; Dijst, M.J.; Dieleman, F.M. Policies for Urban Form and Their Impact on Travel: The Netherlands Experience. Urban Stud. 2004, 41, 579–603. [Google Scholar] [CrossRef]
  13. Jiang, Y.H.; Zhen, F. Evaluation of the Travel Quality of Urban Residents—A Case Study on Qingyuan. Urban Stud. 2010, 17, 47–55. [Google Scholar]
  14. Shen, Q. Spatial technologies, accessibility, and the social construction of urban space. Comput. Environ. Urban Syst. 1998, 22, 447–464. [Google Scholar] [CrossRef]
  15. Pan, H.X.; Tang, Y.; Wu, J.Y.; Lu, Y.; Zhang, Y.F. Spatial Planning Strategy for “Low Carbon Cities” in China. Urban Plan. Forum 2008, 6, 57–64. [Google Scholar]
  16. Cervero, R. Rail Transit and Joint Development: Land Market Impacts in Washington, D.C. and Atlanta. J. Am. Plan. Assoc. 1994, 60, 83–94. [Google Scholar] [CrossRef]
  17. Mohammad, S.I.; Graham, D.J.; Melo, P.C.; Anderson, R.J. A meta-analysis of the impact of rail projects on land and property values. Transp. Res. Part A Policy Pract. 2013, 50, 158–170. [Google Scholar] [CrossRef]
  18. Polom, M.; Tarkowski, M.; Puzdrakiewicz, K. Urban Transformation in the Context of Rail Transport Development: The Case of a Newly Built Railway Line in Gdańsk (Poland). J. Adv. Transp. 2018, 2018, 1218041. [Google Scholar] [CrossRef]
  19. Babalik-Sutcliffe, E. Urban rail systems: Analysis of the factors behind success. Transp. Rev. 2002, 22, 415–447. [Google Scholar] [CrossRef]
  20. Cervero, R.; Gorham, R. Commuting in Transit Versus Automobile Neighborhoods. J. Am. Plan. Assoc. 1995, 61, 210–225. [Google Scholar] [CrossRef]
  21. Cervero, R.; Kockelman, K. Travel Demand and the 3Ds: Density, Diversity, and Design. Transp. Res. Part D Trans. Environ. 1997, 2, 199–219. [Google Scholar] [CrossRef]
  22. Zhang, L.; Levinson, D.M. Determinants of Route Choice and Value of Traveler Information. Work. Pap. 2006, 44, 81–92. [Google Scholar] [CrossRef]
  23. Ewing, R.H.; Cervero, R. Travel and the Built Environment: A Synthesis. Transp. Res. Record J. Transp. Res. Board 2001, 17, 87–114. [Google Scholar] [CrossRef]
  24. Ewing, R.H.; Cervero, R. Travel and the Built Environment: A Meta-Analysis. J. Am. Plan. Assoc. 2010, 76, 265–294. [Google Scholar] [CrossRef]
  25. Yao, E.J.; Li, B.B.; Liu, S.S.; Zhang, Y. Forecast of Passenger Flow Distribution among Urban Rail Stations Considering the Land-use Matching Degree. J. Transp. Syst. Eng. Inf. Technol. 2015, 15, 107–113. [Google Scholar]
  26. Kishi, K.; Uchida, K.; Satoh, K. Price Sensitivity of Airfare from the Viewpoint of Passengers. J. Infrastruct. Plan. 1999, 16, 187–194. [Google Scholar] [CrossRef]
  27. Kishi, K.; Hino, S.; Satoh, K. Location Planning of Elevators at Subway Stations Considering Transfer Resistances Based on Passengers’ Physical and Conscious Resistance. J. East. Asia Society Transp. Studies 2003, 5, 3255. [Google Scholar]
  28. Yan, H.; Yang, R.R.; Xiong, W.; Liu, T.; Chen, N. Critical Accessing Time and Distance for Pedestrian and Cyclists to Urban Rail Transit. Urban Trans. China 2013, 11, 83–90. [Google Scholar]
  29. Qin, H.M.; Guan, H.Z.; Ao, X.L.; Liu, Y. Park and Ride Survey Analysis. Urban Trans. China 2012, 10, 80–83. [Google Scholar]
  30. He, J.; Liu, Z.; Sun, Y.W. Transfer Convenience Analysis Based on Passengers’ Physical and Psychological Impedance. J. Tongji Univ. (Natl. Sci.) 2010, 38, 92–97. [Google Scholar]
  31. Hess, P. Measures of connectivity. Places 1997, 11, 58–65. [Google Scholar]
  32. Dang, Y.X.; Dong, G.P.; Yu, J.H.; Zhang, W.Z.; Chen, L. Impact of land-use mixed degree on resident’s home-work separation in Beijing. Acta Geogr. Sin. 2015, 6, 919–930. [Google Scholar]
  33. Wu, J.G. Landscape Ecology Pattern, Process, Scale and Hierarchy; Higher Education Press: Beijing, China, 2007. [Google Scholar]
  34. Wang, X.M.; Wang, C.Y.; Zhan, Y.L.; Liu, Z. A Factor Analysis on Landscape Structure Metrics with Large Scale. Geogr. Geo-Inf. Sci. 2006, 22, 17–21. [Google Scholar]
  35. Zong, Y.G. The corridor effects in urban ecological landscape planning—A case study on Beijing. Acta Ecol. Sin. 1999, 19, 145–150. [Google Scholar]
Figure 1. Road environment along Nanjing Chilin Tram 1. (a) Road environment around No.4 Beiwanying Street station; (b) Road environment around No.8 Qidi Street station; (c) Road environment around No11. Shujiefang station; (d) Road environment around No13. Shiyang Road station.
Sustainability 11 02034 g001
Figure 2. The location of Nanjing Chilin Hi-tech Innovation Park.
Sustainability 11 02034 g002
Figure 3. The research area and the station numbers.
Sustainability 11 02034 g003
Figure 4. Passenger flow intensity between different types of stations.
Sustainability 11 02034 g004
Figure 5. Transport mode preference.
Sustainability 11 02034 g005
Figure 6. OD trajectory analysis of passengers for working and studying.
Sustainability 11 02034 g006
Figure 7. OD trajectory analysis of passengers for shopping and consuming.
Sustainability 11 02034 g007
Figure 8. OD trajectory analysis of passengers for fitness and recreation.
Sustainability 11 02034 g008
Figure 9. OD trajectory analysis of passengers for other purposes.
Sustainability 11 02034 g009
Figure 10. KLP reference price.
Sustainability 11 02034 g010
Figure 11. Two kinds of distance scatter fitting lines.
Sustainability 11 02034 g011
Figure 12. Two kinds of distance fitting cumulative frequency curves.
Sustainability 11 02034 g012
Figure 13. PRD of 800 m circle around each station.
Sustainability 11 02034 g013
Figure 14. Comparisons between total plot ratio and main types of land use in each circle.
Sustainability 11 02034 g014
Figure 15. Layout rule of the land use around the stations along the line.
Sustainability 11 02034 g015
Table 1. Classification of Chilin Tram Line 1 Stations.
Stations TypesQuantityStation Name
Accessing station1No1. Maqun
Function-oriented stationsResidence5No 2. Baishuiqiao Road; No 4. Beiwanying Street; No 5. Tianquan Road; No 7. Tianxing Road; No 13. Shuijiefang
Public service2No 3. Magao Road; No 6. Nanwanying Street
Scientific research office2No 10. Guanghua Road; No 12. Zhihui Road
Group development stations2No 8. Qidi Street; No 13. Shiyang Road
Special function station1No 9. Chilin Ecological Park
Table 2. Passengers’ travel demand.
Passenger Travel DemandClassification and Proportion
Social attributesAgeClassification≤18 years old19–30 years old30–45 years old45–60 years old≥60 years old
Quantity16164692416
Proportion5.54%56.75%23.88%8.30%5.54%
SexClassificationMaleFemale
Quantity151138
Proportion52.25%47.83%
Educational backgroundClassificationJunior high school and belowHigh schoolJunior college or undergraduateMaster or above
Quantity164818441
Proportion5.54%16.61%63.67%14.19%
Dwelling stateClassificationSettle in NanjingIndependent rental housingRent sharingOthers
Quantity189334720
Proportion65.40%11.42%16.26%6.92%
Number of cars owned by familiesClassification0 vehicle1 vehicle2 vehicles≥3 vehicles
Quantity109145277
Proportion37.83%50.33%9.33%2.50%
Travel characteristicsTravel purposeClassificationworking and studyingshopping and consumingfitness and recreationOther purposes
Quantity157743028
Proportion54.33%25.61%10.38%9.69%
Time consumption of one-way travelClassification≤20 min20–40 min40–60 min≥60 min
Quantity861234634
Proportion29.76%42.56%15.92%11.76%
Table 3. Calculation of road network indexes around each station.
NumberStationsPRDPRD
Each SectionOverall
Chilin residential section1Maqun1.2491.241.282
2Baishuiqiao Road1.304
3Magao Road1.209
4Beiwanying Street1.206
5Tianquan Road1.213
6Nanwanying Street1.235
7Tianxing Road1.261
Chilin hi-tech innovation park section8Qidi Street1.2421.331
9Chilin Ecological Park1.254
10Guanghua Road1.233
11Shuijiefang1.622
12Zhihui Road1.355
13Shiyang Road1.277
Table 4. The actual radiation scope of each tram station.
NumberStationsPRDAccessing Time Threshold (min)
Chilin residential section1Maqun1.2497.323
2Baishuiqiao Road1.3047.014
3Magao Road1.2097.565
4Beiwanying Street1.2067.584
5Tianquan Road1.2137.541
6Nanwanying Street1.2357.406
7Tianxing Road1.2617.254
Chilin hi-tech innovation park section8Qidi Street1.2427.364
9Chilin Ecological Park1.2547.294
10Guanghua Road1.2337.418
11Shuijiefang1.6225.639
12Zhihui Road1.3556.75
13Shiyang Road1.2777.163
Table 5. The land use related indicators.
Land UseEquationsNotes
The degree of mixed land use L a n d u s e m i x i = K = 1 K P k , i ln ( p k , i ) ln ( K , i ) K represents the number of land use types in street i; P k , i represents the area ratio of the K-type land use in street i.
Dominance index of land use D = H m a x H = ln ( m ) + k = 1 m P k ln ( P k ) D represents dominance index of land use; H represents the land diversity index of the station; P k is the proportion of the area occupied by the K-type land; m represents the number of species for land use categories in the area.
Table 6. Accessing time threshold and land use indexes around No.1 Maqun station.
MaqunTime Threshold (min)Working & StudyingShopping & ConsumingFitness & RecreationOther Purposes Sustainability 11 02034 i001
5.284.33.364.16
Return JourneySettled Passengers5.34
Tenant Passengers6.65
Totality6.52
The Influence Range7.32
Accessibility (min)Index AttributeCommercialResidentialMunicipal FacilitiesPublic ServiceGreenland & WatersSpecialCommerce & ResidenceCommerce & OfficePublic TransportRoadAccessible Area (m2)Total Plot Ratio
0–3.36Plot ratio3.602.260.000.000.000.000.004.800.000.00150743.713.39
Percentage (%)8.70%21.41%0.00%0.00%20.20%0.00%0.00%15.97%0.00%33.72%
3.36–4.16Plot ratio3.602.190.002.000.000.000.004.800.000.0084614.712.67
Percentage (%)9.80%37.11%0.00%0.62%20.43%0.00%0.00%4.19%0.00%27.85%
4.16–4.30Plot ratio3.602.140.002.000.000.000.004.800.000.0017254.082.39
Percentage (%)5.53%36.62%0.00%2.96%23.94%0.00%0.29%1.49%0.00%29.17%
4.30–5.28Plot ratio3.602.010.001.960.000.000.004.800.000.00143388.622.03
Percentage (%)1.80%36.90%0.00%5.83%21.25%0.00%4.52%0.34%0.00%29.35%
5.28–6.52Plot ratio0.001.781.501.610.000.001.500.000.000.00249288.341.71
Percentage (%)0.00%32.01%0.54%9.05%27.49%0.00%5.77%0.00%0.04%25.10%
6.52–7.32Plot ratio0.801.601.251.470.000.001.501.200.000.00224837.721.49
Percentage (%)0.11%28.66%1.48%10.63%32.19%0.00%2.19%0.17%1.71%22.85%
Totallytotal area (m2)25202.57267148.994672.6655874.08223234.720.0025840.7628732.763961.22235459.40870127.18
Percentage (%)2.90%30.70%0.54%6.42%25.66%0.00%2.97%3.30%0.46%27.06%
Land use diversity Index0.69
Dominance index of land use0.7
The degree of mixed land use0.66
Table 7. Accessing time threshold and land use indexes around No.2 Baishuiqiao Road station.
Baishuiqiao RoadTime Threshold (min)Working & StudyingShopping & ConsumingFitness & RecreationOther Purposes Sustainability 11 02034 i002
6.136.134.64.5
Return JourneySettled Passengers4.6
Tenant Passengers5.39
Totality5.03
The Influence Range7.01
Accessibility (min)Index AttributeCommercialResidentialMunicipal FacilitiesPublic ServiceGreenland & WatersSpecialCommerce & ResidenceCommerce & OfficePublic TransportRoadAccessible Area (m2)Total Plot Ratio
0~4.50Plot ratio0.991.470.000.900.000.001.800.000.000.00317208.211.32
Percentage (%)2.27%57.41%0.00%6.20%9.91%3.06%0.11%0.00%0.57%20.48%
4.50~4.60Plot ratio0.001.260.000.000.000.001.800.000.000.0016198.571.02
Percentage (%)0.00%49.97%0.00%0.00%11.34%12.45%1.64%0.00%0.78%23.83%
4.60~5.03Plot ratio0.001.250.000.000.000.001.800.000.000.0073816.900.96
Percentage (%)0.00%49.41%0.00%0.00%17.06%14.65%2.67%0.00%2.55%13.65%
5.03~6.13Plot ratio0.001.430.001.500.000.001.810.000.000.00231095.181.02
Percentage (%)0.00%41.51%0.00%4.62%16.36%14.04%2.76%0.00%6.74%13.96%
6.13~7.01Plot ratio0.001.580.001.500.000.002.190.000.000.00254855.421.11
Percentage (%)0.00%33.88%0.00%7.11%21.06%17.36%4.10%0.00%3.07%13.43%
Totallytotal area (m2)7195.47408956.460.0048456.35137360.8799204.2919403.200.0027203.27145394.35893174.27
Percentage (%)0.81%45.79%0.00%5.43%15.38%11.11%2.17%0.00%3.05%16.28%
Land use diversity Index0.64
Dominance index of land use0.6
The degree of mixed land use0.69
Table 8. Accessing time threshold and land use indexes around No.5 Tianquan Road station.
Tianquan RoadTime Threshold (min)Working & StudyingShopping & ConsumingFitness & RecreationOther Purposes Sustainability 11 02034 i003
4.765.53.34.4
Return JourneySettled Passengers7.31
Tenant Passengers6.89
Totality6.82
The Influence Range7.54
Accessibility (min)Index AttributeCommercialResidentialMunicipal FacilitiesPublic ServiceGreenland & WatersSpecialCommerce & ResidenceCommerce & OfficePublic TransportRoadAccessible Area (m2)Total Plot Ratio
0~3.30Plot ratio3.602.260.000.000.000.000.004.800.000.00150743.713.39
Percentage (%)8.70%21.41%0.00%0.00%20.20%0.00%0.00%15.97%0.00%33.72%
3.30~4.40Plot ratio3.602.190.002.000.000.000.004.800.000.0084614.712.67
Percentage (%)9.80%37.11%0.00%0.62%20.43%0.00%0.00%4.19%0.00%27.85%
4.40~4.76Plot ratio3.602.140.002.000.000.000.004.800.000.0017254.082.39
Percentage (%)5.53%36.62%0.00%2.96%23.94%0.00%0.29%1.49%0.00%29.17%
4.76~5.50Plot ratio3.602.010.001.960.000.000.004.800.000.00143388.622.03
Percentage (%)1.80%36.90%0.00%5.83%21.25%0.00%4.52%0.34%0.00%29.35%
5.50~6.82Plot ratio0.001.781.501.610.000.001.500.000.000.00249288.341.71
Percentage (%)0.00%32.01%0.54%9.05%27.49%0.00%5.77%0.00%0.04%25.10%
6.82~7.54Plot ratio0.801.601.251.470.000.001.501.200.000.00224837.721.49
Percentage (%)0.11%28.66%1.48%10.63%32.19%0.00%2.19%0.17%1.71%22.85%
Totallytotal area (m2)25202.57267148.994672.6655874.08223234.720.0025840.7628732.763961.22235459.40870127.18
Percentage (%)2.90%30.70%0.54%6.42%25.66%0.00%2.97%3.30%0.46%27.06%
Land use diversity Index0.67
Dominance index of land use0.64
The degree of mixed land use0.67
Table 9. Accessing time threshold and land use indexes around No.6 Nanwanying Street station.
Nanwanying StreetTime Threshold (min)Working & StudyingShopping & ConsumingFitness & RecreationOther Purposes Sustainability 11 02034 i004
3.244.448.644.32
Return JourneySettled Passengers6.36
Tenant Passengers8.2
Totality6.79
The Influence Range7.41
Accessibility (min)Index AttributeCommercialResidentialMunicipal FacilitiesPublic ServiceGreenland & WatersSpecialCommerce & ResidenceCommerce & OfficePublic TransportRoadAccessible Area (m2)Total Plot Ratio
0–3.24Plot ratio0.002.920.000.800.000.000.000.000.000.00143691.232.80
Percentage (%)0.00%22.67%0.00%1.36%39.06%0.00%0.00%0.00%0.00%36.91%
3.24–4.32Plot ratio0.002.920.001.130.000.000.000.000.000.00127473.482.46
Percentage (%)0.00%35.35%0.00%12.26%28.78%0.00%0.00%0.00%0.00%23.61%
4.32–4.44Plot ratio0.002.940.001.200.000.000.000.000.000.0017109.282.34
Percentage (%)0.00%33.83%0.00%17.57%22.73%0.00%0.00%0.00%0.00%25.87%
4.44–6.79Plot ratio0.002.620.001.270.000.003.362.300.000.00480266.332.04
Percentage (%)0.00%30.77%0.00%21.79%20.41%0.00%0.85%2.42%1.41%22.35%
6.79–7.41Plot ratio0.002.270.001.480.000.003.292.200.000.00174359.642.15
Percentage (%)0.00%44.36%0.00%11.63%13.84%0.00%2.78%4.91%0.64%21.84%
Totallytotal area (m2)0.00308559.390.00145521.89218847.980.008926.2620196.957865.73232981.75942899.96
Percentage (%)0.00%32.72%0.00%15.43%23.21%0.00%0.95%2.14%0.83%24.71%
Land use diversity Index0.67
Dominance index of land use0.53
The degree of mixed land use0.7
Table 10. Accessing time threshold and land use indexes around No.10 Guanghua Road station.
Ganghua RoadTime Threshold (min)Working & StudyingShopping & ConsumingFitness & RecreationOther Purposes Sustainability 11 02034 i005
6.634.3314.064.06
Return JourneySettled Passengers3.24
Tenant Passengers14.6
Totality8.65
The Influence Range7.42
Accessibility (min)Index AttributeCommercialResidentialMunicipal FacilitiesPublic ServiceGreenland & WatersScientific Research & DesignCommerce & ResidenceCommerce & OfficePublic TransportRoadAccessible Area (m2)Total Plot Ratio
0~4.06Plot ratio0.002.320.000.870.001.290.004.000.000.00215234.642.06
Percentage (%)0.00%15.54%0.00%3.50%44.02%6.11%0.00%2.51%0.00%28.31%
4.06~4.33Plot ratio0.001.750.001.170.001.290.004.000.000.0034019.562.02
Percentage (%)0.00%15.14%0.00%5.56%42.95%7.00%0.00%6.99%0.00%22.37%
4.33~6.63Plot ratio0.001.520.000.940.001.670.003.700.000.00412290.461.82
Percentage (%)0.00%18.14%0.00%0.87%45.48%11.86%0.00%4.28%0.00%19.36%
6.63~7.42Plot ratio0.001.660.000.920.001.830.003.000.000.00202001.991.65
Percentage (%)0.00%11.90%0.00%7.10%44.66%19.10%0.00%1.00%0.00%16.24%
Totallytotal area (m2)0.00137435.030.0027367.13387094.00103015.470.0027455.330.00181179.70863546.66
Percentage (%)0.00%15.92%0.00%3.17%44.83%11.93%0.00%3.18%0.00%20.98%
Land use diversity Index0.61
Dominance index of land use0.42
The degree of mixed land use0.74
Table 11. Accessing time threshold and land use indexes around No.12 Zhihui Road station.
Zhihui RoadTime Threshold (min)Working & StudyingShopping & ConsumingFitness & RecreationOther Purposes Sustainability 11 02034 i006
5.734.927.87
Return JourneySettled Passengers6.56
Tenant Passengers5.71
Totality6.04
The Influence Range6.75
Accessibility (min)Index AttributeCommercialResidentialMunicipal FacilitiesPublic ServiceGreenland & WatersScientific Research & DesignCommerce & ResidenceCommerce & OfficePublic TransportRoadAccessible Area (m2)Total Plot Ratio
0~4.92Plot ratio1.441.320.000.600.002.063.000.000.000.00422882.701.68
Percentage (%)5.81%13.40%0.00%0.29%46.90%10.33%2.08%0.00%0.00%21.18%
4.92~5.73Plot ratio2.300.980.000.630.002.253.000.000.000.00175303.331.84
Percentage (%)3.99%14.46%0.00%3.26%40.75%16.76%6.50%0.00%0.00%14.27%
5.73~6.04Plot ratio1.870.950.000.800.002.233.000.000.000.0079244.921.91
Percentage (%)5.78%10.56%0.00%2.50%43.81%19.70%6.04%0.00%0.00%11.61%
6.04~6.75Plot ratio2.250.950.000.930.002.383.003.000.000.00175686.942.09
Percentage (%)1.76%11.07%0.00%1.71%37.65%28.03%4.02%2.70%0.00%13.06%
Totallytotal area (m2)39264.07109829.950.0011947.46370623.68137944.0932019.484737.830.00146751.32853117.89
Percentage (%)4.60%12.87%0.00%1.40%43.44%16.17%3.75%0.56%0.00%17.20%
Land use diversity Index0.66
Dominance index of land use0.6
The degree of mixed land use0.69
Table 12. Funcitonal index evaluation of the land use around the stations.
StationsLand Use Diversity IndexDominance Index of Land UseThe Degree of Mixed Land UsePlot RatioThe Proportion of Major Land Use Properties
CommercialResidentialPublic ServiceCommerce & ResidenceCommerce & OfficeScientific Research & Design
1Maqun0.690.700.662.113.97%42.09%8.80%4.07%4.53%
2Baishuiqiao Road0.640.600.691.150.96%54.69%6.48%2.59%
3Magao Road0.740.510.751.642.80%37.87%17.51%5.66%2.02%
4Beiwanying Street0.460.550.602.271.13%70.32%9.52%
5Tianquan Road0.670.640.672.2746.66%16.39%1.60%4.62%
6Nanwanying Street0.670.530.702.1843.46%20.50%1.26%2.84%
7Tianxing Road0.670.350.782.1947.34%17.70%4.55%2.75%
8Qidi Street0.700.450.772.763.75%12.76%19.32%5.08%9.98%
9Chilin Ecological Park0.410.750.534.062.94%2.82%7.10%11.77%
10Guanghua Road0.610.420.741.8320.14%4.01%3.18%11.93%
11Shuijiefang0.650.400.751.097.98%38.52%2.57%6.84%
12Zhihui Road0.660.600.691.855.56%15.55%1.69%4.53%0.56%16.17%
13Shiyang Road0.700.620.721.113.81%4.34%12.57%5.73%0.51%5.38%